Delivered Light Output - Color Kinetics · 2 Evaluating Light Output Technical Brief Evaluating...
12
Evaluating Light Output Technical Brief Using Delivered Light to Specify and Compare LED Lighting Fixtures
Transcript of Delivered Light Output - Color Kinetics · 2 Evaluating Light Output Technical Brief Evaluating...

Evaluating Light Output
Technical Brief
Using Delivered Light to Specify and Compare LED Lighting Fixtures

Evaluating Light Output Technical Brief2
Evaluating Light Output: The Importance of Delivered LightLight output is an informal term for how much light a fixture produces, and how the fixture emits and distributes that light. The formal term for data describing the quantity and distribution of the visible light produced by a light source or fixture is photometrics.
It is common practice for lighting fixture manufacturers to report key photometrics in fixtures specification sheets or data sheets. These usually include basic charts and graphs that describe the power or intensity of a lamp or light fixture, the way it distributes light in space or over an area, and its energy efficiency. Lighting specifiers and designers use this data to make preliminary evaluations of a lighting fixture’s capabilities and its potential suitability for a particular task or application. Fixture manufacturers often make more detailed information available for deeper analysis, creating computer renderings, building mock-ups, and so on.
The specification most commonly used for evaluating and comparing the performance of conventional lighting fixtures is lumen output. Technically speaking, the lumen is a standard unit that measures the total perceived power of a light source. (Exactly what “total perceived power of a light source” means is discussed in more detail on page 5.) In practice, lighting professionals, purchasers, and users often refer casually to a fixture’s “brightness.” This is not only inaccurate, but it can be misleading, especially where LED lighting fixtures are concerned.
E Luminaire testing labs report raw photometric data in .IES files, the format of which conforms to standards set by the Illuminating Engineering Society of North America (IES). Reputable fixture manufacturers make these files available to lighting designers, who use them with lighting analysis software tools to create charts, graphs, and dimensional renderings, and to make comparisons between fixture types.

Evaluating Light Output Technical Brief 3
For a number of reasons, lumen output is not the best measurement of an LED lighting fixture’s capabilities. In fact, evaluating an LED lighting fixture solely or primarily on the basis of its lumen output can underestimate or otherwise give a distorted picture of the fixture’s performance and suitability for a given task or application.
Instead of lumen output, the best and most relevant measurement for evaluating LED lighting fixtures and for making accurate comparisons with conventional lighting fixtures is delivered light. The formal term for measurements of delivered light is illuminance. Roughly speaking, illuminance is the intensity of light falling on a surface area. If the area is measured in square feet, the unit of illuminance is footcandles (fc). If measured in square meters, the unit of illuminance is lux (lx).
Delivered light describes how much useful light a lighting fixture can deliver to a task area. Useful light is the portion of a lighting fixture’s light output that is effectively directed to a task area, discounting any wasted light. The task area can be any space or surface that requires illumination — an entrance hallway, a common office space with desktop computers, a kitchen countertop, or the face of a Mayan pyramid in Guatemala. Light can be wasted in a number of ways: It can be partially blocked or dispersed within the fixture housing, it can be emitted in a direction away from the task area, or it can be lost through filtering, lensing, fixture positioning, or any of a number of other factors relevant to a specific installation.
A look through The IESNA Lighting Handbook, the 1,000-page standard reference work from the Illuminating Engineering Society of North America (IES), demonstrates the importance of delivered light as a lighting principle, especially for white-light and everyday applications. Along with chapters that describe in detail how to deliver the right amount of useful light in an application, the Handbook includes an extensive lighting design guide that specifies ideal light levels for every conceivable interior, industrial, outdoor, sports, transportation, and emergency lighting application.
For example, the Handbook recommends a delivered light level of around 30 fc (300 lx) for an open plan office with extensive computer use, as well as for the ticket counter of a transportation terminal. Freight elevators should have a level of around 5 fc (50 lx), while serious reading in a chair at home requires a level of around 50 fc (500 lx). Lecture halls where demonstrations are being performed should have a light level of around 100 fc (1000 lx).
A computer graphic ray trace image, rendered in AGi32 lighting analysis software, from raw photometric data for ColorBlast Powercore LED fixtures from Philips Color Kinetics. The image models ColorBlast Powercore lighting effects in an exterior glass lightbox.
Rend
erin
g: C
hris
Four
nier
and
Mat
t Pay
ette
E Technically., there are 10.7 lux per footcandle. However, to simplify the math, lux measurements are typically given as footcandles x 10. 30 fc is therefore equivalent to 321 lx, but is expressed as 300 lx by convention.

Evaluating Light Output Technical Brief4
The Trouble with LumensThe way that lumen output is traditionally measured, reported, and interpreted poses a number of potential problems for evaluating and comparing LED lighting fixtures:
Since complete and accurate definitions of lumens and related photometric terms ▪can be technical and complex, they are often misunderstood. Without a good understanding of these terms, however, the unique properties of LED lighting sources cannot be clearly grasped.
Lumens are an imperfect measurement of the perceived intensity of light sources, ▪with known shortcomings. The specific spectral properties of LED light sources exaggerate these shortcomings, especially toward the blue end of the spectrum.
Conventional lighting fixture manufacturers often report total lamp lumens ▪more prominently than or instead of total fixture lumens. Because many LED lighting fixtures do away with the distinction between lamp and luminaire, only total fixture lumens can serve as a basis for valid comparisons between LED and conventional lighting fixtures.
LED lighting fixtures and conventional lighting fixtures are tested differently, and ▪therefore some photometric data is reported differently. These differences must be taken into consideration in order to accurately compare conventional lighting fixtures and LED lighting fixtures.
A fixture’s total lumen output does not account for wasted light. Because LED ▪lighting fixtures are fundamentally directional and natively create white and colored light without filtering or additional lensing and shading, LED fixtures typically waste much less light then their conventional counterparts, and deliver more of their total light output to a task or target area. An LED lighting fixture with lower rated lumens, therefore, may deliver the same or more useful light in a specific application than a comparable conventional lighting fixture with a higher rated lumen output.
Each of these issues is discussed in greater detail in the sections that follow.
Clusters of eW Downlight Powercore, LED downlights from Philips Color Kinetics, and indirect lighting illuminate the dining room at Flinstering, a restaurant in Breda, The Netherlands. Recommended light levels for dining areas such as these is about 10 fc (100 lx).
Phot
ogra
phy:
Korff
en
van
Mie
rlo
How Many Watts Is That LED?Because of incandescent light bulbs, most people are used to looking at wattage to determine the light output of a light source: a 100-watt lamp puts out more light than a 60-watt lamp.
All general service incandescent lamps use the same filament material heated to the same temperature, so the only way to increase their light output is to increase the wattage. This is one of the main reasons why incandescent lamps are so energy wasteful.
LED light sources are much more efficient at converting watts to lumens. Different materials can be used within the LED sources themselves, each of which has its own light extraction efficacy. For these and other reasons, two different LED sources can consume the same number of watts but differ widely in lumen output.
Because watts can’t be used as an index of light output, evaluating the “brightness” of LED sources for a given situation requires you to think differently about lighting. A standard 60-watt incandescent lamp emits a total of about 800 lumens, but the light is emitted equally in all directions. When you’re reading at your office desk, your book does not receive all 800 lumens from your desktop lamp, nor do you need it to.
The crucial measurement is delivered light. According to the IES, serious reading requires an average of 50 footcandles (fc) or 500 lux (lx) on the page. Many linear LED under-cabinet fixtures and other task lights can deliver this level of light while consuming far less than 60 watts. For example, an under-cabinet LED light from a leading supplier can deliver 50 fc in typical desktop situations while consuming only about 6 watts per foot.

Evaluating Light Output Technical Brief 5
What Exactly Is a Lumen?Light measurements can either be radiometric or photometric. Radiometric measurements measure all the wavelengths of a light source, both visible and invisible. Photometric measurements measure only the visible wavelengths of light. The total electromagnetic energy that a light source emits across all wavelengths is known as radiant flux, and is measured in watts. The total energy that a light source emits across the visible wavelengths of light is known as luminous flux, and is measured in lumens.
Since visibility only has meaning in relation to a human viewer, photometric data takes into consideration the varying sensitivities of the human eye to different wavelengths (colors) of visible light. The sensitivity of a human eye with normal vision can be plotted as a bell-shaped curve. This curve is known as the spectral luminous efficiency function, and is often referred to as the eye-sensitivity curve. The eye-sensitivity curve shows that the human eye is most sensitive to light in the green part of the spectrum, around a wavelength of 550 nanometers (nm), and is progressively less sensitive to light toward both the red and blue ends of the spectrum.
To calculate lumens, different wavelengths of light are given more or less weight depending on where they fall on the eye-sensitivity curve. Two light sources with the same radiant flux falling on different parts of the curve will therefore have different lumen measurements. Imagine, for instance, two light sources of 1 watt of radiant flux each. One source emits a blue light at 480 nm, and one emits a green light at 555 nm. As the eye-sensitivity curve shows, the blue light appears significantly less bright than the green light, even though the total energy of the two lights is the same (see the figure at the top of the next page). To put it another way, the green light produces more lumens than the blue light, even though both lights produce the same amount of radiant energy.
In practice, there are variations in every individual’s experience of the apparent intensity of a light source. In 1924, the International Commission on Illumination (CIE), a recognized authority on light, illumination, color, and color spaces, standardized the responses of the human eye to visible light by defining a so-called standard observer. The standard observer has regular eye responses to visible light under specific conditions, which the standard defines. The eye-sensitivity curve
E In casual usage, the apparent power of a light source is often mistakenly referred to as a fixture’s “brightness.” Brightness is subjective, and varies depending on such factors as the distance of the light source from the viewer, the viewing angle, and the conditions of the light source’s surroundings. Lumen measurements, in contrast, are based on carefully defined standards and test conditions, rather than on subjective impressions.
1
0.8
0.6
0.4
0.2
0400 nm 450 500 550 600 650 700
The spectral luminous efficiency function weights the perceived intensity of light of different wavelengths based on the varying sensitivities of the human eye. The eye is most sensitive to light around 550 nm in the green-yellow area of the spectrum, and is less sensitive at either the red or blue end.
E Direct-view fixtures, such as tubes, panels, and string lights used for large-scale video displays, are designed for viewing rather than for illumination. The light output of direct-view fixtures is typically measured in candelas per square meter, sometimes called nits. Nits are a measure of luminance, the amount of light emitted or reflected from a particular area.
Evaluating Light Output Technical Brief6
used in lumens and other photometric measurements is the standard observer’s eye-sensitivity curve, not the eye-sensitivity curve of any actual observer. Lumens and related measurements are therefore approximations or idealizations, which are usually good enough for evaluations and comparisons of different light sources.
Deficiencies of the Eye-Sensitivity CurveIt is well understood that the eye-sensitivity curve underestimates the perceived intensity of wavelengths toward the blue end of the spectrum. Although none has been widely adopted, modifications of the eye-sensitivity curve have been suggested over the years. The Judd-Vos correction, for example, adjusts the curve to more accurately represent the normal sensitivity of human vision, especially to blue light.
The Judd-Vos correction, shown below, may not look like much, and it has relatively little effect when comparing conventional light sources with one another. But the correction can make a great deal of difference when measuring the luminous flux of LED light sources and comparing it to that of conventional light sources.
Lumens are calculated using the efficiency curve’s weighting function. Two lights with the same radiant flux but producing light at different wavelengths, therefore, have different measured lumens.
1
0.8
0.6
0.4
0.2
0400 nm 450 500 550 600 650 700
Green light, 1 watt555 nm683 lumens
Blue light, 1 watt480 nm68 lumens
1 watt blue light at 480 nm = 68 lumens
1 watt green light at 555 nm = 683 lumens
1
0.8
0.6
0.4
0.2
0400 nm 450 500 550 600 650 700
Standard eye-sensitivity curve
Judd-Vos correction

Evaluating Light Output Technical Brief 7
Conventional light sources tend to radiate across a wide range of visible wavelengths. Incandescent light sources typically radiate throughout the visible band. Fluorescent light sources show a spiky spectrum, with intense radiation in some narrow wavelength bands and lesser levels of radiation throughout, due to emission lines of mercury, which LEDs do not contain. Solid-color LED light sources usually radiate in a single, narrow band of wavelengths, which exaggerates discrepancies in the eye-sensitivity curve. The calculated lumens for a blue LED source with a peak wavelength of around 460 nm, for example, does not account for a significant portion of the visible light that the LED produces.
In practice, the deficiencies of the eye-sensitivity curve can result in lumen measurements that underestimate the perceived intensity of LED light sources, especially blue light. The perceived intensity of an LED lighting fixture, therefore, could be greater — in some cases much greater — than the fixture’s reported lumens suggest.
Relative Photometry, Absolute Photometry, and EfficiencyDespite its shortcomings for accurately representing the perceived intensity of some LED light sources, luminous flux is a standard measurement used throughout the lighting industry. In evaluating lighting fixtures, you often have to compare the reported light output of LED lighting fixtures with the reported light output of conventional light sources. To make accurate comparisons, you need to understand the differences in the methods for gathering and reporting photometric data for conventional and LED lighting fixtures. With these differences in mind, you can avoid common pitfalls in interpreting and comparing the photometric data for LED and conventional fixtures.
Conventional lighting fixtures are tested using the relative photometry method. In relative photometry, luminaires and the lamps used within them are tested separately. Lamp and luminaire testing differ so much from one another, in fact, that lamp photometry engineering and luminaire photometry engineering are separate specialties, each with its own standards and practices. The total luminous flux and chromaticity (color) of a fixture’s lamps are typically measured with integrating spheres,
E Saturated colors appear “brighter” to the eye than less saturated colors, even when their lumens are equivalent. This effect is not well understood as of yet, and is not well represented by the eye-sensitivity curve.
1
0.8
0.6
0.4
0.2
0400 nm 450 500 550 600 650 700
Spectral profile of blue LED light source at 460 nm
Visible wavelengths excluded from measurement of luminous flux
The Labsphere LMS-200 20-inch Light Measurement Integrating Sphere.

Evaluating Light Output Technical Brief8
while the luminous intensity distribution and efficiency of the luminaires are usually measured with goniophotometers — although “gonies,” as they are affectionately called, can also measure luminous flux.
In relative photometry, the lumen output of a fixture’s lamps functions as a reference, and the lumen output of the luminaire is measured relative to it. A certain amount of the light from a conventional lighting fixture’s lamps is typically blocked or absorbed by the fixture’s housing, so total fixture lumens is always reported as a percentage of total lamp lumens. This percentage is the efficiency of the luminaire.
Because LEDs are typically inseparable from the luminaires in which they act as light sources, relative photometry is inappropriate for measuring the light output of LED fixtures. Instead, LED fixtures are tested using absolute photometry. The approved procedures and testing conditions for absolute photometry are spelled out in Electrical and Photometric Measurements of Solid-State Lighting Products, publication IES LM-79-08, published by IESNA in early 2008.
In absolute photometry, only fixture lumens are measured, and not lamp lumens, because a separate measurement of the LEDs independent of the fixture is neither possible nor meaningful. Fixture efficiency, which compares lamp lumens to fixture lumens, therefore has no meaning for an LED lighting fixture. To put it another way, the efficiency of an LED lighting fixture in which the LEDs are inseparable components is always 100%.
Specifiers and designers sometimes mistakenly compare the total lamp lumens of a conventional lighting fixture with the total fixture lumens of an LED fixture. To make a valid comparison, you must reduce the measured lamp lumens of the conventional fixture by its efficiency. This reduction is typically reported in a Zonal Lumen Summary chart.
For example, the Slique T2 SQ series of under-cabinet fluorescent light fixtures, from Alkco, prominently reports 860 lumens for the two T2 lamps used within the fixture. However, the Zonal Lumen Summary chart reports 575 total fixture lumens, because the fixture outputs only 66.9% of the total lamp lumens (66.9% of 860 = 575). That means that 33.1% of the light produced by the fixture’s lamps is wasted or lost within the fixture housing. When comparing a Slique T2 under-cabinet fixture to an LED-based under-cabinet fixture designed for similar lighting applications, you should compare the LED-based fixture’s total lumens with the efficiency-corrected lumen total of the Slique T2, not with its reported lamp lumens.
Lensing, Filtering, Shading, and Other Sources of LossHow much light a fixture delivers to a task surface depends on a complete range of factors in addition to the fixture’s lumen output. These factors include fixture positioning, distance from the area to be illuminated, and light losses that result from lensing, filtering, shading, or other techniques or accessories used to direct or alter the source light.
The fact that LED lighting fixtures are inherently directional minimizes losses associated with lensing and shading. Furthermore, the fact that LEDs natively generate colored light eliminates losses associated with filtering used to alter the color or distribution of light produced by conventional lighting fixtures.
ZONAL LUMEN SUMMARYZone Lumen % Lamp % Fixt.0-30 113 12.1 19.60-40 199 23.1 34.60-60 382 44.4 66.30-90 534 62.1 92.890-120 38 4.4 92.890-130 40 4.7 7.090-150 41 4.8 7.290-180 41 4.8 7.20-180 575 66.9 100.0
The total fixture lumens of a conventional lighting fixture, which accounts for fixture efficiency, should be used in comparisons with the lumen output of LED fixtures.
Evaluating Light Output Technical Brief 9
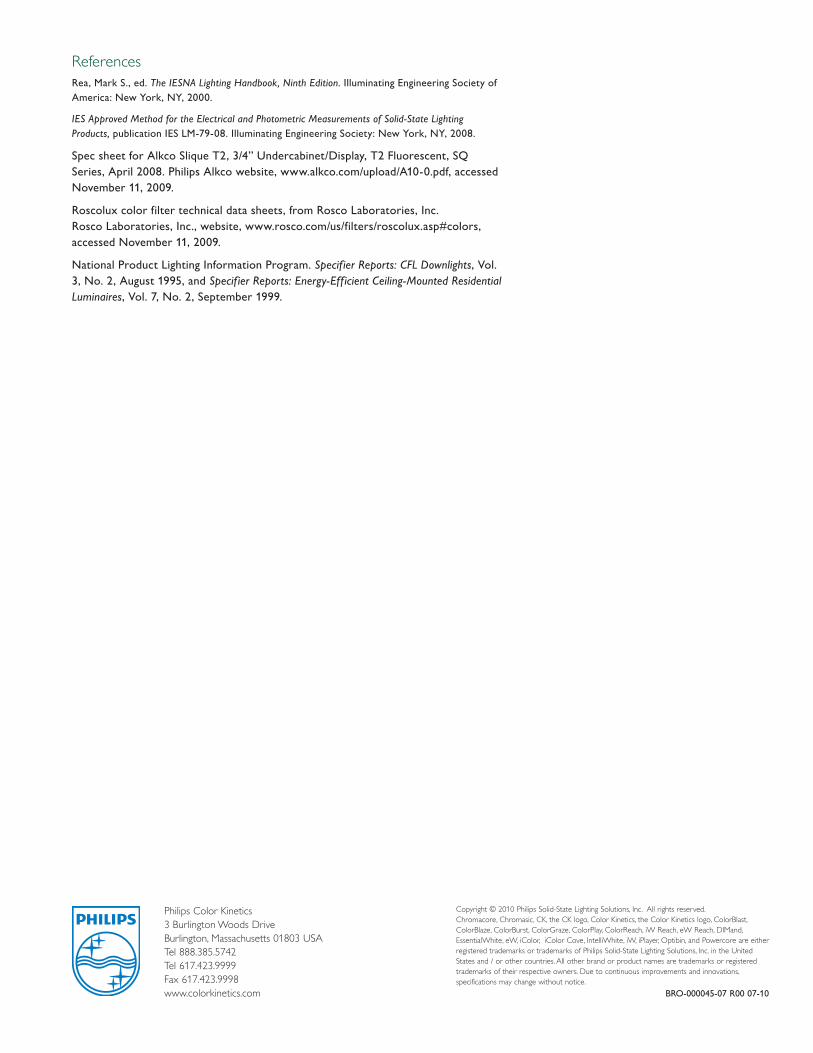
General Lighting Example: The DownlightA client has asked you to specify lighting for the corridors in a new office space. The client wants you to investigate LED-based alternatives to CFL downlights for energy-efficiency and maintenance reasons, but he isn’t convinced that LED downlights are bright enough for the task.
You know that brightness is a subjective impression, and that the client is actually referring to luminous flux. When you compare the lumen output of some typical LED downlights with similar incandescent and CFL downlights, the LED downlights seem to be less capable — that is, they generally report fewer total lumens than their non-LED counterparts. But you also know that you need to correct for efficiency and other losses, and that the crucial measurement for the lighting application is not how “bright” the fixture is, but how much useful light it can deliver to a task area at a certain distance.
According to The IESNA Lighting Handbook, the ideal light level for corridors, lobbies, and other common areas in an office space is 5 – 10 fc (50 – 100 lx). The task area for this sort of illumination is a plane 30 in (0.75 m) above the floor. Any ceiling-mounted downlight that can deliver up to 10 fc (100 lx) to this task surface is appropriate for the application.
eW Downlight Powercore is a surface-mounted LED downlight from Philips Color Kinetics. According to published specs, eW Downlight Powercore generates between 405 and 527 total fixture lumens, depending on color temperature and beam width. A comparable CFL downlight produces a total of 860 lamp lumens with two 13-watt T4 lamps. Information published by the National Lighting Product Information Program (NLPIP), an independent lighting research center providing objective test information to lighting professionals, gives this particular CFL downlight an efficiency rating of 50.1. This means the CFL downlight actually outputs 430 total fixture lumens — on a par with eW Downlight Powercore.
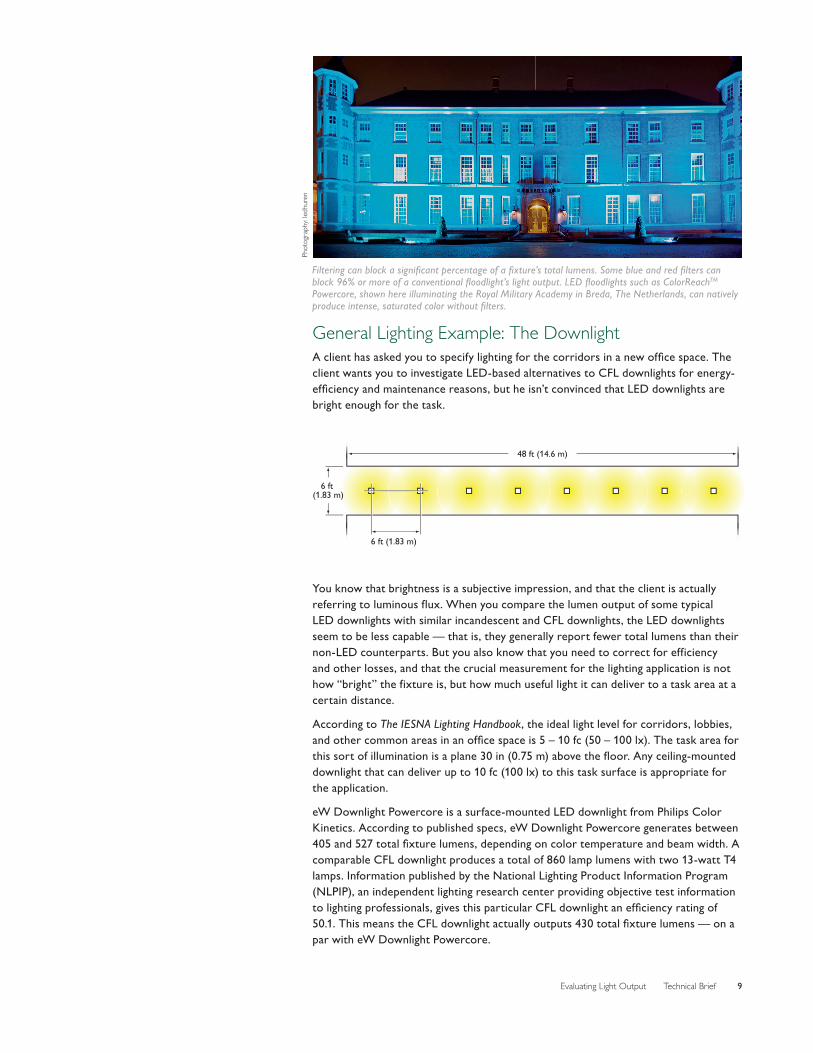
Filtering can block a significant percentage of a fixture’s total lumens. Some blue and red filters can block 96% or more of a conventional floodlight’s light output. LED floodlights such as ColorReachTM Powercore, shown here illuminating the Royal Military Academy in Breda, The Netherlands, can natively produce intense, saturated color without filters.
Phot
ogra
phy:
ledh
uren
48 ft (14.6 m)
6 ft (1.83 m)
6 ft (1.83 m)

Evaluating Light Output Technical Brief10
The NLPIP created a corridor installation mock-up to measure the light levels delivered by the CFL downlight and other comparable downlights. Their test results indicate that, at a 9 ft ceiling height, the CFL downlight delivers an average of 11 fc (110 lx) to the task surface. According to published specs, eW Downlight Powercore fixtures can deliver an average of 15 fc (150 lx) at 9 ft, using a narrow beam angle. eW Downlight Powercore, therefore, delivers more light in this application than the CFL downlight. Not only that, the LED downlight’s useful life is 10 to 20 times longer than the CFL downlight’s, and it uses 40% less energy to operate (15 watts as opposed to 26 watts).
Cove Lighting Example: Directional LightLED lighting fixtures with integrated optics and lensing can direct light to a target application area more efficiently than fluorescent and standard bulb-shaped incandescent lamps, which emit light in all directions. A significant percentage of the light produced by a typical fluorescent or incandescent lamp is lost within or blocked by the luminaire, reabsorbed by the lamp, or emitted in a direction that is not useful for the intended application. For some fixture types, such as recessed downlights, troffers, and under-cabinet fixtures, 40% to 50% of the total lamp output is lost before it exits the fixture.
A mock-up of an architect’s studio, showing LED downlights illuminating drafting desktops, the target work surface in this application. Performance of visual tasks in this environment requires a light level of about 50 fc (500 lx) at the work surface.
Rend
erin
g:: K
ristin
McK
enna
An LED cove light with integrated lensing emits 100% of its 177 fixture lumens within a 110° beam angle. A fluorescent cove fixture emits 85% of its 700 lamp lumens in all directions, delivering 182 lumens in any 110° slice — effectively the same amount of delivered light as the LED cove light.

Evaluating Light Output Technical Brief 11
LED fixtures that emit light in a specific direction reduce the need for reflectors and diffusers that can trap light, and can therefore deliver light more efficiently to a target area. For example, eW Cove Powercore, a linear LED fixture from Philips Color Kinetics, emits light in a tight 110° spread. At 177 lumens per foot, these fixtures produce much less light than a popular F32T8 lamp, which is rated at 700 lumens per foot. However, analysis shows that eW Cove Powercore delivers a comparable level of light to a target area.
Including all losses, about 85% of the F32T8’s lamp lumens leave the fixture, reducing its lumen output to 595 lumens per foot. But those 595 lumens are radiated in all directions, in 360°. Any 110° slice would contain about 30% of the lumen output, or 182 lumens — almost exactly the same as eW Cove Powercore. Because it contains an integrated lens and housing that rotates through a full 180°, eW Cove Powercore lets designers and installers easily direct light exactly where it’s needed, without secondary lensing or diffusers that would almost certainly reduce the fixture’s light output.
Philips Color Kinetics3 Burlington Woods DriveBurlington, Massachusetts 01803 USATel 888.385.5742Tel 617.423.9999Fax 617.423.9998www.colorkinetics.com
Copyright © 2010 Philips Solid-State Lighting Solutions, Inc. All rights reserved. Chromacore, Chromasic, CK, the CK logo, Color Kinetics, the Color Kinetics logo, ColorBlast, ColorBlaze, ColorBurst, ColorGraze, ColorPlay, ColorReach, iW Reach, eW Reach, DIMand, EssentialWhite, eW, iColor, iColor Cove, IntelliWhite, iW, iPlayer, Optibin, and Powercore are either registered trademarks or trademarks of Philips Solid-State Lighting Solutions, Inc. in the United States and / or other countries. All other brand or product names are trademarks or registered trademarks of their respective owners. Due to continuous improvements and innovations, specifications may change without notice.
BRO-000045-07 R00 07-10
ReferencesRea, Mark S., ed. The IESNA Lighting Handbook, Ninth Edition. Illuminating Engineering Society of America: New York, NY, 2000.
IES Approved Method for the Electrical and Photometric Measurements of Solid-State Lighting Products, publication IES LM-79-08. Illuminating Engineering Society: New York, NY, 2008.
Spec sheet for Alkco Slique T2, 3/4” Undercabinet/Display, T2 Fluorescent, SQ Series, April 2008. Philips Alkco website, www.alkco.com/upload/A10-0.pdf, accessed November 11, 2009.
Roscolux color filter technical data sheets, from Rosco Laboratories, Inc. Rosco Laboratories, Inc., website, www.rosco.com/us/filters/roscolux.asp#colors, accessed November 11, 2009.
National Product Lighting Information Program. Specif ier Reports: CFL Downlights, Vol. 3, No. 2, August 1995, and Specif ier Reports: Energy-Efficient Ceiling-Mounted Residential Luminaires, Vol. 7, No. 2, September 1999.