Deliverable D4.1 Market Potential and Operational ...
121
GA 826347 P a g e 1 | 121 Deliverable D4.1 Market Potential and Operational Scenarios for Virtual Coupling Reviewed: yes Project acronym: MOVINGRAIL Starting date: 01/12/2018 Duration (in months): 25 Call (part) identifier: H2020-S2R-OC-IP2-2018 Grant agreement no: 826347 Due date of deliverable: Month 7 Actual submission date: 19/07/2019 Responsible/Author: Egidio Quaglietta (TUD) Dissemination level: Public Status: Completed Ref. Ares(2019)4718378 - 19/07/2019
Transcript of Deliverable D4.1 Market Potential and Operational ...

G A 8 2 6 3 4 7 P a g e 1 | 121
Deliverable D4.1 Market Potential and Operational Scenarios for
Virtual Coupling
Reviewed: yes
Project acronym: MOVINGRAIL
Starting date: 01/12/2018
Duration (in months): 25
Call (part) identifier: H2020-S2R-OC-IP2-2018
Grant agreement no: 826347
Due date of deliverable: Month 7
Actual submission date: 19/07/2019
Responsible/Author: Egidio Quaglietta (TUD)
Dissemination level: Public
Status: Completed
Ref. Ares(2019)4718378 - 19/07/2019
G A 8 2 6 3 4 7 P a g e 2 | 121
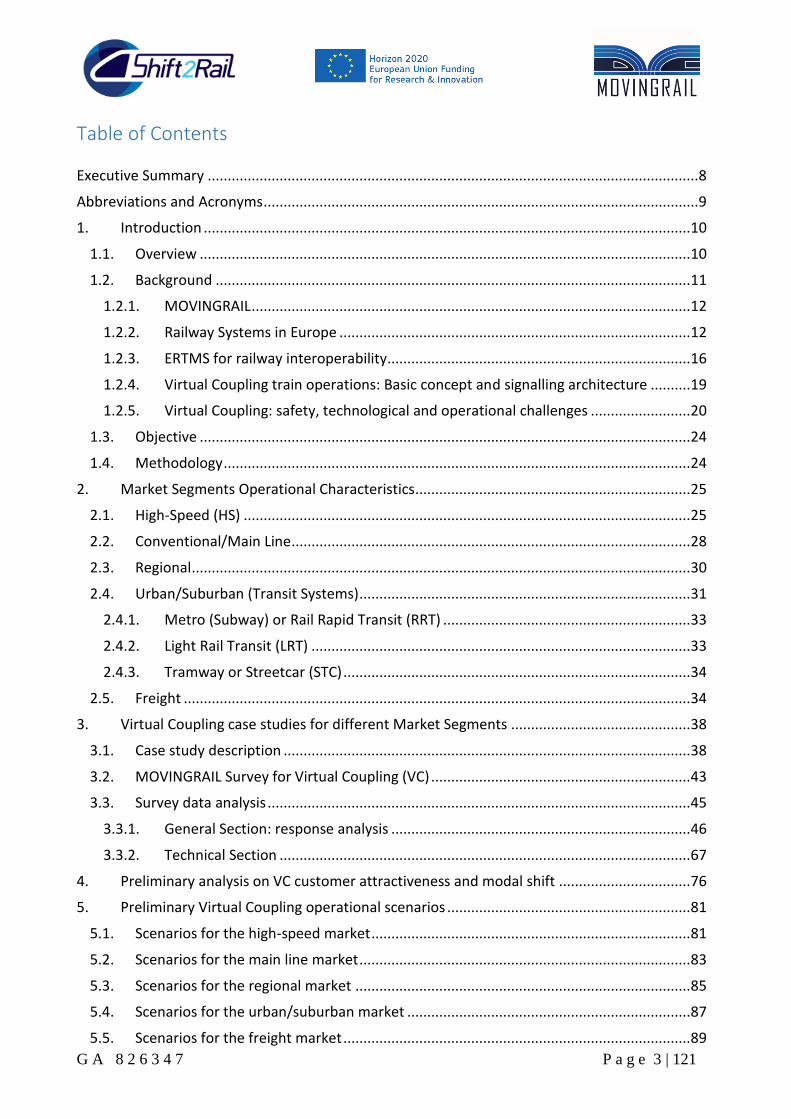
Document history
Revision Date Description
1 07/06/2019 First draft by Joelle Aoun (TUD)
2 08/06/2019 Revision first draft by Egidio Quaglietta (TUD)
3 27/06/2019 Second draft by Joelle Aoun (TUD)
4 08/07/2019 Contributions to second draft by Gemma Nicholson (UoB), Joern Pachl (TUBS) and Martin Scheidt (TUBS), John Chaddock (PARK)
5 13/07/2019 Revision of second draft of document by Egidio Quaglietta (TUD)
6 15/07/2019 Revision by Rob Goverde (TUD)
7 17/07/2019 Revision by Egidio Quaglietta and Joelle Aoun (TUD)
8 18/07/2019 Final quality check by Rob Goverde (TUD)
Report contributors
Name Beneficiary Short Name Details of contribution
Joelle Aoun TUD Issuing the first and second draft of the document. Preparing survey questions, analysing and processing survey data, commenting results.
Egidio Quaglietta TUD Revision of first and second draft of the document, feedback on survey questions, case studies data analysis, results and recommendations. Coordination of contribution from involved partners. Editing of the final version.
Rob Goverde TUD Feedback of document content, revision overall text, final quality control check
Gemma Nicholson UoB Contributions to Section 2 and Section 6
Joern Pachl TUBS Contributions to Section 2 and Section 6
Martin Scheidt TUBS Contributions to Section 2 and Section 6
John Chaddock PARK Revision and feedback of document content
G A 8 2 6 3 4 7 P a g e 3 | 121
Table of Contents Executive Summary ........................................................................................................................... 8
Abbreviations and Acronyms ............................................................................................................. 9
1. Introduction .......................................................................................................................... 10
1.1. Overview ........................................................................................................................... 10
1.2. Background ....................................................................................................................... 11
1.2.1. MOVINGRAIL .............................................................................................................. 12
1.2.2. Railway Systems in Europe ........................................................................................ 12
1.2.3. ERTMS for railway interoperability ............................................................................ 16
1.2.4. Virtual Coupling train operations: Basic concept and signalling architecture .......... 19
1.2.5. Virtual Coupling: safety, technological and operational challenges ......................... 20
1.3. Objective ........................................................................................................................... 24
1.4. Methodology ..................................................................................................................... 24
2. Market Segments Operational Characteristics ..................................................................... 25
2.1. High-Speed (HS) ................................................................................................................ 25
2.2. Conventional/Main Line .................................................................................................... 28
2.3. Regional ............................................................................................................................. 30
2.4. Urban/Suburban (Transit Systems) ................................................................................... 31
2.4.1. Metro (Subway) or Rail Rapid Transit (RRT) .............................................................. 33
2.4.2. Light Rail Transit (LRT) ............................................................................................... 33
2.4.3. Tramway or Streetcar (STC) ....................................................................................... 34
2.5. Freight ............................................................................................................................... 34
3. Virtual Coupling case studies for different Market Segments ............................................. 38
3.1. Case study description ...................................................................................................... 38
3.2. MOVINGRAIL Survey for Virtual Coupling (VC) ................................................................. 43
3.3. Survey data analysis .......................................................................................................... 45
3.3.1. General Section: response analysis ........................................................................... 46
3.3.2. Technical Section ....................................................................................................... 67
4. Preliminary analysis on VC customer attractiveness and modal shift ................................. 76
5. Preliminary Virtual Coupling operational scenarios ............................................................. 81
5.1. Scenarios for the high-speed market ................................................................................ 81
5.2. Scenarios for the main line market ................................................................................... 83
5.3. Scenarios for the regional market .................................................................................... 85
5.4. Scenarios for the urban/suburban market ....................................................................... 87
5.5. Scenarios for the freight market ....................................................................................... 89

G A 8 2 6 3 4 7 P a g e 4 | 121
5.6. Overlay of Virtual Coupling on existing fixed-block signalling .......................................... 90
5.7 On-demand virtually coupled swarming trains ................................................................ 91
6. SWOT Analysis ...................................................................................................................... 92
7. Conclusions and recommendations ..................................................................................... 97
References .....................................................................................................................................102
Appendices ....................................................................................................................................105

G A 8 2 6 3 4 7 P a g e 5 | 121
List of Tables Table 1 - Overview for Stated Preference Data from Surveys and Workshops .............................. 11
Table 2 – Passenger-km Distribution Around the World (UIC, 2019) ............................................. 26
Table 3 – Options for a routine trip from Rome to Bologna ........................................................... 39
Table 4 – Train frequency and cost before and after VC (case study 1) ......................................... 39
Table 5 – Options for a routine trip from London Waterloo to Southampton ............................... 40
Table 6 – Train frequency and cost before and after VC (case study 2) ......................................... 40
Table 7 – Options for a routine trip from Leicester to Peterborough ............................................. 41
Table 8 – Train frequency and cost before and after VC (case study 3) ......................................... 41
Table 9 – Options for a routine trip from London Lancaster to London Liverpool St. .................... 42
Table 10 – Train frequency and cost before and after VC (case study 4) ....................................... 42
Table 11 – Options for a routine trip from Hamburg to Rotterdam ............................................... 43
Table 12 – Train frequency and cost before and after VC (case study 5) ....................................... 43
Table 13 – Modal Share for each Passenger-related Case Study .................................................... 77
Table 14 - Modal share for freight-related case study .................................................................... 78
Table 15 – Operational scenario for the high-speed market .......................................................... 82
Table 16 – Operational scenario for the main line market ............................................................. 84
Table 17 – Operational scenario for the regional market ............................................................... 86
Table 18 – Operational scenario for the urban/suburban market .................................................. 88
Table 19 – Operational scenario for the freight market ................................................................. 90
Table 20 - SWOT analysis of Virtual Coupling for all market segments .......................................... 92
Table 21 – Additional Strengths, Weaknesses, Opportunities and Threats for high-speed rail ..... 94
Table 22 – Additional Strengths, Weaknesses, Opportunities and Threats for main line rail ........ 94
Table 23 – Additional Strengths, Weaknesses, Opportunities and Threats for regional rail .......... 95
Table 24 – Additional Strengths, Weaknesses, Opportunities and Threats for urban/suburban rail ......................................................................................................................................................... 95
Table 25 – Additional Strengths, Weaknesses, Opportunities and Threats for freight rail ............ 96
G A 8 2 6 3 4 7 P a g e 6 | 121
List of Figures Figure 1 - Modal shares in France (Leboeuf, 2018) ......................................................................... 13
Figure 2 – Modal share in the Netherlands (CBS, 2013a) ................................................................ 13
Figure 3 - Distribution of trips by mode of travel (CBS, 2016) ........................................................ 14
Figure 4 – Modal split in the Netherlands for freight (2013 VS 2016) ............................................ 14
Figure 5 – Modal Share in Germany for transport performance passengers (2013 VS 2016) ........ 15
Figure 6 – Modal split in Germany for freight transport (2013 VS 2016)........................................ 15
Figure 7 – Number of passenger journeys (left) and passenger km (right) on public transport in Great Britain 1985/86 to 2017/18, from [9] .................................................................................... 16
Figure 8 – Schematic layout of ETCS Level 1 ................................................................................... 16
Figure 9 – Schematic layout of ETCS Level 2 ................................................................................... 17
Figure 10 – Schematic layout of ETCS Level 3 Hybrid ...................................................................... 18
Figure 11 – Schematic layout of ETCS Level 3 ................................................................................. 18
Figure 12 – Schematic layout of Virtual Coupling train operations ................................................ 20
Figure 13- Safety challenges in Virtual Coupling ............................................................................. 21
Figure 14 - Technological challenges in Virtual Coupling ................................................................ 22
Figure 15 – Infrastructure and operational challenges for the VC implementation ....................... 23
Figure 16 – Percentage share before and after introduction of high-speed trains in Madrid – Seville (UNIFE) .................................................................................................................................. 26
Figure 17 – Electrification of the GB main line network ................................................................. 29
Figure 18 – Strategic Freight Network in Great Britain [29] ............................................................ 37
Figure 19 – Case study 1, Rome-Bologna (HSR) .............................................................................. 39
Figure 20 – Case study 2, London Waterloo-Southampton (Main Line) ......................................... 40
Figure 21 – Case study 3, Leicester-Peterborough (Regional) ........................................................ 41
Figure 22 – Case study 4, London Lancaster-London Liverpool St. (Urban) .................................... 42
Figure 23 – Case study 5, Hamburg-Rotterdam (Freight)................................................................ 43
Figure 24 – Railway SMEs distribution ............................................................................................ 45
Figure 25 – Age distribution ............................................................................................................ 46
Figure 26 – Gender distribution....................................................................................................... 46
Figure 27 – Socio-professional category distribution ...................................................................... 47
Figure 28 – Railway-related company/institution ........................................................................... 47
Figure 29 – Country distribution ...................................................................................................... 48
Figure 30 – Travelled distance for O-D ............................................................................................ 48
Figure 31 – Travel time for O-D ....................................................................................................... 49
Figure 32 – Monthly expenses for O-D ............................................................................................ 49
Figure 33 – Daily activities ............................................................................................................... 50
Figure 34 - Regularly used means of transport ............................................................................... 50
Figure 35 – Regularly used types of trains (MSs) ............................................................................ 51
Figure 36 – Reasons for traveling by train ....................................................................................... 51
Figure 37 – Reasons for traveling by bus ......................................................................................... 52
Figure 38 – Reasons for traveling by car.......................................................................................... 52
Figure 39 – Reasons for traveling by bike ........................................................................................ 53
Figure 40 – Reasons for walking ...................................................................................................... 53
Figure 41 – Running trains for O-D .................................................................................................. 54
Figure 42 – Train frequency from origin .......................................................................................... 54
Figure 43 – Will to use more frequent train service enabled by VC based on current train service

G A 8 2 6 3 4 7 P a g e 7 | 121
frequencybetweenrespondents’O-D ............................................................................................ 55
Figure 44 – Will to shift from current mode of transport to a more frequent train service enabled byVCbasedoncurrenttrainservicefrequencybetweenrespondents’O-D ................................. 56
Figure 45 – Travel frequency by train (for respondents who do not use railways routinely)......... 57
Figure 46 – Activities purpose by train (for respondents who do not use railways routinely) ....... 57
Figure 47 – Travel mode choice repartition (case study 1) ............................................................. 58
Figure 48 – Share of interviewees willing to pay more for a more frequent high-speed service enabled by VC .................................................................................................................................. 58
Figure 49 – Share of interviewees willing to use a more frequent high-speed enabled by VC for the same ticket cost ......................................................................................................................... 59
Figure 50 – Travel mode choice repartition (case study 2) ............................................................. 59
Figure 51 – Share of interviewees willing to pay more for a more frequent main line service enabled by VC .................................................................................................................................. 60
Figure 52 – Share of interviewees willing to use a more frequent main line enabled by VC for the same ticket cost ............................................................................................................................... 61
Figure 53 – Travel mode choice repartition (case study 3) ............................................................. 61
Figure 54 – Share of interviewees willing to pay more for a more frequent regional service enabled by VC (case study 3) ........................................................................................................... 62
Figure 55 – Share of interviewees willing to use a more frequent regional service enabled by VC for the same ticket cost (case study 3) ............................................................................................ 62
Figure 56 – Travel mode choice repartition (case study 4) ............................................................. 63
Figure 57 – Share of interviewees willing to pay more for a more frequent metro service enabled by VC (case study 4) ......................................................................................................................... 63
Figure 58 – Share of interviewees willing to use a more frequent metro service enabled by VC for the same ticket cost (case study 4) ................................................................................................. 64
Figure 59 – Travel mode choice repartition (case study 5) ............................................................. 65
Figure 60 – Willingness to use a more frequent freight train service enabled by VC to deliver more containers at a higher marginal cost (case study 5) .............................................................. 65
Figure 61 – Willingness to adopt fully automated freight wagons ................................................. 66
Figure 62 – Most important factor for transport mode choice ....................................................... 66
Figure 63 – Desired facilities for each MS if VC is introduced ......................................................... 68
Figure 64 – Additional desired facilities for each MS if VC is introduced........................................ 69
Figure 65 – Train length preference for each MS if VC is introduced ............................................. 69
Figure 66 – Share of respondents favourable to have trains heading to different directions which can stop in queue at the same platforms ........................................................................................ 70
Figure 67 – Suggested solution for boarding the right train ........................................................... 70
Figure 68 – Share of respondents considering VC more beneficial than MB for the different market segments ............................................................................................................................. 71
Figure 69 – Reasons for the benefits of VC over MB ....................................................................... 72
Figure 70 – Main challenges for the implementation of VC for each MS ....................................... 73
Figure 71 – Business impact of Virtual Coupling in terms of CAPEX and OPEX for each MS .......... 74
Figure 72 - Modal share for each passenger-related case study .................................................... 78
Figure 73 – Modal share for freight-related case study .................................................................. 78

G A 8 2 6 3 4 7 P a g e 8 | 121
Executive Summary This document evaluates the attractiveness of Virtual Coupling (VC) for different market segments (high-speed, main line, regional, urban/suburban, freight) and defines operational scenarios for each of them. A SWOT analysis identifies main strengths and weaknesses of the Virtual Coupling concept and corresponding opportunities and threats to each specific railway market segment. The research relies on a Delphi method with an extensive survey of expert opinions and stated travel preferences assuming VC has been implemented. The survey involved subject matter experts of the wide European railway industry including infrastructure managers, railway undertakings, system suppliers, transport authorities, railway institutions, private consultants and academics. In addition, travel preferences have been collected by interviewing European representatives belonging to other socio professional categories. Results show that the implementation of Virtual Coupling can be attractive to customers of high-speed, main line, regional and especially freight segments. Virtual Coupling has the potential of completely changing the way in which such segments operate and attract a modal shift from other transport modes to railways. Customers are even willing to pay higher fares for more frequent and flexible train services, especially on the regional and freight segments which are currently perceived as not satisfactory. Several operational scenarios have been defined based on the outcomes of the survey, setting market-attractive VC service headways for each market segment as well as specifying characteristics of rolling stock, power supply, traffic, and platform crowd management. Principles to couple/decouple virtually coupled convoys are also provided based on the specific network characteristics of the different market segments. A SWOT analysis is presented which builds on the outcomes of the survey, the operational scenarios and brainstorming sessions with experts of the European railway industry. The main strengths identified for VC are a substantial increase in capacity and reduced operational costs with respect to Moving Block while mitigating delay propagation and improving reliability of ground/train communication. On the other hand, weaknesses of this concept refer to the fact that capacity gains at diverging junctions equipped with current switch technologies might be marginal, since here trains still need to be separated by a full braking distance. Also, the implementation of VC operations would require an investment to upgrade the overhead line system, platform lengths (to allow platoons of trains to stop) and possibly the switch technology. An upgrade of the switch technology towards faster and more reliable ones (e.g. Railtaxi and REPOINT) will unleash the full potential of VC operations. Significant opportunities will be brought about Virtual Coupling such as potential increase in the profit of infrastructure managers and operators as well as a deregulation of the current railway market which could be opened also to smaller transport operators due to the increase of available train paths and the decrease of operational costs by full train automation. In addition, the train-to-train communication could lead to the institution of cooperative consortia of railway operators which can be more economically beneficial than the current competitive market model. This would also provide the chance to migrate obsolescent command and control systems towards future-proof digital railway architectures. Possible threats to the introduction of this concept mainly relate to potential increase of train control complexity increasing risks of approval from the railway industry. The need for an initial investment might be not well received by infrastructure managers and local governments. As well as the necessity of partially changing policies, operational procedures and engineering rules currently in place. When overcoming such challenges, Virtual Coupling has potentials to fully revolutionise and improve current train operations so to induce a sustainable shift to railways.

G A 8 2 6 3 4 7 P a g e 9 | 121
Abbreviations and Acronyms
Abbreviation / Acronyms
Description
CAF Construcciones y Auxiliar de Ferrocarriles (Constructions and Auxiliary Railways)
CBTC Communications-Based Train Control
CSP Content Security Policy
CTCS Chinese Train Control System
D4.1 Deliverable 4.1
ETCS European Train Control System
EU European Union
GSM-R Global System for Mobile - Railway
HS High Speed
HSR High Speed Rail
IMs Infrastructure Managers
L1 Level 1
L2 Level 2
L3 Level 3
LRT Light Rail Transit
MA Movement Authority
MB Moving Block
MOVINGRAIL MOving block and VIrtual coupling New Generations of RAIL signalling
mi mile
MS Market Segment
O-D Origin to Destination
R&D Research and Development
RUs Railway Undertakings
RRT Rail Rapid Transit
S2R Shift2Rail
SIL Safety Integrity Level
STC Streetcar
TCS Train Control System
TIM Train Integrity Monitoring
TUD Delft University of Technology
UITP Union International des Transports Public (International Association of Public Transport)
V2V Vehicle-to-Vehicle
VC Virtual Coupling
WP Work Package

G A 8 2 6 3 4 7 P a g e 10 | 121
1. Introduction Virtual Coupling is a recently introduced concept envisaging a railway with no more block segregation and track-side safety equipment (moving-block), where train integrity and safe braking supervision is entirely controlled on-board of trains which move synchronously in platoons at a relative braking distance from each other (i.e. the distance to slow down to the speed of the train ahead). Such a concept is set to provide substantial capacity benefits over plain moving-block operations (enabled by ETCS Level 3 signalling) which instead consider trains being outdistanced by an absolute braking distance which could reach up to 4-5 km for high-speed lines. Although the concept of platoons of vehicles separated by only a relative braking distance is already known in the field of road traffic, its adaptation to the railways raises profound challenges especially because of the much lower rail-wheel adhesion coefficient which makes train operations such as braking and direction switching significantly different from cars. The concept of Virtual Coupling introduces safety, technological and operational issues that need to be brought to the attention of the wider European railway industry to understand whether there can be a potential for market uptake, despite its supposed capacity benefits. There is hence a necessity for deeper investigation of the advantages that VC can provide with respect to fixed- and moving- block signalling and the corresponding challenges to its implementation. Both advantages and challenges can be different depending on the type of railway market segment (e.g. high speed, regional, urban/suburban) where speeds and operations could vary substantially. A first understanding of market potentials for Virtual Coupling can be identified for each market segment by direct consultation with experts of the wide European railway industry encompassing different perspectives on operational and business requirements from infrastructure managers, railway undertakings, suppliers and public authorities. To this end, an extensive survey is presented in this deliverable which collects opinions on Virtual Coupling by mainly interviewing a significant number of Subject Matter Experts (SMEs) of the European railway industry. The survey is intended to identify potentials and challenges that railway experts see in Virtual Coupling for the different market segments so to feed a SWOT analysis providing Strengths, Weaknesses, Opportunities, and Threats to the implementation of such a concept. Results of the SWOT analysis eventually lead to determining possible operational scenarios of Virtual Coupling for each railway market segment. Section 1 of this deliverable illustrates current fixed-block railway signalling technologies and principles across several European countries describing in more detail the Virtual Coupling concept and the corresponding challenges. Section 2 gives instead an overview on the main railway market segments as identified by the Shift2Rail Multi-Annual Action Plan (MAAP). Section 3 reports questions used in the survey to collect SME opinions and stated preferences for several real case studies in relation to each of the market segments. Analysis and results of the survey are reported and commented in Section 4 together with a SWOT analysis. Operational scenarios for Virtual Coupling are eventually provided in Section 5. Recommendations and conclusions are given in Section 6.
1.1. Overview This report collects the outcome of activities performed in Task 4.1 “Market Analysis” of theShift2Rail project MOVINGRAIL funded under Grant Agreement GA 826347. The core of the document provides results from an extensive survey focussed on representatives of the European railway industry to collect expert opinions about market potentials, challenges and operational scenarios for Virtual Coupling railway operations for the different market segments identified by the Shift2Rail Multi-Annual Action Plan. The same survey has also been extended to

G A 8 2 6 3 4 7 P a g e 11 | 121
European representatives of other socio-professional sectors to gather general thinking of potential end users of the railways as well as stated travel preferences and customer attractiveness of Virtual Coupling operations. An overview about the type of data collected during the survey is reported in Table 1.
Table 1 - Overview for Stated Preference Data from Surveys and Workshops
1.2. Background In recent years, the need for improved and sustainable mobility has become crucial, where rail services effectively reduce reliance on road networks by reducing congestion and pollution. Therefore, railways and particularly passenger rail has often been supported by public policies, particularly by the imposition of public service obligations in the EU area [1] as well as strategic plansonsustainablemobilitysuchastheEC“WhitepaperonTransport”. MOVINGRAIL is a research project funded by the Shift2Rail Joint Undertaking (S2R JU) of the European Commission in response to the open call S2R-OC-IP2-01-2018 [2]. This section provides a brief background about the MOVINGRAIL project and the contributions it will provide to the state-of-the-art in railway signalling and operations. Also, a detailed description of the Virtual Coupling concept (VC) is included together with challenges to its implementation mainly related to safety, technology, operations and rules. The core of the deliverable is an extensive analysis of expert opinions and stated travel preferences collected by means of a survey particularly addressed to stakeholders of the European Railway industry. Such survey aims at identifying benefits and challenges that Virtual Coupling could provide over Moving Block and traditional fixed-block signalling systems from the technical, technological, operational and business perspectives. In addition, collected interviews identify potential modal shift to railways of passenger and freights that Virtual Coupling could trigger. It is worth mentioning that results presented in this deliverable might be affected by a population bias, due to the specific stratification of the interviewed sample which is predominantly composed of railway subject matter experts. A bias is also due to different perspectives that interviewees belonging to different categories of railway stakeholders (e.g. infrastructure managers and railway
WP 4 (TUD) Stated preference data from surveys and workshops
Purpose Collecting data to support the assessment of market potentials and impact assessment of Virtual Coupling for different railway segments.
Types and format Surveys from railway experts to gather feedback and opinions about actual technological and operational feasibility of Virtual Coupling.
Origin of data The data derive from surveys built electronically (online) to both railway practitioners and the general public in the European region.
Expected size of data Less than 1 GB.
Data utility The data produced in WP4 will be useful to railway industry stakeholders and academic researchers to assess feasibility and multi-dimensional impacts of Virtual Coupling (VC) as well as to make predictions/plans about the development and implementation of the VC technology. Furthermore, it is useful to other experts of the broader transport industry and statisticians to estimate environmental repercussions that VC could have by potentially attracting more passengers towards railways.

G A 8 2 6 3 4 7 P a g e 12 | 121
undertakings) might have on a specific aspect of the railway business.
1.2.1. MOVINGRAIL The MOVINGRAIL project aims at developing train-centric signalling systems by specifying effective operations and testing methods for Moving Block, as well as assessing technologies and impacts of the Virtual Coupling concept on representative market segments of the railway business [3]. MOVINGRAIL includes a multidimensional analysis framework which models the railway system and evaluates the impacts of both Moving Block (MB) and Virtual Coupling (VC) in terms of three main dynamically interacting domains: operations, technology and business. The achievement of these results is made by integrating multiple analysis with various methodologies, models and simulation environments (e.g. multi-criteria and sensitivity analysis techniques) [3]. For MB signalling, state-of-the-art methods for train operation modelling are used to assess, validate and propose improvements to the moving-block engineering and operational rules, so to ensure train safe separation [3]. For VC signalling, state-of-the-art is retrieved by reviewing the main S2R work delivered in IP1 and IP2 on communication structures for the Train Control Monitoring System (TCMS). Improvements to the radio-based communication architectures are proposed by setting specifications which provide a more effective satisfaction to user requirements. Analogies with the railway field can spot possible automated car functions which can be imported to railways, so to fast-track further development of the VC concept [3].
1.2.2. Railway Systems in Europe The current EU railway network consists of 230,865 km of rail lines, out of which 121,108 km are electrified (UIC, 2010) [4]. In 2008, there were 367.3 billion passenger-kilometres travelled on national railway networks within the EU-27 (excluding the Netherlands) [4]. In 2010, the total performance of rail freight transport in the EU-27 was 389 billion tonne-kilometres [4]. Market shares of rail, air and road depend on several parameters such as the geographical context, national regulations, etc. However, in most European countries where High Speed Rail (HSR) is in operation, respondents are still prioritizing car as a main transport mode for short and medium distances, whereas air is the most popular mode for very long distances [5]. Due to the many common assets of private cars (e.g. privacy, ability for a full door-to-door trip, wider choice of departure date and time, wider choice of route, ease of handling luggage, less intermodal transfers, etc.), competition of modal shift from private cars to railways is becoming more complex. Additionally, the rapid evolution of car transport is mainly due to car-pooling and car-sharing [6]. Regardless of the benefits of traveling by car, railways and particularly HSR have proven capability of remaining very efficient over both long and short distances. The most retained assets which distinguish railways from other public transport modes include ground speed, access to city centres, freedom of passengers on-board trains (e.g. standing/walking during travel), passenger comfort, ability to save time (e.g. working in the train rather than wasting time on driving), etc. ECORYS (one of the largest and leading international research and consulting companies)
G A 8 2 6 3 4 7 P a g e 13 | 121
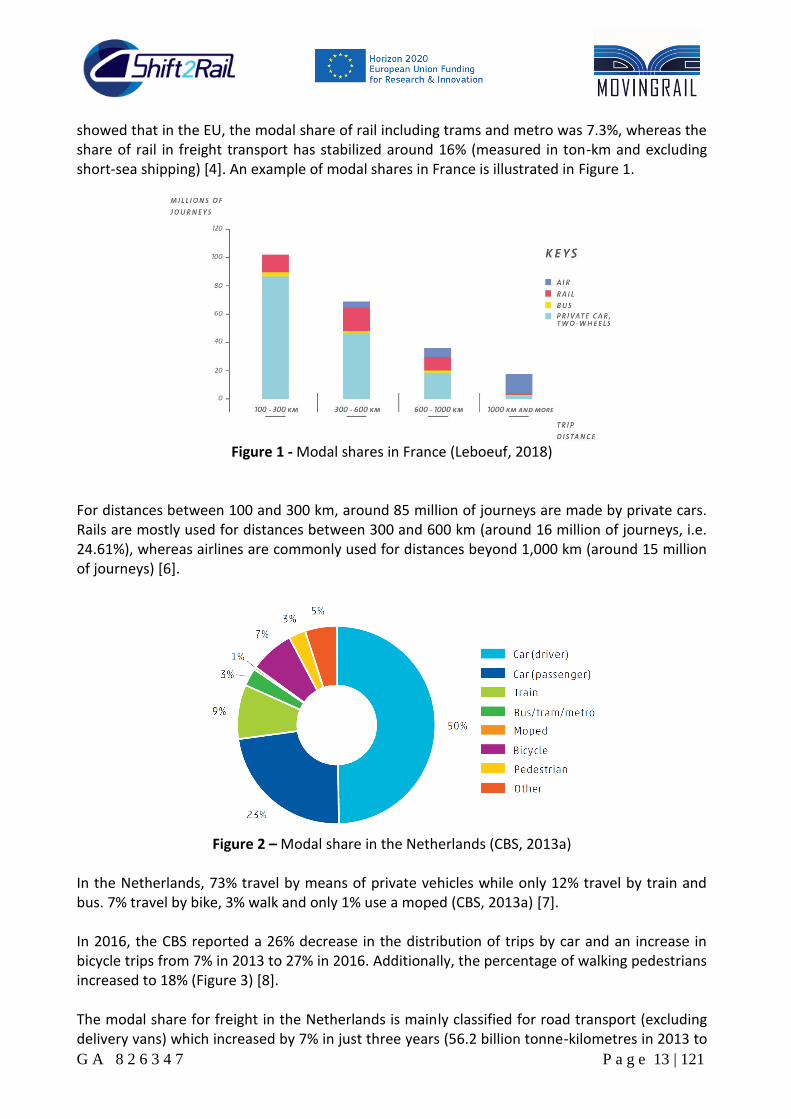
showed that in the EU, the modal share of rail including trams and metro was 7.3%, whereas the share of rail in freight transport has stabilized around 16% (measured in ton-km and excluding short-sea shipping) [4]. An example of modal shares in France is illustrated in Figure 1.
Figure 1 - Modal shares in France (Leboeuf, 2018)
For distances between 100 and 300 km, around 85 million of journeys are made by private cars. Rails are mostly used for distances between 300 and 600 km (around 16 million of journeys, i.e. 24.61%), whereas airlines are commonly used for distances beyond 1,000 km (around 15 million of journeys) [6].
Figure 2 – Modal share in the Netherlands (CBS, 2013a)
In the Netherlands, 73% travel by means of private vehicles while only 12% travel by train and bus. 7% travel by bike, 3% walk and only 1% use a moped (CBS, 2013a) [7]. In 2016, the CBS reported a 26% decrease in the distribution of trips by car and an increase in bicycle trips from 7% in 2013 to 27% in 2016. Additionally, the percentage of walking pedestrians increased to 18% (Figure 3) [8]. The modal share for freight in the Netherlands is mainly classified for road transport (excluding delivery vans) which increased by 7% in just three years (56.2 billion tonne-kilometres in 2013 to

G A 8 2 6 3 4 7 P a g e 14 | 121
60.3 billion tonne-kilometres in 2016). The inland waterways involve around 37% of the distributed freight trips, while railways only cover 5% with a minimal marginal increase of 0.5 billion tonne-kilometre from 2013 till 2016 (Figure 4) [8].
Figure 3 - Distribution of trips by mode of travel (CBS, 2016)
Figure 4 – Modal split in the Netherlands for freight (2013 VS 2016)
In Germany, 80% of residents rely on motorised individual vehicles (965.298 billion passenger-kilometres). The other transport modes are almost equally distributed, i.e. 7.82% for railways, 6.83% for public rail passenger transport and 5.33% for air traffic (Figure 5). The increase in rail-related transport modes was around 5% from 2013 till 2016. In terms of freight transport, almost 70% rely on road freight transport (i.e. 128.3 billion tonne-kilometres in 2016 VS 112.613 billion tonne-kilometres), followed by 19% for railways (128.3 billion tonne-kilometre). The inland navigation covers only 8% of freight trips, followed by 2.7% for pipelines and almost 0% for air traffic (Figure 6).
0
10
20
30
40
50
60
70
2013 2016
Bill
ion
to
nn
e-k
ilom
etre
s
Road (excluding delivery vans) Inland Waterways Railways Pipelines

G A 8 2 6 3 4 7 P a g e 15 | 121
Figure 5 – Modal Share in Germany for transport performance passengers (2013 VS 2016)
Figure 6 – Modal split in Germany for freight transport (2013 VS 2016)
The following statistics are for Great Britain and have been taken from [9] for the year 2017 (or 2017/18 for the freight statistics), which are the latest available at the time of writing. In England, the modal share of rail by number of trips was just 3% for the year 2017, corresponding to 11% of the distance travelled. Journeys by car made up the largest share by a significant margin with 62% of trips and 78% of distance travelled. The corresponding figures for bus were 6% and 5%, respectively. In terms of domestic freight, 9%, 13% and 78% were moved by rail, water and road, respectively. This corresponds to 17.0 billion tonne km moved by rail and is a 2% drop from the previous year, caused by a reduction in the volume of coal freight moved, which has declined by 85% since 2013/14.
0
200
400
600
800
1000
1200
2013 2016
Bill
ion
pas
sen
ger-
kilo
met
res
railway public rail passenger transport air traffic motorised individual traffic
0
100
200
300
400
500
600
2013 2016
Bill
ion
to
nn
e-k
ilom
etre
railway inland navigation road freight transport pipelines

G A 8 2 6 3 4 7 P a g e 16 | 121
Figure 7 – Number of passenger journeys (left) and passenger km (right) on public transport in
Great Britain 1985/86 to 2017/18, from [9]
Figure 7 shows that 1.71 billion passenger journeys were made on National Rail services (made up of those provided by passenger TOCs) in 2017/18, a 149% increase since 1985/86. The modal share of rail including main line, underground and light rail/tram has increased over the last approximately 10 years compared to buses.
1.2.3. ERTMS for railway interoperability To increase capacity and facilitate interoperability, Europe has introduced the European Rail Traffic Management System (ERTMS). The European Train Control System (ETCS) is the core signalling and train control component of ERTMS, which can be implemented with standard trackside equipment and/or unified controlling equipment within the train cab.
Figure 8 – Schematic layout of ETCS Level 1
ETCS L1 provides continuous guidance functions by Movement Authority, MA (that is the maximum distance trains can run safely before a danger point), where line-side signals are used in most cases. Information on train position along the tracks is reported by means of track detection sections. Trains receive instead in-cab updates of the MA and the signal aspects when crossing trackside transponders (called Eurobalises) which are directly connected to line-side signalling by means of a Lineside Electronic Unit (LEU). An additional infill loop (called Euro-loop) can be used for local continuous MA transmission (Figure 8). Supervision of the braking curve is
distance
speed
Train detection equipment
ETCS Level 1Minimum train separation
Balises
Euro-loop

G A 8 2 6 3 4 7 P a g e 17 | 121
performed dynamically by means of an on-board computer called European Vital Computer (EVC), which computes a safe braking curve to stop at the End of Authority (EoA) which is located at a safety margin from the danger point (named Supervised Location). The EVC is able to supervise speed and position of the train thanks to an on-board odometer which is recalibrated any time it crosses a new balise. ETCS L1 is generally used in conventional traffic (main line railways) for speeds up to 160 km/h [10],[11].
Figure 9 – Schematic layout of ETCS Level 2
ETCS Level 2 (Figure 9) is a radio-based fixed-block signalling system where line-side signals are removed and substituted with marker boards having the only purpose of delimiting block sections. Train position reporting and integrity monitoring are still performed via track-side train detection. Trains communicate via GSM-R to a track-side Radio Block Centre (RBC) receiving updates on the MA at regular time intervals (usually 2 to 5 seconds). The MA is then elaborated by the EVC to compute and supervise safe braking curves. Balises are in this case used only passively as a geographical reference to recalibrate train odometry. ETCS L2 can contribute to significant capacity gains due to dynamic supervision of the braking curve and frequent transmission of MA updates (Theeg and Vlasenko, 2009) [12]. ETCS L2 is usually introduced on HS lines and is implemented in several regions throughout Europe (e.g. France, Germany, Italy, Spain, the Netherlands).
distance
speed
Train detection equipment
ETCS Level 2
Minimum train separationBalises
Radio Block Centre

G A 8 2 6 3 4 7 P a g e 18 | 121
Figure 10 – Schematic layout of ETCS Level 3 Hybrid
In order to release more network capacity than ETCS Level 2, the concept of ETCS Level 3 Hybrid [13] has been introduced recently thanks to a joined cooperation between ProRail and Network Rail (respectively the Dutch and British railway infrastructure manager). ETCS Level 3 Hybrid still relies on track-side train detection equipment for position reporting and checking integrity of trains which are not equipped with an on-board Train Integrity Monitoring (TIM) device, responsible for monitoring that all cars of a trainset are safely held together. As in ETCS Level 2 the MA is reported at regular time intervals by means of the RBC. In ETCS Level 3 Hybrid regular ETCS Level 2 block sections are further segregated into smaller sections which are called Virtual Sub-Sections (VSS) since they are software-based and not physical delimiters. A train following a TIM-equipped train can occupy the same physical block section of the train ahead and will be granted an MA that goes before the next occupied VSS. If a train is instead following a train not equipped with TIM, then it will be supervised under ETCS Level 2, receiving an ETCS Level 2 MA which ends before the next occupied physical block section.
Figure 11 – Schematic layout of ETCS Level 3
ETCS Level 3 (Figure 11) is the last level of ETCS signalling technologies enabling moving-block train operations that overcome traditional fixed-block train separation by allowing trains to be
distance
speed
Train detection equipment
ETCS Level 3 Hybrid
Minimum train separationBalises
Radio Block Centre
TIM TIM
VSS VSSVSS VSSVSS VSS VSS
distance
speed
ETCS Level 3
Minimum train separation
Radio Block Centre
Balises
TIM TIM
Train Integrity Monitoring
Safety margin

G A 8 2 6 3 4 7 P a g e 19 | 121
separated by an absolute braking distance, i.e., the distance needed to reach a standstill from current speed (Theeg and Vlasenko, 2009) [12]. In ETCS Level 3 block sections, line-side signals and track-side train detection equipment are no longer required, while transferring vital functionalities such as train integrity monitoring and braking supervision from track-side to on-board. The TIM becomes responsible for checking integrity of the trainset while the EVC ensures that trains are safely separated by an absolute braking distance. Trains report positions to the RBC via GSM-R while the MA broadcasted refers to danger points that can be switches, speed restrictions as well as nose and/or tail of trains ahead. ETCS Level 3 moving-block has been so far not implemented yet due to missing TIM technologies for trains with variable compositions such as freight trains. An implementation of moving-block signalling can instead be seen for many urban metro lines using the so-called Communications-Based Train Control (CBTC) railway signalling system that relies on radio-based communication between the train and track equipment [10]. Capacity benefits for ETCS L3 moving-block however can be limited for high-speed lines, where absolute braking distances can reach up to 4-5 km when operating speeds are around 300 km/h [14],[15]. A further operational development for advanced signalling technologies builds on the concept of separating trains by means of a relative braking distance (i.e. the distance needed to slow down to the speed of the train ahead) instead of an absolute one. This concept goes under the name of Virtual Coupling (VC) and calls for a deeper investigation on safety, operational and engineering challenges that it can raise. More details about Virtual Coupling are provided in the following Section 1.2.4.
1.2.4. Virtual Coupling train operations: Basic concept and signalling architecture The railway transport demand of passengers and goods is continuously increasing which leads to railway capacity saturation especially in densely built areas. This has been challenging to the railway industry and specifically to infrastructure managers, having direct impact on railway customers which are constrained by reduced service frequency and the consequent lack of flexibility in adapting their travel alternatives [14]. To further increase network capacity so to accommodate the forecasted increase in the railway demand (European Environment Agency, 2015 [16]), the concept of Virtual Coupling (VC) has been recently proposed (Figure 12). VC takes moving-block train operations to the next stage by aiming at separating trains by a relative braking distance and move synchronously together in platoons of trains that can be treated as a single convoy at junctions so to increase capacity at bottlenecks. As in ETCS Level 3 train position reporting is performed via radio communication with the RBC. Also, the MA is broadcasted to trains by the RBC. Due to the very short distances between trains under Virtual Coupling, sight and reaction times of human drivers are no longer safe and Automatic Train Operation (ATO) shall be equipped to all trains for automated driving. To implement such a concept, trains need to exchange speed, acceleration and position information and a Vehicle to Vehicle (V2V) communication architecture is therefore required [17]. The train convoy (platoon) concept consists in understanding the behaviour between a leading train and a following train. A leading train is controlled as in ETCS L3 whilst the following train receives speed and brake command data from the leader. If information is delivered from the

G A 8 2 6 3 4 7 P a g e 20 | 121
leader to the follower, the latest assumes that the leader must continue on the current trajectory based on high integrity V2V communications, otherwise it falls back to ETCS L3 [17].
Figure 12 – Schematic layout of Virtual Coupling train operations
The concept of vehicle platooning has been proved already in the road sector for automated cars under cooperative adaptive cruise control (Herman et al., 2017) [14], however the much longer braking curves of trains and the presence of moving track elements for direction switching (i.e. points), raise non-negligible safety, operational and technological challenges for the railways which need to be carefully addressed.
1.2.5. Virtual Coupling: safety, technological and operational challenges The purpose of Virtual Coupling is to improve frequency, hence capacity, as train headway can be significantly reduced [14]. However, every newly introduced technology has limitations and potential risks, which require serious investigation by experts. The VC implementation faces several main challenges in terms of safety, technology, infrastructure layout and operations. The different safety challenges raised by VC are illustrated in Figure 13. When trains travel at a relative braking distance from each other, critical safety issues arise especially at locations such as diverging junctions, where points might not have enough time to be moved and locked in between consecutive trains with potential risks of train derailments. To avoid such a risk a convoy shall therefore be outdistanced by an absolute braking curve when approaching diverging junctions which might in turn reduce capacity gains of Virtual Coupling when compared to plain ETCS Level 3 operations.
distance
speed
Virtual Coupling
Minimum train separation
Radio Block Centre
Balises
TIM TIM
Train Integrity Monitoring
Safety marginTrain convoy
V2V comm

G A 8 2 6 3 4 7 P a g e 21 | 121
Figure 13- Safety challenges in Virtual Coupling
Another issue regards the communication frequency of dynamic information exchanged by trains in a convoy. If the train ahead is braking and the information is not timely broadcasted to the following train, then a collision will be likely to occur. To this end, a communication technology ensuring a sufficient frequency of information exchange must be selected. Another relevant issue refers to collision risks that arise when trains moving in a convoy have different braking characteristics. In case a train has braking characteristics which are worse than the train ahead, then this might overshoot the MA and collide with the leading train. A robust VC train shall hence consider not only to communicate data of the train ahead to the trains behind, but also to broadcast the status of the trains behind to the leading train so that this latter can adjust its braking rates to the maximum possible deceleration of the other trains. From the technological point of view VC introduces several challenges as represented in Figure 14. A main technological challenge is to deploy a V2V communication layer which complements the RBC-train communication while providing high-frequency integer and reliable exchange of position, speed and acceleration among trains. Also, the interface between trains with the Interlocking (IXL) and the Traffic Management System (TMS) is a relevant issue to address.
Safety challenges
Safety margin
TIM TIM
Distance at diverging junctions
Radio Block Centre
Safety margin
TIM TIM
V2V comm.
Communication frequency
TIM TIMTIM
Platooning trains with different characteristics

G A 8 2 6 3 4 7 P a g e 22 | 121
Figure 14 - Technological challenges in Virtual Coupling
The main challenge is to understand whether under Virtual Coupling, trains will be still controlled and dispatched by a centralised TMS or will be individually controlled. This would mean that routes within interlocking areas will be no longer set from a central traffic dispatching centre but could be set directly from on-board the trains by means of a specific train-IXL communication interface which need to be specifically developed. The implementation of ATO is another challenge that railways are already facing today to be interfaced with national signalling systems and/or ETCS. However, the interface for ATO under Virtual Coupling will need to consider additional functionalities to those tackles in today’s ATO requirements. One of these functionalities regards controlling a train during braking so to match the most constraining braking rate among all trains belonging to the same convoy, so to avoid collision with trains ahead that might have better braking performance. Furthermore, the ATO shall be able to access information about position, acceleration and speed of the train ahead so to keep a safe distance between trains in a convoy.
Technological challenges
Radio Block Centre
Safety margin
TIM TIM
V2V comm.
Communication architecture
Interface with TMS and IXL
Safety margin
TIM TIM
Radio Block Centre TMS
IXL
V2V link
ATO interface
Safety margin
TIM TIMATO ATO

G A 8 2 6 3 4 7 P a g e 23 | 121
Figure 15 – Infrastructure and operational challenges for the VC implementation
The introduction of Virtual Coupling will however affect also the configuration of current railway infrastructure and operations (Figure 15). One of the main challenges to be addressed with respect to the infrastructure is for instance the extension of platform tracks to allow multiple trains coupled in a convoy to enter a station at the same time and stop while queueing one behind each other at the same platform. So, there might be the need of adapting platform lengths to the average length of a train convoy. Also, platoons of trains having different directions stopping at the same station might create confusion to passengers needing to catch the right train going to the desired destination. To avoid any confusion, trains heading towards the same destination might be therefore allocated to the same platform. Another solution would instead be to segregate the platform in multiple sections where each section indicates the destination of the train there stopped. Such a segregation might be performed by means of boards or even physically by means of gates or platform doors. From the operational perspective current train planning rules could be completely superseded by different set of norms which are no longer depending on the single train but on the entire convoy. For instance, the running time of a train might not be scheduled anymore solely depending on its technical characteristics and route, but also on the operational characteristics of the other trains in the same convoy (Section 2). In Virtual Coupling the scheduled running time of a single train will hence depend on the running time of the train leading the convoy. Changes might also be needed in terms of
Infrastructure and operational challenges
STATION
Safety margin
TIM TIM
Platform length for platoons
TIM
Train planning rules
Engineering and operational rules

G A 8 2 6 3 4 7 P a g e 24 | 121
engineering and operational rules, since train convoying will massively impact rules for allocating and managing rolling stock and crew to train services. The length of a train set could be cut down inorder tohaveshorterandmore frequent trains thatcancouple/decouple“onthefly” foramore flexible service which could better adapt to demand needs. Furthermore, the protocols for traffic management and train-to-trackside communication might be modified, given that the information about route conditions might be provided just to the leader of a train convoy and no longer to every single train if these are part of a convoy. Addressing each of the mentioned challenges will radically modify the current setup of the railway business in terms of Capital Expenditures (CAPEX) and Operational Expenditures (OPEX), policy, regulations and business risks. The feasibility of Virtual Coupling depends on the possibility of overcoming safety, technological and operational challenges as well as on the trade-off between capacity benefits, business costs and risks. To this end, a SWOT analysis has been developed to assess the strengths, weaknesses, threats and opportunities of VC implementation for each of the rail market segments. More details about the SWOT are provided in Section 5.7.
1.3. Objective This deliverable aims at analysing the potential business and market responses due to the application of the Virtual Coupling (VC) concept, by identifying its benefits and drawbacks in terms of performance and safety.
1.4. Methodology The methodology applied to identify market potentials and possible scenarios for VC follows four main steps:
1. Defining case studies for each of the main market segments. 2. Collecting and analysing expert opinions and stated preferences by means of a survey
which aims at understanding potential customer attractiveness of VC operations, as well as main advantages and limitations that VC could have in terms of safety, technology, operations, regulations, costs and business risks.
3. Using results of the survey made at step 2 to perform a SWOT analysis that identifies needs and targets, potential competitors and barriers to the deployment of VC.
4. Assessing market needs and possible VC operational scenarios based on the main outcome of the SWOT analysis.
Before getting into the details of the survey and the SWOT analysis, an accurate description of the different rail market segments as identified by the Shift2Rail MAAP is reported in the following section.

G A 8 2 6 3 4 7 P a g e 25 | 121
2. Market Segments Operational Characteristics Railways are classified based on operational characteristics of the network such as average speed, volume transported, covered distance, etc. The various passenger rail Market Segments (MSs) depend on several factors such as the geographical extension of the network, the served territory (e.g. regional, urban), and the demand. The distinction of passenger rail market segments is generally classified among four categories: high-speed, main line, regional and urban/suburban. Each MS corresponds to specific customer needs mainly depending on the purpose of travel and the distance between origin and destination, as well as on their expectations in regard to their age, gender, education, activity, and income. In order to satisfy these requirements, the relevant passenger market segments may call for specific research needs, requiring specific design, operation, as well as construction and maintenance conditions [14]. In addition to the passenger rail market segments we also consider freight railways which have been defined by the UIC and S2R (2015) as a key element to a sustainable transport system [14],[18]. Freight trains are indeed mostly used for the transport of bulk commodities such as solid mineral fuels (e.g. coal), ores, metal waste, as well as petroleum products and fertilisers [14]. The following sections describe the specifications for each MS.
2.1. High-Speed (HS) High Speed Rail (HSR) has been a very successful and innovative rail market segment for several decades, particularly in Europe [14],[18]. HS lines are complex systems as they have different implementations worldwide in terms of maximum/average speeds, number of stops, and operations. They also involve various technical aspects, e.g. infrastructure, rolling stock, operation and cross-sector issues (financial, commercial, etc.) [19]. The CSP and the UIC (2014) indicate that the length of HSR networks both in operation and under construction were 35,708 km worldwide. The longest HSR network in operation were in Asia (15,241 km) followed by Europe (7,351 km) (CSP, 2014; Janic, 2016; UIC, 2014) [20]. Recent statistics (UIC, 2019) show that the high speed lines in the world currently in operation amount to 46,483 km, split into 36,372 km in Asia (17 countries), 9,176 km in Europe (19 countries) and 8 other countries (935 km) [19]. The Trans-European HS lines are classified into three categories in the Technical Specification for Interoperability (TSI) (EC, 1996; UIC, 2014a): - Category I: VMAX ≥ 250 km/h – New tracks are specially constructed for HS
- Category II: VMAX ≥ 200 km/h – Existing tracks are specially upgraded for HS
- Category III: VMAX ≥ 200 km/h – Existing tracks are specially upgraded for HS, with special
specifications to the limitations/enforcement imposed by landscape or the compulsory
passage through the urban environment.
In general, HS lines are interurban lines (i.e. few intermediate stops) operated on zero level crossings [21]. The maximum commercial speed is about 300 km/h for the majority of national high speed railways (Japan, China, Taiwan, France, Germany, Spain, Italy, UK), although some lines reach higher commercial speeds up to 320 km/h [4]. High Speed Rails have recently been

G A 8 2 6 3 4 7 P a g e 26 | 121
the preferred choice for journeys up to 800 km (i.e. 5 hours door to door) [14],[18]. The line length is usually beyond 250 km and speed limitations should be taken into account when there are external factors such as environment and noise protection. ECORYS indicates that HSR is best suited for journeys of 2 to 3 hours (about 250-900 km) (ECORYS, May 2012) [4]. The minimum distance between HS stations is 50 kilometres. The capacity can result in 16 to 20 trains per hour [21] with up to 400,000 passengers per day, which would significantly reduce traffic congestion [19]. Another advantage of HSR is its eco-friendliness, i.e., efficient use of land, as well as its economic development [19]. Furthermore, HSR promotes logical territory structure and contributes to urban sprawl [19]. Usually it is preferred that no shunting movements (i.e. merging, diverging) or splitting routes are present on high speed lines. In those cases, buffer times of 1 minute between the position of the head of a train and the position of the indication point might be sufficient. Furthermore, a practical headway of 3 minutes is applicable (Emery, 2011) [21]. High speed traffic in the world amounts for 844.8 billion passengers-km (UIC, Jan 2019). The trend of passenger-km in different countries is displayed in Table 2 [19].
Table 2 – Passenger-km Distribution Around the World (UIC, 2019)
The introduction of high-speed trains has increased the competitiveness of railways by reducing the total travel time. For example, on the connection Paris-Frankfurt the running time has decreased from 6.15 to 3.49 hours [22]. The percentage share before the introduction of high-speed trains on the Madrid-Seville line was 67% for cars and 33% for trains. After the introduction of HS trains, 51% shifted to trains resulting in a total rail share of 84% (Figure 16) [22].
Figure 16 – Percentage share before and after introduction of high-speed trains in Madrid –
Seville (UNIFE) Based on statistics reported by the UIC referring to January 22nd 2019, the maximum current planned operation speed reached 350 km/h in China in 2017 with a total number of 1,013 seats [19]. In the UK, the maximum operating speed of 225 km/h has been put in service in 2009

G A 8 2 6 3 4 7 P a g e 27 | 121
(Southeastern owner/operator) and carries a total number of 348 seats [19]. For the other countries in Europe, the maximum operating speed reached 320 km/h in France, Germany and Switzerland since year 1993, 2000 and 2006, respectively [19].
The HSL-Zuid (Hogesnelheidslijn Zuid, or High Speed Line South) is a high speed railway in the Netherlands of 125 kilometres, which was opened in 2009. The high speed line runs from Schiphol Airport to Rotterdam and continues to the Dutch/Belgian border towards Antwerp. This high speed track is used by the Amsterdam-Brussels-Paris Thalys train, the London-Amsterdam Eurostar, the international Intercity Amsterdam-Brussels, as well as national services. Reservations for Thalys are compulsory as they can get fully booked. The trip from Amsterdam to Paris takes on average 3 hours and 20 minutes for speeds up to 300 km/h. The Thalys trains are usually equipped with a significant number of facilities such as air conditioning, bars, disabled facilities, power sockets, restaurants, waiter service, Wi-Fi, newspapers/magazines, etc. The international trains to Paris and Brussels each operate once per hour, and the Eurostar twice a day. In additional, also national trains use the HSL line, with an Intercity Direct service from Amsterdam to Rotterdam twice per hour, an Intercity Direct service Amsterdam-Rotterdam-Breda twice per hour, and an intercity train The Hague-Rotterdam-Breda twice per hour that uses the HSL from Rotterdam to Breda. Breda is a station halfway Rotterdam and the Belgian border that is connected to the HSL. The Intercity Direct operates with a maximum speed of 160 km/h (to be increased to 200 km/h when new rolling stock is available). The HSL-Zuid is therefore currently operated by six trains per hour, plus twice a day the Eurostar with mixed traffic of trains with 300 km/h and 160 km/h. The HSL Zuid signalling is ETCS Level 2, with legacy ATB-EG train protection at Rotterdam and the stretch Amsterdam-Schiphol Airport. The principal railway operator in the Netherlands, Nederlandse Spoorwegen (NS), stated an expectation of up to 17 million domestic and seven million international passengers annually from 2010. The HSR in Germany consists of dedicated new tracks for 250-300 km/h and upgraded existing tracks for 200-230 km/h for mixed traffic. With a few exceptions, the high speed sections end outside the main stations. Most high-speed trains therefore run partly on conventional lines with 140-200 km/h. Due to the settlement structure, the distance between the stops is sometimes considerably less than 50 km (for example Rhine-Ruhr). Although high-speed traffic is operated in free competition without subsidies, the high-speed network is exclusively operated by Deutsche Bahn (ICE and IC). Most lines of the core network are served hourly. As part of the Deutschlandtakt project, it is planned to increase this service to half an hour. In Great Britain, High Speed 1 (HS1) is a high-speed network linking the Channel Tunnel to St Pancras International station in London [23]. The infrastructure manager is HS1 Ltd. The network contains four stations, additionally Ashford International, Ebbsfleet International and Stratford International. HS1 is an electrified 25kV/50 Hz AC mainly double track railway, which does not allow diesel locomotives except in exceptional circumstances. The high speed network connects to Network Rail infrastructure in several locations, including to the Midland Main Line and the West Coast Main line. All major parts of the network are signalled for bi-directional operation, and passing loops are provided in two locations in both directions to provide traffic regulation options. The speed limit is 140 km/h for freight trains and 225 km/h for domestic passenger trains along the length of the route and either 300 km/h or 230 km/h for international passenger trains. Traffic is controlled and signalled from the control centre at Ashford. The in-cab TVM430 system

G A 8 2 6 3 4 7 P a g e 28 | 121
is used throughout the main parts of the HS1 network. At the interfaces with the NR network KVB signalling is used and St Pancras International station is controlled by lineside signalling. GSM-R is used throughout the HS1 network. HS2 is a planned high speed railway, which will run from London to Birmingham (to be built in Phase 1) and on to Leeds and Manchester (Phase 2). Speeds of up to 362 km/h are planned for normal operation, with specification up to 402 km/h. Some rolling stock will operate exclusively on the HS2 network, while the remainder will transfer onto the main line network to extend the reach of HS2. These trains will run seamlessly on the high speed infrastructure and transfer to speeds of 200 km/h or below. All junctions to the conventional network will be on the Phase 2 part of the infrastructure. It is intended that by 2033 18 trains per hour will run north from London on HS2. It is currently recommended that freight will not operate on the HS2 route. It is specified for ETCS level 2 operation with ATO. The communication system will be GSM-R and power will be supplied as 25kV AC.
2.2. Conventional/Main Line Main line services are essential to meet either very substantial or more specific long distance national and international trips connecting cities within a region or across regional boundaries. As defined in the railway capacity manual of the Transportation Research Board [24] a main line consists of tracks which are used for through trains or mainly as a principal artery of the system from which branch lines, yards, sidings and spurs are connected. It generally refers to a route between cities as opposed to a route providing suburban or metro services. For capacity reasons, main lines in many countries have at least a double track and often contain multiple parallel tracks. Main line tracks are typically operated at higher speeds than branch lines and are generally built and maintained to a higher standard than yards and branch lines. Main lines may also be operated under shared access by a number of railway companies, with sidings and branches operated by private companies or single railway companies. Railway points are usually set in the direction of the main line by default. Failure to do so has been a factor in several fatal railway accidents, for example the Buttevant rail disaster in Ireland [25]. Trains operating on a main line corridor, are usually intercity and/or commuter services mostly providing a direct connection between main cities and/or towns. Together with these direct intercity services it is also possible to find a minority of stop services which perform more stops in between main cities so to serve customer demand accessing/egressing the railway network from/to city outskirts and surrounding villages. Most long-distance services depend on an efficient combination of HS and conventional lines, especially for connecting segments with less traffic demand or accessing city centres [14]. Depending on the country (e.g. in Italy and Spain), high-speed lines may for instance access sections and stations of main line railways and run over those sections in a mixed traffic condition together with intercities, fast regional trains or even freight trains. The majority of main line rail network in the Netherlands consists of mixed traffic with InterCity (IC) trains, regional trains (sprinters) and freight trains. These lines are very densely used and include main stations with trains from various directions. IC trains connect the major cities while Sprinters basically serve all stops. Both IC and Sprinter trains on the core Dutch railway network are operated by a single operator, the Netherlands Railways (NS). For both IC trains and sprinters

G A 8 2 6 3 4 7 P a g e 29 | 121
no seat reservation is required. High customer satisfaction is achieved through enough seat availability, passenger-service and provision of up-to-date travel information via either screens or mobile (internet) particularly during disruptions. Over the last years, the number of train services grew enormously, mainly through increases in frequency, and in peak hours seats are not enough so that many passengers are also standing. Since December 2006, all IC services in the west and centre of the country are operated with a 15-minute headway. In the current Program High Frequent trains (PHS), the aim is to decrease the headway to 10 minutes between ICs, with additional Sprinter or freight trains in between, which is already operational on the main line Amsterdam-Utrecht-Den Bosch-Eindhoven since 2018. Long-haul traffic on conventional routes in Germany is given priority over regional or freight traffic. Trains of this segment normally operate between 140-200 km/h. Since some trains partly use high-speed lines, the transition of these segments is fluid. Although most trains run relatively long distances (500-1000 km), most passengers only use them for shorter distances (100-300 km). Most lines are operated every two hours. However, some branch lines only operate once a day. For some years there has been little competition in this non-subsidised segment. In addition to Deutsche Bahn (IC), the private company Flixtrain is currently operating in this segment. In Great Britain Network Rail defines the long distance market as that with travel distances of over 50 miles (80 km), not mainly for commuting, and for travel between two large urban centres at least 30 miles (50 km) apart. This means that the journey profile is mainly business and leisure use. 36% of the main line (5766 km) is electrified as of 2018 [26] and the electrification status in CP5 is shown in Figure 17. Power may be supplied by a 25 kV overhead supply, 1500V DC overhead supply or a 750V DC third rail supply. There are six main lines, five of which connect to London; the Cross Country route from Scotland to southern and south west England does not. On the majority of lines the line speed limit is 125 miles per hour (~200 km/h), except for 110 mph on the Midland Main Line and 100 mph on the Great Eastern line. Signalling is conventional fixed block three or four aspect.
Figure 17 – Electrification of the GB main line network

G A 8 2 6 3 4 7 P a g e 30 | 121
2.3. Regional Regional trains are defined as rail-based high-performance suburban transit systems which operate along the rail lines/routes spreading between urban and suburban areas [20] They serve as a backbone for local public transport (particularly for commuters) in many countries worldwide. They usually compete with lower cost bus services or private cars [14],[18]. These services are mostly operated under public service contracts and they might share or not the infrastructure with the ongoing main line traffic. They should be attractive to customers through reduced costs, as well as increased reliability, frequency and speed [14],[18]. The electrically powered trains are usually composed of 1 to 10 vehicles with a capacity of 140 to 1,800 spaces for passengers [20]. The transport services are provided according to a fixed schedule at lower service frequency and rarer stops at stations on the longer lines/routes, which allow higher travel speeds as compared to the Rail Rapid Transit (RRT) and Light Rail Transit (LRT) [20]. In most European countries, regional trains are intensely used. A clear example is Spain, which has planned to enlarge the fleet of regional trains with 206 new trains (118 3-car units and 88 4-car units) by 2023 [27]. The biggest challenge for regional trains is to maintain the “traditional” rail strengths (i.e.resilience, energy savings and capacity) for mass transit while coordinating with other public transport services (e.g. ticketing, information to passengers) [14]. Another challenge is to offer increased capacity with improved traffic management, rolling stock and automation concepts [18]. In the Netherlands, regional lines are tendered to different train operators. The trains are also called sprinters which stop at all stations with generally a lower frequency than IC trains. They link regional destinations to larger Dutch cities and are often operated on single-track lines. Operators for regional lines include Arriva, Veolia and Connexxion. Most regional lines are non-electrified and operated by DMUs. In 2006, the regional train line service from Groningen to Leeuwarden was tendered in combination with all regional railway services in the northern provinces. Between 2002 and 2006, passenger transport between Leeuwarden and Groningen increased by 22%. In 2007, there was a further growth beyond 2%. High levels of customer satisfaction are achieved in the Netherlands due to trains with platform-level entries, accurate on-board travel information, tariff actions, increased frequencies and free Internet on-board. Regional transport (IRE/RE/RB/etc.) in Germany is organised and subsidised by the federal states. Connected networks or individual lines are usually awarded in competition for 10-15 years to the railway undertaking offering the lowest price and/or best service. The trains consist mainly of DMU or EMU with a large variance in top speed (80-200 km/h) and capacity (from 2-car-DMU to 8-car-double-deck-EMU) depending on the network. The train frequency is in most cases between 15 minutes and 2 hours. In Great Britain the regional market is considered to be that relating to an area less than 50 miles (80 km) from a regional centre to which respondents travel for the purposes of work and leisure [28]. Here, 63% of trips are for commuting, 28% for leisure and 9% for business. The movement to a central location applies pressure to the road networks in terms of congestion and parking availability in the centres, allowing rail a competitive advantage. Regional rail travel makes up 23% of total journeys made on the national rail network. Often journey times are slow with low

G A 8 2 6 3 4 7 P a g e 31 | 121
average speeds due to frequent station stops and low permitted line speeds. In cases where there are faster speeds and better journey times, an alternative main line option sometimes provides a faster alternative. Rolling stock is usually diesel, often with poor acceleration capability. During peak hours crowding is often an issue, and this, combined with older rolling stock is a cause for reduced customer satisfaction. These lines often run at capacity in peak hours; increasing the length of rolling stock may be one way to combat this, depending on availability and platform lengths / timetable implications. The Cambrian line uses an ETCS level 2 signalling system between Shrewsbury and Aberystwyth / Pwllheli. Communication goes via the radio block centre using GSM-R. Otherwise conventional signalling systems are in use on the regional lines.
2.4. Urban/Suburban (Transit Systems) The urban/suburban rail segment serves the daily needs of urban population and is the best alternative to the use of private cars especially in congested and polluted areas [14][18]. Therefore, this market segment plays a prominent role in major cities and high-density areas. The urban/suburban rail-based transit systems follow a schedule at speeds varying around 50 to 80 km/h. The trains operate within cities (i.e. between a city centre and middle to outer suburbs). Therefore, speeds are normally reduced and services are operated more closely together, resulting in higher capacity; the headway at peak times can be reduced to 2-5 minutes between trains. LRT and PRT systems and their particular lines/routes are increasingly semi- and/or fully automated, i.e., driverless, in many urban areas around the world (Vuchic, 1981, 2005) [20]. Main challenges comprise cost effectiveness and increased attractiveness, which require higher scales of proven and affordable technology, as well as improved accessibility, comfort, security and innovative services based on Intelligent Traffic Systems (ITS). Other challenges include improvements through technical harmonization of interfaces. Trains on these lines are heavily loaded as they can serve large numbers of commuters (i.e. respondents who travel for work on a daily basis). During peak commuting hours, longer train sets (also known as multiple-unit sets) are operated. Passenger incidents can therefore occur more frequently. The impact of failures results in significant perturbations in terms of cost, performance and delay. Therefore, the need to recover quickly should be a priority for urban/suburban lines in order to manage capacity and ensure safety [18]. The major sub-markets include tramways or Streetcars (STC), Light Rail Transit and Rail Rapid Transit, or metro (subway). STC and metro are segregated from general road and pedestrian traffic, whilst LRT is partially protected from road traffic [4][14]. More information regarding each of the sub-markets is detailed in Sections 2.4.1, 2.4.2 and 2.4.3. A wide variety of rail-bound urban and suburban transport systems are used in Germany. These include S-Bahn (main line suburban railway), U-Bahn (urban railway with independent tracks), trams (partly road-bound tracks) and various combined systems. Most of them are operated with EMU. Only some tram-train-systems have hybrid trains. The services are carried out either by a competitor or by municipal companies. In both cases, transport is subsidised by the cities or regions. S-Bahn is a full railway according to the German railway regulations EBO. Frequency depends on the line and is normally between 3 and 30 minutes. There are networks consisting only of dedicated lines (S-Bahn Berlin), consisting partly of mixed lines with a dedicated home

G A 8 2 6 3 4 7 P a g e 32 | 121
line in the city center (S-Bahn Munich, S-Bahn Munich, S-Bahn Stuttgart) or of a wide spread net with dedicated and mixed lines without a pronounced homeline (S-Bahn Rhine-Ruhr). U-Bahn is not a full railway according to German light rail and tramway regulations BOStrab. The networks consist exclusively of dedicated lines (U-Bahn Berlin, U-Bahn Munich, Hamburger Hochbahn). The frequency is usually between 2 and 15 minutes. Trams are classic streetcars (BOStrab). They operate partly on separate and partly on tracks in the road. The amount of separate tracks differs from city to city in a wide range. Due to driving on sight, on the one hand the operational speed is relatively low, on the other hand the possible train frequency is comparatively high. A frequently used combined system consists of metro-like lines (U-Bahn) in the city centre and tram lines in less central districts. Both are operated by the same EMU. Such systems are often called Stadtbahn (Stadtbahn Rhine-Ruhr, Stadtbahn Cologne or Stadbahn Hannover). Another used combined system consist of a tram network in the city center and regional lines. These Tram-Train-Systems have different names and are operated by special EMU or hybrid trains. They are suitable for smaller cities (Stadtbahn Karlsruhe, RegioTram Kassel or Chemnitzer Modell). In the Netherlands, metro and tram systems mainly operate in Amsterdam, Rotterdam, The Hague, Maastricht and Utrecht. The metro system of Amsterdam (founded in 14 October 1977) is both an underground system (40.9 km) and light rail (9.6 km) which is mainly considered an economic key area. The network includes 58 stations (39 part of the metro and 19 part of the light rail) which are connected and grouped together across five lines (namely lines 50 to 54). The metro system also connects Amsterdam to the surrounding municipalities. Services run from 5:30 am to 12:30 am. The metro has four distinct series of trains which differ in the composition of rolling stock. S1 and S2 trains are manufactured by the US company Burlington Northern (BN) Railroad and operate on Line 51. The S3 and M4 series are manufactured by the Spanish company CAF and run on lines 50, 51 and 53. All the previously mentioned trains are small and have only a two-car capacity. The most recent series are S3 trains, manufactured by Alstom, a French company. The latest have been in operation since 2015 and mainly consist of six cars which operate on all lines. The system operator is Gemeentevervoersbedrijf (GVB), the Amsterdam urban public transport company. The metro system of Amsterdam operates for speeds up to 70 km/h and serves 194,000 passengers daily, which is equivalent to more than 70 million passengers annually. The schedule and frequency vary from line to line and are related to the days of the week (e.g. earlier departures on weekdays where the headway varies between 10 and 15 minutes, depending on peak hour demand). During weekends, the frequency is every 15 minutes starting from 6:07 am till 12:50 am. The Rotterdam metro line belongs to the public transport company RET (Rotterdamse Elektrische Tram). It is the oldest metro network in the Netherlands from 1968. Similarly to the metro system of Amsterdam, the network has five main lines (A to E), where Line E connects the Rotterdam metro network to the tram network in The Hague.Rotterdam’sundergroundhasa lengthof78.3kilometres.LinesA,BandCtransported175,000 passengers per day in 2013 mainly between Schiedam Centrum and Capelsebrug (the central part). The number of passenger kilometres have developed from 599 in 2017 to 618 in 2018(2.7%increase),resultinginanoperatingnetresultof€5.6millionin2018. In Great Britain urban rail is divided into commuter rail networks (in Edinburgh, Leeds, Liverpool, Manchester, Birmingham, Cardiff, Bristol, and London), metro networks (Glasgow, Newcastle, London) and tram networks (Edinburgh, Blackpool, Manchester, Sheffield, Nottingham, Birmingham and London). The largest urban rail network is in London, London Overground run
G A 8 2 6 3 4 7 P a g e 33 | 121
by Transport for London, which also runs the London Underground and the Docklands Light Railway. Ticketing is part of the Oyster card network and service frequency is high. Passengers may use tickets across modes, including on buses. London Underground typically uses two aspect fixed block signalling. The Victoria and Central lines are equipped with automatic train operation. Originally the Docklands Light railway used a fixed block signalling system, but since 1994 the Thales (since 2007, previously Alcatel) SelTrac moving block transmission based train control system was introduced. Transmission is between trains’VOBCandthecontrolcentreviainductiveloop.TheThameslinkprogramme upgraded the core section of the Thameslink network across central London to an ATO system operating over ETCS level 2, i.e. signalling is in-cab and communications are via GSM-R. Trains run at GoA 2 in the Thameslink core.
2.4.1. Metro (Subway) or Rail Rapid Transit (RRT) The metro is a rail-based high-performance urban transit system where trains operate along the dedicated lines/routes with rail tracks usually spreading underground, i.e. with the tunnel alignment in large densely populated urban areas [20]. The lines constituting the network are the exclusive right-of-way enabling frequent, punctual, reliable, and fast transport services compared to other urban mass transport systems [4],[20]. ECORYS defines the metro as a primarily used short-distance passenger transport within urban areas [4]. It represents the backbone of urban transportation systems in many large urban areas around the world [20]. The transit services are provided according to a fixed schedule with relatively close stops at underground stations in dense urban areas and fewer stations in suburban areas [20]. Speeds are on average around 80 km/h. The rolling stock is usually composed of electric multiple units [4]. The electrically powered trains are composed of 1-10 vehicles with the capacity of 140 to 2,000 spaces for passengers. Compared to the LRT, the RRT system provides much higher transit capacity, travel speed, internal comfort, reliability, punctuality and safety of services [20]. A historical example of a metro system is the London Underground (Tube) that was the first implemented metro system in the world and was opened in the second part of the 19th century [20]. Since 2000, the length of the overall network of metros has increased by 4,800 kilometres, resulting in 16,100 km [1]. Nowadays, there are around 160 metro systems in 55 countries worldwide [20]. Teodorovic and Janic (2017) state that subway systems currently operate in 148 urban areas (cities) around the world with about 540 lines. The total daily passenger demand served by these systems has been about 150×106 passengers per day (UITP, 2014). Specifically in Europe, the total length of a 2,800 km network (45 cities) and the fleet of 21,500 vehicles serves more than 30 million passengers per day [20].
2.4.2. Light Rail Transit (LRT) Light rail is a rail-based high-performance urban transit system operating along predominantly reserved grade-separated Right-Of-Ways (ROWs), although some systems share streets with car traffic. It usually includes 1 to 4 electric railcars carrying up a capacity of up to 220-600 passengers [4][20]. Speeds are generally up to 100 km/h [4]. The services are provided according to a fixed schedule at stops/stations, which are rarer than those at bus and tramway systems. The LRT system has generally long distances with more distant, i.e. less frequent, stations along the entire length of its lines [20].
G A 8 2 6 3 4 7 P a g e 34 | 121
Since LRT trains mainly operate along their right-of-ways, they can provide higher quality of transit services in terms of travel speed, punctuality and reliability compared to tramways. The advantage of LRT is that it can run not only on grade-crossing tracks, but also on the streets, which increases its spatial flexibility. Moreover, the system possesses the ability to be upgraded into rapid transit systems, such as Light Rail Rapid Transit (LRRT). It can also be fully automated, i.e., driverless, known as Automated Light Rail Transit (ALRT) (Vuchic, 2005) [20]. One of the largest integrated network of both LRT and tramway systems is in Prague with a fleet of 920 vehicles, the longest network is in St. Petersburg (Russia) which has a length of 240 km, and the largest annual volume of satisfied served passengers demand has been in Budapest (Hungary) with a value of 396 million passengers per year (UITP, 2015) [20].
2.4.3. Tramway or Streetcar (STC) The tramway is a lightweight medium-capacity urban transit system operating the electrically powered vehicles usually in composition of 1 to 3 units with the capacity of 100 to 180-300 spaces for passengers [20],[4]. Differently from the other rail-bound systems, tram vehicles are not separated by means of an Automatic Train Protection (ATP) system, since they are simply driven on sight. Driving on sight is indeed essential for trams given that they usually share the lane with private car traffic and need to have the possibility of promptly reacting to sudden occupation of the rail tracks by means of cars or pedestrians crossing the road. A signalling system is however integrated with road traffic lights to manage right of ways and priorities at road junctions. Such an integrated signalling system is necessary to reduce congestion and prevent potential incidents, especially with individual car traffic [20]. Whenever possible the use of reserved lanes for trams has been proved to increase efficiency of tram services by significantly improving punctuality and service reliability [20]. The power supply is usually provided by electrical overhead lines/wires above the route. The tramway services are provided according to a fixed schedule with generally shorter distances and more distant, i.e., less frequent, stations along parts of its lines spreading out of the city centre. The stations are closer to each other, i.e., more frequent, along the same lines within the city centre [20]. The networks of streetcar (tramway) systems consist of several lines covering fully or partially given urban areas [20]. Tramways provide passenger transport services on tracks along public urban streets and also sometimes on separate rights of way [4]. In some cases, the network can consist only of a single line. An example is the tram line in Edinburgh (United Kingdom), which is 14 km long starting in the city centre and ending at Edinburgh airport with 14 stations in between and 10 other stops along the line [20].
2.5. Freight The freight/low traffic railways typically run outside cities and in areas where the need of capacity is low. Freight lines are considerably considered long and the typical headway is at least 1 hour, but also much smaller headways occur. Contrary to the urban/suburban railways, recovery can be achieved by operational rules rather than technical solutions (e.g. sweeping). Fast recovery is not required as there is no need for trackside infrastructure and fixed communication equipment. Due to the low level of external costs generated by rail freight, customers can prefer it as their

G A 8 2 6 3 4 7 P a g e 35 | 121
mode of choice looking to reduce the environmental impact, i.e., with much lower CO2 emissions and energy consumption per tonne-kilometre than road or inland waterways freight transport [14],[18].ThegoalofthisMSistoappropriatelymeetcustomers’requirementsbyofferingviablesolutions that increase productivity, optimise network capacity, enhance the quality of services, and reduce costs. One of the main drawbacks in Europe is that freight operations are more costly than in North America and Asia, as freight operations generally meet better structural conditions (i.e. longer distances, less frequent stops, infrastructure allowing for substantially longer and heavier trains). However, the rail freight corridors have been implemented in the EU in order to improve the framework conditions on designated lines with high economic importance [14]. From the other side, interoperability problems in both technical and operational domains, in combination with legal and administrative obstacles have so far partly hindered rail freight transport between Europe and Asia from achieving equal economic importance, as in North America. The key challenge for rail freight is offering an attractive, reliable, rapid and cost-efficient alternative to road. Simplicity, transparency and quality of the offered freight services should be improved in order to attract more customers to consider rail as their first chosen mode for the transport of most goods. Other parameters are major but cost intensive such as enhancing technical interoperability as well as the quality of the infrastructure. Harmonization and synchronization of some procedures, e.g. unloading and reloading containers between different gauge systems and customs, can be less time-consuming and more effective in speeding up transport [18],[14]. The Betuweroute is a double track 160 kilometres dedicated freight line, which runs from the Maasvlakte in the Rotterdam harbour Zevenaar to the border with Germany beyond Zevenaar. The Betuweroute comprises two parts: the Havenspoorlijn (48 km) and the A15 route (112 km) which runs parallel to the motorway. The line is electrified at 25 kV AC. Freight operators include ITL Benelux, Crossrail, DB Cargo, ERS Railways, etc. In 2016, 10.4% of all containers that arrived in Rotterdam left the port by means of railways, which is equivalent to 760,000 containers. The Betuweroute started operation on June 2007. Freight speeds vary and can reach in most cases 95 km/h, depending on the locomotive type and the carried tonnage. The Betuweroute witnessed its best in 2014 when 25,100 trains passed the freight line connecting the Netherlands and Germany. The numbers then dropped to 22,900 in 2015 and 20,400 in 2016. In 2017, the number of trains increased again by 17% where there were 42,850 freight trains running between the Netherlands and Germany. An additional track for the Betuweroute is expected between Zevenaar and Oberhausen (Germany) by 2022. Forecast volumes are expected to be 34,500-37,500 freight trains by 2025 and 37,000-43,000 in 2030. Freight traffic in Germany consists mainly of three different segments. The wagonload freight traffic across Europe with loads starting from at least one wagon, the container and intermodal traffic with single containers or truck lorries, and the whole train traffic between factories (for example chemical plant or car factory) and/or harbours with loads completing a train. Competition in this segment is high between various state railways and private rail transport companies. Most of the traffic is handled on the electrified core network. This partly consists of pure freight corridors with headways of up to 2 minutes and the conventional main line network with mixed traffic. Some high-speed lines are also used for freight transport at night. Less freight

G A 8 2 6 3 4 7 P a g e 36 | 121
is transported on the non-electrified secondary and tertiary networks. In Great Britain, freight is carried either in intermodal freight containers or trainload freight for coal, metal, oil and construction materials. Freight is transported on GB main lines, i.e. they accommodate mixed traffic, and Network Rail, which divides its network into eight geographical routes, operates a virtual route for freight as the ninth route. The Department for Transport introduced a vision for a Strategic Rail Freight Network in 2009 (see Figure 18) [29]. A core network that can support freight linking ports by rail with distribution centres and centres of production is planned in order to create the capacity and capability to compete with road freight. The routes should have the following characteristics [29]:
W10/W12 loading gauge
775m length functionality (650m minima & 1500m aspiration)
RA10 without infrastructure driven speed restriction
Electrified at 25kV AC
24/7 availability (through core & diversionary routes)
Under the current European TEN-T freight network plans, a route linking GB to continental Europe using the West Coast Main Line must conform to certain standards by 2030: accommodation of 22.5 tonne axle loads and 100 km/h capability. The current route meets this requirement except for Ipswich – Felixstowe and Swansea – Llanelli; there are some gaps in coverage at junctions. The ability to support 740 m trains is currently only met by the section of WCML from London – Crewe [30].

G A 8 2 6 3 4 7 P a g e 37 | 121
Figure 18 – Strategic Freight Network in Great Britain [29]

G A 8 2 6 3 4 7 P a g e 38 | 121
3. Virtual Coupling case studies for different Market Segments To investigate the applicability of the Virtual coupling concept to each of the different railway market segments, specific case studies have been analysed which build on real-life railway networks in Europe. Referring to the main five market segments defined by the Shift2Rail MAAP, we have identified a case study for each segment, namely:
1. The Rome-Bologna corridor in Italy for the High-Speed segment, 2. The London Waterloo-Southampton on the South West Main Line in the UK for the Main
Line segment, 3. The Leicester-Peterborough corridor on the Birmingham- Peterborough line in the UK as a
representative of the Regional segment, 4. The London Lancaster-London Liverpool Street on the London Central Line in the UK as a
case study for the Urban/Suburban segment. 5. The Rotterdam-Hamburg corridor between the Netherlands and Germany for the freight
segment.
These case studies were proposed to the railway experts and other interviewees during the survey so that they could refer to real case studies to provide expert opinions and/or stated travel preferences for the Virtual Coupling concept. Using real case studies has also allowed interviewees to compare potential travel times and train frequencies under hypothetical Virtual Coupling scenarios against current existing railway services and/or other transport modes such as cars, buses, aviation. In such a way, interviewees have had a good background to give more reliable answers on possible travel choice in a future scenario where Virtual Coupling would be implemented. In addition, SMEs could have a concrete reference to spot possible limitations and or challenges of the Virtual Coupling technology when considering each of the different market segments.
3.1. Case study description The following section describes the case studies defined for each market segment in the survey performed on market potentials of Virtual Coupling. Case study 1 – High Speed: Rome-Bologna (Italy) The travelled distance from Rome to Bologna by means of a direct (non-stop) high speed train is 305 km. The total travel time from origin to destination is 1 hour and 55 minutes (Figure 19). The headwayforthisHSRis15minutesandthetrainticketcostsaround€45(Table 3). Traveling by bustakesaround4hoursmorethanbytrainwithasignificantlydecreasedticketpriceto€14.The frequency of buses is every 4 hours. Traveling by car would cost approximately the same cost as for traveling by train with a need to drive for 4 hours and 20 minutes. A flight from Rome toBolognatakes55minutesandcostsaround€66withafrequencyof3tripsperday.

G A 8 2 6 3 4 7 P a g e 39 | 121
Figure 19 – Case study 1, Rome-Bologna (HSR)
Table 3 – Options for a routine trip from Rome to Bologna
The case study aims at understanding travel choices of the interviewed sample in the current situation and stated preferences in the future scenarios that a more frequent train service is available(every6minutesratherthanevery15minutes)foranincreased(plus€5.5)orforthesame ticket price (Table 4).
Table 4 – Train frequency and cost before and after VC (case study 1)
Case study 2 – Main Line: London Waterloo-Southampton (SWML, UK) The one-way travel time from London Waterloo to Southampton (127 km) is around 1 hour and 20 minutes with 4 intermediate stops (Figure 20). Every 30 minutes, a train stops at Waterloo Station heading towards Weymouth on the South Western Main Line (SWML). The cost of the train trip to Southampton is around £24. Traveling by regional bus, also known as coach, takes 2 hours and 20 minutes with a doubled waiting time for two consecutive buses, as compared to the trains’ frequency. However, a bus ticket would be £16.6 cheaper than a train ticket. Car drivers would spend around £12 on their 2 hours and 10 minutes one-way trip (Table 5).

G A 8 2 6 3 4 7 P a g e 40 | 121
Figure 20 – Case study 2, London Waterloo-Southampton (Main Line)
Table 5 – Options for a routine trip from London Waterloo to Southampton
The case study is addressed to collect travel preferences of the interviewees relative to the current transport situation and in the future scenarios where a more frequent train service is available (every 11 minutes rather than every 30 minutes) for an increased (plus £4.85) or the same cost (Table 6).
Table 6 – Train frequency and cost before and after VC (case study 2)
Case study 3 – Regional: Leicester-Peterborough (Birmingham-Peterborough line, UK) On the Birmingham-Peterborough line, the railway route from Leicester to Peterborough is 84 km long and the one-way trip between Leicester and Peterborough takes 55 minutes with 3 intermediate stops (Figure 21). The headway is 60 minutes and the ticket cost is £11.50 (Table 7). The travel time by means of a regional bus (coach) is 1 hour and 15 minutes for a ticket price of £7. However, the frequency of services is just 2 buses per day. Traveling by means of a private vehicle takes 1 hour for a price of around £13.

G A 8 2 6 3 4 7 P a g e 41 | 121
Figure 21 – Case study 3, Leicester-Peterborough (Regional)
Table 7 – Options for a routine trip from Leicester to Peterborough
The case study investigates stated travel choices of the interviewed sample in the current situation as well as for future scenarios envisaging the availability of a more frequent train service (every 22 minutes rather than every 60 minutes) for a higher (plus £2.30) or the same cost (Table 8).
Table 8 – Train frequency and cost before and after VC (case study 3)
Case study 4 – Urban: London Lancaster-London Liverpool St. (London Central Line, UK) The metro in UK, also known as underground or tube, covers a distance of 7 km from London Lancaster to London Liverpool Street with 8 intermediate stops (Figure 22). The travel time is 15 minutes (considering dwell time for passengers to board/disembark the platform). The train frequency is every 2 minutes and the one-way trip costs £2.40. By means of a bus, the travel time would increase to 50 minutes for a ticket price of £1.50, while the frequency of bus services would decrease to every 6 minutes. Traveling by car would only cost £0.92 for the one-way trip from London Lancaster to London Liverpool St. for a 45 minutes travel time. Riding a bike or walking is indeed free where travel times go around 35 minutes for traveling by bike and almost one hour and a half for walking (Table 9).

G A 8 2 6 3 4 7 P a g e 42 | 121
Figure 22 – Case study 4, London Lancaster-London Liverpool St. (Urban)
Table 9 – Options for a routine trip from London Lancaster to London Liverpool St.
The case study is set to analyse responses of the interviewees over travel choices for the current situation and for future scenarios where an improved metro service (every 45 seconds rather than every 2 minutes) is offered for an increased (plus £0.30) or the same price (Table 10).
Table 10 – Train frequency and cost before and after VC (case study 4)
Case study 5 – Freight: Hamburg-Rotterdam (Germany-Netherlands) The freight line from Hamburg to Rotterdam is 503 km long and the average running time between these two locations is around 7 hours and a half. It is assumed that three freight trains per day depart from Hamburg with destination Rotterdam and that each train transports 8 containers (i.e. 24 containers per day). The cost to deliver the goods by means of the freight train is around €1,235 per container. If the same amount and type of goods are transported via atruck, the travel time would just increase for half an hour with significant decrease in price to almost €505 per container. However, the frequency is just based on demand. If goods aretransportedbymeansofaship,thecostpercontainerisaround€1,160percontainerforatravel

G A 8 2 6 3 4 7 P a g e 43 | 121
time of 16 hours. The frequency is just one freight trip per day. Similarly, the frequency of goods transportation for air cargo is once a day, but instead the cost is increased to €1,506 percontainer (Table 11).
Figure 23 – Case study 5, Hamburg-Rotterdam (Freight)
Table 11 – Options for a routine trip from Hamburg to Rotterdam
This case study is addressed to understand stated delivery choices of the interviewed sample concerning the current situation and the future scenarios of a more frequent and flexible rail freight delivery service available (56 containers per day rather than 24) for an increased marginal delivery cost, as shown in Table 12.
Table 12 – Train frequency and cost before and after VC (case study 5)
3.2. MOVINGRAIL Survey for Virtual Coupling (VC) Interviews to collect expert opinions and stated travel preferences under Virtual Coupling have been performed by means of a survey held during an interactive workshop specifically organised by MOVINGRAIL. In particular, a European workshop on train-centric signalling systems has been arranged and given on the 23rd of May 2019, at the Imperial Hotel, (61-66 Russel Square), London (UK) with the title: “How will the future of railways look like: development and evolutions of moving-block train operations”. The workshop was attended by a total of 68

G A 8 2 6 3 4 7 P a g e 44 | 121
interviewees including 42 representatives of the European railway industry and 26 respondents belonging to other socio-professional categories. The survey was built electronically (online) with 66 questions based on a cascading sequence from previous answers. The structure of the survey is based on two main sections:
General Section, posing questions addressed to collect information of the general public;
Technical Section, with questions addressed to SMEs having expertise and/or advanced knowledge of the railways.
The General Section contains the following parts: Part 1. Basic information: questions related to age, gender, socio-professional category
and whether the respondent has expert/advanced knowledge about railways (including the type of railway-related institution/company).
Part 2. Travel choice on daily routine trips: questions related to residential city/town, Origin and Destination (O-D) and modal choice for daily routine trips of the interviewees. The requested information for those trips is listed in the following:
- covered distance - travel time - monthly cost - travel activities (i.e. work/study, leisure, sport or other purposes) - mean(s) of transport (i.e. walk, bike, bus, regional bus (coach), train, car or plane),
as well as the reasons for traveling with that mode of transport. If respondents do not travel by train, they are asked whether train services exist
between their origin and destination. In case the respondents stated that they travel by train or that there is an existing railway connection between their O-D, an additional set of questions are formulated addressed to collect further information on: the current frequency of train services departing from their origin possible shifting from current mode of transport to railways (for those who do
not use trains currently) for future scenarios where Virtual Coupling would provide more frequent train services.
potential will to pay more for shifting to or using a more frequent and flexible train service in a future scenario where Virtual Coupling is implemented.
If respondents do not use railways on their routine O-D trips, they are asked whether they ever use railways, how frequently and for which type of activity.
Part 3. Travel choice on market segment case studies: questions addressed to collect modal choice of the interviewees in future scenarios where it is possible to choose for an improved railway service thanks to the deployment of Virtual Coupling. Key performance for the different travel alternatives (i.e. travel time, frequency and cost) are provided to the interviewees so that they can provide a reliable answer on their travel choice.
The Technical Section instead includes the following three parts: Part 1. Technological and operational scenarios for Virtual Coupling: collecting expert
opinions about potential technologies and modes of operations that would be needed for running virtually coupled trains for each of the market segments. Questions in this part aim at investigating for instance the need for ATO on-board, or the frequency of the V2V communication architecture. From the operational perspective it is investigated
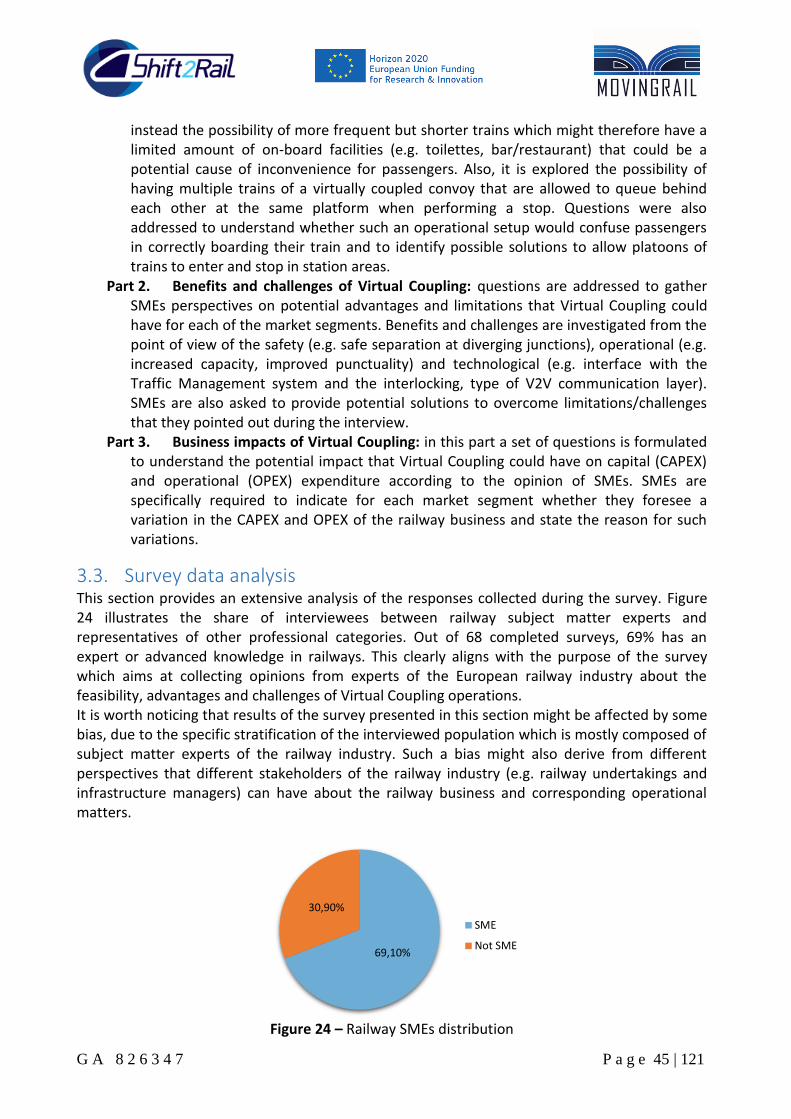
G A 8 2 6 3 4 7 P a g e 45 | 121
instead the possibility of more frequent but shorter trains which might therefore have a limited amount of on-board facilities (e.g. toilettes, bar/restaurant) that could be a potential cause of inconvenience for passengers. Also, it is explored the possibility of having multiple trains of a virtually coupled convoy that are allowed to queue behind each other at the same platform when performing a stop. Questions were also addressed to understand whether such an operational setup would confuse passengers in correctly boarding their train and to identify possible solutions to allow platoons of trains to enter and stop in station areas.
Part 2. Benefits and challenges of Virtual Coupling: questions are addressed to gather SMEs perspectives on potential advantages and limitations that Virtual Coupling could have for each of the market segments. Benefits and challenges are investigated from the point of view of the safety (e.g. safe separation at diverging junctions), operational (e.g. increased capacity, improved punctuality) and technological (e.g. interface with the Traffic Management system and the interlocking, type of V2V communication layer). SMEs are also asked to provide potential solutions to overcome limitations/challenges that they pointed out during the interview.
Part 3. Business impacts of Virtual Coupling: in this part a set of questions is formulated to understand the potential impact that Virtual Coupling could have on capital (CAPEX) and operational (OPEX) expenditure according to the opinion of SMEs. SMEs are specifically required to indicate for each market segment whether they foresee a variation in the CAPEX and OPEX of the railway business and state the reason for such variations.
3.3. Survey data analysis This section provides an extensive analysis of the responses collected during the survey. Figure 24 illustrates the share of interviewees between railway subject matter experts and representatives of other professional categories. Out of 68 completed surveys, 69% has an expert or advanced knowledge in railways. This clearly aligns with the purpose of the survey which aims at collecting opinions from experts of the European railway industry about the feasibility, advantages and challenges of Virtual Coupling operations. It is worth noticing that results of the survey presented in this section might be affected by some bias, due to the specific stratification of the interviewed population which is mostly composed of subject matter experts of the railway industry. Such a bias might also derive from different perspectives that different stakeholders of the railway industry (e.g. railway undertakings and infrastructure managers) can have about the railway business and corresponding operational matters.
Figure 24 – Railway SMEs distribution
69,10%
30,90%
SME
Not SME

G A 8 2 6 3 4 7 P a g e 46 | 121
3.3.1. General Section: response analysis
3.3.1.1. Part 1 – Basic information Almost half of the respondents (51.45%) aged between 22 and 35 years old and quarter were above 50 years old, followed by around 21% between 36 and 49 years old (Figure 25).
Figure 25 – Age distribution
85% were males and 15% females (Figure 26).
Figure 26 – Gender distribution
Out of 68 respondents, 45 were employers or employees, 14 students, 7 teachers or professors and 3 freelancers. The other respondent belongs to all the mentioned socio-professional categories (Figure 27).
1,50% 1,50%
51,45%
20,58%
24,98% < 18
18-21
22-35
36-49
50+
85,30%
14,70%
Male
Female

G A 8 2 6 3 4 7 P a g e 47 | 121
Figure 27 – Socio-professional category distribution
The 47 respondents (69%) with railway advanced knowledge/expertise belong to different companies and/or institutions listed in Figure 28. The majority (38.30%) belong to university/research institutes followed by 31.90% for signalling or manufacturing companies and 19.10% for infrastructure managers. The remaining participants are representatives of Train Operating Company (TOC), and governmental or European railway agency/association (Figure 28). Five respondents work for railway, engineering or safety consultancies, whereas other two belong to transport engineering companies and to the Institution of Railway Signal Engineers.
Figure 28 – Railway-related company/institution
3.3.1.2. Part 2 – Travel choice on daily routine trips This survey addresses EU residents where almost half (48.53%) live in the Netherlands and 36.76% in the United Kingdom (Figure 29). Other European countries include Germany (2.94%), Spain (2.94%), Italy (2.94%), Denmark (2.94%) and Belgium (1.47%). Some of the respondents (1.47%) come instead from outside Europe.
66,20%
20,60%
10,30% 4,40%
1,50%
0%
10%
20%
30%
40%
50%
60%
70%
80%
90%
100%
Employer/Employee Student/PhD Teacher/Professor Freelancer Other (Specify)
38,30%
19,10%
2,10%
31,90%
2,10%
14,90%
0%
10%
20%
30%
40%
50%
60%
70%
80%
90%
100%
University /Research Institute
InfrastructureManager
Train OperatingCompany (Railway
Undertaking)
Signalling /Manufacturing
company
Governmental / EURailway Agency /
Association
Other(Specify)

G A 8 2 6 3 4 7 P a g e 48 | 121
Figure 29 – Country distribution
Almost half of the respondents (47%) routinely cover an O-D distance of less than 20 km, followed by 31% covering distances between 30 and 100 km. Only 2% travel daily over distances beyond 900 km (Figure 30).
Figure 30 – Travelled distance for O-D
The travel time on one-way routine trips is almost equally split between 15 and 30 minutes (28%), and between 30 minutes and 1 hour (29%). A similar distribution is found for travel times less than 15 minutes (19%), and between 1 and 2 hours (18%). Only 6% travel routinely for more than 2 hours (Figure 31).
48,53%
36,76%
13,24%
1,47%
Netherlands
United Kingdom
Other EU countries
Other countries
47,05%
10,29%
30,87%
7,39%
2,90% 1,50%
≤20km
Between 20 and 30 km
Between 30 and 100 km
Between 100 and 200 km
Between 200 and 300 km
> 900 km

G A 8 2 6 3 4 7 P a g e 49 | 121
Figure 31 – Travel time for O-D
Overonehalf (54.35%)oftherespondentsspend lessthan€50ontheirO-D routine trips, and 16.18% spend either €101 to €200 or more than €200 per month. The rest (13.28%) spendbetween€51and€100permonth(Figure 32).
Figure 32 – Monthly expenses for O-D
It is quite obvious that 97.10% of respondents travel routinely for work or study purposes. A total of 19.10% travel for leisure activities whereas 8.80% practice sports regularly (Figure 33). Other responses (2.90%) included buying groceries or visiting family and friends.
19,12%
27,93% 29,43%
17,62%
5,91% ≤15minutes
Between 15 and 30 minutes
Between 30 minutes and 1 hour
Between 1 and 2 hours
> 2 hours
54,35%
7,39% 5,89%
16,18%
16,18% ≤€50
€51 – €70
€71 – €100
€101 – €200
> €200

G A 8 2 6 3 4 7 P a g e 50 | 121
Figure 33 – Daily activities
The most used transport modes used for daily routine trips (Figure 34) are almost equally split between the train (45.60%) and the bike (44.12%), followed by 39.70% for respondents who travel by car. One quarter (25%) prefer walking whereas 14.70% use the bus. A very small percentage (1.47%) travel by motorcycle.
Figure 34 - Regularly used means of transport
In Figure 35, it is possible to see that among the respondents travelling by train, 71% travel by Intercity (IC) trains, followed by 38.70% using regional trains and 25.80% taking metro (urban trains). Around 9.70% use light rail while 6.50% uses trams. High speed rail is used by only 6.50% of our respondents.
97,10%
19,10%
8,80% 2,90%
0%
10%
20%
30%
40%
50%
60%
70%
80%
90%
100%
Work/Study Leisure Sport Other (Specify)
25,00%
44,12%
14,70%
45,60% 39,70%
1,47%
0%
10%
20%
30%
40%
50%
60%
70%
80%
90%
100%
Walking Bike Bus Train Car Other(Specify)

G A 8 2 6 3 4 7 P a g e 51 | 121
Figure 35 – Regularly used types of trains (MSs)
The main reason for respondents to travel by train is to save time (e.g. working in the train), followed by 38.70% for the lack of parking spaces at destination. Equally, 32.30% state that traveling by train is more comfortable than a car whereas other responses provide different reasons listed as follows:
environmental choice
living close to station
unpredictable journey time for driving in big cities (e.g. London)
uncomfortable bicycle route
train cheaper than owning a car
limited car access in some parts of the city
no viable alternative due to road traffic congestion
company pays the public transport fees.
Some of the respondents (16.10%) considered that traveling by train is safer than car. Another 16.10% stated that they cannot afford buying a car. The rest (9.70% plus 6.50%) prefer trains because they have the freedom of standing/walking during a travel and/or do not hold a driving licence (Figure 36).
Figure 36 – Reasons for traveling by train
Out of 68 respondents, only 5 respondents travel by bus. As reported in Figure 37, the common
6,50%
71,00%
38,70%
25,80%
9,70% 6,50%
0%
10%
20%
30%
40%
50%
60%
70%
80%
90%
100%
High Speed Intercity(Conventional)
Regional/Local Metro Light Rail Tram
32,30%
16,10%
67,70%
16,10% 9,70% 6,50%
38,70% 32,30%
0%
10%
20%
30%
40%
50%
60%
70%
80%
90%
100%
Morecomfortable than
a car
Safer than a car Time saving (e.g.working in the
train)
Can’taffordcostof a car
Freedom ofstanding/walking
during travel
Don’tholdadriving license
No parking atdestination
Other (Specify)

G A 8 2 6 3 4 7 P a g e 52 | 121
reason for using buses is the inexistence of railway connection between origin and destination (66.70%). Reasons are equally split (33.30%) for living close to destination, having a wider choice of departure date and time, or other reasons which state that traveling by bus is only for a part of the journey and is based on occasional convenience.
Figure 37 – Reasons for traveling by bus
Figure 38 shows that respondents who travel by car report that this is faster than traveling by any other public transport mode (73.70%). Around 63.20% mention that there is no railway connection between their origin and destination, whereas 52.60% state their preference based on a wider choice of departure date and time. Reasons are equally split (36.80%) for less intermodal transfers and/or more comfortability, as well as for more privacy (21.10%) and/or wider choice of route (21.10%). Only 10.50% consider the ease of handling luggage as a reason for traveling by car, whereas another 10.50% state other reasons (e.g. transporting children to school/day care).
Figure 38 – Reasons for traveling by car
As shown in Figure 40, traveling by bike is quite common for respondents who live close to their destination (81.30%). About 56.30% consider that traveling by bike is faster than public transport. Half of the respondents (50.00%) travel by bike because they care for health, followed by 37.50% for a wider choice of departure date and time. One quarter (25%) consider that
33,30% 33,30%
66,70%
33,30%
0%
10%
20%
30%
40%
50%
60%
70%
80%
90%
100%
Live close to destination Wider choice of departuredate and time
There is no railwayconnection between my
origin and destination
Other (Specify)
73,70%
21,10%
36,80% 26,30%
10,50%
36,80%
52,60%
21,10%
63,20%
10,50%
0%10%20%30%40%50%60%70%80%90%
100%
Faster thanpublic
transport
More privacy Lessintermodaltransfers
Live close todestination
Ease ofhandlingluggage
Morecomfortable
Wider choiceof departure
date andtime
Wider choiceof route
No railwayconnection
for O-D
Other(Specify)

G A 8 2 6 3 4 7 P a g e 53 | 121
traveling by bike is more comfortable than other means of transport whereas 18.80% mention that there is no railway connection between their origin and destination. Equally split reasons (12.50%) were shared for a wider choice of route, or other reasons related to environmental consideration or personal preference (Figure 39).
Figure 39 – Reasons for traveling by bike
One-quarter (25%) of respondents walk partly in their routine O-Dtrips,where75%state‘other’reasons such as best mode of transport and environmental friendliness. Figure 40 illustrates that half of interviewees walk because they live close to destination. The rest were equally divided (25%) for three different reasons (i.e. less intermodal transfers, healthiness and absence of railway connection between origin and destination).
Figure 40 – Reasons for walking
Out of 37 respondents who stated that they do not routinely use railways, 32.40% do not travel by train although there is an existing train service running between their origin and destination (Figure 41).
81,30%
6,30%
56,30%
6,30%
25,00%
50,00%
37,50%
12,50% 18,80%
12,50%
0%
10%
20%
30%
40%
50%
60%
70%
80%
90%
100%
Live close todestination
More privacythan publictransport
Faster thanpublic
transport
Lessintermodaltransfers
Morecomfortable
Healthy Wider choiceof departure
date andtime
Wider choiceof route
No railwayconnection
for O-D
Other(Specify)
50,00%
25,00% 25,00% 25,00%
75,00%
0%
10%
20%
30%
40%
50%
60%
70%
80%
90%
100%
Live close todestination
Less intermodaltransfers
Healthy No railwayconnection for
O-D
Other (Specify)

G A 8 2 6 3 4 7 P a g e 54 | 121
Figure 41 – Running trains for O-D
As reported in Figure 42, 34.90% can find a train departing from their origin every 15 minutes, followed by 16.30% for every 30 minutes, and 14% for either every 10 minutes or for every 1 hour or more. Train services running every 20 minutes or 3 minutes have the same percentage of 4.70%. Only 2.30% have trains running every less than 3 minutes.
Figure 42 – Train frequency from origin
Out of 68 interviewees, 43 have a railway connection between their origin and destination. Among those 31 already use trains whereas 12 travel by other means of transport. To those 43 interviewees it has been asked to provide the frequency of the train service along their O-D and whether they would be willing to pay more for using a more frequent service enabled by Virtual Coupling. Responses to such questions are reported in Figure 43, illustrating answers of the interviewees already using the railways, based on the current frequency (e.g. a train every hour, every 30 min, or every 5 min) of the train services connecting their O-D. Respondents having a poor train connection between their O-Dwithfrequenciesoflessthanonetrainperhour(≥1h)are mostly willing to pay more to use a more frequent train service. Such result shows the discomfort of respondents living on a poorly railway connected O-D pair which makes them prone to spend more in order to have a more frequent train service. For those interviewees who have instead a train connection departing every 30 min, the urgency of having an improved train connection is limited. The majority of these respondents seems indeed to be already comfortable with the current train service since they would be willing to use a more frequent train service only if they would not to pay more. The same behaviour is observed for those
32,40%
67,60%
Yes
No
14,00%
16,30%
4,70%
34,90%
14,00%
9,30%
4,70% 2,30%
Every≥1hour
Every 30 minutes
Every 20 minutes
Every 15 minutes
Every 10 minutes
Every 5 minutes
Every 3 minutes
Every < 3 minutes

G A 8 2 6 3 4 7 P a g e 55 | 121
respondents having a train connection with frequencies around 20 min. For those respondents already being served by a train connection with frequencies equal or higher than a train every 15 min (i.e. a train every 10 min, 5 min, 3 min or less than 3 min), it is clear that having an even more frequent service would not make a difference to them. Indeed, they would take advantage of an improved train service enabled by Virtual Coupling only if the ticket price remained the same. This shows that the higher frequencies allowed by Virtual Coupling would not be an urgencytosatisfycustomer’sneedswheneverexistingrailwayconnectionsalreadyoffer4trainsper hour, since this provides a sufficient set of travel alternatives to the passengers. However, those higher service frequencies would instead be needed to move more respondents on a given O-D pair, that makes it therefore ideal for very busy railway corridors.
Figure 43 – Will to use more frequent train service enabled by VC based on current train service
frequency betweenrespondents’O-D
Figure 44 reports the responses of those interviewees who have a railway connection between their O-D pair but use a different mode of transport for their routine trips. Responses show whether these interviewees would be willing to shift from their current mode to an improved railway mode based on the current frequencies of the train service between their origin and destination. It is interesting to observe that most of the respondents having a current train frequencyof lessthanonetrainperhour(≥1h)wouldbe willing to shift to a more frequent train service even for a higher ticket cost. This result shows that the reason why they use a transport mode different than railways is mainly due to a poor train connection which does not provide enough customer satisfaction on those O-D pairs. For O-D pairs being served by train connection with a frequency of one train every 30 min, it is clear that there is a part of the respondents (9%) who would be even willing to pay more to shift from their current mode to an improved train service. This means that the current train service is not satisfactory to these respondents since it does not provide a sufficient set of travel alternatives to match type of activities and travel requests of these passengers. The other part of those interviewees (27%), which represents however the majority, answers that they are not interested in shifting to railways at all, no matter the service frequency and the cost. Such answer clearly shows that these interviewees have specific travel needs (e.g. having a door-to-door service, flexible route) that makes railways as a mode not satisfactory to them. For those respondents having an existing railway connection with frequencies equal or higher than a train every 20 min (i.e. every
0%
5%
10%
15%
20%
25%
30%
35%
40%
45%
≥1hr 30 min 20 min 15 min 10 min 5 min 3 min < 3 min
Willing to pay more Willing to use only if price is the same
Not willing to use independently from the price

G A 8 2 6 3 4 7 P a g e 56 | 121
20 min, every 15 min, every 10, 5, 3 or less than 3 min) it is clear that have travel requests for which railways does not represent a valid alternative. This conclusion is strongly supported by the fact that the totality of these respondents would not be willing to shift to an improved train service enabled by VC independently from their frequency and price. Results of such interview clearly illustrates that there is a part of passenger who would be willing to use railways and that are forced to use other modes because the available railway connection between their O-D pair, is either too poor (e.g. less than a train per hour) or does not match their travel needs (e.g. needing more than two departure options per hour). The implementation of Virtual Coupling could therefore attract that slice of respondents to become routinely railway passengers. However, a big share of respondents who do not use railways state that this is because such a transport mode does not match their travel requirements despite their frequency and cost. Main motivations provided by this portion of respondents are reported below, grouped by the train frequency of the existing railway connection along their O-D:
≥1hr:Thecarischeaperandmorecomfortable
30 min: The ticket price is already expensive, do not want to walk from/to the station, do
not want changes in travel time
20 min: Train has inconvenient door to door travel
15 min: Train service frequency already sufficient, but prefer healthier choices such as the
bike
10 min: Train frequency is already sufficient, but there are inconvenient intermodal
transfers to reach destination
5 min: Train frequency is sufficient, but the ticket is too expensive.
Figure 44 – Will to shift from current mode of transport to a more frequent train service enabled
byVCbasedoncurrenttrainservicefrequencybetweenrespondents’O-D
Among the 37 respondents (54.41%) who do not usually travel by train, 40.50% travel by train monthly. 32.40% use railways occasionally whereas 27% travel by train on a weekly-basis schedule (Figure 45).
0%
5%
10%
15%
20%
25%
30%
≥1hr 30 min 20 min 15 min 10 min 5 min 3 min < 3 min
Willing to pay more Willing to shift only if price is the same
Not willing to shift independently from the price

G A 8 2 6 3 4 7 P a g e 57 | 121
Figure 45 – Travel frequency by train (for respondents who do not use railways routinely)
The majority of respondents who do not routinely travel by train use railways for leisure (70.30%). More than one half (54.10%) of respondents use instead trains for business or study purposes, whereas 40.50% for visiting family or friends (Figure 46).
Figure 46 – Activities purpose by train (for respondents who do not use railways routinely)
3.3.1.3. Part 3 – Travel choice on market segment case studies This part of the survey illustrates stated travel preferences of the interviewees for the case studies (described in Section 3) formulated for each of the railway market segments. For each case study, the interviewees have been asked to make a choice about the transport mode currently available between the O-D pair proposed in each case study. Specifically, interviewees have chosen the first and the last modal option they would use to move along the proposed O-D pair, based on provided information about service frequency, cost and travel time of each mode. Successively, it has been investigated the attractiveness of a more frequent railway service enabled by Virtual Coupling and the will of pay more to use such an improved train connection. Such analysis gives an insight on the potential modal shift that Virtual Coupling could trigger for each segment of the railway market. Case study 1 – High speed railway corridor Rome-Bologna For the high-speed connection Roma-Bologna (Italy), survey results (Figure 47) show that 98.50% prefer traveling by train, whereas only 1.50% would prefer traveling by car. The airplane would be the last modal choice for 42.60% of the sample, followed by the bus and the car which would be the last choice for 38.20% and 19.10% of the respondents, respectively.
27,00%
40,50%
32,40% Weekly
Monthly
Occasionally
70,30%
40,50%
54,10%
Leisure
Visiting family/friends
Business/Study

G A 8 2 6 3 4 7 P a g e 58 | 121
Figure 47 – Travel mode choice repartition (case study 1)
Whenasking the interviewees about theirwillof paying€5.5 more for using a more frequent high-speed service enabled by Virtual Coupling, only 17.60% has provided a positive answer. The main reasons for such a choice refer to a better satisfaction of travel needs for specific target groups of passengers which looks for more convenient and more flexible travel alternatives with more choices of departure times and less waiting time at stations. Other respondents state instead that they are willing to pay more for the higher frequencies only if their trip is work related. The majority of the respondents (82.40%) do find the current high-speed frequency of 15 min already sufficient to satisfy their travel requests and therefore would not be willing to pay more for availing of an improved service. Some of them indeed states that paying extra on daily trips for a headway difference of 9 minutes is not worth it. Such an outcome is also confirmed by Figure 49 showing that the majority of the interviewees (96.40%) who are not willing to pay more for an improved service would be anyway willing to take advantage of an improved high-speed service enabled by VC only if the ticket price remained the same. The remaining 3.60% of the sample state that they would not be willing to use a more frequent high-speed service even if the ticket cost is the same since a high-speed connection with frequencies of a train every 15 min is already satisfactory to their needs.
Figure 48 – Share of interviewees willing to pay more for a more frequent high-speed service
enabled by VC
98,50%
0,00% 1,50% 0,00% 0,00%
38,20%
19,10%
42,60%
0%
20%
40%
60%
80%
100%
120%
A (train) B (bus) C (car) D (plane)
First choice Last choice
17,60%
82,40%
Yes (Specify the reason)
No (Specify the reason)

G A 8 2 6 3 4 7 P a g e 59 | 121
Figure 49 – Share of interviewees willing to use a more frequent high-speed enabled by VC for
the same ticket cost Case study 2 – Main Line railway corridor London Waterloo-Southampton For the main line corridor between London Waterloo and Southampton (UK) collected responses (Figure 50) show that travelling by train would be the first choice for 79.40% and the last choice instead for only 8.80% of the interviewees. The bus would be the first modal choice for 10.30% of the respondents and the last choice instead for 45.60% of the sample. The same shares are observed for the car. The main feeling about this result is that when the distances between origin and destination gets a bit below 300 Km, the train still seems to be the more preferred travelling option but the buses and cars start being a possible valid alternative for some respondents. When enquiring the interviewees about their will to pay £4.85 more for an improved railway connection enabled by VC (bringing current headways of 30 min down to 11 min), responses are almost equally split between positive and negative answers as reported in Figure 51.
Figure 50 – Travel mode choice repartition (case study 2)
A slightly higher tendency (52.90%) is observed towards respondents not willing to pay additional fees for more frequent trains. This is because most respondents considered the
96,40%
3,60%
Yes (Specify the reason)No (Specify the reason)
79,40%
10,30% 10,30% 8,80%
45,60% 45,60%
0%
10%
20%
30%
40%
50%
60%
70%
80%
90%
A (train) B (regional bus) C (car)
First choice Last choice

G A 8 2 6 3 4 7 P a g e 60 | 121
current ticket costs as already expensive and that current headways of 30 minutes are good enough to address their travel requirements. Some other respondent state that traveling by modes other than trains would be instead more convenient (e.g. the bus ticket price is 4 times cheaper than the train). Other interviewees have mentioned that they would like to find available seats over a long trip or have a shorter travel time rather than a higher train frequency. Some of the respondents claim that it is quite easy to plan their journey around a 30 min service frequency without disturbing their schedules. On the other hand, 47.10% of the interviewees would be willing to pay the proposed ticket price increase of £4.85 to have a more flexible main line service offering a wider choice of departure times. Other stated that the increased frequency versus the total travel time makes the service more attractive and that it would be worth paying the extra little money. These respondents envisage a waiting time of 30 minutes in between trains too long of a period, especially if the reason for travelling is work related.
Figure 51 – Share of interviewees willing to pay more for a more frequent main line service
enabled by VC Figure 52 reports instead the share of interviewees who do not agree on paying extra for more frequent trains but who would anyway appreciate an improved service if the train tickets costed the same. Out of 36 respondents, 83.30% manifest their will to avail of a more frequent main line service only for the same travel cost. For such respondents the current train frequencies are already able to address their travel needs and higher frequencies would be just an extra that they will take advantage of only if the price remains the same. On the other hand, 16.70% of the sample mentioned that even if the price would remain the same, they still would not use the more frequent train services. The main reasons for such a choice is that current main line train tickets are already too expensive to them and that their preferred option is the bus which is much cheaper in comparison. Other respondents instead mention that the proposed frequency increase would add no value to their travelling options.
47,10% 52,90%
Yes (Specify the reason)
No (Specify the reason)

G A 8 2 6 3 4 7 P a g e 61 | 121
Figure 52 – Share of interviewees willing to use a more frequent main line enabled by VC for the
same ticket cost Case study 3 – Regional railway corridor Leicester-Peterborough For the regional line between Leicester and Peterborough (UK), the train is identified as the first choice by 72.10% of the respondents and the last choice instead by 4.40%. The car is considered as the first option by 27.90% and the last modal choice by 26.50%. The last choice for traveling from Leicester to Peterborough is instead the regional bus (69.10%) mainly because of the very poor frequency of just two buses per day.
Figure 53 – Travel mode choice repartition (case study 3)
When investigating the will of interviewees to pay more for a more frequent regional service enabled by VC (bringing current headway of 1 h down to 22 min), the share of responses can be observed in Figure 54. Among the 68 respondents, 83.80% would be willing to pay the proposed ticket cost increase of £2.30, as they consider the increase very reasonable versus the risk of missing a train and waiting for 60 minutes to catch the next available train (saving ~40 minutes of time every day). Most of the respondents state that a headway decrease from 60 minutes to 22 minutes makes the trip more attractive for a travel time of about 1 hour. 16.20% of the respondents are not willing to pay the £2.30 additional fee as they consider that the travel time and cost for traveling by car would be similar to the train but not constrained by
83,30%
16,70%
Yes (Specify the reason)
No (Specify the reason)
72,10%
0,00%
27,90%
4,40%
69,10%
26,50%
0%
10%
20%
30%
40%
50%
60%
70%
80%
A (train) B (regional bus) C (car)
First choice Last choice

G A 8 2 6 3 4 7 P a g e 62 | 121
the headway of 22 minutes.
Figure 54 – Share of interviewees willing to pay more for a more frequent regional service
enabled by VC (case study 3) Interviewees who did not agree on paying more for using an improved train service enabled by VC have been asked whether they would use the improved service for the same ticket cost. Distribution of the responses has been reported in the pie diagram in Figure 55. It is clear that 72.70% of these sample would be taking advantage of the higher train frequencies only if do not need to pay more. This clearly shows that such share of respondents is already comfortable with the travelling options currently existing and that the higher train frequency would just be a plus for which they are not willing to pay, being not essential to them. On the other hand, 27.30% of respondents are not willing to use the railways no matter the cost and frequency since they consider that the travel time and cost for traveling by car are similar to the train and that their current preferred mode of transport does not have time constraints, contrary to a train schedule.
Figure 55 – Share of interviewees willing to use a more frequent regional service enabled by VC
for the same ticket cost (case study 3) Case study 4 – Urban railway corridor London Lancaster-London Liverpool St. For the urban corridor between London Lancaster and London Liverpool St. (UK) responses on modal choices of the interviewees are illustrated in Figure 56. For 75% of the respondents the most preferred mode of transport is the metro, followed by the bike (for 20.60%), the bus (for 2.90%) and the car (for only 1.50%). Almost half of the respondents (47.10%) consider walking as
83,80%
16,20%
Yes (Specify the reason)
No (Specify the reason)
72,70%
27,30%
Yes (Specify the reason)
No (Specify the reason)

G A 8 2 6 3 4 7 P a g e 63 | 121
their last choice, while 29.40% consider the car as their last modal preference. The rest of the respondents identify their last choice as the bus (10.30%) the metro (8.80%) and the bike (only 4.40%).
Figure 56 – Travel mode choice repartition (case study 4)
Referring to the share of responses illustrated in Figure 57, only one quarter (25%) of the respondents are willing to pay a proposed ticket cost increase of £0.30 for an improved metro service with headways of 45 seconds instead of the current 2 min headways. The main reason stated by these respondents is that a shorter headway would provide less overcrowded trains and a higher chance of finding available seats. The remaining three-quarters (75%) of the interviewees stated instead that they would not be willing to pay even £0.30 more since a headway of 2 min is already sufficient ot satisfy their travel needs. Some others say that they would still travel by bike for health reasons and that the proposed increase in train frequency would not make a difference to them. Some state instead that in their opinion a headway of 45 seconds between trains does not provide enough time for passengers to board/alight the train at crowded stations, while others mentioned that having more frequent trains in this case does not add any value.
Figure 57 – Share of interviewees willing to pay more for a more frequent metro service enabled
by VC (case study 4)
75,00%
2,90% 1,50%
20,60%
0,00%
8,80% 10,30%
29,40%
4,40%
47,10%
0%
10%
20%
30%
40%
50%
60%
70%
80%
A (metro) B (bus) C (car) D (bike) E (walk)
First choice Last choice
25,00%
75,00%
Yes (Specify the reason)No (Specify the reason)
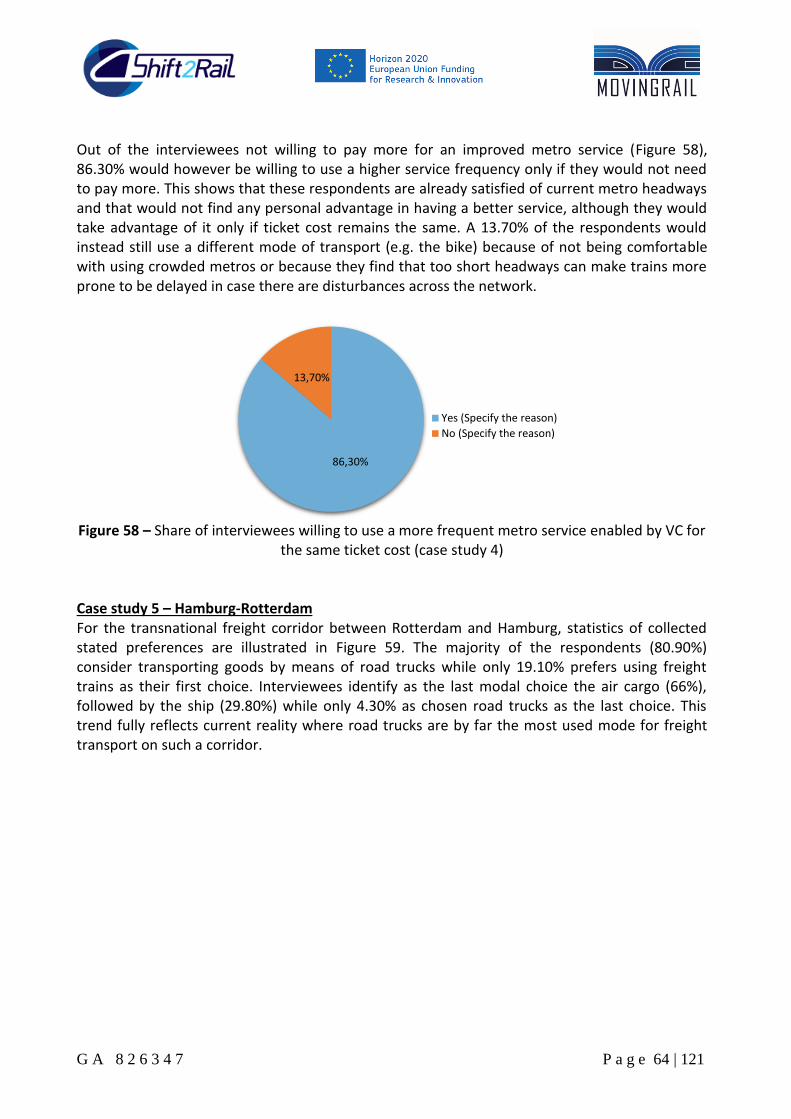
G A 8 2 6 3 4 7 P a g e 64 | 121
Out of the interviewees not willing to pay more for an improved metro service (Figure 58), 86.30% would however be willing to use a higher service frequency only if they would not need to pay more. This shows that these respondents are already satisfied of current metro headways and that would not find any personal advantage in having a better service, although they would take advantage of it only if ticket cost remains the same. A 13.70% of the respondents would instead still use a different mode of transport (e.g. the bike) because of not being comfortable with using crowded metros or because they find that too short headways can make trains more prone to be delayed in case there are disturbances across the network.
Figure 58 – Share of interviewees willing to use a more frequent metro service enabled by VC for
the same ticket cost (case study 4) Case study 5 – Hamburg-Rotterdam For the transnational freight corridor between Rotterdam and Hamburg, statistics of collected stated preferences are illustrated in Figure 59. The majority of the respondents (80.90%) consider transporting goods by means of road trucks while only 19.10% prefers using freight trains as their first choice. Interviewees identify as the last modal choice the air cargo (66%), followed by the ship (29.80%) while only 4.30% as chosen road trucks as the last choice. This trend fully reflects current reality where road trucks are by far the most used mode for freight transport on such a corridor.
86,30%
13,70%
Yes (Specify the reason)
No (Specify the reason)

G A 8 2 6 3 4 7 P a g e 65 | 121
Figure 59 – Travel mode choice repartition (case study 5)
For this case study the survey aims at understanding whether interviewees would be willing to use a more frequent freight train service enabled by VC, which would allow delivering 56 containers per day rather than the current 24. Of course, delivering more containers entails a higher delivery cost per unit which inevitably reduces the marginal profit per container. However, when delivering more containers, the global profit might be higher, although the reduced marginal profit per container unit. As reported in Figure 60, a total of 61.70% of the interviewees are willing to use a more frequent virtually coupled freight train service to deliver more containers at an increased marginal cost, leading anyway to possibly larger global profits. Such a share of interviewees state that as long as the same profit is maintained, more frequent freight trains would be better than having trucks since train are usually more reliable than road vehicles. On the other hand, 38.30% of the respondents would keep on relying on road transport (truck) since this is remarkably cheaper and would prefer transporting goods by truck even in the case of more frequent freight trains.
Figure 60 – Willingness to use a more frequent freight train service enabled by VC to deliver
more containers at a higher marginal cost (case study 5) In this case study it has also been investigated the possibility of having single freight wagons (each transporting one container) completely automated and able to virtually couple in a train convoy at junctions or diverge at junctions to reach required destinations. Results of the
19,10%
80,90%
0,00% 0,00% 0,00% 4,30%
29,80%
66,00%
0%
10%
20%
30%
40%
50%
60%
70%
80%
90%
A (freight train) B (Truck) C (ship) D (air cargo)
First choice Last choice
61,70%
38,30%
Yes (Specify the reason)
No (Specify the reason)

G A 8 2 6 3 4 7 P a g e 66 | 121
investigation are illustrated in Figure 61. A big share of the respondents (80.90%) have positively considered such a scenario. In their opinion automated wagons would indeed make rail freight transport more efficient, faster and less expensive because there would be no operating costs for drivers. Most of the respondents stated that automated freight trains would be more flexible and reliable than current train services. Another 19.10% of the interviewees would not instead be willing to shift to fully automated virtually coupled freight wagons since they mainly identify safety concerns in automation such as security threats from terrorism, vandalism or theft, stating that automation would probably not make freight trains cheaper than trucks. Some other of this share of respondents assert that their exclusive interest is on cost, time and frequency of delivery, no matter the way goods are transported. So they could potentially consider automated freight trains only if the profit would at least remain the same.
Figure 61 – Willingness to adopt fully automated freight wagons
3.3.1.4. Modal choice explanation Based on the previous case studies, almost half of the respondents (47.10%) consider that the travel time is the most important factor for choosing the transport mode. A 16.20% of the interviewees consider the mode of travel itself as the most import factor, while 13.20% based their decision on the travel cost. Only 8.80% consider the frequency of services as the most essential choice parameter. Other responses (14.70%) include instead environmental reasons or a combination of different factors mainly involving travel time and cost (Figure 62).
Figure 62 – Most important factor for transport mode choice
80,90%
19,10%
Yes
No
16,20%
13,20%
47,10%
8,80%
14,70%
Mode of travel
Travel cost
Travel time
Frequency of service
Other (Specify)

G A 8 2 6 3 4 7 P a g e 67 | 121
3.3.2. Technical Section
3.3.2.1. Part 1 – Technological and operational scenarios for Virtual Coupling Under Virtual Coupling having more frequent trains might also lead to have shorter train compositions which can indeed virtually couple to each other in one convoy when converging at merging junctions. Shorter train compositions have the advantage to provide a more flexible scheduling of rolling stock available and have a wider coverage of the Origin-Destination pairs. However, shorter trains might also entail some discomfort to passengers since only a limited number of facilities or services (e.g. toilettes, bar/restaurant) can be available. Although such a limited on-board service availability could be tolerable over short distance trips, it might not be acceptable instead over the medium and/or the long distance. For this reason, interviewed SMEs have been asked to provide their opinion about the scenario of having shorter trains for the different market segments. Furthermore, for each segment it has been requested to list down desired/necessary services to be found on board of shorter train compositions. Interview results illustrated in Figure 63 show that in the case of shorter high-speed trains it is preferable to keep a certain number of toilettes per seat (72.34% of respondents), having silent wagons for working and/or relaxing (65.96%) as well as a bar/restaurant service (70.21%). A good part of the interviewees also selected preference for having a train having both first- and second-class coaches (31.91%), although this does not result to be a priority for such a kind of train service. Only a minor share of respondents has instead indicated a preference for long high-speed trains (19.15%) or for having separated trains for the first and the second class (23.40%). For main line trains instead the majority of the preferences has been principally expressed for having a certain number of toilettes per seat (74.47%), followed by the need of having silent wagons for working/relaxing (61.70%) and a bar/restaurant service (55.32%). The need of having mixed trains with both first- and second-class cars is not a main priority (31.91%) although it resulted to be more important than having long main line trains (25.53%) or shorter trains separated for the first and the second class (25.53%). In case of shorter regional trains, the main priority has been again indicated to keep a certain number of toilettes per seat (63.83%), followed by the need of silent wagons for working/relaxing (51.06%). A minor preference has also been expressed for having both first- and second-class wagons (27.66%) while instead the presence of a bar/restaurant has not been considered as necessary for this type of trains (17.02%), neither the need for long regional trains (10.64%) or shorter trains separated for the first and the second class (10.64%). For urban/suburban trains instead, the main preferred feature for shorter trains is to have silent cars (36.17%). Although not a priority, the presence of cars for both first- and second-class (21.28%) and the need for long trains offering more seats (20%) are also considered relevant to the urban/suburban segment. The need for a certain number of toilettes per seat is instead not considered essential (17.02%), however more important than having bar/restaurant services (4.26%) or separated shorter trains for the first and the second class (4.26%). Regarding the freight market segment, the only characteristic considered as essential is to have long trains able to carry as much freight as possible.

G A 8 2 6 3 4 7 P a g e 68 | 121
Figure 63 – Desired facilities for each MS if VC is introduced
Interviewees were also given the freedom of indicating features that in their opinion would be the most relevant to each market segment. As represented in Figure 64, the main priority for the high-speed segment is to have enough seats available to prevent on-board overcrowding on a long-distance ride, followed by a minority of respondents who would like to have extra facilities such as movie-theatre wagons. For the main line, the regional and the urban/suburban segments, a sufficient number of seats to prevent overcrowding is indicated to be the most essential characteristic for trains. More accurate on-board train running information is also seen as a very useful feature to support passengers during their journeys, although not a priority for these market segments. For the freight market segment, a cheaper cost of freight delivery has been instead found to be the most important aspect that trains shall have in the future. Possibly the use of automation and the use of single automated freight wagons able to couple/decouple on the fly, might be the answer to such a need given that costs for train drivers and for coupling yard handling would be minimised.
0%
10%
20%
30%
40%
50%
60%
70%
80%
90%
100%
High Speed Main Line Regional Urban/Suburban Freight
Longer trains Bar/restaurant
Specific number of toilets Silent wagons
Separated trains for first and second classes Mixed first and second class wagons
0,00%
20,00%
40,00%
60,00%
80,00%Longer trains
Bar/restaurant
Specific number oftoilets
Silent wagons
Separated trains for firstand second classes
Mixed first and secondclass wagons
High Speed Main Line Regional Urban/Suburban Freight
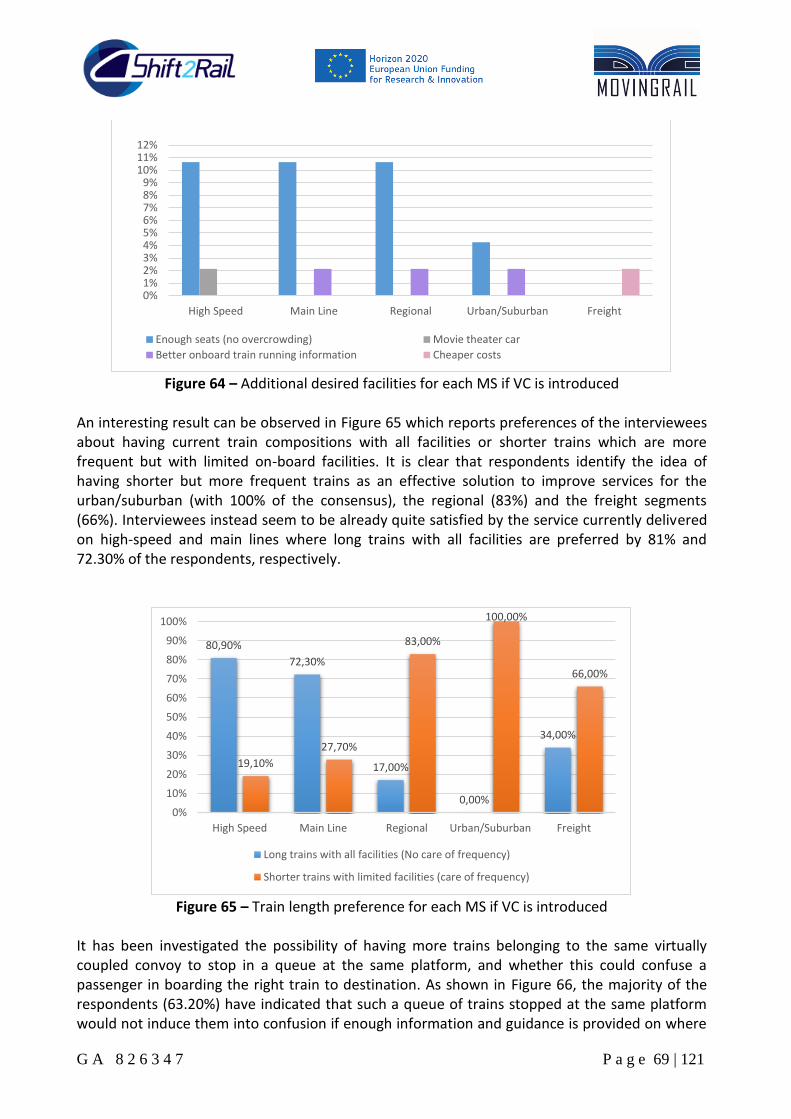
G A 8 2 6 3 4 7 P a g e 69 | 121
Figure 64 – Additional desired facilities for each MS if VC is introduced
An interesting result can be observed in Figure 65 which reports preferences of the interviewees about having current train compositions with all facilities or shorter trains which are more frequent but with limited on-board facilities. It is clear that respondents identify the idea of having shorter but more frequent trains as an effective solution to improve services for the urban/suburban (with 100% of the consensus), the regional (83%) and the freight segments (66%). Interviewees instead seem to be already quite satisfied by the service currently delivered on high-speed and main lines where long trains with all facilities are preferred by 81% and 72.30% of the respondents, respectively.
Figure 65 – Train length preference for each MS if VC is introduced
It has been investigated the possibility of having more trains belonging to the same virtually coupled convoy to stop in a queue at the same platform, and whether this could confuse a passenger in boarding the right train to destination. As shown in Figure 66, the majority of the respondents (63.20%) have indicated that such a queue of trains stopped at the same platform would not induce them into confusion if enough information and guidance is provided on where
0%1%2%3%4%5%6%7%8%9%
10%11%12%
High Speed Main Line Regional Urban/Suburban Freight
Enough seats (no overcrowding) Movie theater car
Better onboard train running information Cheaper costs
80,90%
72,30%
17,00%
0,00%
34,00%
19,10%
27,70%
83,00%
100,00%
66,00%
0%
10%
20%
30%
40%
50%
60%
70%
80%
90%
100%
High Speed Main Line Regional Urban/Suburban Freight
Long trains with all facilities (No care of frequency)
Shorter trains with limited facilities (care of frequency)

G A 8 2 6 3 4 7 P a g e 70 | 121
their train is located. Only 36.80% have indicated instead that this would create them some problems in boarding the correct train. However, several solutions have been suggested to allow implementing such a VC operational scenario at platforms so to mitigate possible passenger discomforts. Proposed solutions are reported in Figure 67 together with their preferences. The most part of the responses (40%) suggest separating the platform into sections delimited by physical barriers and platform doors opening only where one of the queuing trains is boarding. Another solution indicated (by 32% of the interviewees) would be having a separation of the platform into sections delimited by boards. Only 20% of the respondents would like to separate platforms into sections delimited by physical barriers such as walls or gates. Other proposed solutions include good and clear travel information support by using specific colours or audible indication to inform passengers about the destination of each train. Also, the installation of lightning arrows (led) indicating the direction of each train. The destination of each train can be displayed on the train itself via digital boards that already exist on many trains.
Figure 66 – Share of respondents favourable to have trains heading to different directions which
can stop in queue at the same platforms
Figure 67 – Suggested solution for boarding the right train
36,80%
63,20%
Yes
No
32,00%
20,00%
40,00%
8,00%
0%
10%
20%
30%
40%
50%
60%
70%
80%
90%
100%
Boards Physical barriers (such aswalls or gates)
Physical barriers andplatform doors opening only
where one of the queuingtrains is boarding
Other (Specify)
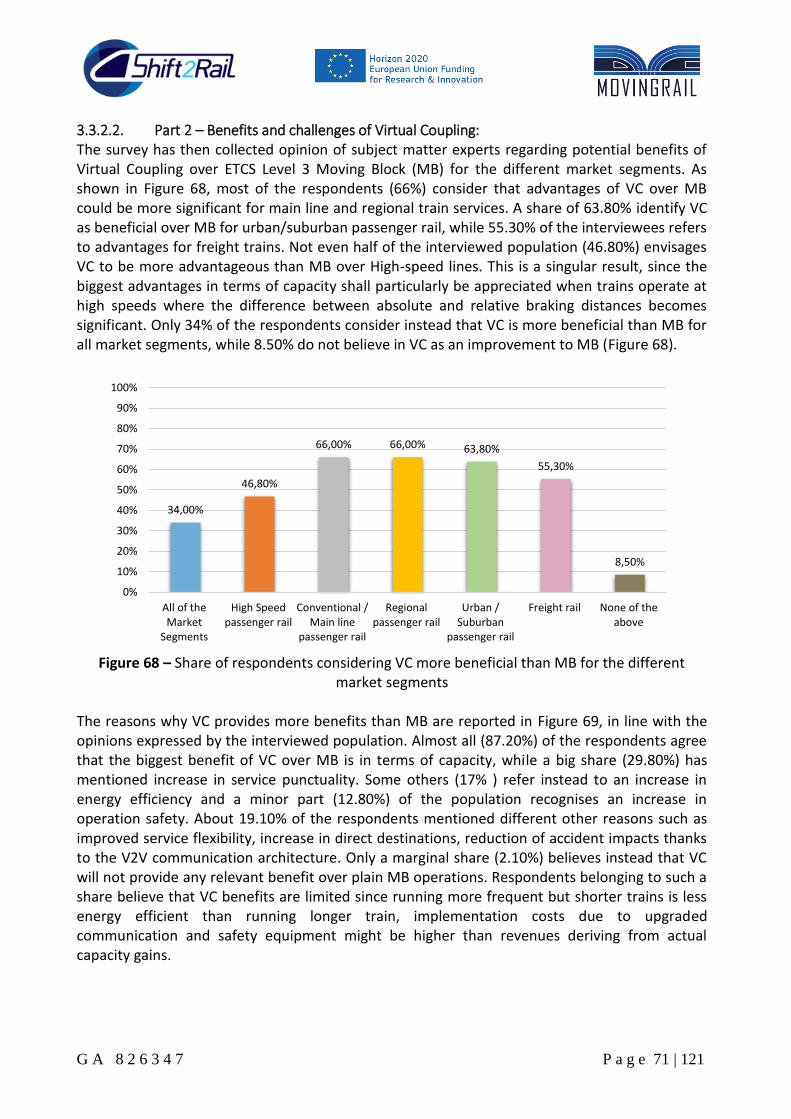
G A 8 2 6 3 4 7 P a g e 71 | 121
3.3.2.2. Part 2 – Benefits and challenges of Virtual Coupling: The survey has then collected opinion of subject matter experts regarding potential benefits of Virtual Coupling over ETCS Level 3 Moving Block (MB) for the different market segments. As shown in Figure 68, most of the respondents (66%) consider that advantages of VC over MB could be more significant for main line and regional train services. A share of 63.80% identify VC as beneficial over MB for urban/suburban passenger rail, while 55.30% of the interviewees refers to advantages for freight trains. Not even half of the interviewed population (46.80%) envisages VC to be more advantageous than MB over High-speed lines. This is a singular result, since the biggest advantages in terms of capacity shall particularly be appreciated when trains operate at high speeds where the difference between absolute and relative braking distances becomes significant. Only 34% of the respondents consider instead that VC is more beneficial than MB for all market segments, while 8.50% do not believe in VC as an improvement to MB (Figure 68).
Figure 68 – Share of respondents considering VC more beneficial than MB for the different
market segments The reasons why VC provides more benefits than MB are reported in Figure 69, in line with the opinions expressed by the interviewed population. Almost all (87.20%) of the respondents agree that the biggest benefit of VC over MB is in terms of capacity, while a big share (29.80%) has mentioned increase in service punctuality. Some others (17% ) refer instead to an increase in energy efficiency and a minor part (12.80%) of the population recognises an increase in operation safety. About 19.10% of the respondents mentioned different other reasons such as improved service flexibility, increase in direct destinations, reduction of accident impacts thanks to the V2V communication architecture. Only a marginal share (2.10%) believes instead that VC will not provide any relevant benefit over plain MB operations. Respondents belonging to such a share believe that VC benefits are limited since running more frequent but shorter trains is less energy efficient than running longer train, implementation costs due to upgraded communication and safety equipment might be higher than revenues deriving from actual capacity gains.
34,00%
46,80%
66,00% 66,00% 63,80%
55,30%
8,50%
0%
10%
20%
30%
40%
50%
60%
70%
80%
90%
100%
All of theMarket
Segments
High Speedpassenger rail
Conventional /Main line
passenger rail
Regionalpassenger rail
Urban /Suburban
passenger rail
Freight rail None of theabove

G A 8 2 6 3 4 7 P a g e 72 | 121
Figure 69 – Reasons for the benefits of VC over MB
Part of the technical section of the survey is dedicated to understanding challenges that SMEs identify to the implementation of VC from the technical, operational and technological perspectives. Figure 70 illustrates the distribution of opinions expressed for the different market segments. As can be seen the priority of the challenges to be faced for VC are considered to be more or less the same for all the market segments. Most of the interviewees find the main challenges to be faced relate to incompatibilities with current infrastructure layout and interlocking systems as well as to the need of updating/modifying current railway engineering rules, policies and regulations. Safety at merging/diverging junction is also considered as one of the main challenges to VC immediately followed by the deployment of a reliable V2V communication architecture. The interface with the ATO is instead not felt as a main problem to Virtual Coupling, mostly because developments in that direction have been already started by the railway industry. For the sake of completeness, other challenges reported by interviewees are provided as follows:
Development of approved technology by suppliers.
Political and social challenges (e.g. acceptance by the general public, legislative barriers, pushback from railway employees).
Safety validation to current required levels SIL3/SIL4.
Stability issues due to excessively short ATO reaction times required to safely control trains when separated by a very short distance.
Handling heterogeneity of rolling stock characteristics when trains move in a convoy.
Building longer station platforms to potentially accommodate queues of trains stopping all together.
87,20%
12,80%
29,80%
17,00%
2,10%
19,10%
0%
10%
20%
30%
40%
50%
60%
70%
80%
90%
100%
Increasecapacity
Increase safety Increasepunctuality
Increase energyefficiency
Idon’tbelievethat VC can provide any
relevant benefit
Other (Specify)

G A 8 2 6 3 4 7 P a g e 73 | 121
Figure 70 – Main challenges for the implementation of VC for each MS
Solutions suggested by the interviewees to overcome indicated challenges are mainly the following: a) Need of migrating towards a digital railway architecture through upgrade of interlocking and
traffic management technologies and the adoption of advanced semantic-based big data architectures
b) Necessity of developing real business cases through research and testing, c) Cooperating within the entire European railway industry to update the interlocking, the train
control equipment and adapt railway policy/regulations.
3.3.2.3. Part 3 – Business impacts of Virtual Coupling The third part of the survey aims at understanding potential impacts of Virtual Coupling on the railway business in terms of Capital (CAPEX) and Operational (OPEX) Expenditure. CAPEX includes all investment costs for necessary infrastructure and technological enhancements to enable Virtual Coupling operations. OPEX instead encompasses costs to manage, operate and maintain the railway service, including employee wages, ordinary and extraordinary maintenance of infrastructure, signalling, rolling stock and equipment, rental fees, utility bills. Statistical distributions of opinions expressed by the respondents are illustrated in Figure 71. It is clear that most of the interviewees (between 77% and 87%) expect an increase in CAPEX due to the deployment of VC for all the market segments. Regarding the OPEX instead, opinions are quite split depending on the specific market segment. For the high-speed segment, responses are not able to provide a clear trend on whether VC will increase, decrease, or not change the OPEX, given that responses are equally spread among the different options (34%, 32% and 34%). For the main line, again opinions are equally split between an increase (36.20%) and a decrease (36.20%) in OPEX, while less responses suggest a non-relevant change for this market segment. For the regional segment, most of the interviewees (44.70%) identify in VC an opportunity to reduce OPEX. Less responses (34%) envisage an OPEX increase while even less interviewees (21.30%) consider that VC will not change operational expenses. For the urban/suburban market, most of the responses (44.70%) mainly indicate a potential reduction in OPEX, while the rest of the opinions are equally divided between a possible increase (27.70%) or an unchanging
0%
10%
20%
30%
40%
50%
60%
70%
80%
90%
100%
High Speed Main Line Regional Urban/Suburban Freight
V2V communication architecture Safety at diverging/merging junctions
ATO Incompatibility with current policy/regulations of railways
Incompatibility with current infrastructure and/or interlocking

G A 8 2 6 3 4 7 P a g e 74 | 121
(27.70%) operational expenditure. Similarly, for the freight market most of the interviewees (42.60%) sees in VC a potential to decrease OPEX, while the remaining opinions are spread between the other two options (29.80% consider an increase while 27.70% a negligible variation).
Figure 71 – Business impact of Virtual Coupling in terms of CAPEX and OPEX for each MS
For the sake of completeness, the main reasons provided by the interviewed SMEs on changes in CAPEX and OPEX due to VC, are provided as follows. Reasons for CAPEX increase:
Need to deploy new and more sophisticated technology.
Need for a bigger fleet with upgraded on-board equipment for all MSs.
Necessity of replacing current signalling, interlocking, infrastructure and traffic control.
Installation of digital dynamic information system for improved guidance to passengers.
Costs to develop and integrate V2V communication layer.
Reasons for CAPEX decrease:
Lower investment after that Moving Block has been already deployed especially for regional and freight lines.
Less requirement of hardware components since main control systems will be software-based.
No need to install track-side equipment with respect to ETCS Level 2.
Reasons for no difference in CAPEX:
If ETCS Level 3 is already installed then the upgrade to VC will not entail relevant additional costs, it will be enabled through existing generic computing architectures/hardware and V2V enhancement as a result of transition beyond GSM-R.
Deploying VC will not be more expensivethaninstallingtoday’ssignallingtechnologiessuchas ETCS Level 1 or 2.
CAPEX for regional and urban/suburban railways are already quite high and installation of VC technologies will simply align with current costs with no addition.
0%10%20%30%40%50%60%70%80%90%
100%
↗ ↘ = ↗ ↘ =
CAPEX OPEX
High Speed Main Line Regional Urban/Suburban Freight

G A 8 2 6 3 4 7 P a g e 75 | 121
Reasons for OPEX increase:
Higher service frequencies resulting in larger personnel, higher energy and track maintenance costs.
Added functionality and complexity
Very high levels of control/monitoring and maintenance due to the need for abolishing failures to point and data communication
Reasons for OPEX decrease:
Integration between ATO and V2V integration will automate operations, significantly decreasing the need for personnel such as train drivers.
Less maintenance due to removal of vital track-side equipment
Lower operational/energy costs due to automatically driven trains which can more easily follow energy-efficient time-distance trajectories.
Reasons for no difference in OPEX:
For longer distances (high-speed or main line), staff would be needed to supervise ATO and customer service (e.g. conductors) with cost savings unlikely to be significant for those markets.
There will possibly be a cost balance between the decreased expense to maintain track-side equipment (i.e. track circuits) and the higher need to maintain rail tracks due to the higher service frequency enabled by VC.
G A 8 2 6 3 4 7 P a g e 76 | 121
4. Preliminary analysis on VC customer attractiveness and modal shift Based on stated travel preferences collected by the survey for the different case studies, an estimation of customer attractiveness of Virtual Coupling train operations can be provided. The main outcome of this analysis is a preliminary understanding of the potential modal shares that a more frequent and flexible train service could provide. The majority of respondents are between 22 and 35 years old, where 34.54% travel by bike, followed by 25.45% who travel by train. Respondents between 36 and 49 years old consider traveling by train as a priority, followed by driving a car (26.92%). The older generation (50 years or more) travel mostly by car (28.12%), followed by one-quarter who use trains and equally 18.75% who either walk or cycle. Around 54% spend less than €50 on their O-D transport monthly, as 44.12% of respondents travel by bike. A total of 44.12% of the respondents do not rely on just one means of transport for their O-D daily trips, they use instead multi-modal means of transport (16.7% travel by bike and train, followed by 13.33% who go by either car and train or through a combination of cycling, traveling by train and walking). Among the 55.88% who travel by means of only one transport mode, 44.74% travel by car, followed by almost 34% who only commute by bike. Only 13.16% use trains exclusively and no one walks entirely for routine O-D (25% cover a partly walking distance in conjunction with other transport modes). Interviewees usually travel by car for distances lower than 20 kilometres or between 30 and 100 kilometres. Trains are mostly used for distances between 30 and 100 kilometres, while cycling is indeed common for distances lower than 20 kilometres. Almost 70% of respondents declare that their main reason for traveling by train is to save time (e.g. working in the train). This means that with the implementation of VC, respondents would even save more time due to the flexibility of train services, resulting in a potential increase of passengers (higher capacity). More than 73% point out that traveling by car is faster than public transport where 42.86% travel for distances shorter than 20 kilometres, followed by 35.71% for distances between 30 and 100 kilometres. About 91% of the respondents who do not have a railway connection between their origin and destination are located in UK and Italy. They travel only by car where 45.45% drive for less than 20 kilometres per day for a one-way trip, followed by 27.27% who drive between 30 and 100 kilometres. A share of 52.60% of the interviewees state that they use cars due to a wider choice of departure date and time (10% selected this option as their only reason for traveling by car). This means that if respondents would have a more frequent and flexible train service, most of them would potentially shift to railways. Among the 44.12% of respondents who travel by bike, about 56.30% consider bikes being faster than public transit. Therefore, respondents who live close to destination would probably not shift from bike to train, as most of them who selected the mentioned reason also stated that they cycle for health purposes. Additionally, some other bike users state that using the bike is completely inexpensive when compared to any other transport mode. From the 14.70% respondents who travel by bus, only 20% do not use a supplementary transport mode and declare that they do not have trains running for their O-D. They are spread among all European countries where the majority falls in UK. In most cases, bus passengers travel by bike and/or walk as well.

G A 8 2 6 3 4 7 P a g e 77 | 121
In total, 43 respondents out of 68 have a train running for their O-D where 27.91% of them do not travel by train. This is mainly because they consider traveling by car faster and more comfortable than public transport, in addition to the wider choice of departure date and time. Other respondents who travel by bike state the same reasons as for traveling by car in addition to living close to destination and caring for health and environment. The three additional reasons for traveling by bike were also justified for respondents who prefer walking. Half of the interviewees travel only by means of their private car where 57.14% drive for distances between 30 and 100 kilometres on a daily-basis and 33.33% use only the bike for daily commuting (less than 20 kilometres). 8.33% commute by both car and bike for a distance between 20 and 30 kilometres, while the other 8.33% travel by motorcycle for 30 to 100 kilometres. Among 27 respondents (39.70%) who travel by car, 22.22% would consider paying more for high speed trains to have more frequent services as they do not like waiting and would be convinced to shift from traveling by car to train if frequency is significantly improved, whereas 77.78% would consider using the new train services (equipped with VC) only if the ticket price would remain the same. For main line trains, 51.85% would consider shifting from driving with paying extra train ticket costs, 40.74% would shift without paying extra costs whereas 7.41% considered the train ticket already too expensive and that traveling by bus or driving for 2 hours would be cheaper and/or more reasonable. For regional trains, 85.18% of car drivers found it more convenient to use frequent trains as the extra cost is relatively low versus the highly improved headway. 7.41% would will to travel by train if the train ticket price would remain the same, since the cost would be cheaper than a car. The remaining 7.41% were still convinced for traveling by means of a private vehicle as they considered that the travel time and cost with a car would be approximately similar to traveling by train and that the main benefit of not shifting from the current mode of transport would be the absence of schedule constraints imposed by trains. 33.33% do not mind paying some more cents to the train ticket to use more frequent urban trains while 55.56% would possibly shift from traveling by car only if the price would remain the same. The remaining 11.11% mention that either they would still use their current multimodal travel (bike for health reasons and car for shorter travel time and more comfort) or think that VC is still not convincing enough for very short headways (less than two minutes). The majority of respondents who do not routinely commute by train use the latest monthly (40.54%) for leisure (80%), business/study purposes (60%), or visiting family and/or friends (40%). A total of 32.43% of the sample use trains occasionally mostly for leisure purposes (66.67%). The remaining 27.03% travel weekly mainly for visiting family or friends (70%).
Table 13 – Modal Share for each Passenger-related Case Study
Case Study 1 Case Study 2 Case Study 3 Case Study 4
Train Bus Car Plane Train Bus* Car Train Bus* Car Train Bus Car Bike Walk
Current scenario (%) 98.5 0.0 1.5 0.0 79.4 10.3 10.3 72.1 0.0 27.9 75.0 2.9 1.5 20.6 0.0
Cost ↗ Freq. ↗ (%) 17.6 22.1 45.6 14.7 47.1 27.9 25.0 83.8 4.4 11.8 25.0 29.4 7.4 38.2 0.0
Cost = Freq. ↗ (%) 100.0 0.0 0.0 0.0 92.6 4.4 2.9 98.5 0.0 1.5 91.2 2.9 1.5 4.4 0.0

G A 8 2 6 3 4 7 P a g e 78 | 121
Figure 72 - Modal share for each passenger-related case study
Table 14 - Modal share for freight-related case study
Case Study 5
Freight train Truck Ship Air Cargo
Current scenario 19.1% 80.9% 0.0% 0.0%
MarginalCost↗Freq.↗ 63.8% 36.2% 0.0% 0.0%
Figure 73 – Modal share for freight-related case study
By aggregating stated travel preferences in the survey, the resulting modal share has been computed for each of the case studies for the current and future scenarios. Numerical results are reported in Table 13 and Table 14, respectively for the passenger and the freight railway segments. Corresponding histograms are illustrated in Figure 72 and Figure 73, respectively.
0,0%
10,0%
20,0%
30,0%
40,0%
50,0%
60,0%
70,0%
80,0%
90,0%
100,0%
Train Bus Car Plane Train Bus* Car Train Bus* Car Train Bus Car Bike Walk
Case Study 1 Case Study 2 Case Study 3 Case Study 4
Current scenario Cost↗Freq.↗ Cost=Freq.↗ *: Regional bus (Coach)
0,0%
10,0%
20,0%
30,0%
40,0%
50,0%
60,0%
70,0%
80,0%
90,0%
100,0%
Freight train Truck Ship Air Cargo
Case Study 5Current scenario
MarginalCost↗Freq.↗

G A 8 2 6 3 4 7 P a g e 79 | 121
High speed segment. For the current scenario described in case study 1, almost 100% of the respondents prefer traveling by train for a distance higher than 300 km. The proposed increase of about 10% in the ticket fare to reduce service headways by 10 min on a 2 hours journey is not perceived as attractive to the interviewees. Having high-speed trains every 15 min seems already satisfactory for most of the respondents. Figure 72 clearly shows that the modal share for the current scenario (blue bars in Figure 72, Case Study 1) is strongly in favour of the high-speed service. The increase in the ticket cost proposed in the future scenario of a more frequent service (every 6 min) enabled by VC, massively shift respondents preferences towards the car, the bus and the plane, as shown by the orange bars in the histogram. For the future scenario of a more frequent high-speed service at the same cost (grey histograms), 100% of the interviewees indicate railways as their favourite option. Main line segment. For case study 2 the majority of interviewees opts for the main line train service in the current transport scenario, while only a small share uses the car or the bus (blue histograms in Figure 72, Case Study 2). A future scenario of a train service offering 20 min less waiting time for a ticket increase by 20% is not considered that attractive from many of the interviewees who in that case would prefer shifting to the other modes of transport, as clearly illustrated by the orange histograms. Many of them responded that for this kind of journey they would prefer arranging their travel schedule around a less frequent train service rather than paying that much more to use an improved main line connection. Instead a future scenario of more frequent main line services at the same cost would strongly attract customers from other modes of transport to the railways as shown by the grey histograms. Regional segment. In case study 3 the most part of the respondents would use the available railway connection (having a frequency of one train per hour) for the current transport scenario. The remaining part instead would rely on the car (blue histograms in Figure 72, Case Study 3). In the future scenario of a train every 22 min for a ticket cost increase by 20%, a significant share of the sample would shift from cars to railways, as shown by the orange histograms. This means that the proposed market scenario would be attractive to passengers, since they are not currently satisfied with the delivered railway service and would be willing to pay more for a more frequent regional train connection. In the scenario that a more frequent regional service is available with no raise in ticket fees, it is evident that almost the totality of the interviewees considers regional railways as the most attractive travel alternative (grey histograms). Urban/suburban segment. For case study 4, the modal share for the current transport scenario is in net favour of the available metro line having already a good frequency of a train every 2 min. By looking at the blue histograms for case study 4 in Figure 72, the other used modes would be the bike, followed by the bus and lastly the car. In the future scenario of a metro train every 45 s for a ticket increase by 13%, many respondents would shift to other the modes of transport (orange histograms), given that they are not willing to pay more for improving a service that is already satisfactory as it currently is. Paying even 0.30£ more for a reduction by 75 s in the average waiting time is not an attractive market scenario. Such a little saving in the waiting times is indeed not perceived by passengers which can already flexibly arrange their trips around the current service headway of 2 min. In the scenario of an improved metro service with no ticket cost increase, interviewees would mainly shift to railways as depicted by the grey histograms. Those results show that service improvements brought by VC on urban/suburban lines might not be perceived by customers and therefore not being attractive if the ticket fares would increase.

G A 8 2 6 3 4 7 P a g e 80 | 121
However, deployment of VC on such lines could benefit railway stakeholders due to the increased capacity and possible mitigation of delay propagation. Freight segment. For case study 5, the modal split in the current transport scenario is in advantage of the road trucks as shown by the blue histograms in Figure 73. Such a result indeed matches with the modal share observed in real life, giving a higher flexibility and cheaper truck delivery. Instead, in the future scenario of more flexible and frequent freight railways enabled by VC, a significant modal shift from road trucks would be observed even in the case of an increase by 15% in the marginal delivery cost. Such a shift is mainly dictated by the fact that customers perceive railways as a more reliable mean of transport. A higher flexibility and delivery capacity would be appealing despite potential raises in the marginal cost, since these latter would be widely compensated by the larger number of units delivered. Such an outcome shows that the implementation of VC on freight railways would be very attractive to the freight transport market with consequent benefits to the environment due to the reduction of road trucks.

G A 8 2 6 3 4 7 P a g e 81 | 121
5. Preliminary Virtual Coupling operational scenarios Preliminary operational scenarios for each market segments have been traced by combining the results from the survey together with outcomes from brainstorming sessions and workshops held with European railway experts within the MOVINGRAIL framework. Each scenario sketches operational characteristics to enable a safe Virtual Coupling train service that increases market attractiveness of each railway segment from both stakeholders’ andcustomers’perspective.Mainoperationalcharacteristicsrelateto:
i) planned service headway for each O-D pair,
ii) the train composition,
iii) train on-board customer facilities,
iv) train platforming procedures,
v) crowd management at platforms,
vi) the train power supply and
vii) main principles to control virtually coupled train convoys.
Operational ranges are defined for each of the abovementioned characteristics and reported in the following subsections for the different market segments. Validity and effectiveness of such operational scenarios will be further investigated in deliverable D4.2 of the MOVINGRAIL project by means of accurate modelling (e.g. simulation) and multi-criteria analysis techniques.
5.1. Scenarios for the high-speed market A possible future scenario for high-speed under Virtual Coupling is described in Table 15. Survey results show that planned headways below 15 min for a given O-D pair would not improve the travel experience of customers on the high-speed railway market. Departing headways of 15 min for an O-D pair seem already to provide passengers with enough flexibility to satisfy their travel requirements. Customers would indeed not be willing to pay more to use a high-speed service with headways lower than 15 min. A lower bound of the headway range proposed for the high-speed segment is set as 15 min. The upper bound is instead retrieved by stretching such a lower bound by 10 min, since this is the waiting time threshold perceived by passengers to affect quality of service and start turning towards possible travel alternatives, as several studies show ([31],[32]). This leads to an upper bound of 25 min. Customers would be probably willing to pay less for the high-speed if planned headways were above 25 min for over an O-D pair. The proposed range 15 min - 25 min hence represents the set of service headways considered most attractive to customers for the high-speed market segment. The number of O-D pairs and the service headways to be considered over each specific pair, need to be defined case by case based on customer demand forecasts, as customary in railway planning [36]. The total number of O-D pairs and the required service headway will determine the capacity needed over a given railway connection. An investigation shall then be made to assess whether Virtual Coupling can provide the level of capacity required for each railway link.

G A 8 2 6 3 4 7 P a g e 82 | 121
Table 15 – Operational scenario for the high-speed market
HIGH-SPEED MARKET SEGMENT
PLANNED HEADWAYS 15 - 25 min per O-D pair (No. O-D pairs to be defined via demand forecasts)
TRAIN COMPOSITION 8 cars at least (2 locos and 6 coaches)
ON-BOARD CUSTOMER FACILITIES
•Bar/restaurantwagon • Sufficient no. toilettes/seats •First- and Second-class cars •Silentwagons
CREW
•Crewlesstrain:ATOinsteadofdriver,on-board telephone/radio and cameras for issue reporting and security surveillance. •Crewonlypresentatstationplatformstocheck tickets and boarding/alighting procedures
TRAIN PLATFORMING A platform for each group of destinations (only trains going in the same direction are allowed to queue at the same platform)
CROWD MANAGEMENT AT PLATFORMS
Platform segregated into sections delimited by boards or physical barriers and platform doors
POWER SUPPLY
For EMUs: •Overhead Line (via pantograph) mainly during cruising/braking •On-board batteries to be mainly used during: i) accelerating ii) when moving in a virtually coupled convoy if the distance from pantographs of neighbouring trains is < 100 m •Regenerative braking to recharge on-board batteries or feed the substation back For DMUs: •Diesel engine during the entire journey whether in a VC convoy or not
CONVOY CONTROL
•Safetymarginof50to300mbetweentrainsinaconvoy •Couplingprocessallowed"ontherun"orwhenatastandstillatstations •Decouplingatdivergingjunctionsbyimposing: i) an absolute braking distance if approaching a switch with current switching technology ii) a relative braking distance + safety margin if approaching a switch with upgraded switching technology
High-speed trains shall have a composition of at least 8 cars (2 locos + 6 wagons) to allow increased train frequencies under Virtual Coupling while addressing requirements expressed by potential end-users about seating availability, number of toilettes per seat, bar/restaurant services, silent wagons as well as both first and second class cars. The train will be completely crewless since it will be automatically driven by the ATO and equipped with phones/radios to allow customers to report issues on board. On-board cameras will also be installed to monitor on-board security. Crew will be however available at platforms to check tickets and assist boarding/alighting of passengers.
G A 8 2 6 3 4 7 P a g e 83 | 121
As mentioned before, Virtual Coupling operations would allow trains moving in the same convoy to stop in a queue along the same platform. This could however generate confusion to passengers when trying to board the correct train, if not enough information is provided. In addition, excessive platform congestion could be observed due to multiple flows of passengers trying to board/alight multiple trains allocated to the same platform. It is clear that strategies for train platforming and crowd management at platforms become extremely relevant to Virtual Coupling operations. In the scenario proposed for the high-speed market, station platforms shall be dedicated to a specific group of destinations. This means that high-speed trains needing to stop at a certain station can stop behind each other at the same platform only if they have the same direction and head towards the same group of destinations. Such a kind of platform allocation can mitigate the risks of occupation conflicts at platform tracks and unmanageable passenger flows on platforms. Those risks could become indeed much higher if high-speed trains having the proposed frequencies and lengths are allowed to stop at the same platform. To a more efficient and safer crowd management, platforms could be segregated into sections delimited by boards or physical barriers (e.g. turnstiles, gates) so to provide more accurate passenger information on the exact location of trains. Also, platform doors will need to be installed, given that trains will be crewless. In addition, platform doors can help passengers in boarding the correct train, since they will only open where a train queuing at the platform is boarding/alighting. Whilst there are no particular restrictions for running diesel-powered high-speed trains (apart from obvious environmental reasons), issues might arise when Electric Multiple Units (EMUs) are operated in a virtually coupled convoy. One main issue regards mechanical oscillations of the overhead catenary which can be substantial beyond speeds of 200 km/h. In order to avoid damages to the overhead line system and the rolling stock, a minimum distance of at least 100 m needs to be allowed between two consecutive pantographs. This means that if the first train of a virtually coupled convoy is powered via the pantograph, the follower train in the convoy cannot avail of the overhead system if the separation in between is less than 100 m. In this case the follower train shall rely on alternative power sources such as on-board lithium-ion batteries, for instance. Another major issue is that power substations might not have enough power to feed all of the trains operating in a single virtually coupled convoy. A valid solution to this problem is also provided by on-board batteries, especially if used during energy-expensive acceleration phases. In this way, much less power is required from the substation if the overhead is mainly used during cruising phases and braking. The usage of regenerative braking will be massively beneficial to this end, for feeding back on-board batteries or the substation grid. To safely separate trains when running in a virtually coupled convoy a safety margin ranging from50to300mshallbeimposed.Trainsareallowedtocoupleinaconvoywhen“on-the-run”between two stations, given inter-station distances on high-speed networks are long enough to safely allow such a coupling procedure. When approaching diverging junctions instead, two trains in a convoy shall be outdistanced by an absolute braking distance for junctions equipped with current switch technologies. If advanced switch technologies such as those proposed by REPOINT [33] or Railtaxi [34] are installed, then shorter train separations (e.g. the relative braking distance) at diverging junctions could be allowed.
5.2. Scenarios for the main line market For the main line market segment operational characteristics envisaged to deploy Virtual

G A 8 2 6 3 4 7 P a g e 84 | 121
Coupling are provided in Table 16. Survey results reveal that service headways ranging between 7 and 20 min for a given O-D pair and a given train category (e.g. intercity, regional), can make the main line market more attractive to both passengers and stakeholders. The number of O-D pairs, the type of train categories and their frequencies over an O-D link, shall be again defined case by case by means of travel demand forecasts. By defining the O-D flow matrix and the required train services for each O-D, the capacity needed over each rail connection will be identified. A capacity analysis will be needed to assess whether Virtual Coupling can enable the required traffic flows. Todeliver such frequencieswhile taking into accountpotential users’ requirements,main linetrains shall be composed of at least 6 cars (2 locos and 4 coaches). Such a composition would be sufficient to provide enough seating availability, a standard number of toilettes per seat, silent wagons and first- and second- class cars. As for the high-speed market trains will be crewless and equipped with ATO, phones and cameras to monitor security. Crew is only expected to be at platforms to check tickets and boarding/alighting procedures. Also, the allocation of stopping trains at station platforms will be performed based on similar groups of destinations. The frequency and length envisaged in this scenario for main line trains, will significantly raise risks of occupation conflicts of platform tracks and unmanageable passenger flows if trains with different destinations are allowed stopping at same platform.
Table 16 – Operational scenario for the main line market
MAIN LINE MARKET SEGMENT
PLANNED HEADWAYS 7 - 20 min per O-D pair (No. O-D pairs to be defined via demand forecasts)
TRAIN COMPOSITION 6 cars at least (2 locos and 4 coaches)
ON-BOARD CUSTOMER FEATURES
•Bar/restaurantwagon •Sufficientno.toilettes/seats •First- and Second-class cars •Silentwagons
CREW
•Crewlesstrain:ATOinsteadofdriver,on-board telephone/radio and cameras for issue reporting and security surveillance. •Crewonlypresent at station platforms to check tickets and boarding/alighting procedures
TRAIN PLATFORMING A platform for each group of destinations (only trains going in the same direction are allowed to queue at the same platform)
CROWD MANAGEMENT AT PLATFORMS
Platform segregated into sections delimited by boards or physical barriers and platform doors

G A 8 2 6 3 4 7 P a g e 85 | 121
POWER SUPPLY
For EMUs: •Overhead Line (via pantograph) mainly during cruising/braking •On-board batteries to be mainly used during: i) accelerating ii) when moving in a virtually coupled convoy if the distance from pantographs of neighbouring trains is < 100 m •Regenerative braking to recharge on-board batteries or feed the substation back For DMUs: •Diesel engine during the entire journey whether in a VC convoy or not
CONVOY CONTROL
•Safetymarginof50to200mbetweentrainsinaconvoy •Couplingprocessallowed"ontherun"orwhenatastandstillatstations •Decouplingatdivergingjunctionsbyimposing: i) an absolute braking distance if approaching a switch with current switching technology ii) a relative braking distance + safety margin if approaching a switch with upgraded switching technology
Sectioning of platforms will be made by means of boards or physical barriers (e.g. turnstiles with ticket recognition) and platform doors will be installed to support passengers in boarding the correct train. Since some intercity trains can reach speeds of around 200 km/h on certain lines, pantographs of consecutive EMUs in a virtually coupled convoy shall be separated by at least 100 m to avoid dangerous oscillations of the catenary and damages to the rolling stock. The use of on-board batteries will be necessary to feed trains in a convoy following a train powered via pantograph, whenever the train separation is lower than 100 m. Also, battery-powered trains will help relief the load of substations which might have an insufficient power to feed multiple main line trains running in a convoy on the same electrified section. To this end, batteries can be especially used during acceleration phases while mainly replying on the overhead line for less power-expensive cruising phases. The support of regenerative braking is deemed very beneficial in Virtual Coupling operations to feed on-board batteries or the substation grid. The safety margin envisaged for main line trains when running in a virtually coupled convoy ranges between a minimum of 50 m to a maximum of 200 m. The distance between stations on main lines is in general sufficient to allow trains to couple on-the-run, although coupling is also possible when at standstill in stations. At diverging junctions equipped with today’s switchtechnologies, an absolute braking distance shall be imposed between two consecutive train in a convoy. A shorter separation, closer to a relative braking distance might be instead thought about when migrating towards advanced super-fast switch technologies.
5.3. Scenarios for the regional market Operational characteristics identified for the regional market segment are illustrated in Table 17. Stated preferences collected by the survey for this market segment identified a service headway between 8 and 20 min per O-D pair, as an attractive range for stakeholders and customers. As already mentioned for the previous market segments, the number of O-D pairs and the service

G A 8 2 6 3 4 7 P a g e 86 | 121
frequency required for each pair will need to derive from specific travel demand predictions performed case by case. Such a prediction will reveal the number of train services that will need to cross a given rail track in a time unit. Based on such an analysis, a capacity investigation will determine whether Virtual Coupling can provide the required traffic volumes. The number of train compositions are envisaged to be of at least 4 cars (2 locos and 2 coaches) to enable proposed service frequencies with minimum rolling stock investment while providing requested customer facilities like enough seating availability, standard number of toilettes/seats, silent wagons and first- and second- class cars. Regional trains are also considered to be crewless since they will be equipped with ATO as well as cameras and phones for monitoring and reporting security issues. Differently from the previous market segments, regional trains going to different groups of destinations can be allowed to queue at the same platform when stopping at a station. The lower service frequencies and shorter lengths might be indeed not critical concerning risks of occupation conflicts of platform tracks and unmanageable platform overcrowding. Platforms can have a lighter segregation into sections which can just be delimited by boards instead of physical barriers. Platform doors will be needed anyway given the absence of the train driver and the on-board crew. Such doors will also support passengers in boarding the correct train when sufficient information on exact train location is provided. EMUs operating under Virtual Coupling on regional lines could be powered directly by the overhead line (via the pantograph) even if running in a virtually coupled convoy. This is not considered to raise particular issues of dangerous catenary oscillations, given the lower operating speeds. Issues regarding power capacity of the substations shall be better investigated, although the use of on-board batteries and regenerative braking will be definitely beneficial to relief power requests from the main electrical grid.
Table 17 – Operational scenario for the regional market
REGIONAL MARKET SEGMENT
PLANNED HEADWAYS 8 - 20 min per O-D pair (No. O-D pairs to be defined via demand forecasts)
TRAIN COMPOSITION 4 cars at least (2 locos and 2 coaches)
ON-BOARD CUSTOMER FEATURES
•Sufficientno.toilettes/seats •First- and Second-class cars •Silentwagons
CREW
•Crewlesstrain:ATOinsteadofdriver,on-board telephone/radio and cameras for issue reporting and security surveillance. •Crewonlypresentatstationplatformstocheckticketsandboarding/alightingprocedures
TRAIN PLATFORMING A platform can allow queues of trains going to different groups of destinations
CROWD MANAGEMENT AT PLATFORMS
Platform segregated into sections delimited by boards and platform doors

G A 8 2 6 3 4 7 P a g e 87 | 121
POWER SUPPLY
For EMUs: •Overhead Line (via pantograph) •Regenerative braking to recharge on-board batteries or feed the substation back For DMUs: •Diesel engine during the entire journey whether in a VC convoy or not
CONVOY CONTROL
•Safetymarginof50to150mbetweentrainsinaconvoy •Couplingprocess allowed when at a standstill at stations •Decouplingprocessrecommendedtobeperformedatastandstill. If distance between interlocking areas are sufficiently long, then decoupling at diverging junctions by imposing: i) an absolute braking distance if approaching a switch with current switching technology ii) a relative braking distance + safety margin if approaching a switch with upgraded switching technology
No specific issues are instead observed for diesel powered trains, despite evident environmental reasons. Safety margin to be guaranteed in between two consecutive regional trains when virtually coupled in a convoy range between 50 and 150 m. Due to the shorter distances between stations on regional lines, the coupling process will be more effectively performed when trains are at a standstill at stations. Also, regional trains might not have enough space between interlocking areastobedecoupled“on-therun”,sodecouplingisrecommendedtobemadeatastandstill.However, if distances allow, decoupling at diverging junctions is possible by guaranteeing an absolute braking distance in between the trains for locations equipped with current switch technologies. Shorter separations could be instead achieved at diverging junctions featuring faster and more advanced switches.
5.4. Scenarios for the urban/suburban market Operational scenarios defined for the urban/suburban market segment are reported in Table 18. Outcomes from collected stated travel preferences show that passengers do not perceive a waiting time below 2 min. Decreasing planned headways of urban/suburban below 1 min does not increase the attractiveness of the railway segment, since customers can already satisfy their travel needs with such a service headway. The urban/suburban market segment becomes therefore attractive for customers and stakeholders, when operating with planned headways ranging between 1 and 6 min for each O-D pair. Customers are not willing to pay more for using an urban service with headways lower than 1 min. Similarly, they would be willing to pay less if the waiting time on the platform is more than 6 min. On some metro lines (e.g. London Victoria line in the UK), service headways of about 1 min can be already achieved with current signalling systems like CBTC. For those metro systems, the implementation of Virtual Coupling is therefore envisaged not to increase the attractiveness of the service itself from the passenger perspective. However, for particularly dense and crowded urban/suburban network, Virtual Coupling can further decrease urban train separation with a positive effect on transport capacity and delay propagation. Benefits on delay propagation can be mostly appreciated if passenger boarding/alighting process is made quasi-deterministic by introducing platform doors. These latter are inevitably needed under Virtual Coupling, due to the unmanned, automated train
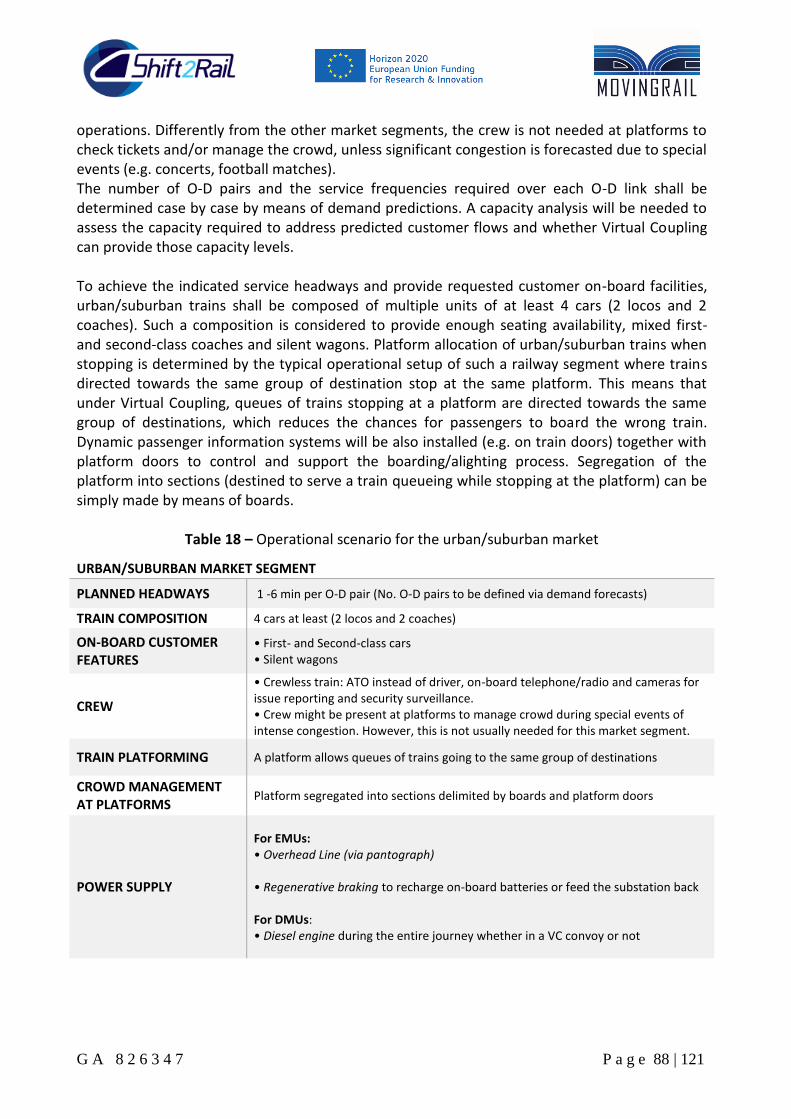
G A 8 2 6 3 4 7 P a g e 88 | 121
operations. Differently from the other market segments, the crew is not needed at platforms to check tickets and/or manage the crowd, unless significant congestion is forecasted due to special events (e.g. concerts, football matches). The number of O-D pairs and the service frequencies required over each O-D link shall be determined case by case by means of demand predictions. A capacity analysis will be needed to assess the capacity required to address predicted customer flows and whether Virtual Coupling can provide those capacity levels. To achieve the indicated service headways and provide requested customer on-board facilities, urban/suburban trains shall be composed of multiple units of at least 4 cars (2 locos and 2 coaches). Such a composition is considered to provide enough seating availability, mixed first- and second-class coaches and silent wagons. Platform allocation of urban/suburban trains when stopping is determined by the typical operational setup of such a railway segment where trains directed towards the same group of destination stop at the same platform. This means that under Virtual Coupling, queues of trains stopping at a platform are directed towards the same group of destinations, which reduces the chances for passengers to board the wrong train. Dynamic passenger information systems will be also installed (e.g. on train doors) together with platform doors to control and support the boarding/alighting process. Segregation of the platform into sections (destined to serve a train queueing while stopping at the platform) can be simply made by means of boards.
Table 18 – Operational scenario for the urban/suburban market
URBAN/SUBURBAN MARKET SEGMENT
PLANNED HEADWAYS 1 -6 min per O-D pair (No. O-D pairs to be defined via demand forecasts)
TRAIN COMPOSITION 4 cars at least (2 locos and 2 coaches)
ON-BOARD CUSTOMER FEATURES
•First- and Second-class cars •Silentwagons
CREW
•Crewlesstrain:ATOinsteadofdriver,on-board telephone/radio and cameras for issue reporting and security surveillance. •Crewmightbepresentatplatformstomanagecrowdduringspecialeventsofintense congestion. However, this is not usually needed for this market segment.
TRAIN PLATFORMING A platform allows queues of trains going to the same group of destinations
CROWD MANAGEMENT AT PLATFORMS
Platform segregated into sections delimited by boards and platform doors
POWER SUPPLY
For EMUs: •Overhead Line (via pantograph) •Regenerative braking to recharge on-board batteries or feed the substation back For DMUs: •Diesel engine during the entire journey whether in a VC convoy or not

G A 8 2 6 3 4 7 P a g e 89 | 121
CONVOY CONTROL
•Safetymarginof50to100mbetweentrainsinaconvoy •Couplingprocessallowedwhenatastandstill at stations •Decouplingprocessrecommendedtobeperformedatastandstill. If distance between interlocking areas are sufficiently long, then decoupling at diverging junctions by imposing: i) an absolute braking distance if approaching a switch with current switching technology ii) a relative braking distance + safety margin if approaching a switch with upgraded switching technology
Given the already high frequency of urban/suburban service on some networks, current power substations might have the capability to feed multiple EMUs operating under Virtual Coupling on the same electrical section. The use of on-board batteries is anyway recommended since this could reduce the power requests from the substations. Regenerative braking shall be used to recharge on-board batteries or feed the substation back. Due to the relatively low speeds of urban/suburban train services (around a max of 80 km/h) no risks of dangerous oscillations of the catenary are envisaged if different EMUs use the pantograph at a short separation from each other. When synchronously moving in a virtually coupled convoy however a safety margin shall be imposed in between consecutive trains that range from 50 to 100 m. The coupling process will need to be performed when trains are at a standstill (e.g. at stations) since inter-station distancesonurban/suburbannetworksarenotenoughtoallowaneffectivecoupling“on-the-run”. Decoupling of a convoy shall occur also at a standstill if distances between consecutiveinterlocking areas are short. Otherwise decoupling on the run is possible at diverging junctions by imposing an absolute braking distance if switches have current technologies. Such a separation can be reduced to potentially the relative braking distance plus a safety margin if advanced technologies for super-fast switches are adopted.
5.5. Scenarios for the freight market Operational characteristics for enabling Virtual Coupling operations on the freight market are represented in Table 19. Freight trains are usually operated on demand depending on the necessity of carriers and Freight Operating Companies (FOCs). Specific demand forecasts need to be performed to determine the O-D pairs and the freight flows over each O-D link. In such a way, it will be possible to assess the capacity required for each rail connection and to identify whether Virtual Coupling could enable predicted traffic volumes. Preliminary simulation studies [14] indicate that Virtual Coupling could potentially reduce technical headways of about 45% with respect to plain moving block. For freight lines, this means that requests of good delivery could almost be doubled with respect to an ETCS Level 3 moving block implementation. To this end, a completely new vision of railway freight transport can be set. Transport of multi-commodity freight with different types of goods towards different destinations could be performed by means of single fully automated freight wagons (25-30 m long) which are able to virtually couple to a main convoy at merging junctions (so to increase capacity at bottlenecks) and decouple at diverging junctions to reach their specific destination. For bulk freight which need instead to be usually moved from the source (e.g. mines, wells) to a single destination (e.g. a construction site) a fixed train composition is envisaged of a max of 10 cars (2 locos and 8 wagons) for a total length of around 250 m. Fixed composition of freight trains will also overcome current limitations of TIM technologies not yet proved for trains with
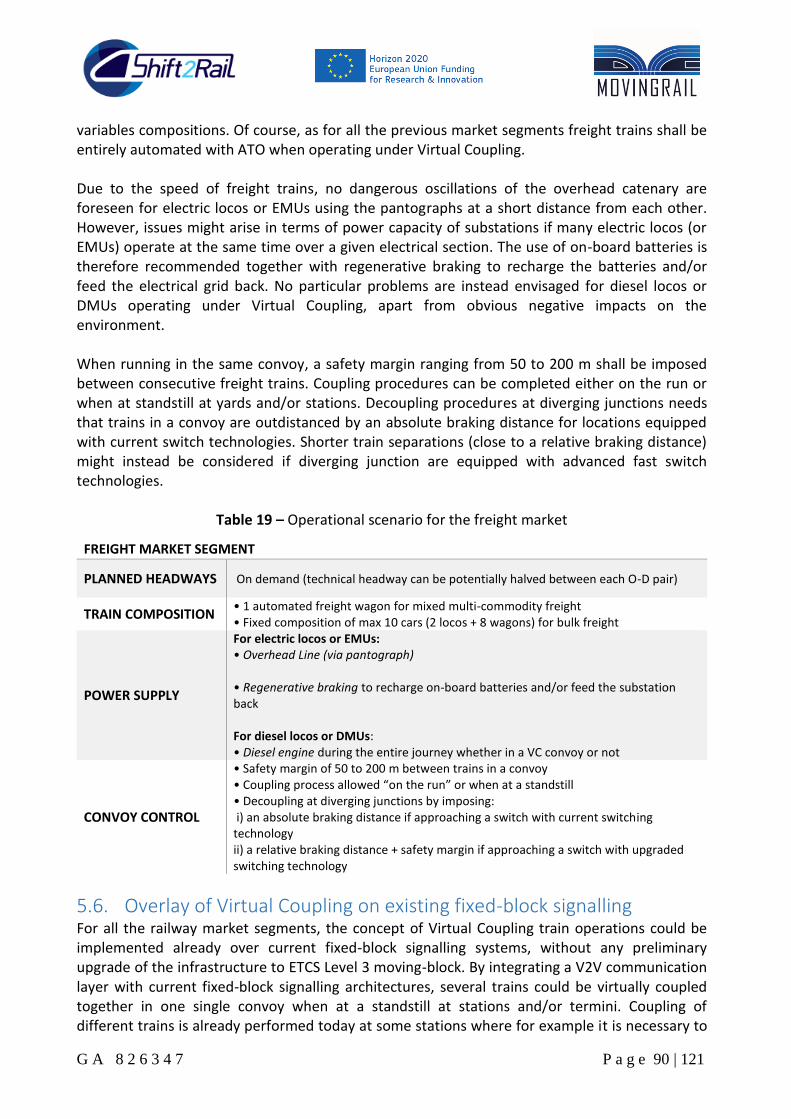
G A 8 2 6 3 4 7 P a g e 90 | 121
variables compositions. Of course, as for all the previous market segments freight trains shall be entirely automated with ATO when operating under Virtual Coupling. Due to the speed of freight trains, no dangerous oscillations of the overhead catenary are foreseen for electric locos or EMUs using the pantographs at a short distance from each other. However, issues might arise in terms of power capacity of substations if many electric locos (or EMUs) operate at the same time over a given electrical section. The use of on-board batteries is therefore recommended together with regenerative braking to recharge the batteries and/or feed the electrical grid back. No particular problems are instead envisaged for diesel locos or DMUs operating under Virtual Coupling, apart from obvious negative impacts on the environment. When running in the same convoy, a safety margin ranging from 50 to 200 m shall be imposed between consecutive freight trains. Coupling procedures can be completed either on the run or when at standstill at yards and/or stations. Decoupling procedures at diverging junctions needs that trains in a convoy are outdistanced by an absolute braking distance for locations equipped with current switch technologies. Shorter train separations (close to a relative braking distance) might instead be considered if diverging junction are equipped with advanced fast switch technologies.
Table 19 – Operational scenario for the freight market
FREIGHT MARKET SEGMENT
PLANNED HEADWAYS On demand (technical headway can be potentially halved between each O-D pair)
TRAIN COMPOSITION •1automatedfreightwagonformixedmulti-commodity freight •Fixedcompositionofmax10cars(2locos+8wagons)forbulkfreight
POWER SUPPLY
For electric locos or EMUs: •Overhead Line (via pantograph) •Regenerative braking to recharge on-board batteries and/or feed the substation back For diesel locos or DMUs: •Diesel engine during the entire journey whether in a VC convoy or not
CONVOY CONTROL
•Safetymarginof50to200mbetweentrainsinaconvoy •Couplingprocessallowed“ontherun”orwhenatastandstill •Decouplingatdivergingjunctionsbyimposing: i) an absolute braking distance if approaching a switch with current switching technology ii) a relative braking distance + safety margin if approaching a switch with upgraded switching technology
5.6. Overlay of Virtual Coupling on existing fixed-block signalling For all the railway market segments, the concept of Virtual Coupling train operations could be implemented already over current fixed-block signalling systems, without any preliminary upgrade of the infrastructure to ETCS Level 3 moving-block. By integrating a V2V communication layer with current fixed-block signalling architectures, several trains could be virtually coupled together in one single convoy when at a standstill at stations and/or termini. Coupling of different trains is already performed today at some stations where for example it is necessary to

G A 8 2 6 3 4 7 P a g e 91 | 121
join trainsets from two split services (e.g. one from Northampton and one from Birmingham in the UK) in one single composition directed towards a major city (e.g. London). However, today the coupling is physical and requires several time-consuming manoeuvres to be completed. The use of virtual coupling will instead smooth down and make the coupling process almost instantaneous needing just that the trainsets are at a standstill at the same platform. Similarly, decoupling of trainsets in a virtually coupled convoy shall also happen when at a standstill at stations or termini. This means that when Virtual Coupling is overlaid over current fixed-block signalling, trains cannot be decoupled on-the-run as they approach a diverging junction, since they need to reach an area where they can be at a standstill. On the other hand, operating convoys of virtually coupled trains under fixed-block signalling, solves many safety concerns that railway experts have for Virtual Coupling in moving block. For example, concerns relating to train integrity monitoring of trains with variable composition will be automatically solved by the presence of track vacancy detection sections. A virtually coupled convoy would be managed and controlled exactly as it is currently done with physically coupled trains, given that all of the current interlocking and signalling rules as well as operational/engineering procedures are directly transferrable. Such an operational scenario will need to be evaluated and compared to Virtual Coupling scenarios under moving block.
5.7 On-demand virtually coupled swarming trains The concept of Virtual Coupling can lead towards a futuristic operational scenario of on-demand swarming trains that can couple/decouple on-the run at junctions so to maximise throughput and efficiency of the network. Such an operational scenario could be a natural consequence of the vision of Mobility as a Service (MaaS) which envisages a fully customised dial-a-ride type of service aiming to maximise the flexibility of public transport modes. Examples of on-demand public transport modes are Uber and Lyft. Fully automated swarming road pods have been recently developed by the Italian company Next [37] and are ready-to-be deployed in Dubai (Emirates). Such pods are already able to couple/decouple to each other on-the-run, although the coupling happens physically and not via radio like it is supposed to be for Virtual Coupling. A potential operational scenario can envisage trains being dispatched on-demand to collect a certain number of customers, requesting to travel across a given set of neighbouring O-D pairs. Trains, in this case, could be just composed of a single powered car and travel altogether in swarms where they could virtually couple when sharing a track or uncouple when heading towards different destinations. Such a scenario could therefore bring the railways towards a completely different level of operations where travellers’ satisfaction could be maximised by means of a totally personalised railway travel experience.

G A 8 2 6 3 4 7 P a g e 92 | 121
6. SWOT Analysis A SWOT analysis is a useful technique to define strengths and weaknesses of a given project variant, technology or operational strategy, and to identify opportunities and threats for the analysed market and/or business. A SWOT analysis is hence crucial to reckon the advantages and limitations of the novel concept of Virtual Coupling operations to understand potential gains and risks for the railway business. The SWOT is mainly implemented to assess market potentials of VC for the main market segments identified in the S2R Master Plan (High Speed, Main Line, Urban/Suburban, Regional and Freight). Virtual Coupling has a set of strengths and weaknesses that are common for all the considered market segments and that will lead to the same type of opportunities and threats. As can be seen in Table 20, Virtual Coupling is envisaged to increase capacity over plain moving block for all market segments due to a train separation that is no longer based on an absolute but on a relative braking distance. The reduction in train separation might also lead to a mitigation effect of delay propagation.
Table 20 - SWOT analysis of Virtual Coupling for all market segments
Strengths Weaknesses
•Increasedlinecapacityduetorelativebrakingdistance separation •Improvedmitigationofdelaypropagation • Reduced latency in communication with RBC in MB due to V2V •Highdegreeofserviceflexibility •DecreasedOPEXthankstoautomatedoperations, removal of track-side equipment and more reliable switch technologies •Potentialimpactreductionofsomeaccidents due to continuous train-to-train communication.
•Safetyatdivergingjunctionsstillneedfullbraking distance for current switch technology •Safetyrisksforhandlingtrainsetshavingheterogeneous braking rates in same convoy •Investmentsneeded to install V2V communication layer •NecessaryinfrastructureupgradestotheOverhead Line System, platforms and possibly switch technologies •Potentialincreaseinticketfeestosupportthe higher service frequencies.
Opportunities Threats
•Attractingmorerailwaycustomersduetoincreased service flexibility •PotentialprofitincreaseofIMsandRUsthanks to more available train paths at reduced operational cost •Deregulationoftherailwaymarketwithopening to smaller transport operators •Restructuringoftherailwaymarketfromacompetitive to a more cost-effective cooperative consortium model for operators •MigrationofcurrentControlandCommandsystems to more future-proof and efficient digital railway architectures •Maximise capacity and further reduce maintenance costs by installing advanced technologies for faster and more reliable switches.
•Potentialincreaseinticketcostsmightbenot well received by railway customers •Possibleincreaseintraincontrolcomplexitywith respect to MB which might raise approval risks from the industry •Additionalcostsofstakeholderstoaddresssafety issues due to relative braking distance separation •Partialredesignofpolicies,processesandengineering rules which need agreement and endorsement across the wide rail industry.

G A 8 2 6 3 4 7 P a g e 93 | 121
The introduction of a V2V communication layer increases reliability of information broadcasting while reducing latency between trains and the RBC with respect to Moving Block. Also, the V2V communication between trains might help in reducing the magnitude of some kind of accidents thanks to the continuous awareness of trains about the dynamic status of neighbouring trains. VC will be enabling a more flexible type of operations which are no longer constrained by fixed time schedules and that can transition to a frequency-based service that is even more attractive tocustomers’needs.Operationalcostsforbothinfrastructuremanagersandrailwayoperatorswill be decreasing or at least remain the same. Indeed, higher maintenance track costs due to potential larger traffic volumes will be compensated by the removal of track-side equipment (e.g. signals, axle counters) and the migration to faster and more reliable switching technologies. From the perspective of railway undertakings, annual costs for personnel and energy consumption will be minimised given that train operations will be fully automated and driving strategies optimised. Several weaknesses can be mentioned. For instance, at diverging junctions with current switch technology trains need to be separated by an absolute braking distance which might make capacity gains of VC over moving block only marginal and not worth the investment. Additional safety risks might arise when trying to control trains with different braking characteristics in the same convoy separated by less than an absolute braking distance. Also, an inevitable investment (CAPEX) needs to be made to deploy the V2V communication layer and to upgrade essential infrastructure elements such as the overhead line system, station platforms (to allow a platoon of trains to stop at a platform) and improve current switch technology to faster and more reliable ones (e.g. REPOINT [33] and RailTaxi [34]). Many opportunities are however opened for the railway business. First and foremost, the increased service flexibility is set to attract a relevant share of customers from other modes of transport. This will in turn increase revenues of Railway Undertakings (RUs) due to higher volumes of sold tickets and a marginal increase in ticket fees for delivering a more frequent service. Similarly, Infrastructure Managers (IMs) will have higher turnovers thanks to larger availability of train paths to be sold. That will eventually bring a higher profit of RUs and IMs since turnover will raise while operational costs might potentially reduce or remain the same as previously explained. Virtual Coupling can lead to further deregulation of the railway market where the larger number of train paths and the reduced operational costs can open business opportunities also for smaller transport companies which could operate services on specific O-D pairs. The train-to-train communication entails that rolling stock of different operating companies exchange information and cooperate during the service. Such a change in train operations can eventually bring about a reorganisation of the railway business in cooperative consortia of railway undertakings. A cooperative consortium model has been proved in economics [35] to provide higher Benefit/Cost ratios than the current competitive market. Other relevant opportunities introduced by Virtual Coupling are the migration of obsolescent command and control systems to future-proof digital railway architectures as well as the implementation of faster more reliable switch technologies set to further reduce maintenance costs. On the other hand, the main threats identified for Virtual Coupling are a potential increase of ticket fees due to more frequent services which might not be received well by customers. The introduction of train-to-train communication and platooning could increase complexity in train control and increase approval risks from the railway stakeholders. Such risks add to the

G A 8 2 6 3 4 7 P a g e 94 | 121
complexity to partially redesign current railway policies, regulation and engineering rules as well as further costs of stakeholders to address safety of Virtual Coupling operations. Additional Strengths, Weaknesses, Opportunities and Threats captured for each specific market segments are detailed in Table 21 for the high-speed, Table 22 for the main line, Table 23 for the regional, Table 24 for the urban/suburban and Table 25 for the freight segment.
Table 21 – Additional Strengths, Weaknesses, Opportunities and Threats for high-speed rail
High Speed
Strengths Weaknesses
•Significant train headway reduction due to relevant difference between absolute and braking distances at high speeds •Moreefficientplatooningbecauseofhomogeneous rolling stock characteristics •Coupling/decouplingcanbeperformedon-the-run due to long interstation distances.
•HighsafetyrisksincaseofV2V signal loss •Substantialstressofoverheadcatenary due to high speed EMUs running closer.
Opportunities Threats
•NoneadditionaltoTable20. •NoneadditionaltoTable20.
Additional strengths for the high-speed segment pertain to a more substantial reduction in train headways since the difference between absolute and relative braking distances is particularly significant for high speeds around 300 km/h. Train control during platooning operations is more effective for high speed trains given their similarity in rolling stock performances. In addition, coupling/decoupling of a convoy can occur on-the-run given that interstation distances are long enough. However, the higher operating speeds raise safety risks in case of V2V communication losses as well as increase the stress over the catenary if trains run closer on the same electrical section.
Table 22 – Additional Strengths, Weaknesses, Opportunities and Threats for main line rail
Main line
Strengths Weaknesses
•Additionalcapacityincreasesthankstohomogenisation of travel behaviour of the different train categories when platooning over open tracks •Groupingoftrainsina single convoy might reduce the amount of level crossing closures •Coupling/decouplingfeasibleon-the-run on sufficiently long interstation distances.
•Highcomplexityanduncertainty in managing heterogeneous rolling stock in one convoy.
Opportunities Threats
•Migrationtoadvancedsystemsforautomatictraffic control to optimise management of trains with different characteristics.
•NoneadditionaltoTable20.

G A 8 2 6 3 4 7 P a g e 95 | 121
For the main line segment, Virtual Coupling could homogenise the travelling behaviour of different train categories on open track when operating in the same convoy. At the same time, train platooning might reduce the amount of level crossing closures with a positive effect on the convenience of level crossing users and traffic congestion on neighbouring roads. As for high-speed, coupling/decoupling of a convoy can be performed on-the-run rather than only at stations. On the other hand, the heterogeneity of rolling stock characteristics makes control of trains in a convoy more complex and uncertain than for other segments. Such a weakness can be however mitigated by the possibility of adopting advanced train control systems to optimise control of trains and maximise operation efficiency.
Table 23 – Additional Strengths, Weaknesses, Opportunities and Threats for regional rail
Regional
Strengths Weaknesses
•Groupingoftrainsina single convoy might reduce the amount of level crossing closures.
•Coupling/decouplinginaconvoypotentially allowed only at a standstill due to non-sufficient interstation distances.
Opportunities Threats
•Substantialincreaseofcustomersthanks to massive improvement of current regional service frequencies.
•NoneadditionaltoTable20.
As for the main line, the introduction of Virtual Coupling on regional lines might have a positive effect on convenience of level crossing users and congestion on nearby roads thanks to grouping of multiple trains in a single convoy which reduces the amount of level crossing closures. However, due to the shorter distances between interlocking areas coupling/decoupling of convoys could be only performed when trains are at a standstill at stations. For regional lines the substantial increase in train frequencies with respect to current connections is set to bring a significant increase in the number of customers. Table 24 – Additional Strengths, Weaknesses, Opportunities and Threats for urban/suburban rail
Urban/ Suburban
Strengths Weaknesses
•Moreefficientplatooningbecauseofhomogeneous rolling stock characteristics.
•VCprovidesonlymarginalcapacityimprovements to current service headways which are already short.
Opportunities Threats
•NoneadditionaltoTable20. •Investments for VC deployment might not be compensated by a sufficient customer increase.

G A 8 2 6 3 4 7 P a g e 96 | 121
For the urban/suburban segment, homogeneity in rolling stock characteristics can provide a more efficient train control under Virtual Coupling. The main weakness for this market is that given the lower operating speeds and the already short service headways, VC could only provide a marginal capacity gain with respect to moving block. This leads to the potential threat that investments for deploying VC on urban/suburban lines might not be compensated by a corresponding increase in customer flows since no significant service improvement is perceived by passengers.
Table 25 – Additional Strengths, Weaknesses, Opportunities and Threats for freight rail
Freight
Strengths Weaknesses
•Higherflexibilityandcapacityoffreight delivery •Minimisedhandlingoperationsatmarshalling yards since coupling and decoupling can occur on the tracks •Coupling/decouplingofconvoyfeasible on-the-run thanks to long interstation distances.
•NoneadditionaltoTable20.
Opportunities Threats
•Introducingarevolutiontocurrentrailfreight transport set to attract a relevant share of market from other modes •Shortertrainswithfixedcompositionovercome limitations of TIM while reducing brake build-up times •Collectionanddistributionofgoodsover the last mile can be optimized and automated.
•NoneadditionaltoTable20.
For the freight segment, VC will lead to a higher and more flexible delivery of goods while minimising marshalling yard operations given that coupling/decoupling will take place on the tracks. Freight trains will be able to couple/decouple in convoys on-the-run besides at standstill because of the long interstation distances. Relevant opportunities for this segment include the possibility to optimise and automate collection and distribution of goods over the last mile. Also, having more frequent but shorter trains with a fixed composition will help overcoming limitations of TIM technologies currently not usable for variable train compositions. Virtual Coupling is set to completely revolutionise the way rail freight operates today, towards a more flexible and efficient service which could attract a significant market share from other transport modes.

G A 8 2 6 3 4 7 P a g e 97 | 121
7. Conclusions and recommendations A description of the innovative concept of Virtual Coupling has been provided in this document by detailing main technological and operational characteristics as well as the differences from traditional fixed-block and moving block signalling systems. Main operational characteristics are explained for the different railway market segments considered in the Shift2Rail MAAP, in order to assess the applicability of the Virtual Coupling concept to each of those segments. To this end, an extensive survey has been performed to collect expert opinions of the European railway industry on potential Virtual Coupling benefits and challenges from the technical, technological and business perspectives. The same survey also features a section dedicated to capture stated preferences to assess the attractiveness to customers of Virtual Coupling operations. Based on the results of the survey, possible market-attractive Virtual Coupling operational scenarios have been defined for each segment. A SWOT analysis has been finally delivered which analyses strengths and weaknesses of the Virtual Coupling concept, and the opportunities and potential threats that could be generated for the railway business. It is worth noticing that results provided in this document might be affected by some bias due to the stratification of the interviewed population which is mostly composed of railway experts. Part of the bias derives from different perspectives of the different industry representatives (e.g. infrastructure managers and railway operators) about a given aspect of the railway business. Another share of the bias might be due to the specific case studies proposed during the interview, which might make obtained results not universally applicable to any railway network belonging to a certain market segment. Results of the survey highlight that in general the concept of Virtual Coupling can make the railway transport mode more attractive to customers, at the condition that the increase in ticket costs (for the higher service frequencies) is restrained. For dedicated high-speed lines with train services having already frequencies of a train every 15 min, the use of Virtual Coupling would not have a significant impact on the modal shift to railways. However, a much bigger impact might be observed if deploying VC on those high-speed connections currently having a lower service frequency per O-D pair (e.g. one train each 30 min). A negligible attractiveness to customers has also been observed for urban/suburban lines where passengers seem to be already satisfied from the service delivered on some metro lines with headways around 1-2 min during peak hours. Although Virtual Coupling seems to give only a marginal gain to passengers of high-speed and urban/suburban lines, railway managers and operators could instead increase the number of train paths and potentially reduce traffic instability and delay propagation, resulting in a possible revenue increase. Virtual Coupling operations are instead very appealing to customers of the main line, regional and freight market segments, where a manifest will to pay more for using a more frequent train service has been recorded. A significant increase of the modal shift has particularly been assessed for the regional segment where the poor train service currently delivered on some lines, makes the customers be willing to pay more to rely on a more frequent and flexible type of train service. The same positive response has been observed for the freight segment where the relevant increase in good transport capacity enabled by Virtual Coupling would make railways a more attractive mode. The introduction of Virtual Coupling has potentials to invert the current modal share by shifting most of the freight transport from road trucks to railways. Such a potential modal shift could occur even if marginal delivery costs might increase due to a higher

G A 8 2 6 3 4 7 P a g e 98 | 121
delivery frequency. On the other hand, Virtual Coupling might mitigate or even nullify marginal delivery costs for increased frequencies, given that the full automation of freight train operations and the V2V communication would remove costs for driving and coupling/decoupling trains at yards. Preliminary operational scenarios have been defined for each market segment by combining survey outcomes with brainstorming sessions and workshops held with representatives of different sectors of the European railway industry. Ranges of “market-effective” service headways have been identified for each segment, together with main operational characteristics such as train compositions, on-board customer facilities, train platforming and crowd management, power supply and control of virtually coupled convoys. For the high-speed, main line and regional segments, train compositions are defined to provide customers with enough seating availability, a standard number of toilettes/seats, silent wagons, a bar/restaurant service and the presence of both first- and second- class coaches. For the urban/suburban segment, trains will be instead composed in such a way to offer sufficient seating, silent wagons as well as first- and second- class coaches. None of those requirements applies instead for freight trains. As mentioned, Virtual Coupling operations might introduce the possibility of having multiple trains (coupled in a convoy) that stop behind each other when stopping at the same platform. Given the frequencies and lengths defined for high-speed, main line and urban/suburban trains, platforms will need to be dedicated to a certain group of destinations. This means that only trains heading to the same destination are allowed to stop behind each other at the same platform when stopping. Because of the lower frequencies of regional trains, platforms can instead allow for trains going to different destinations to queue behind each other when stopping. To enable such operational changes, platforms of all market segments will need to be segregated into sections delimited by boards and/or physical barriers (e.g. turnstiles) and equipped with platform doors. Platform doors are necessary since trains will be crewless (no driver, no conductors) and to help controlling boarding/alighting process of passengers. For all market segments but freight, crew might be only considered to be present at platforms to check tickets or manage platform congestion during special events such as concerts and/or football matches. Whilst the use of DMUs would not raise particular issues when trains run in a virtual coupled convoy, specific operational measures need to be introduced instead for EMUs. High-speed or fast main line trains moving at a short distance from each other within a convoy, might generate mechanical oscillations in the catenary that could be dangerous for the overhead line system and for the rolling stock. Such trains can be powered via the pantograph only if the distance from the pantograph of the train ahead is more than 100 m. Also, the power capacity of the substations might become insufficient to feed many trains moving on the same electrical section. For this reason, the use of on-board batteries needs to be introduced together with regenerative braking to recharge the batteries and/or feed the substation back, during braking. The distance between stations (yards) on high-speed, main lines and freight networks allows trainsoperatingunderVirtualCouplingtocouple“on-the-run”aswellasatstandstillatstations(yards). For regional and urban/suburban railways, the shorter inter-station distance only consents trains to be virtually coupled/decoupled while at a standstill at stations. For all market segments, if distances between consecutive interlocking areas are sufficiently long, then

G A 8 2 6 3 4 7 P a g e 99 | 121
decoupling on-the-run at diverging junctions is possible by imposing an absolute braking distance between trains for switches equipped with current technologies. A shorter train separation such as a relative braking distance can be achieved if instead advanced technologies for super-fast switching are installed (e.g. Railtaxi, REPOINT). For the freight market, a completely new operational setup is proposed where bulk freight trains going from one source to one single destination will have a fixed composition, that is shorter than today’s freight trains to allow higher service frequency and flexibility. Having a higherfrequency of freight trains with a fixed freight train composition will also help solving the current limitation of Train Integrity Monitoring for variable train compositions. For mixed multi-commodity freight trains transporting different types of goods to different destinations, freight trains might instead operate as a single fully automated freight wagon. This single autonomous freight wagon will be able to couple to a convoy at merging junctions and decouple from it at diverging junctions to reach its specific destination. Main outcomes from the SWOT analysis highlight that Virtual Coupling provides clear advantages over plain moving block for all the market segments. An increase in network capacity can be provided together with a potential reduction of operation costs (OPEX) due to full automation of train operations and the substantial reduction in train crew, which depends on the Grade of Automation implemented. Potential strengths also refer to an improved communication with the RBC due to the introduction of the V2V communication layer that might reduce communication latency and increase reliability. Also, the impacts of some type of accidents might be reduced by virtue of the train to train communication which always communication to the train behind what is happening to the train in front. On the other hand, several weaknesses can be mentioned that are valid for all the market segments. For example, an increase in the capital expenditure (CAPEX) is expected to deploy the V2V communication layer and correspondingly upgrade the on-board equipment of the rolling stock. There might be a need of upgrading the overhead line system to allow multiple trainsets to run in a coupled convoy over the same electrical section. Such an upgrade would not just affect the CAPEX but also the design of the electrical power system. Another issue relates to safety at diverging junctions where current switch technology needs trains in a convoy to be outdistanced by an absolute braking distance, which might make capacity gains of Virtual Coupling negligible with respect to plain moving block. Other safety risks also arise for managing trains with different braking parameters that follow each other in the same convoy (e.g. a freight train platooning behind a regional) at a separation which is less than the absolute braking distance. Several market opportunities are brought about by Virtual Coupling. First of all, the increased capacity will open chances for infrastructure managers and railway undertakings to increase their profit. Specifically, turnover of infrastructure managers might increase thanks to a larger availability of train paths that can be sold to TOCs and FOCs. Operational costs are instead envisaged to decrease or at least to remain the same, given that the increased track maintenance due to higher traffic volumes will be compensated by the removal of track-side equipment (e.g. signals, track-clear detection) and the installation of faster more reliable switch technologies. Railway undertakings will be advantaged by an increase in ticket sales due to potentially higher passenger flows and a marginal ticket increase to operate a more frequent service. At the same time, their operational costs will be substantially reduced because of fully automated crewless train operations which will minimise annual costs for personnel salary.

G A 8 2 6 3 4 7 P a g e 100 |
121
Another important opportunity is that a more flexible railway market can be created where passengers and freight carriers have a larger choice of travel alternatives which are no longer constrained by a fixed timetable but based on a regular frequency-based service (like for metros). Such a flexible market is set to attract a significant number of trips from other modes of transport and therefore increase the amount of railway customers, with direct benefits for the wide railway industry in general, as well as for the environment. Also, a deregulation of the railway market is expected which opens opportunities for smaller transport operators to operate smaller feeder trains over specific O-D pairs given the larger availability of train paths provided by Virtual Coupling and the much lower operational costs enabled by fully automatic train operations. Virtual Coupling might also introduce a novel structure in the railway organisation where for example a given railway is no longer operated by one or two competing undertakings but by a cooperative consortium of operators. Such a consortium might be set since trains operated by different companies will need to communicate and share information directly with each other, changing the current role of the infrastructure manager acting as an intermediary between the different operators when managing traffic. Research in economics show that such a model of cooperative consortium has a higher Benefit/Costs ratio than the current competitive model. Beside such advantages, Virtual Coupling also offers the railway industry a chance to accelerate the migration of current control and command systems towards more future-proof digital railway architectures, as well as an upgrade of current switch technologies to faster and more reliable ones. On the other hand, Virtual Coupling might also introduce threats such as a potential increase in ticket fees (needed for delivering a more frequent service) which might not be received well by customers. Also, the V2V communication layer could lead to a higher train control complexity than ETCS Level 3 with risks of approval from the railway industry. Other threats regard the need to partially redesign policies, regulations and engineering rules currently adopted in the railways as well as the necessity of facing additional investment costs to address the safety issues introduced by relative braking distance operations. Outcomes obtained from the SWOT analysis lead towards several recommendations for the railway industry and future research:
A real business case of Virtual Coupling shall be set up to understand potential safety issues arising from convoying and train-to-train communication. Such a business case can be readily implemented since it is already possible to overlay the V2V communication layer over current fixed-block signalling systems, letting trains couple/decouple when at a standstill at stations. Hence, safety and technological testing can be performed already without needing to wait for preliminary infrastructure upgrades to moving block.
Current switch technologies shall be upgraded with faster and more reliable ones (e.g. Railtaxi, REPOINT) to achieve full potential of Virtual Coupling train operations. Initial investments for such infrastructure upgrades will be compensated over time by the significant capacity increase and the substantial reduction in switch maintenance.
The adoption of advanced traffic management systems for optimal traffic control can further increase capacity benefits of Virtual Coupling over moving block by homogenising train traffic behaviour over shared open tracks.
G A 8 2 6 3 4 7 P a g e 101 |
121
The impact of Virtual Coupling on main line capacity needs to be further investigated given that the heterogeneous composition of the train traffic might reduce the expected gains over plain moving block signalling.
Applicability of Virtual Coupling to the urban/suburban segment requires a deeper analysis of the economic benefits to railway stakeholders, since these might not be more attractive than moving block operations from the customer perspective.

G A 8 2 6 3 4 7 P a g e 102 |
121
References [1] IEA, The Future of Rail – Opportunities for energy and the environment, International
Energy Agency (IEA) in collaboration with UIC, IEA Publications, January 2019.
[2] Shift2Rail (S2R), IP2 Projects, MOVINGRAIL. Retrieved from
https://projects.shift2rail.org/s2r_ip2_n.aspx?p=MOVINGRAIL.
[3] MOVINGRAIL (MOving block and Virtual coupling New Generations of RAIL signalling),
S2R-OC-IP2-01-2018 – Analysis for Moving Block and implementation of Virtual Coupling
concept, Proposal Technical Annex 1-3, 2018.
[4] ECORYS Research and Consulting, Sector Overview and Competitiveness Survey of the
Railway Supply Industry, Within the Framework Contract of Sectoral Competitiveness
Studies – ENTR 06/054, Rotterdam, May 2012.
[5] Schut D., Wisniewski J., with the support of IRRB Members, A Global Vision for Railway
Development, UIC Communication Department, International Railway Research Board
(IRRB) and UIC (International Union of Railways), Paris, November 2015.
[6] Leboeuf M., High Speed Rail – Fast Track to Sustainable Mobility, UIC Passenger
Department, 2018.
[7] CBS, T.B.P.M. Tjin-A-Tsoi, Transport and Mobility, Statistics Netherlands, 2015.
[8] KiM Netherlands Institute for Transport Policy Analysis, Ministry of Infrastructure and
Water Management, 2018.
[9] Kronberg, N., et al., Transport Statistics for Great Britain, D.f. Transport, Editor. 2018:
London.
[10] RailSystem (2015), Communications-Based Train Control (CBTC). Retrieved from
http://www.railsystem.net/communications-based-train-control-cbtc/.
[11] Pachl J., Railway Operation and Control, VTD Rail Publishing, USA, December 2004.
[12] Theeg G. and Vlasenko S., Railway Signalling & Interlocking, International Compendium,
Eurail press, Germany, 2009.
[13] Furness N., van Houten H., Arenas L., Bartholomeus M., ERTMS Level 3: the Game-
Changer, IRSE News, Issue 232, pp. 1-8, 2017.
[14] Quaglietta E. Wang M., Goverde R.M.P., A multi-state train-following model for the
analysis of Virtual Coupling railway operations, Forthcoming at the 8th International
Conference on Railway Operation modelling and analysis, RailNorrkoping, 17th-20th June,
2019.
[15] Quaglietta E., Analysis of Platooning Train Operations under V2V Communication-Based
Signaling: Fundamental Modelling and Capacity Impacts of Virtual Coupling,
Transportation Research Board: The TRIS and ITRD database, December 2018.
[16] European Environment Agency, Passenger Transport Demand, Outlook from WBCSD,
https://www.eea.europa.eu/data-and-maps/indicators/passenger-transport-demand-
outlook-from-wbcsd/passenger-transport-demand-outlook-from, last accessed July, the
1st , 2019.

G A 8 2 6 3 4 7 P a g e 103 |
121
[17] Mitchell et al., ERTMS Level 4, Train Convoys or Virtual Coupling, International Technical
Committee, Report on topic 39, IRSE (Institution Railway Signal Engineers), IRSE News,
Issue 219, February 2016.
[18] Shift2Rail Joint Undertaking Multi-Annual Action Plan, Brussels, November 2015.
[19] UIC (International Union of Railways), High speed rail – Fast track to sustainable mobility,
Paris, November 2010. Retrieved from www.uic.org/highspeed.
[20] TeodorovićD.andJanićM.,TransportationEngineering– Theory, Practice and Modeling,
Butterworth-Heinemann, Elsevier, 2017.
[21] Emery D., Headways on High Speed Lines, Ecole Polytechnique Fédérale de Lausanne,
LITEP Group, Station 18 – EPFL – CH-1015 Lausanne – Switzerland, Meeting the
challenges for future mobility, Challenge F: Even more trains even more on time, 9th
World Congress on Railway Research, May 22-26, 2011, WCRR, Lille, France.
[22] UNIFE, the European Rail Industry Association, A driver for EU competitiveness and
sustainable mobility worldwide, Facts on the Rail Supply Industry.
[23] 2019 HS1 Network Statement. 2018, HS1 Limited: London.
[24] Fox J. , Hirsch P., Smith C, Kanike O., National Cooperative Highway Research Program
Report 773: Capacity Modeling Guidebook for Shared-Use Passenger and Freight Rail
Operations, Transportation Research Board. p. 87, Washington DC, April 17, 2019.
[25] Irish Department for Transport, Report of the Investigation into the Accident on the CIE
Railway at Buttevant, Co. Cork, on 1st August 1980, p. 31, 1981.
[26] Goddard, A., Rail infrastructure, assets and environmental 2017-18 Annual Statistical
Release. 2018, Office of Rail and Road: London.
[27] Trepat J., Transport News from Around the World (and from the Netherlands), Fly-Over,
Study Association Magazine – Dispuut Verkeer – T&P – TIL – TU Delft, Volume 28. Edition
III, p.38, April 2019.
[28] Long Term Planning Process: Regional Urban Market Study. 2013, Network Rail: London.
[29] Freight and National Passenger Operators Route Strategic Plan. 2018, Network Rail:
London.
[30] Freight Network Study Long Term Planning Process. 2017, Network Rail: London.
[31] Khalid U. A., Bachok S., Osman M.M., Ibrahim M., User perceptions of Rail Public
Transport Service in Kuala Lumpur, Malaysia: KTM Komuter, Procedia - Social and
Behavioural Sciences, Vol. 153, pp.566-573, 2014.
[32] Cheng Y., Tsai Y., Train delay and perceived-waittime:passengers’perspective,Transport
Reviews, Vol. 34 (6), pp. 710-729, 2014.
[33] Bemmet S., Repoint: revolutionising track switch, Rail Technology Magazine, January
2019: http://www.railtechnologymagazine.com/Comment/repoint-revolutionising-track-
switch-, last accessed on 9th July 2019.
[34] Igenieur Müller Büro, Railtaxi, https://www.astrail.de/bahntaxe.htm, last accessed 12th
July 2019.

G A 8 2 6 3 4 7 P a g e 104 |
121
[35] Root F., Visudtibhan K., International Strategic Management: Challenges and
Opportunities, Taylor and Francis, New York, 1992.
[36] MilenkovićM., Bojović N., Railway demand forecasting, In: Handbook of on emerging
innovations in rail transportation engineering, IGI Global, Pennsylvania, USA, 2016
[37] Next the future of Mobility, https://www.next-future-mobility.com, last accessed 16th
July 2019.

G A 8 2 6 3 4 7 P a g e 105 |
121
Appendices
MOVINGRAIL Survey for Virtual Coupling (VC)
1) Your age: ( ) <18
( ) 18-21
( ) 22-35
( ) 36-49
( ) 50+
2) Your gender: ( ) Male
( ) Female
3) Your socio-professional category: [ ] Employer/Employee
[ ] Student/PhD
[ ] Teacher/Professor
[ ] Merchant/Trader
[ ] Freelancer
[ ] Other (Specify): _________________________________________________
4) Do you have expert/advanced knowledge about railways? ( ) Yes
( ) No
5) Please specify which railway company/institution you work for: [ ] University/Research Institute
[ ] Infrastructure manager
[ ] Train Operating Company (Railway Undertaking)
[ ] Freight operating company

G A 8 2 6 3 4 7 P a g e 106 |
121
[ ] Signalling/Manufacturing company
[ ] Governmental/European Railway Agency/Association
[ ] Other (Specify): _________________________________________________
6) Which city/town do you currently live in? _________________________________________________
7) What distance do you cover in your one-way routine trips? ()≤20km
( ) Between 20 and 30 km
( ) Between 30 and 100 km
( ) Between 100 and 200 km
( ) Between 200 and 300 km
( ) Between 300 and 600 km
( ) Between 600 and 900 km
( ) > 900 km
8) How much time do you spend on your one-way routine trips? ()≤15minutes
( ) Between 15 and 30 minutes
( ) Between 30 minutes and 1 hour
( ) Between 1 and 2 hours
( ) > 2 hours
9) How much do you spend on your one-way routine trips monthly? ()≤€50
()€51– €70
()€71– €100
()€101– €200
()>€200
10) Which activities do you travel for daily? [ ] Work/Study
[ ] Leisure

G A 8 2 6 3 4 7 P a g e 107 |
121
[ ] Sport
[ ] Other (Specify): _________________________________________________
11) Which mean(s) of transport do you regularly use to perform the activities reported in the previous question? [ ] Bike
[ ] Bus
[ ] Car
[ ] Taxi
[ ] Train
[ ] Walking
[ ] Other (Specify): _________________________________________________
12) Please Specify the type(s) of train you use the most: [ ] High Speed
[ ] Intercity (Conventional)
[ ] Regional/Local
[ ] Metro
[ ] Light Rail
[ ] Tram
[ ] Other (Specify): _________________________________________________
13) State the reason(s) why you travel by train: [ ] More comfortable than a car
[ ] Safer than a car
[ ] Time saving (e.g. working in the train)
[]Can’taffordcostofacar
[ ] Freedom of standing/walking during travel
[ ] Do not hold a driving license
[ ] No parking at destination
[ ] Other (Specify): _________________________________________________
14) State the reason(s) why you travel by car: [ ] Faster than public transport

G A 8 2 6 3 4 7 P a g e 108 |
121
[ ] More privacy
[ ] Less intermodal transfers
[ ] Live close to destination
[ ] Ease of handling luggage
[ ] More comfortable
[ ] Wider choice of departure date and time
[ ] Wider choice of route
[ ] There is no railway connection between my origin and destination
[ ] Other (Specify): _________________________________________________
15) State the reason(s) why you travel by bike: [ ] Live close to destination
[ ] More privacy than public transport
[ ] Faster than public transport
[ ] Less intermodal transfers
[ ] More comfortable
[ ] Healthy
[ ] Wider choice of departure date and time
[ ] Wider choice of route
[ ] There is no railway connection between my origin and destination
[ ] Other (Specify): _________________________________________________
16) State the reason(s) why you prefer walking: [ ] Live close to destination
[ ] More privacy than public transport
[ ] Less intermodal transfers
[ ] Healthy
[ ] Wider choice of departure date and time
[ ] Wider choice of route
[ ] There is no railway connection between my origin and destination
[ ] Other (Specify): _________________________________________________
17) State the reason(s) why you travel by bus: [ ] Less intermodal transfers

G A 8 2 6 3 4 7 P a g e 109 |
121
[ ] Live close to destination
[ ] More comfortable
[ ] Wider choice of departure date and time
[ ] Wider choice of route
[ ] There is no railway connection between my origin and destination
[ ] Other (Specify): _________________________________________________
18) Are there any trains running between the origin and destination of your routine trips? ( ) Yes
( ) No
19) Please specify the train frequency from your origin: ( ) Every 1 hour or more
( ) Every 30 minutes
( ) Every 20 minutes
( ) Every 15 minutes
( ) Every 10 minutes
( ) Every 5 minutes
( ) Every 3 minutes
( ) Every less than 3 minutes
20) Imagine that you are able to use a new train service having the same travel time of the train currently running from your origin to destination but having a frequency of 22 minutes instead of 1 hour or more, as you previously mentioned. Would you consider shifting from your current mode of transport to the new train service if you would need to pay 20% more than the current ticket? ( ) Yes (Specify the reason): _________________________________________________
( ) No (Specify the reason): _________________________________________________
21) Imagine that you are able to use a new train service having the same travel time of the train currently running from your origin to destination but having a frequency of 11 minutes instead of 30 minutes, as you previously mentioned. Would you consider shifting from your current mode of transport to the new train service if you would need to pay 20% more than the current ticket? ( ) Yes (Specify the reason): _________________________________________________
( ) No (Specify the reason): _________________________________________________
G A 8 2 6 3 4 7 P a g e 110 |
121
22) Imagine that you are able to use a new train service having the same travel time of the train currently running from your origin to destination but having a frequency of 7 minutes instead of 20 minutes, as you previously mentioned. Would you consider shifting from your current mode of transport to the new train service if you would need to pay 20% more than the current ticket? ( ) Yes (Specify the reason): _________________________________________________
( ) No (Specify the reason): _________________________________________________
23) Imagine that you are able to use a new train service having the same travel time of the train currently running from your origin to destination but having a frequency of 6 minutes instead of 15 minutes, as you previously mentioned. Would you consider shifting from your current mode of transport to the new train service if you would need to pay 20% more than the current ticket? ( ) Yes (Specify the reason): _________________________________________________
( ) No (Specify the reason): _________________________________________________
24) Imagine that you are able to use a new train service having the same travel time of the train currently running from your origin to destination but having a frequency of 4 minutes instead of 10 minutes, as you previously mentioned. Would you consider shifting from your current mode of transport to the new train service if you would need to pay 20% more than the current ticket? ( ) Yes (Specify the reason): _________________________________________________
( ) No (Specify the reason): _________________________________________________
25) Imagine that you are able to use a new train service having the same travel time of the train currently running from your origin to destination but having a frequency of 2 minutes instead of 5 minutes, as you previously mentioned. Would you consider shifting from your current mode of transport to the new train service if you would need to pay 12% more than the current ticket? ( ) Yes (Specify the reason): _________________________________________________
( ) No (Specify the reason): _________________________________________________
26) Imagine that you are able to use a new train service having the same travel time of the train currently running from your origin to destination but having a frequency of 1 minutes instead of 3 minutes, as you previously mentioned. Would you consider shifting from your current mode of transport to the new train service if you would need to pay 12% more than the current ticket? ( ) Yes (Specify the reason): _________________________________________________
( ) No (Specify the reason): _________________________________________________

G A 8 2 6 3 4 7 P a g e 111 |
121
27) Imagine that you are able to use a new train service having the same travel time of the train currently running from your origin to destination but having a frequency of 30 seconds instead of less than 3 minutes, as you previously mentioned. Would you consider shifting from your current mode of transport to the new train service if you would need to pay 12% more than the current ticket? ( ) Yes (Specify the reason): _________________________________________________
( ) No (Specify the reason): _________________________________________________
28) Imagine that you are able to use a new train service having the same travel time of the train currently running from your origin to destination but having a frequency of 22 minutes instead of 1 hour or more, as you previously mentioned. Would you consider using the new train service if you would need to pay 20% more than the current ticket? ( ) Yes (Specify the reason): _________________________________________________
( ) No (Specify the reason): _________________________________________________
29) Imagine that you are able to use a new train service having the same travel time of the train currently running from your origin to destination but having a frequency of 11 minutes instead of 30 minutes, as you previously mentioned. Would you consider using the new train service if you would need to pay 20% more than the current ticket? ( ) Yes (Specify the reason): _________________________________________________
( ) No (Specify the reason): _________________________________________________
30) Imagine that you are able to use a new train service having the same travel time of the train currently running from your origin to destination but having a frequency of 7 minutes instead of 20 minutes, as you previously mentioned. Would you consider using the new train service if you would need to pay 20% more than the current ticket? ( ) Yes (Specify the reason): _________________________________________________
( ) No (Specify the reason): _________________________________________________
31) Imagine that you are able to use a new train service having the same travel time of the train currently running from your origin to destination but having a frequency of 6 minutes instead of 15 minutes, as you previously mentioned. Would you consider using the new train service if you would need to pay 20% more than the current ticket? ( ) Yes (Specify the reason): _________________________________________________
( ) No (Specify the reason): _________________________________________________

G A 8 2 6 3 4 7 P a g e 112 |
121
32) Imagine that you are able to use a new train service having the same travel time of the train currently running from your origin to destination but having a frequency of 4 minutes instead of 10 minutes, as you previously mentioned. Would you consider using the new train service if you would need to pay 20% more than the current ticket? ( ) Yes (Specify the reason): _________________________________________________
( ) No (Specify the reason): _________________________________________________
33) Imagine that you are able to use a new train service having the same travel time of the train currently running from your origin to destination but having a frequency of 2 minutes instead of 5 minutes, as you previously mentioned. Would you consider using the new train service if you would need to pay 12% more than the current ticket? ( ) Yes (Specify the reason): _________________________________________________
( ) No (Specify the reason): _________________________________________________
34) Imagine that you are able to use a new train service having the same travel time of the train currently running from your origin to destination but having a frequency of 1 minutes instead of 3 minutes, as you previously mentioned. Would you consider using the new train service if you would need to pay 12% more than the current ticket? ( ) Yes (Specify the reason): _________________________________________________
( ) No (Specify the reason): _________________________________________________
35) Imagine that you are able to use a new train service having the same travel time of the train currently running from your origin to destination but having a frequency of 30 seconds instead of less than 3 minutes, as you previously mentioned. Would you consider using the new train service if you would need to pay 12% more than the current ticket? ( ) Yes (Specify the reason): _________________________________________________
( ) No (Specify the reason): _________________________________________________
36) If you could use the newly introduced train services with higher frequency by paying the same standard train ticket price for your specified trip, then would you consider shifting from your current mode of transport? ( ) Yes (Specify the reason): _________________________________________________
( ) No (Specify the reason): _________________________________________________
37) If you could use the newly introduced train services with with higher frequency by paying the same standard train ticket price for your specified trip, then would you consider using these trains? ( ) Yes (Specify the reason): _________________________________________________

G A 8 2 6 3 4 7 P a g e 113 |
121
( ) No (Specify the reason): _________________________________________________
38) How frequent do you use railways? ( ) Daily
( ) Weekly
( ) Monthly
( ) Occasionally
( ) Never
39) For which activities do you use railways? [ ] Leisure
[ ] Sports
[ ] Visiting family/friends
[ ] Business/Study
[ ] Other (Specify): _________________________________________________
40) CASE STUDY 1 - High Speed, IT Suppose you live nearby Roma and you want to travel daily to Bologna (190 mi or 305 km), which means of transport ("Option") would you consider as your first choice and which one would be your last choice?
A B C D
First choice - - - -
Last choice - - - -
41) Imagine that you are able to use a new train service having the same travel time of the current train running from Roma to Bologna. Would you be willing to pay €5.50 more than the current train ticket if the new train service runs as frequent as 6 minutes?

G A 8 2 6 3 4 7 P a g e 114 |
121
( ) Yes (Specify the reason): _________________________________________________
( ) No (Specify the reason): _________________________________________________
42) Would you be willing to use the new train service if instead the ticket price would remain the same? ( ) Yes (Specify the reason): _________________________________________________
( ) No (Specify the reason): _________________________________________________
43) CASE STUDY 2 - Main Line, UK Suppose you live nearby London Waterloo and you want to travel daily to Southampton (79 mi or 127 km), which means of transport ("Option") would you consider as your first choice and which one would be your last choice?
A B C
First choice - - -
Last choice - - -
44) Imagine that you are able to use a new train service having the same travel time of the current train running from London Waterloo to Southampton. Would you be willing to pay £4.85 more than the current train ticket if the new train service runs as frequent as 11 minutes?
( ) Yes (Specify the reason): _________________________________________________
( ) No (Specify the reason): _________________________________________________
45) Would you be willing to use the new train service if instead the ticket price would remain the same? ( ) Yes (Specify the reason): _________________________________________________
( ) No (Specify the reason): _________________________________________________

G A 8 2 6 3 4 7 P a g e 115 |
121
46) CASE STUDY 3 - Regional, UK Suppose you live nearby Leicester and you want to travel daily to Peterborough (52 mi or 84 km), which means of transport ("Option") would you consider as your first choice and which one would be your last choice?
A B C
First choice - - -
Last choice - - -
47) Imagine that you are able to use a new train service having the same travel time of the current train running from Leicester to Peterborough. Would you be willing to pay £2.30 more than the current train ticket if the new train service runs as frequent as 22 minutes?
( ) Yes (Specify the reason): _________________________________________________
( ) No (Specify the reason): _________________________________________________
48) Would you be willing to use the new train service if instead the ticket price would remain the same? ( ) Yes (Specify the reason): _________________________________________________
( ) No (Specify the reason): _________________________________________________
49) CASE STUDY 4 - Urban, UK Suppose you live nearby London Lancaster and you want to travel daily to London Liverpool Street (4.3 mi or 7 km), which means of transport ("Option") would you consider as your first choice and which one would be your last choice?

G A 8 2 6 3 4 7 P a g e 116 |
121
A B C D E
First choice - - - - -
Last choice - - - - -
50) Imagine that you are able to use a new train service having the same travel time of the current train running from London Lancaster to Liverpool. Would you be willing to pay £0.30 more than the current train ticket if the new train service runs as frequent as 45 seconds?
( ) Yes (Specify the reason): _________________________________________________
( ) No (Specify the reason): _________________________________________________
51) Would you be willing to use the new train service if instead the ticket price would remain the same? ( ) Yes (Specify the reason): _________________________________________________
( ) No (Specify the reason): _________________________________________________
52) Based on your selected choices to the previous questions, what was the most important factor for your decision? ( ) Mode of travel
( ) Travel cost
( ) Travel time
( ) Frequency of service
( ) Environment
( ) Other (Specify): _________________________________________________
53) CASE STUDY 5 - Freight, DE-NL If you want to transport regularly 3 tons of household goods from Hamburg to Rotterdam (313 mi or 503 km), which means of transport ("Option") would you consider as your first choice and which one would be your last choice?

G A 8 2 6 3 4 7 P a g e 117 |
121
A B C D
First choice - - - -
Last choice - - - -
54) Let's consider that for every trip from Hamburg to Rotterdam, you can only deliver 8 containers and the maximum trips you can make by means of freight trains is 3 per day (resulting in 24 containers per day). Imagine that you are able to transport your goods by means of a new train service having a frequency of 7 freight trains per day (resulting in 56 containers per day). Would you consider using the new train service if you will need to deliver more containers per day (higher cost of delivery) to maintain the same profit? ( ) Yes (Specify the reason): _________________________________________________
( ) No (Specify the reason): _________________________________________________
55) Would you consider delivering your goods by means of automated freight trains so that train units would virtually couple and decouple at junctions to reach the required destinations? ( ) Yes (Specify the reason): _________________________________________________
( ) No (Specify the reason): _________________________________________________
56) In case VC is introduced and all trains will become shorter in length, which kind of services/facilities would you like to find on trains for each of the Market Segments (MSs)? Please tick no more than three facilities per MS.
High
Speed Main Line
Regional Urban/Suburban Freight
Longer trains [ ] [ ] [ ] [ ] [ ]
Bar/restaurant [ ] [ ] [ ] [ ] [ ]
Specific number of toilets
[ ] [ ] [ ] [ ] [ ]
Silent wagons [ ] [ ] [ ] [ ] [ ]

G A 8 2 6 3 4 7 P a g e 118 |
121
Separated trains for first and second classes
[ ] [ ] [ ] [ ] [ ]
Mixed first and second class wagons
[ ] [ ] [ ] [ ] [ ]
Enter another option
[ ] [ ] [ ] [ ] [ ]
Enter another option
[ ] [ ] [ ] [ ] [ ]
57) Virtual Coupling introduces the possibility of more frequent/flexible services. However this might lead to have shorter trains having a limited amount/availability of facilities (e.g. toilets, restaurant/bar, first class wagons, etc.) currently available on trains. For which market scenario would you be willing to accept a limited availability of facilities for a more frequent and flexible train service?
Long trains with all facilities (No care of frequency)
Shorter trains with limited facilities (care of frequency)
High Speed ( ) ( )
Main Line ( ) ( )
Regional ( ) ( )
Urban/Suburban ( ) ( )
Freight ( ) ( )
58) Imagine having different trains on the same platform that go into the same line and then each train goes to a different direction, would this cause confusion to you in picking the right train to your destination? ( ) Yes
( ) No
59) Which solution would you prefer to help you boarding the right train? ( ) Separation of platform into sections delimited by boards
( ) Separation of platform into sections delimited by physical barriers (such as walls or gates)
( ) Separation of platform into sections delimited by physical barriers and platform doors opening only where one of the queuing trains is boarding

G A 8 2 6 3 4 7 P a g e 119 |
121
( ) Other (Specify): _________________________________________________
60) According to you, which market segments do you think Virtual Coupling can provide benefit with respect to ETCS Level 3 Moving Block and current fixed-block signalling? [ ] All of the Market Segments
[ ] High Speed passenger rail
[ ] Conventional/Main line passenger rail
[ ] Regional passenger rail
[ ] Urban/Suburban passenger rail
[ ] Freight rail
[ ] None of the above
61) What is/are the reason(s) of your previous choice(s)? [ ] Increase capacity
[ ] Increase safety
[ ] Increase punctuality
[ ] Increase energy efficiency
[ ] I do not believe that VC can provide any relevant benefit
[ ] Other (Specify): _________________________________________________
62) Why do you think that VC is not applicable to the Market Segments you did not choose? ____________________________________________
____________________________________________
____________________________________________
____________________________________________
63) What do you think are the main technical challenges to the implementation of VC for each market segment? Tick your options correspondingly based on the given challenges for each market segment.
High
Speed Main Line
Regional Urban/Suburban Freight
V2V (Vehicle to Vehicle) communication
[ ] [ ] [ ] [ ] [ ]

G A 8 2 6 3 4 7 P a g e 120 |
121
architecture
Safety at diverging/merging junctions
[ ] [ ] [ ] [ ] [ ]
ATO (Automatic Train Operation)
[ ] [ ] [ ] [ ] [ ]
Incompatibility with current policy/regulations of railways
[ ] [ ] [ ] [ ] [ ]
Incompatibility with current infrastructure and/or interlocking
[ ] [ ] [ ] [ ] [ ]
Enter another option
[ ] [ ] [ ] [ ] [ ]
Enter another option
[ ] [ ] [ ] [ ] [ ]
64) What do you think should be done to overcome the challenge(s) you pointed out? ____________________________________________
____________________________________________
____________________________________________
____________________________________________
65) CapEx (Capital Expenditure) represents the investment costs to buy tools/equipment for railways, while OpEx (Operational Expenditure, also known as revenue expenditure) represents the operating costs including employee wages, repair and maintenance of equipment, rental fees, utility bills, etc. How do you expect VC is going to impact the railway business in terms of CAPEX and OPEX for each Market Segment (MS)? Please read the below description for more clarification: • “↗” - the selected MS would increase CAPEX/OPEX • “↘” - the selected MS would decrease CAPEX/OPEX

G A 8 2 6 3 4 7 P a g e 121 |
121
• “=” - the selected MS would make no difference to CAPEX/OPEX.
CAPEX OPEX
↗ ↘ = ↗ ↘ =
High Speed ( ) ( ) ( ) ( ) ( ) ( )
Main Line ( ) ( ) ( ) ( ) ( ) ( )
Regional ( ) ( ) ( ) ( ) ( ) ( )
Urban/Suburban ( ) ( ) ( ) ( ) ( ) ( )
Freight ( ) ( ) ( ) ( ) ( ) ( )
66) What are the reasons why you selected your choices about CAPEX & OPEX? ____________________________________________
____________________________________________
____________________________________________
____________________________________________