Deliverable 4 The typology of buildings which will still ... · 1.5.2. Results ... reduction by 2...
89
Factor 4 project –IEEA Agreement n° EIE/05/076/S12.419636 – Deliverable 4 – October 2006 1 Programme of actions towards Factor 4 in existing social housings in Europe Deliverable 4 The typology of buildings which will still be in use in 2050, the estimation of greenhouse effect gas (GEG) emissions from the social housing building stock and the selection of criteria for choosing the representative buildings March 2007 www.suden.org Authors: Philippe OUTREQUIN [email protected] for France and the scientific coordination Crdd La Calade, Ole JANSEN [email protected] for Denmark Cenergia Reinahard JANK [email protected] for Germany Volkswohnung Roberto FABBRI (ABITA) and Sergio BOTTIGLIONI [email protected] for Italy ABITA and Ricerca & Progetto Jana SULER [email protected] for Romania APDL Project partly funded by the EUROPEAN COMMISSION – Intelligent Energy Executive Agency Grant agreement EIE/05/076/S12.419636
Transcript of Deliverable 4 The typology of buildings which will still ... · 1.5.2. Results ... reduction by 2...

Factor 4 project –IEEA Agreement n° EIE/05/076/S12.419636 – Deliverable 4 – October 2006
1
Programme of actions towards Factor 4 in existing social housings in Europe
Deliverable 4
The typology of buildings which will still be in use in 2050, the estimation of greenhouse effect gas
(GEG) emissions from the social housing building stock and the selection of criteria for choosing the
representative buildings
March 2007
www.suden.org
Authors:
Philippe OUTREQUIN
for France and the
scientific coordination
Crdd La Calade,
Ole JANSEN [email protected] for Denmark Cenergia
Reinahard JANK
for Germany Volkswohnung
Roberto FABBRI (ABITA) and Sergio
BOTTIGLIONI [email protected]
for Italy ABITA and Ricerca &
Progetto
Jana SULER [email protected] for Romania APDL
Project partly funded by the
EUROPEAN COMMISSION – Intelligent Energy Executive Agency
Grant agreement EIE/05/076/S12.419636
Factor 4 project –IEEA Agreement n° EIE/05/076/S12.419636 – Deliverable 4 – October 2006
2
Factor 4 – Deliverable 4
The typology of buildings which will still be in use in 2050, the estimation of greenhouse effect
gas (GEG) emissions from the social housing building stock and the selection of criteria for
choosing the representative buildings
March 2007
Under contribution by
Name of experts Countries Partners
Frederic Groulet
frederic.groulet@union-
habitat.org
(and experts from USH such as Brigitte Brogat)
for France Union Sociale pour
l’Habitat
(USH)
Catherine Charlot– Valdieu
for France and the
coordination of the work
Sustainable Urban
Development European
Network (SUDEN)

Factor 4 project –IEEA Agreement n° EIE/05/076/S12.419636 – Deliverable 4 – October 2006
3
Summary
1. THE FACTOR 4 PROJECT ...................................................................................................................... 5 1.1. project summary................................................................................................................................ 5 1.2. The factor 4 partners ......................................................................................................................... 5 1.3. Reminder upon the Factor 4 work programme ................................................................................. 6
2. THE SOCIAL HOUSING STOCK TO RENOVATE.................................................................................. 8
2.1. Reminder of the overall typology (deliverable 3) ............................................................................... 8 2.2. The objectives of this selected typology ............................................................................................ 8 2.3. The selection of criteria ..................................................................................................................... 8
PART 1 FRANCE.......................................................................................................................................... 9
1.1. Reminder upon the typology for France ............................................................................................ 9 1.1.1. The main criteria ...................................................................................................................... 9 1.1.2. Secondary criteria .................................................................................................................. 10
1.2. The French social housing building stock ....................................................................................... 12 1.3. Evaluation of energy consumptions and CO2 emissions per housing unit in each selected category16 1.4. energy consumptions and CO2 émissions analysis ......................................................................... 17 1.5. scénarii upon démolition as well as upon the évolution of the social housing building stock .......... 21
1.5.1. The selected hypotheses ...................................................................................................... 21 1.5.2. Results ................................................................................................................................... 24
1.6. The selected typologies for the French case studies ...................................................................... 26 1.7. Some selected French case studies ............................................................................................... 27
PART 2 - DENMARK.................................................................................................................................. 31
2.1. Reminder upon the typology for Denmark....................................................................................... 31 2.1.1. The main criteria selected...................................................................................................... 31 2.1.2. The secondary criteria ........................................................................................................... 32
2.2. The Danish social housing stock ..................................................................................................... 32 2.3. Evaluation of energy consumption and CO2 emissions per housing unit in each selected category36 2.4. Energy consumption and CO2 emissions analysis .......................................................................... 44 2.5. Working out scenary on the demolition as well as the evaluation of the social housing stock........ 44 2.6. The selected typologies for the Danish case studies ..................................................................... 47 2.7. The Danish selected case studies................................................................................................... 47
PART 3 : ITALY.......................................................................................................................................... 49
3.1. The Italian social housing building stock ......................................................................................... 49 3.2. The analysis of energy consumption and of CO2 emissions ........................................................... 52 3.3. Demolition scenarii and their impacts.............................................................................................. 52 3.4. The selected criteria for the typology............................................................................................... 53 3.5. Description of the italian case studies selected............................................................................... 57
PART 4 - GERMANY.................................................................................................................................. 65
4.1. Reminder upon the typology for Germany....................................................................................... 65 The criteria selected ........................................................................................................................ 65 4.1.1. The main criteria .................................................................................................................... 67 4.1.2. The secondary criteria ........................................................................................................... 67
4.2. The German social housing building stock...................................................................................... 67 4.3. The analysis of energy consumption and of CO2 emissions ........................................................... 69 4.4. Demolition scenarii and their impacts.............................................................................................. 71 4.5. The selected hypotheses and the selection of case studies ........................................................... 72
PART 5 : THE VRANCEA COUNTY IN ROMANIA ................................................................................... 79
5.1. Reminder upon the typology for Romania ....................................................................................... 79

Factor 4 project –IEEA Agreement n° EIE/05/076/S12.419636 – Deliverable 4 – October 2006
4
5.1.1. The main criteria selected...................................................................................................... 79 5.1.2. The secondary criteria ........................................................................................................... 80
5.2. The social housing context .............................................................................................................. 81 5.3. The social housing profile................................................................................................................ 83 5.4. The analysis of energy consumption ............................................................................................... 84 5.5. Future scenarios ............................................................................................................................. 86 5.6. The selection of cases studies ........................................................................................................ 87
Factor 4 project –IEEA Agreement n° EIE/05/076/S12.419636 – Deliverable 4 – October 2006
5
1. THE FACTOR 4 PROJECT
The European project Factor 4 or Programme of actions towards Factor 4 in existing social
housings in Europe is supported by the Intelligent Energy Executive Agency in the SAVE programme in 2006. 1.1. PROJECT SUMMARY
The Factor 4 project follows the Sustainable Development World Strategy developed since the last Earth summit at Johannesburg in 2002, and so it aims at working out, on the one hand, a decision aid tool for a
long term assets’ management of the building stock, and on the other hand, recommendations for all the actors concerned.
The project’s objective is to help social owners to define sustainable strategies for their building stock, id est aiming at the reduction of greenhouse effect gas (GEG) emissions which contribute to factor 4, that is to say to the European and French policies towards the reduction of greenhouse effect gas emissions by 4 before 2050.
Of course, all the existing buildings cannot divide GEG emissions by a factor 4 in the next years (a factor 2 objective). The project aims at defining a strategy with mid term actions and at identifying the various barriers and especially non technical ones.
This Factor 4 project deals with existing social housing buildings which will still be in use in 2030-2050. Its objective is to improve their energy efficiency by a minimum of 30 % in a short term and more in a long term. It also deals with the use of renewable energies, in order to participate to the reduction of greenhouse gas emission (GEG) by a factor 4 before 2050.
The first step consists in working out a typology of the buildings in order to identify representative buildings (and by the way to estimate the efforts to do in order to reach the factor 4) and then the Factor 4 project objective is to work out a Factor 4 model for dealing with a life cycle energy cost analysis of these representative buildings in order to give elements for setting up sustainable strategies for the national (or regional) building stocks and for each social housing building stock and, at least, to suggest technical and non technical recommendations for the retrofitting of social housing buildings which will still be there in 2030-2050 (named “2050 buildings”)…
The Factor 4 project also aims at involving public and private owners (including public administration and local authorities) in managing themselves similar actions and in working out financial actions, new rules, new regulation, etc. towards this overall common objective as regarding the reduction of GEG emissions by a factor ..
1.2. THE FACTOR 4 PARTNERS
The project is coordinated by SUDEN (Sustainable Urban Development European Network, a European network registered as a non profit association, www.suden.org) and gathers the following partners (the social owners are underlined) :
• SUDEN association or network
• Union Sociale pour l’Habitat, USH, (France)
• HTC, (France)
• Crdd La Calade
• Cenergia (Denmark)
• Ricerca e Progetto (Italy)

Factor 4 project –IEEA Agreement n° EIE/05/076/S12.419636 – Deliverable 4 – October 2006
6
• Volkswohnung (Germany)
• Moulins Habitat (France)
• Association of the Local Development Promotors, APDL (Romania)
• Soc Coop ABITA ARL (Italy)
• KAB (Denmark)
1.3. REMINDER UPON THE FACTOR 4 WORK PROGRAMME
This project includes several work packages. This deliverable 4 is a part of the following work packages :
a) Step 1: Typological analysis and energy diagnosis for the “2050 buildings”
A typological analysis must be done to allow a selection of representative buildings or case studies (among buildings which will still be in use in 2050 because a sustainable strategy is a long term strategy).
This typology will use a battery of criteria available in existing surveys, to be precisely defined and supplemented such as, for example: the construction date, the general morphology of the buildings (size of the units, number of units with the same number of rooms, numbers of floors per building), the location of the buildings (city centre or suburbs), the building process, the heating system…
A prospective analysis is working out in order to define the building types which should be in use in 2030-2050.
The outcomes of this step are :
- the selection of criteria to choose the representative buildings for the Factor 4 case studies,
- a typology of the social housing building stock (worked out by HTC for France),
- a prospective analysis about demolition as regarding social housing
- the estimation of the social housing building stock energy consumption and of its greenhouse gas emissions
- the final Factor 4 typology with the representative building types and the selected Factor 4 representative buildings (usually named case studies) in the various countries of the Factor 4 partners (12 to 15 case studies for France, 6 to 8 for Italy and Germany and 3 to 4 for Denmark).
b) Step 2 : the building scale analysis
The building case studies selected are representative buildings and will be analysed. For each case study the energetic analysis will deal with:
• Energy consumptions for heating and lighting will be assessed (mainly measured but also estimated): based on energy bills and through tenants’ enquiries for the other individual electric consumptions.
• Potential energy savings measures or solutions will be then suggested for reaching the Factor 4 objective. Technical sheets will be worked out for each case study
Then, a synthesis will be worked out showing:
- for each type of building the potential energy savings and also,, after a life cycling cost analysis the induced costs and externalities
- the potential energy savings for each case study.
c) Step 3: the building stock analysis and the barriers analysis
The objective of the Factor 4 approach is to set up sustainable strategies for building stock and so this third step will deal with the building stock scale.
Factor 4 project –IEEA Agreement n° EIE/05/076/S12.419636 – Deliverable 4 – October 2006
7
The objective is the analysis of the barriers as regarding the implementation of strategies aiming at the reduction by 2 up to 4 of the energy consumption and greenhouse effect gas emissions in social housing.
The opposite barriers to a factor 4-energy efficiency strategy are numerous and must be analysed for each type of the typology, with the help of the various case studies :
- regulation barriers
- financing and financial barriers
- organization and management barriers
- human barriers : behaviors of tenants, lack of information and knowledge…
The potential energy saving measures will be defined including their cost (including the necessary estimated investments, today as well as in 20 to 40 years from now)
A decision aid tool, the Factor 4 model will be worked out for social owners. This model will be tested for each case study or representative building.
The energy systems will be analysed with their contribution to greenhouse effect gas emissions: the direct and the life cycling (id est including a life cycle analysis LCA) emissions will be estimated and then valued (valorized in monetary terms) as well as the atmospheric pollutant emissions.
The Factor 4 model will analyse the various impacts of these financing tools on the global economic balance of the retrofitting works and for the building stock strategy of each social owner.
This step 3 will include the following tasks:
a) the working out of the Factor 4 model
b) the analysis of each case study (first building scale analysis)
c) the elaboration of the various scenarii for each building case study
d) an analysis of each scenario with the Factor 4 model in order to show the economic impacts of the various potential solutions for each type of actor concerned by the retrofitting works (including the financial aspects)
e) a discussion upon the various results obtained with the LCEC analysis focused on the economical barriers for each case study (with an overall synthesis or extrapolation as regarding the whole typology)
f) local working meetings with the local partners of the social owners in order to discuss about the costs and advantages of the various solutions suggested and to identify the best solutions allowing to overpass some barriers. This discussion will focus on the solutions and problems to be solved in the short term but also in the middle term and for the long term
g) global discussion between the project partners in order to propose some recommendations about the different proposed solutions in regards to financing schemes in a working meeting: solutions for short term, middle term and long term in order to define a way to define the conditions of the Factor 4 - energy efficiency approach.
h) Recommendations for taking into account energy in the social owner strategy as regarding his building stock.
The Factor 4 model
The life cycle cost of a new construction corresponds to the sum of the controlled initial costs and the deferred costs (which control is uncertain) and a life cycle cost analysis must allow to work out scenarii and to find a balance between controlled costs and future non controlled costs. The life cycle cost analysis is as well a decision aid tool as an assessment and evaluation tool.

Factor 4 project –IEEA Agreement n° EIE/05/076/S12.419636 – Deliverable 4 – October 2006
8
2. THE SOCIAL HOUSING STOCK TO RENOVATE
2.1. REMINDER OF THE OVERALL TYPOLOGY (DELIVERABLE 3)
The typology analysis (cf. deliverable 3 under the leadership of HTC) consists first in setting up the social housing stock for each country and its composition according to selected criteria.
These criteria were discussed during a working meeting gathering the Factor 4 partners.
The basic statistic data have been collected by HTC (deliverable 3).
In France for example HTC achieved the data and then crossed several data sources according to the criteria selected such as the heating energy. As a matter of fact, HTC data cover only 88 % of the social housing stock (because the data about non metropolitan areas as well as the data about mixed companies (SEM) were not collected).
Then, La Calade defined unitary consumptions per energy source for each unit inside the typology in order to estimate the overall energy consumption and the greenhouse gas emissions for each typology segment.
A demolition scenario has been worked out by La Calade (under the contribution of some SUDEN members as well as by USH experts) as regarding the social housing building stock evolutions until 2050.
This scenario allows to estimate the energy consumptions and the greenhouse gas emissions of the 2050 social housing building stock (id est the buildings which will still be in use in 2050), others things being equal (that is to say without integrating technological evolutions related to the equipments replacing and to the retrofitting actions, neither to energy substitutions).
This scenario allows to bring to the fore the Factor 4 stake for the existing social housing building stock.
Last, La Calade estimated all the characteristics of each building type of the typology selected (id est the existing social housing building stock still in use in 2050), in order to make it as representative as possible,.
The sample worked out takes also into account the secondary criteria selected by the Factor 4 partners. These secondary criteria were not so important for working out the typology but they are important for the Factor 4 purpose.
2.2. THE OBJECTIVES OF THIS SELECTED TYPOLOGY This typological analysis has two main objectives :
a) to estimate the market of the Factor 4 project and of the Factor 4 objective as regarding the reduction of greenhouse gas emissions by 4 before 2050;
b) to define a typology allowing to select a sample of 15 representative buildings as case studies for the analysis of energy opportunities or possibilities and for a factor 4 strategy implementation.
2.3. THE SELECTION OF CRITERIA This selection of criteria is described and explained (why, how…) in the deliverable 3 for each country concerned by the Factor 4 project.
The deliverable 3 gathers all the data for each type of buildings inside the typology worked out.

Factor 4 project –IEEA Agreement n° EIE/05/076/S12.419636 – Deliverable 4 – October 2006
9
PART 1 FRANCE 1.1. REMINDER UPON THE TYPOLOGY FOR FRANCE
1.1.1. The main criteria
Four main criteria have been selected for the social housing building stock analysis :
- the construction date
- the climatic area
- the building size
- the heating energy source
The construction date
The construction date is an essential criteria insofar as already old buildings will be completely timeworn before 2050. Moreover, thermal regulations are directly related to construction date.
Statistic data are available according to 7 time slices for the construction date of social buildings:
- before 1956,
- between 1956 and 1970
- between 1971 and 1975
- between 1976 and 1983
- between 1984 and 1989
- between 1990 and 2000
- since 2000 (or between 2001 and 2003).
The climatic areas
The climatic area location has very important effects on needs for heating. For France there are three climatic areas for the metropolitan zone.
The climatic areas in France
Factor 4 project –IEEA Agreement n° EIE/05/076/S12.419636 – Deliverable 4 – October 2006
10
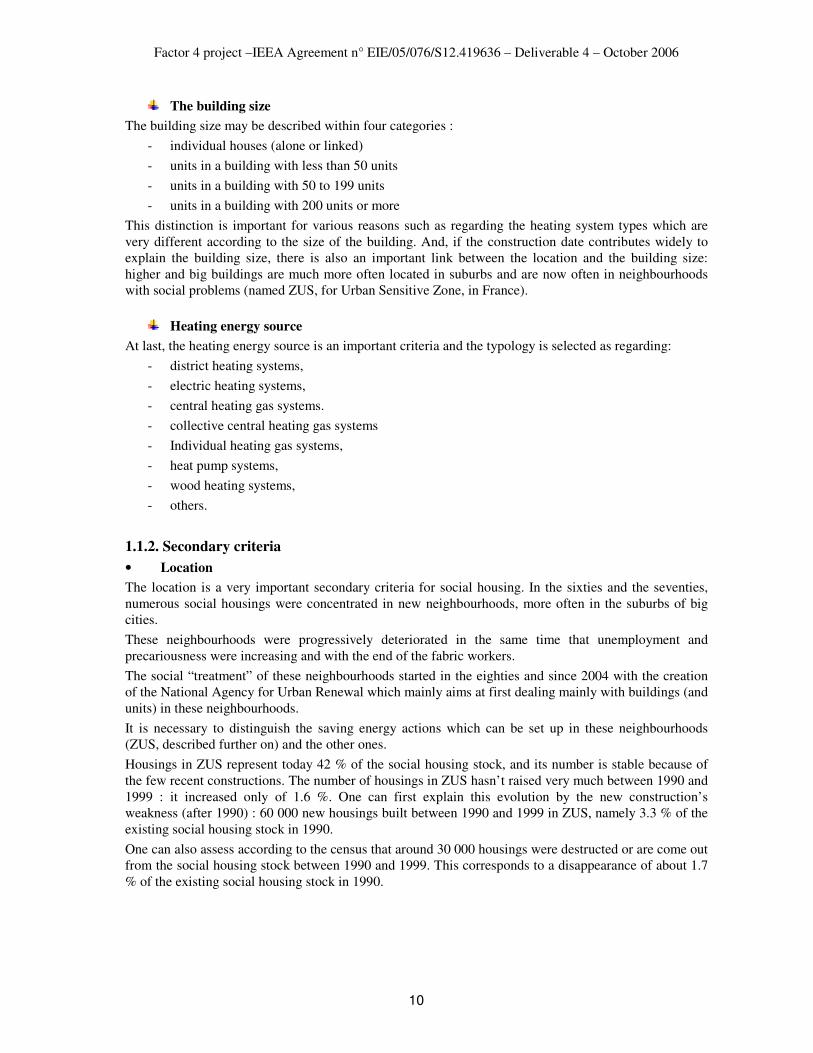
The building size
The building size may be described within four categories :
- individual houses (alone or linked)
- units in a building with less than 50 units
- units in a building with 50 to 199 units
- units in a building with 200 units or more
This distinction is important for various reasons such as regarding the heating system types which are very different according to the size of the building. And, if the construction date contributes widely to explain the building size, there is also an important link between the location and the building size: higher and big buildings are much more often located in suburbs and are now often in neighbourhoods with social problems (named ZUS, for Urban Sensitive Zone, in France).
Heating energy source
At last, the heating energy source is an important criteria and the typology is selected as regarding:
- district heating systems,
- electric heating systems,
- central heating gas systems.
- collective central heating gas systems
- Individual heating gas systems,
- heat pump systems,
- wood heating systems,
- others.
1.1.2. Secondary criteria
• Location
The location is a very important secondary criteria for social housing. In the sixties and the seventies, numerous social housings were concentrated in new neighbourhoods, more often in the suburbs of big cities.
These neighbourhoods were progressively deteriorated in the same time that unemployment and precariousness were increasing and with the end of the fabric workers.
The social “treatment” of these neighbourhoods started in the eighties and since 2004 with the creation of the National Agency for Urban Renewal which mainly aims at first dealing mainly with buildings (and units) in these neighbourhoods.
It is necessary to distinguish the saving energy actions which can be set up in these neighbourhoods (ZUS, described further on) and the other ones.
Housings in ZUS represent today 42 % of the social housing stock, and its number is stable because of the few recent constructions. The number of housings in ZUS hasn’t raised very much between 1990 and 1999 : it increased only of 1.6 %. One can first explain this evolution by the new construction’s weakness (after 1990) : 60 000 new housings built between 1990 and 1999 in ZUS, namely 3.3 % of the existing social housing stock in 1990.
One can also assess according to the census that around 30 000 housings were destructed or are come out from the social housing stock between 1990 and 1999. This corresponds to a disappearance of about 1.7 % of the existing social housing stock in 1990.

Factor 4 project –IEEA Agreement n° EIE/05/076/S12.419636 – Deliverable 4 – October 2006
11
• The unit size
The social housing building stock is widely represented by units with 2 or 3 bedrooms, (66.6 % of the stock), the units with only 1 bedroom or only a single room being representing only 24 % of the stock and the bigger units with 4 bedrooms or more 9.4 %.
• The tenants’ income level
The analysis of data about tenants in social housing (called HLM), as much at the aggregated national level as at the detailed level of the visited HLM organisms, shows that the tenants’ income level is closely correlated to the initial financing schema implemented. Thus, at the national level, the proportion of households whose income does not exceed 60 % of the HLM ceiling income is 15 points smaller for the buildings built in 1990-2000 than for the buildings built between 1955 and 1975.
One can explain this situation in particular by the sensitive difference of rent between PLA (Specific supported social housings with a decision taken before the construction of the buildings and so allocated to selected households) and former social housings generations, because the APL (individual support for rent) is not high enough for cutting this gap. The financing schema influence upon social occupation, automatic as soon as the HLM organism tries to avoid too important effort rates, is not favourable to the social mix objective. Moreover, the PLUS (a PLA with a more important financial support) provides a more interesting answer but the financial support is not big enough.
A national analysis has thus showed that people with low incomes (smaller than 60 % of the HLM ceiling income) are strongly overrepresented in buildings built between 1955 and 1975, in relation to buildings built after 19901.
• The rent level
This rent level is liable to a ceiling income. It’s also the determining factor allowing (or not) to support some works.
The rent level is calculated according to the financing schema used for the housing construction and their retrofitting works.
For instance, in 2004, the average rents of housings rented by HLM companies (52 % of the social housing building stock) vary of nearly 40 % according to the financing schema :
Average rent of a unit In € per month In € per month and per
m2
Taking all financing sources together
Social PLA
PLA LM, PLATS et PLAI
280 2,57
3.01
2.57
Convention except PLA
(Palulos or others)
244 2,30
Source : DAEI, EPLS ; 2004, January, 1st
Note :
PLA : Supported housing with a specific rental level
PLA LM : PLA with a more moderate rent
PLA TS : PLA with a very important reduction of the rent level (because of a public financial support)
PLAI : PLA – Integration with is a specific level of rent for people without any job since a long time
1 Rapport sur le financement du logement social (Report on social housing financing), Henri Guillaume, , Inspection
Générale des Finances (Finance administration’s overall Inspection), n° 2001 – M – 013 – March 4th 2002

Factor 4 project –IEEA Agreement n° EIE/05/076/S12.419636 – Deliverable 4 – October 2006
12
• The type of companies owning the buildings
One can distinguish mainly three categories of social owners:
- HLM public companies, which represent 48.6 % of the French social housing building stock (49.9 % for the metropolitan area)
- Public limited HLM companies, representing 42.1 % of the stock (42.2 % for metropolitan France)
- Mixed companies, which represent 8.1 % of the French social housing building stock (6.8 % for metropolitan area) (and which are not included in the typology described in the deliverable 3).
- a few specific companies, which represent only 1.2 % of the French social housing building stock.
Other criteria mentioned but not selected at this stage of the analysis
• The ownership
This criteria can be an important barrier for energy retrofitting because there is no more only one decision maker but as many as the number of units and so a decision upon retrofitting works can be impossible if there is not public funds (especially as regarding GEG emissions).
In France important differences can be noticed in various regions and so this criteria will be taken into account later on in the analysis.
• The previous energy retrofitting works
Potential retrofitting works are not taken into account as a criteria at this stage and will be taken into account later for working out the SEC model for example.
1.2. THE FRENCH SOCIAL HOUSING BUILDING STOCK Social housing is defined in France (so for gathering statistical data) as housing with a public support managed by a company… (This definition has been modified in July 2006 by a new law…).
We don’t study the social housing building stock managed by private owners who can rent housings within the framework of specific conventions with a rent ceiling. (This building stock is however considered as social housing by the European Commission).
The French social housing building stock is estimated to 4.3 millions of units, including 3.8 millions of units directly managed by companies who are members of USH (Union Sociale pour l’Habitat, whih is the social housing national association) and 0.5 million of units corresponding to units managed by the State, public companies (such as Charbonnages de France, EDF…) and SEM (mixed companies including sometimes local authorities).
The companies affiliated to USH are members of three federations representing :
- the public HLM companies,
- private companies (named SA HLM)
- and social housing cooperatives.
The following analysis (data) deals mainly with social housings managed by companies affiliated to
USH.
The existing social housing building stock is composed of 3.8 millions of units (2004).
The table 1 (cf. Appendix about France) presents the distribution of the existing social housing building stock linked to USH (so only 3.8 among the 4.3 millions of units).

Factor 4 project –IEEA Agreement n° EIE/05/076/S12.419636 – Deliverable 4 – October 2006
13
The distribution according to the construction date is the following :
The French social housing building stock distribution according to the construction date
Source : La Calade for Factor 4 (according to the data upon the French social
housing building stock collected by HTC)
The main part of the French social housing building stock has been built between 1956 and 1975, namely half the existing building stock (in 2005).
The main part of this building stock built between 1956 and 1975 has been built in ZUS (specific social areas).
Units of buildings built in the ZUS Units of buildings built out of the ZUS
80 % of this building stock has been built between 43 % of this building stock has been built 1949 and 1974 after 1974
Source :La Calade according to the data from Observatoire de ZUS (ZUS Observatory)
4%
42%
37%
11%
4% 2%
< 1949
1949 - 1967
1968 - 1974
1975 - 1981
1982 - 1989
1990 - 1999
10%
29%
18%
15%
14%
14%
< 1949
1949 - 1967
1968 - 1974
1975 - 1981
1982 - 1989
1990 - 1999
11%
34%
15%
15%
9%
16%
< 1956
1956 - 1970
1971-1975
1976 - 1983
1984 - 1989
1990 - 2003
Factor 4 project –IEEA Agreement n° EIE/05/076/S12.419636 – Deliverable 4 – October 2006
14
Units in ZUS are representing today 24 % of the total social housing building stock (according to the specific French definition up to now) with 1.84 million of units. Main homes represent the most important percentage of this building stock with 1.67 million of units.
This social housing building stock of main homes gather 1.03 million of rented units (61.3 %), 0.33 million of units owned with specific social conditions (19.9 %) 0.23 million of units rented by common private owners (non registered as HLM) and 0.08 million of units with other specificities.
This social housing building stock of main homes does not change a lot because there were very few new buildings in the last years: only 60 000 units representing 1.6 % of the existing building stock (or 3.3 % of the 1990 building stock) has been built between 1990 and 1999. And we can estimate that around 30 000 units have been demolished or sold (and so are no more inside the social housing building stock) between 1990 and 1999, which corresponds to a reduction of around 1.7 % of the 1990 social housing building stock.
The ZUS characteristics can be described as following2 :
a) The construction date
In the ZUS, 79 % of the first homes rented inside the HLM sector have been built between 1949
and 1974. Units are therefore quiet old and new constructions not very numerous. However, some ZUS have a more recent habitat ; for about 40 of them, more than the quarter of the social housing
building stock has been built after 1982.
b) Their comfort level
Units have a good comfort level. 92 % of them gather all the identified comfort criteria (WC inside the unit, shower or bathtub and a central heating system). First homes without comfort (that is to say without bathtub neither shower) represent only 1.3 % of the total stock and they are less and less numerous (from 3.5 % of the units in 1990 to 1.3 % in 1999).
c) The buildings envelope
More often in the ZUS(where 16 % of the tenants gave this bad opinion), the façades of the HLM buildings are judged in bad state (opened cracks or degraded facings). In the meanwhile, out of the ZUS this percentage is only up to 11 %. Nevertheless, restoration works seem more frequent for the HLM buildings in ZUS : 44 % of the tenants experienced a restoration of their building less than ten years ago, comparing to 38 % for the HLM buildings out of the ZUS.
Because of their age, HLM buildings in ZUS present more frequent signs of degradation and therefore are more often refurbished or retrofitted.
d) The units size
Social housing units (except in individual houses) are often bigger than in the other types of buildings: their average inhabitable surface is 68 m2, in comparison with only 59 m2 for the others types.
The units vacancy3
The units vacancy rate is higher in ZUS (8.2 %) than elsewhere.(7.5 %). This rate does not vary very much according to the construction date – except for buildings built before 1949, where the vacancy
rate is higher (13.7 %). More often ZUS where the vacancy rate was the highest in 1990 have experienced a drop of the number of units between 1990 and 1999. It is possible that vacancy occurred before demolition works.
2 Source Observatoire national des zones urbaines sensibles, 2004 and especially the chapter 2 upon the housing
description in ZUS (from page 63) 3 Source Observatoire national des zones urbaines sensibles, 2004 and especially the chapter 2 upon the housing
description in ZUS (from page 63)

Factor 4 project –IEEA Agreement n° EIE/05/076/S12.419636 – Deliverable 4 – October 2006
15
The construction rate
One can also notice that the construction rate has considerably dropped since the beginning of the eighties.
Number of new building units in social housing in France
Source : La Calade for Factor 4 (from data collected by HTC)
This evolution is in phase of reversal since 20024..The number of social housing units built was:
47 400 units for 2002
53 000 units for 2003…
for reaching 80 000 units in 2006 and 2007.
This increase is also true for the whole housing sector. The average number of new residential buildings raised up to 300 000 units per year since 1990 to 2000, with a 280 000 units low point in 2000.
New units built raised up to 360 000 in 2003, 380 000 in 2004, 450 000 in 2005 and 480 000 units built are expected for 2006.
Social housing building stock distribution per building size
Source : La Calade for Factor 4
Buildings with less than 50 units are the most numerous in France (57 %), while individual houses represent 13.4 % of the stock.
4 This new evolution was in 2000 but was seen only in 2002 because of thesystem inertie
0
20000
40000
60000
80000
100000
120000
140000
1956 - 1970 1971-1975 1976 - 1983 1984 - 1989 1990 - 2003
14%
57%
26%
3%
maison individuelle
immeuble < 50 logements
immeuble 50 - 199 logements
immeuble > 200 logements

Factor 4 project –IEEA Agreement n° EIE/05/076/S12.419636 – Deliverable 4 – October 2006
16
Social housing units’ distribution as regarding climatic areas
Source : La Calade for Factor 4
70 % of the social housing units are in the H1 climatic area.
1.3. EVALUATION OF ENERGY CONSUMPTIONS AND CO2 EMISSIONS PER HOUSING UNIT IN EACH SELECTED CATEGORY The second table (Cf. Appendix) breaks up the social housing building stock in taking energy sources into account. (We must remind that as we use only average figures, we don’t mind if there were retrofitting works before today).
Indeed, there is a large variety of energy sources in social housings:
- Individual central heating with natural gas
- Collective central heating with natural gas
- Central heating with fuel oil
- District heating systems
- Electric heating systems
- other heating systems
Distribution of the social housing building stock according to their heating systems
Source : La Calade for Factor 4
70%
21%
8% 1%
H1
H2
H3
DOM
26%
29%11%
11%
13%
10%
Chauffage central individuel gaz
Chauffage central collectif gaz
Chauffage fioul
Chauffage urbain
Chauffage électrique
Autres

Factor 4 project –IEEA Agreement n° EIE/05/076/S12.419636 – Deliverable 4 – October 2006
17
Natural gas is used by 55 % of the units. Heating systems with petroleum sources is used only by 11 % of the units, as well as district heating. And electric heating systems are up to 13 %.
1.4. ENERGY CONSUMPTIONS AND CO2 ÉMISSIONS ANALYSIS The data available today in France5 (USH) are only upon 2002 but these data are only upon some types of building and only for renting charges. Consumptions from residents are not known (and so forgotten) and there are mistakes, as sown in the table below.
Energy consumption for heating and hot water according to the unit type
Collective buildings Single house
Collective heating system and hot water
Individual heating and hot water systems
Individual heating and hot water systems
Collective heating system and individual hot water
Climatic areas H1 H2 et H3 H1, H2 et H3
H1 H2 et H3
Number of buildings in the enquiry
23 35 56 16
Consumption in kWh/m² SH
Min 48 104 75 121
Max 201 193 181 170
Median 144 135 119 145
Unitary price in € / kWh 0,040 0,039 0,039 0,034
Expense in € par m² 5,76 5,27 4,64 4,93
Hot water in m3 / m² SH for 63 buildings
0,47
Consumption in kWh* for hot water
24,6
???
???
Total expense in € / m² SH
7,64 6,08 ? ? 5,53 4,48
Source HTC et *La Calade (cycle 55 / 10 pour l’eau chaude) d’après HTC
SH is liveable surface
However, the table 3 (cf Appendix) gives the selected hypotheses about energy consumptions for each case of the typology.
The table 4 (cf Appendix too) gives energy consumptions and CO2 emissions of each unit according to the typology selected.
In multiplying the energy consumptions per the social housing building stock for each type of the typology, we achieve (cf Table 5 in Appendix) an estimation of the energy consumptions and the greenhouse gas emissions for each segment of the corresponding social housing building stock.
The final energy consumption in 2004 is estimated at 56 770 GWh.
5 Source, USH, Observatoire des charges locatives 1982-2002 20 ans d’observation des charges locatives, Jean-
Alain Meunier, HTC, 28 février 2005

Factor 4 project –IEEA Agreement n° EIE/05/076/S12.419636 – Deliverable 4 – October 2006
18
Energy consumption is widely concentrated in the H1 climatic area, which represents nearly 74 % of the total consumption, while the H2 climatic area gathers 20 % and the H3 climatic area only 6.5 % of this overall energy consumption.
The French social housing building stock energy consumption in GWh according to the building
size and to each climatic area
Source : La Calade for Factor 4
Buildings with less than 50 units (except individual houses) are the most important ones : they represent 56 % of the overall energy consumption. Buildings with 50 to 199 units represent 27 % of the overall energy consumption, whereas big towers or bars with 200 units or more only represent 3.2 % of the energy consumption. At last, individual houses correspond to 14 % of the total energy consumption.
0
5000
10000
15000
20000
25000
30000
maison individuelle immeuble < 50
logements
immeuble 50 - 199
logements
immeuble > 200
logements
H1
H2
H3
H1H2
H3
maison individuelle
imm. collectif < 50 logem.
imm. collectif < 200 logem.
imm. collectif > 200 logem.
0
5000
10000
15000
20000
25000

Factor 4 project –IEEA Agreement n° EIE/05/076/S12.419636 – Deliverable 4 – October 2006
19
The social housing building stock energy consumption in GWh
according to the building size and construction date
Source : La Calade for Factor 4
Social housings built between 1956 and 1974 correspond to 58 % of the total energy consumption.
Buildings built between 1975 and 1989 correspond to 19 % of the energy consumption.
Distribution of the social housing energy consumption in % according to the construction date
Source : La Calade for Factor 4
Energy consumption can be broken down according to the energy source of the heating system.
Heating systems with gas corresponds to 59 % of the social housing building stock total consumption ; fuel oil systems 12 %, district heating 15 %, electric heating systems 8 %, and the others less than 6 %.
These various ratios show the most important market segments of the social housing building stock as regarding the definition of a factor 4 strategy.
0
5000
10000
15000
20000
25000
maison individuelle immeuble < 50
logements
immeuble 50 - 199
logements
immeuble > 200
logements
<1956
1956-1974
1975-1989
1990-2000
> 2000
11%
58%
19%
11%1%
<1956
1956-1974
1975-1989
1990-2000
> 2000

Factor 4 project –IEEA Agreement n° EIE/05/076/S12.419636 – Deliverable 4 – October 2006
20
The table 6 (Cf Appendix) gives an evaluation of the CO2 emissions from the French social housing building stock.
Total CO2 emissions have been calculated with emission factors taking into account direct (combustion) and indirect (life cycle productions in order to take primary energy consumptions into account) emissions.
The whole CO2 emissions are valued to 11.8 Mt CO2 for the 2004 social housing building stock
(USH).
Inasmuch as we work upon a building stock (the one belonging to USH members) which corresponds to 88 % of the national public social housing building stock, it would be advisable to correct those emissions by a factor equal to 1.14, and this gives an overall CO2 emissions level estimated to 13.5 Mt
CO2 .
CO2 emissions according to the heating system in the social housing building stock in %
Source : La Calade for Factor 4
CO2 emissions from the social housing building stock
in thousands of tons per year, per building size and per climatic area
Source : La Calade for Factor 4
26%
33%
16%
16%
4%5%
Chauffage central individuel gaz
Chauffage central collectif gaz
Chauffage fioul
Chauffage urbain
Chauffage électrique
Autres
0
1000
2000
3000
4000
5000
6000
7000
maison individuelle immeuble < 50
logements
immeuble 50 - 199
logements
immeuble > 200
logements
H1
H2
H3
Factor 4 project –IEEA Agreement n° EIE/05/076/S12.419636 – Deliverable 4 – October 2006
21
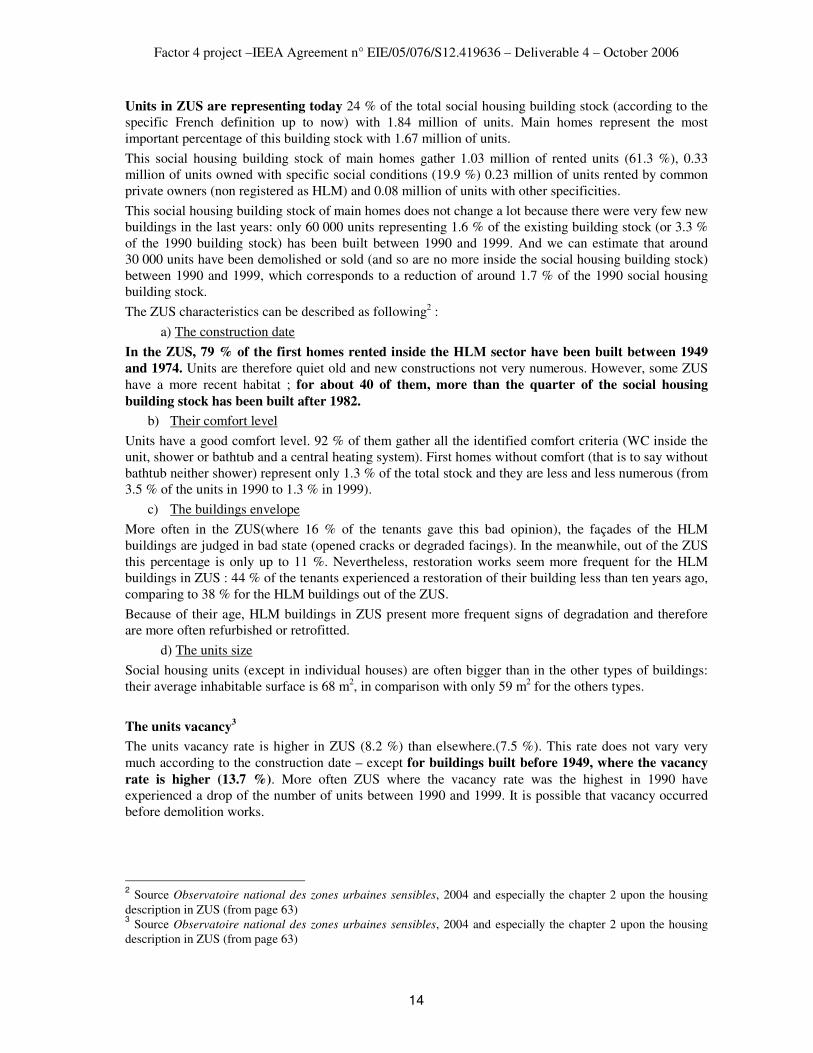
CO2 emissions from the social housing building stock
in thousands of tons per year, per buloding size and per construction date
Source : La Calade pour Factor 4
1.5. SCÉNARII UPON DÉMOLITION AS WELL AS UPON THE ÉVOLUTION OF THE SOCIAL HOUSING BUILDING STOCK
1.5.1. The selected hypotheses
Between 1954 and 1980, the social housing construction effort proved to be very important with in particular the sixties pick facing the French repatriation from Algeria and the rural exodus.
Since 1983, the community effort in favour of social housing didn’t stop decreasing, making appear a hollow of social housing units production in the early 2000 years, the production of this year being only up to 40 000 units.
In 2006, the deficit cumulated since more than 20 years raises, according to Philippe Genestier (the town planner-in-chief of the Government), to 1 million of units. 1.3 million of households are estimated with bad housing conditions.
Because of this construction deficit, the social housing building stock is an ageing stock, which needs
for important restoration works and important retrofitting works.
Between 1990 and 1999, the number of demolitions is estimated up to 30 000 units for the whole housings located in sensitive urban area (ZUS), namely an annual average demolition rate up to 0.17 %.
In 2001 the government decided to implement a boosting programme of social rented flats construction and to speed up the demolition-reconstruction operations.
Simplifying measures of financing modes or schemas began to produce effects since 2002, a year during which the government tripled the funds dedicated to demolition works, in order to finance the demolition of 15 000 HLM units (in comparison with an average level of 7 000 units demolished per year during the 1999-2002 period). The stock regeneration objective was aiming in consequence at passing from an annual average rate of 0.17 % to 0.35 % for the demolition of units.
The National Urban Renewal Programme (PNRU , Programme National de Rénovation Urbaine), as it was defined in the Law n° 2003-710 dated 1er août 2003 (Loi d’orientation et de programmation pour la ville et la rénovation urbaine) recently amended (by the Law n°2005-32 dated 18 January 2005), forsees an additional supply of 250 000 social housing units, the retrofitting of 400 000 units, the demolition of 250 000 units, as well as public equipments and urban works for the next 2004-2011period.
The annual demolition average rate would be then up to 0.75 % per year.
0
500
1000
1500
2000
2500
3000
3500
4000
4500
5000
maison individuelle immeuble < 50
logements
immeuble 50 - 199
logements
immeuble > 200
logements
<1956
1956-1974
1975-1989
1990-2000
> 2000

Factor 4 project –IEEA Agreement n° EIE/05/076/S12.419636 – Deliverable 4 – October 2006
22
The number of demolitions before the Social cohesion Law (Loi de Cohésion sociale) is more than twice the previous number but this previous number was very small:
Year Number of demolished units
1998 3 155 1999 6 419 2000 6 500 2001 7 584 2002 8 086 2003 9 160 including 6 760 in ZUS 2004 Non yet available but 7 617 were to be
demolished (including 5 197 in ZUS) Source : DAEI and DGUHC ; inquiry among DDE as well as Projet de Loi de Finances initiale pour 2006 for 2003andt 2004
Last, a prospective survey managed by Caisse des Dépôts et Consignations6 allows to estimate how many units should be demolished before 2011:
Estimation about the untis which should be demolished during the next years :
Years 2005 2006 2007 2008 2009 2010 2011
Number of
units
demolished
10 000
13 300
17 689
23 526
31 290
41 616
55 349
Source Caisse des Dépôts et Consignation, 2004
In fact, during the first two years of the PNRU Programme (at the beginning of September 2006), there were 86 000 units to be demolished7, namely an annual average rate of units’ demolition nearly 1 %.
In 2006, the government still wishes to speed up these demolition and construction works. Social housing companies have to face this challenge with numerous obstacles, and in particular the operators’ production ability (their own staff, building firms…) and the lack of property supply in a great number of local authorities.
The outcome between demolition and constructions works is a government’s requirement which is also linked to a dedensification objective. In other words, local authorities have to demolish in sensitive urban areas (ZUS) where social housing predominates and to build outside of the ZUS, which is sometimes difficult or takes much time.
The present result is a light deficit in terms of new units… which can prompt social owners to slow down the demolition rate… facing the important social housing demand.
One can thus notice that between the years 1990-2002, the yearly demolition average rate was up to 0.17 %. A first objective (2001) was to double this rate and for the 2004-2011 period this rate could reach 0.75 % per year.
What can be this demolition rate for the 2006-2050 period?
Numerous phenomena bring to say that the nineties demolition rate is too weak :
- It is considerate that 1.3 million of French people have bad housing units: in 2002, the government has thrown an important action plan against indecent and unworthy housings (as regarding more private than public social housing). This reveals a important number of obsolescent units.
- This obsolescence is not only due to technical reasons. Numerous units are not following the size standards any more and it is not possible to modify them because of their building structure.
6 Financial situation of the French social housing sector in 2004 7 Source : Etat d’avancement des dossiers au 1
er Septembre 2006, ANRU

Factor 4 project –IEEA Agreement n° EIE/05/076/S12.419636 – Deliverable 4 – October 2006
23
Very high buildings, bars and towers – mainly built during the sixties – have a very negative image and no more correspond to the social demand.
- The population ageing requires a housing adaptability, which is not always possible (for technical as well as financial reasons) to implement.
- The need for a greater social mix in neighbourhoods cannot be achieved without the demolition of a certain number of units.
On the other hand, nobody can assert that the present rate wished by the government can remain as it is, because :
- Housing demand is very high and no doubt more important than the ability to build new housings ;
- New housings construction requires property land policies and most of local authorities will have difficulties to implement them. Once urban brownfields dealt with, the excessive cost of land property will slow down the social housing potential development.
- Numerous units are not flexible enough in order to allow important and sustainable retrofitting works which do not require their demolition because of social or physic obsolescence reasons.
At last, one can raise the question of resources mobilization for financing new housings. Public efforts in favour of housing has remained almost the same between 1997 and 2005, and even if this effort increases during the 2006-2007 period, what will happen later on ?
Once these few points detailed, a first scenario can be worked out. It’s aim is to maintain a
relatively high social housing demolition rate in France, which could be fixed up to 0.40 % per
year.
During the 2005 – 2050 period, starting from 4.3 million of social housing units in 2004, more than 20 % of this building stock would be demolished before 2050. So 3.45 million of the existing social housing units would still be in use (new units built and social owners’ acquisitions are not taken into account of course).
So the Factor 4 project should deal with this stock managed by USH companies composed of more
than 3 million of units.
How dividing up this demolition volume on the existing stock ?
First, the stock has a “natural” obsolescence that La Calade has suggested to fix up to 0.17 % per year ; which corresponds to nearly 300 000 units demolished during the period (the rate is estimated according to the construction date, supposing that there is not any demolition for buildings built within the last 50 years).
Units built before 1956 will get more than 100 years. But their demolition is not so easy. They have been built with raw resistant materials but often without good energy efficiency. These units were often built in city centres and so the demand for such units is very high. So the average demolition rate selected will be the same as for the overall building stock which is 0.23 % per year (not including the usual obsolescence rate of which is up to 0.17 %).
The units built between 1956 and 1974 are more concerned by demolition strategies.
The recent measures taken by the French government for the ZUS urban renewal show that demolition works deal mainly with:
- On social housing areas or neighbourhoods with the most important density, in order to reduce this density, demolition works deal with the ZUS which are characterized by a building stock essentially built between 1949 and 1974.
- On social housing areas or neighbourhoods with the most important density, the bars and towers with more than 200 units will be more often demolished, but these bars and especially those with
Factor 4 project –IEEA Agreement n° EIE/05/076/S12.419636 – Deliverable 4 – October 2006
24
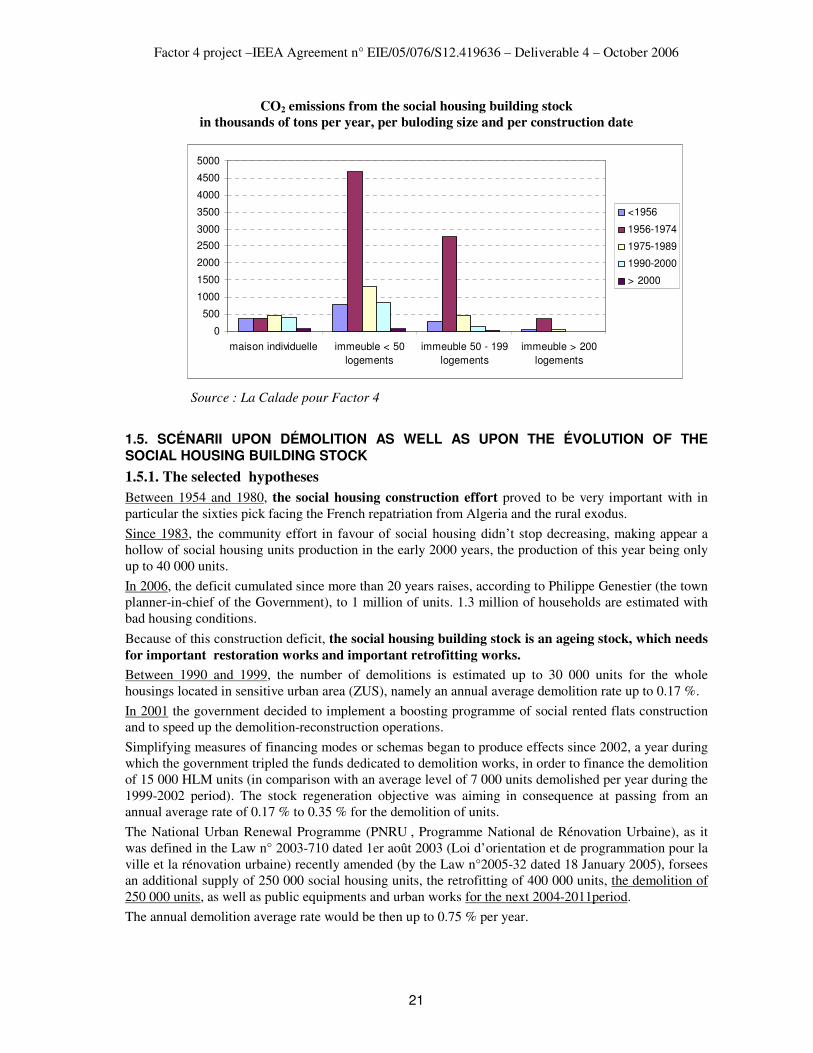
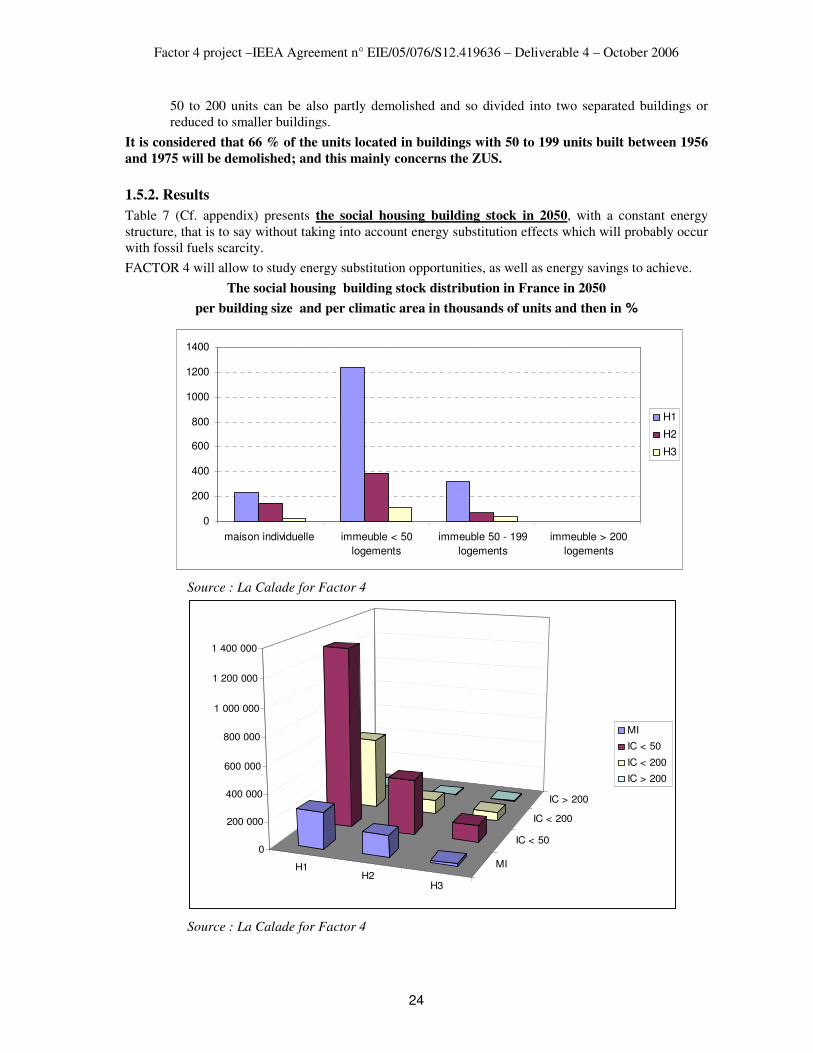
50 to 200 units can be also partly demolished and so divided into two separated buildings or reduced to smaller buildings.
It is considered that 66 % of the units located in buildings with 50 to 199 units built between 1956
and 1975 will be demolished; and this mainly concerns the ZUS.
1.5.2. Results
Table 7 (Cf. appendix) presents the social housing building stock in 2050, with a constant energy structure, that is to say without taking into account energy substitution effects which will probably occur with fossil fuels scarcity.
FACTOR 4 will allow to study energy substitution opportunities, as well as energy savings to achieve.
The social housing building stock distribution in France in 2050
per building size and per climatic area in thousands of units and then in %
Source : La Calade for Factor 4
Source : La Calade for Factor 4
0
200
400
600
800
1000
1200
1400
maison individuelle immeuble < 50
logements
immeuble 50 - 199
logements
immeuble > 200
logements
H1
H2
H3
H1H2
H3
MI
IC < 50
IC < 200
IC > 200
0
200 000
400 000
600 000
800 000
1 000 000
1 200 000
1 400 000
MI
IC < 50
IC < 200
IC > 200

Factor 4 project –IEEA Agreement n° EIE/05/076/S12.419636 – Deliverable 4 – October 2006
25
Source : La Calade for Factor 4
Buildings of less than 50 units (except individual houses) in H1 areas are predominant with nearly 50 % of the social housing building stock in 2050. The same housing type in H2 areas comes next with 15 % of the stock; then we find the buildings with more than 50 units in H1 areas, with 12 % of the stock.
The existing social housing building stock distribution in 2050
according to the construction date (< 2004)
Source : La Calade for Factor 4
The energy consumption of this social housing (USH members) building stock would raise up to 45
TWh in 2050, without changing any energy parameter, that is to say with the same energy production and consumption conditions than in 2004 (Cf table 8 in appendix).
9,1%
5,9%
0,7%
48,2%
15,2%
4,6%
12,4%
2,5%
1,5%
Individuel - H1
Individuel - H2
Individuel - H3
< 50 logts - H1
< 50 logts - H2
< 50 logts - H3
> 50 logts - H1
> 50 logts - H2
> 50 logts - H3
3%
44%
31%
20%
2%
<1956
1956-1974
1975-1989
1990-2000
> 2000

Factor 4 project –IEEA Agreement n° EIE/05/076/S12.419636 – Deliverable 4 – October 2006
26
This energy consumption gathers the heating consumption (collective, individual or independent ones), hot sanitary water consumption (collective and independent ones) and the whole electricity consumption.
The existing units’ surface in 2050 is so estimated to 212 Mm², if we consider than the average surface is up to 95 m² for individual houses and up to 66 m² for collective buildings.
So the unitary energy consumption is up to 210 kWh per m2. According to USH, the average energy consumption for collective heating is up to 160 kWh/m2 and the difference noticed is due to the energy consumption as regarding sanitary hot water as well as specific electricity.
The CO2 emissions of this social housing building stock (Cf table 9 in Appendix) would reach the
amount of 9.3 million of tons, still without changing any energy parameter.
If one wishes to give to this building stock the objective of a reduction of its greenhouse gas emissions by a factor 4, the objective would be to reduce the CO2 emissions by 6.9 Mt before 2050, that is to say more than half (60 %) of the social housing building stock present greenhouse gas emissions.
The CO2 emissions distribution is close to the energy consumptions one, per building size or per construction date or per climatic area.
1.6. THE SELECTED TYPOLOGIES FOR THE FRENCH CASE STUDIES
By breaking down the CO2 emissions typology, it is possible to select 15 buildings which can be representative case studies (representative of existing buildings which will be still in use in 2050).
The SEC model will be tested and validated with these case studies and the potential energy savings will be estimated also with these case studies.
The CO2 emissions analysis allows to present the potential sample according to each of the criteria selected.
Main criteria
• Construction date
- Building built before 1956 : 1
-Building built between 1956 and 1974 : 8
- Building built between 1975 and 1989 : 4
- Building built between 1990 and 1999 : 2
- Building built since 2000 : 0
• Climatic area
- H1 area : 11 à 12
- H2 area: 3
- H3 area: 0 à 1
• Building size
- Single house : 2
- Building with less than 50 units : 10 à 11
- Building with 50 to 199 units : 2 à 3
- Building with more than 200 unitts : 0
• Heating systems
- Individual heating gas system : 3 à 4

Factor 4 project –IEEA Agreement n° EIE/05/076/S12.419636 – Deliverable 4 – October 2006
27
- Collective heating Gas system : 4 à 5
- Oil heating system : 2 à 3
- District heating system 2 à 3
- Electric heating system : 1
- Others 0 à 1
Integration of secondary criteria
• Location
Demolition works are widely concentrated in ZUS as well as the retrofitting works and it should be the same during the next 2006-2011 years.
As the financial public effort is widely concentrated on these areas, it is necessary to give a particular weight to units located in these areas (and which represent 42 % of the social housing building stock).
- Buildings located in ZUS : 6 to 9
- Buildings located outside of the ZUS : 9 to 6
• Social owners type
8 % of the social housings are managed by SEM (mixed companies), which are not taken into account in our statistic analysis.
So the case studies could be distributed like this :
- Public social owners (OP HLM) 7 to 8
- Private social owners (HLM SA) 6 to 7
- SEM HLM : 1
1.7. SOME SELECTED FRENCH CASE STUDIES
Only one French social owner (Moulins Habitat) is a Factor 4 partner and his building stock is not important enough for having all the samples of the Factor 4 typology selected.
But we know that since the writing of the Factor 4 proposal and it is possible to get other social owners
as associated Factor 4 partners.
For example the CMH Group told they were interested since the first beginning of the project and they already participated to the kick off meeting in Paris at USH at the beginning of February 2006.
Then, when we got the data collected by HTC (deliverable 3) and the Factor 4 typology worked out by La Calade, we asked to several social owners in various parts of France interested by energy savings and the reduction of greenhouse gas emissions to join the Factor 4 partners.
This selection of social owners interested by the Factor 4 purpose was also an opportunity for the validation of the typology with many social owners everywhere in France. (This typology was also validated by the French national association USH, as a Factor 4 partner).
The case studies of Moulins Habitat are described below and others will be described later on.
Factor 4 project –IEEA Agreement n° EIE/05/076/S12.419636 – Deliverable 4 – October 2006
28
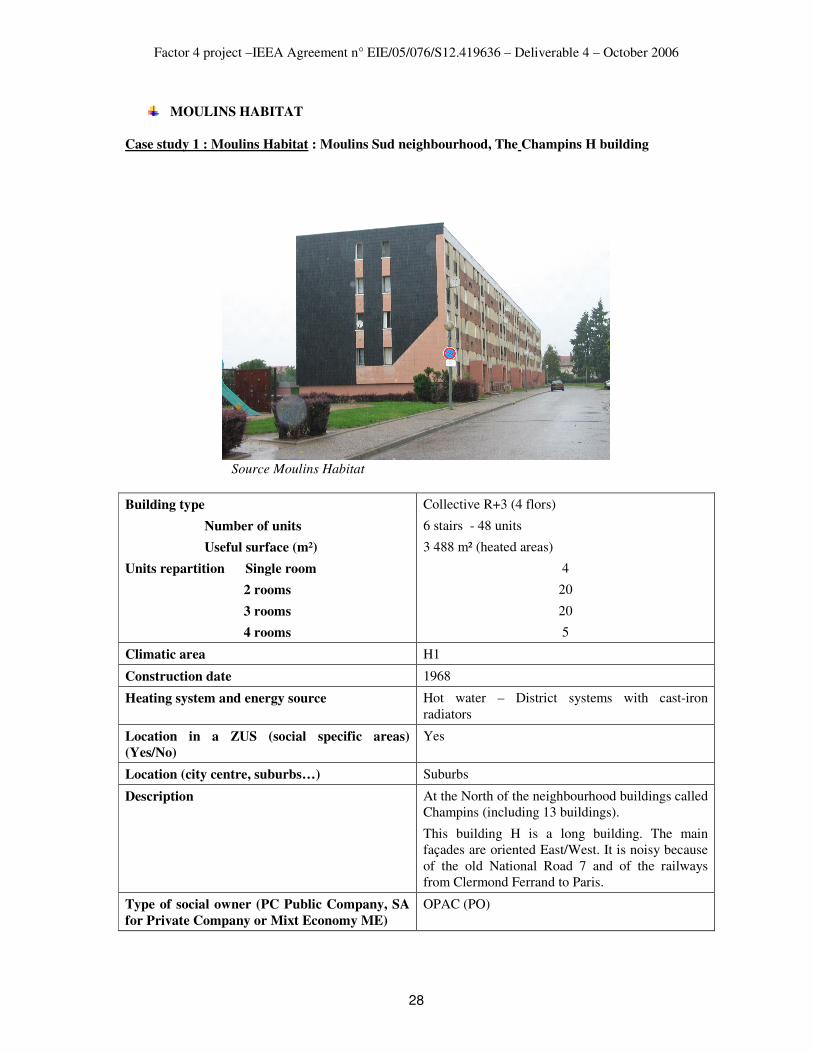
MOULINS HABITAT
Case study 1 : Moulins Habitat : Moulins Sud neighbourhood, The Champins H building
Source Moulins Habitat
Building type
Number of units
Useful surface (m²)
Units repartition Single room
2 rooms
3 rooms
4 rooms
Collective R+3 (4 flors)
6 stairs - 48 units
3 488 m² (heated areas)
4
20
20
5
Climatic area H1
Construction date 1968
Heating system and energy source Hot water – District systems with cast-iron radiators
Location in a ZUS (social specific areas)
(Yes/No)
Yes
Location (city centre, suburbs…) Suburbs
Description At the North of the neighbourhood buildings called Champins (including 13 buildings).
This building H is a long building. The main façades are oriented East/West. It is noisy because of the old National Road 7 and of the railways from Clermond Ferrand to Paris.
Type of social owner (PC Public Company, SA
for Private Company or Mixt Economy ME)
OPAC (PO)

Factor 4 project –IEEA Agreement n° EIE/05/076/S12.419636 – Deliverable 4 – October 2006
29
Case study 2: Moulins Habitat : Yzeure Le Plessis M building
Source Moulins Habitat
Building type
Number of units
Useful surface (m²)
Units repartition Single room
2 rooms
3 rooms
4 rooms
Collective building with 5 floors
18 units – 1 stair
1 147 m² (heated area)
2
12
4
Climatic area H1
Construction date 1974
Heating system and energy source Gas flooring heating with a specific collective heating system for these buildings
Location in a ZUS (Yes/No) Yes
Location (city centre, suburbs…) Suburbs
Description On the Eastern part of the neighbourhood composed of 18 buildings
Type of social owner (PO, SA, ME) PO (OPAC)

Factor 4 project –IEEA Agreement n° EIE/05/076/S12.419636 – Deliverable 4 – October 2006
30

Factor 4 project –IEEA Agreement n° EIE/05/076/S12.419636 – Deliverable 4 – October 2006
31
PART 2 - DENMARK
2.1. REMINDER UPON THE TYPOLOGY FOR DENMARK
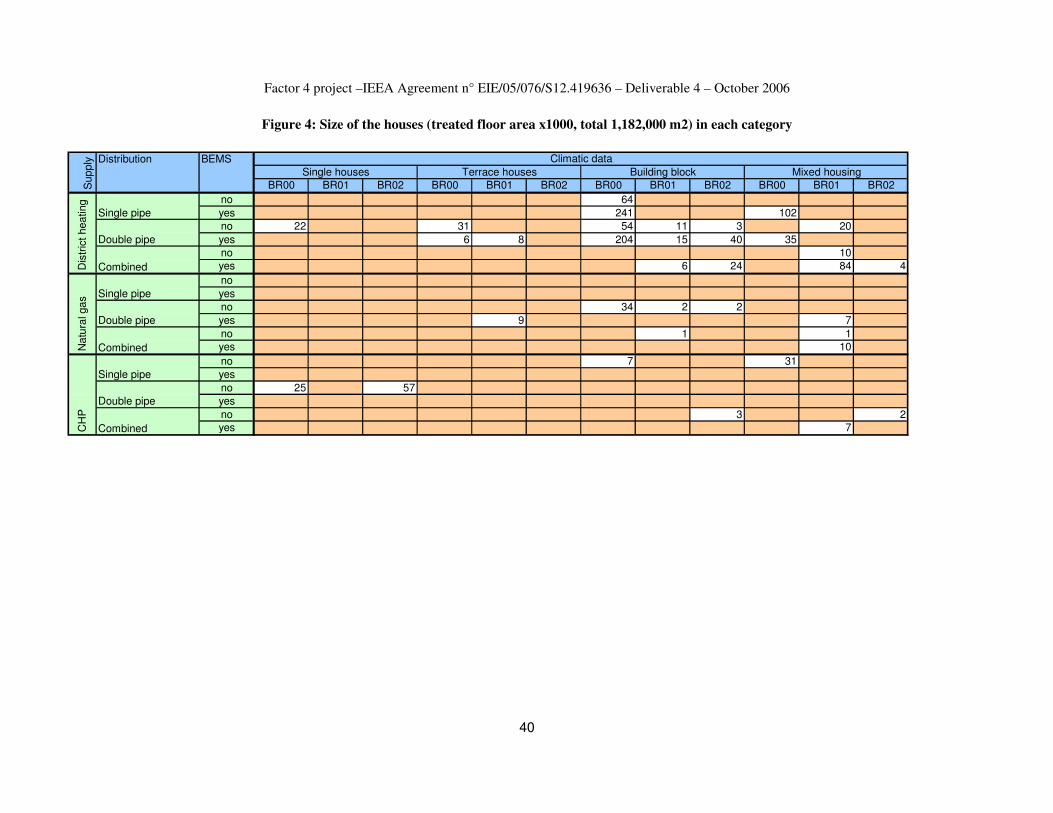
The Danish methodology application is developed based on the social housing schemes managed by KAB and reported in the KAB Statistic 2005. The statistic includes 24000 dwellings in 143 estates with total of 1,700,000 m2 treated floor area. The smallest estate includes 6 dwellings and the biggest 1,645 dwellings.
2.1.1. The main criteria selected
Six main criteria have been selected for the Danish social housing stock analysis.
− Climatic
− Type of construction
− Construction date
− Type of energy resource
− Type of distribution
− Building Energy Management System (BEMS)
Climatic area
The climatic in Denmark don’t differ very much from one location to another. Only small variations have been monitored and it has no significant influence on the energy consumption for heating. It is common practice to use the Danish TRY weather data for energy calculations of buildings.
Type of construction
Four types of building constructions have been selected for the Danish building stock: houses in one floor level, houses in two floor level and building block with more than two floor levels. Since the KAB Statistic include information on group of houses some estates consists of a combination of different type of houses called mixed housing.
Date of construction
The construction date follows the updating of the Danish building regulation and consists of four periods:
BR00: before 1980
BR82: from 1980 to 1995
BR95: from 1995 to 2006
BR06: after 2006
In the new building regulation BR06 two low energy standards are defined “klasse 1 & klasse 2” which are expected to be the requirements in the building regulation in the near future.
The energy performance of most of the old buildings (category BR00) has been improved. All buildings in the KAB Statistics have windows with two layers of glasses which was not available when it was constructed. Insulation has been added to the external cavity walls and the heat distribution systems have been insulated and thermostatic valves are installed on all radiators.
Heat supply
All the estates in the statistic are heat supplied in tree different ways: by district heating, natural gas and by local combined heat and power generation (CHP). The heat consumption in houses heated by natural gas is monitored by the gas input and the losses in the burner are included in the data.
Distribution
The internal distribution of the heat in the houses follows one of the following principles:

Factor 4 project –IEEA Agreement n° EIE/05/076/S12.419636 – Deliverable 4 – October 2006
32
− Single pipe system
− Double pipe system
− Combined.
It is expected that the principles of distribution is important for the consumption of space heating as the single pipe systems are old systems without sufficient controlling potential (flow and temperature).
BEMS
To improve the heating system a building energy management system (BEMS) has been installed in many estates. BEMS are installed in the major part of estates managed by KAB.
2.1.2. The secondary criteria
Individual energy meters have been installed in all buildings and it has a great impact on the tenants energy behaviour as the energy goes down by approximately 25% when the meters are installed.
Using condensing gas boilers has also an important effect on the energy consumption but this information is not included in the KAB Statistic.
As an example energy meters and condensing gas boilers were installed in a housing scheme in year 2003 and the yearly energy consumption drop from 150 kWh/m2 to 105 kWh/m2 or 30%.
The tenants energy behaviour and the energy management of the heating installation are two important issues which have a significant impact on the energy consumption in the estates. These informations are not included in the KAB Statistic and they are not included in the Danish typology.
2.2. THE DANISH SOCIAL HOUSING STOCK
In year 2005 there are total 513,745 social housing in Denmark according to the Statistics Denmark (SD) with a distribution shown in

Factor 4 project –IEEA Agreement n° EIE/05/076/S12.419636 – Deliverable 4 – October 2006
33
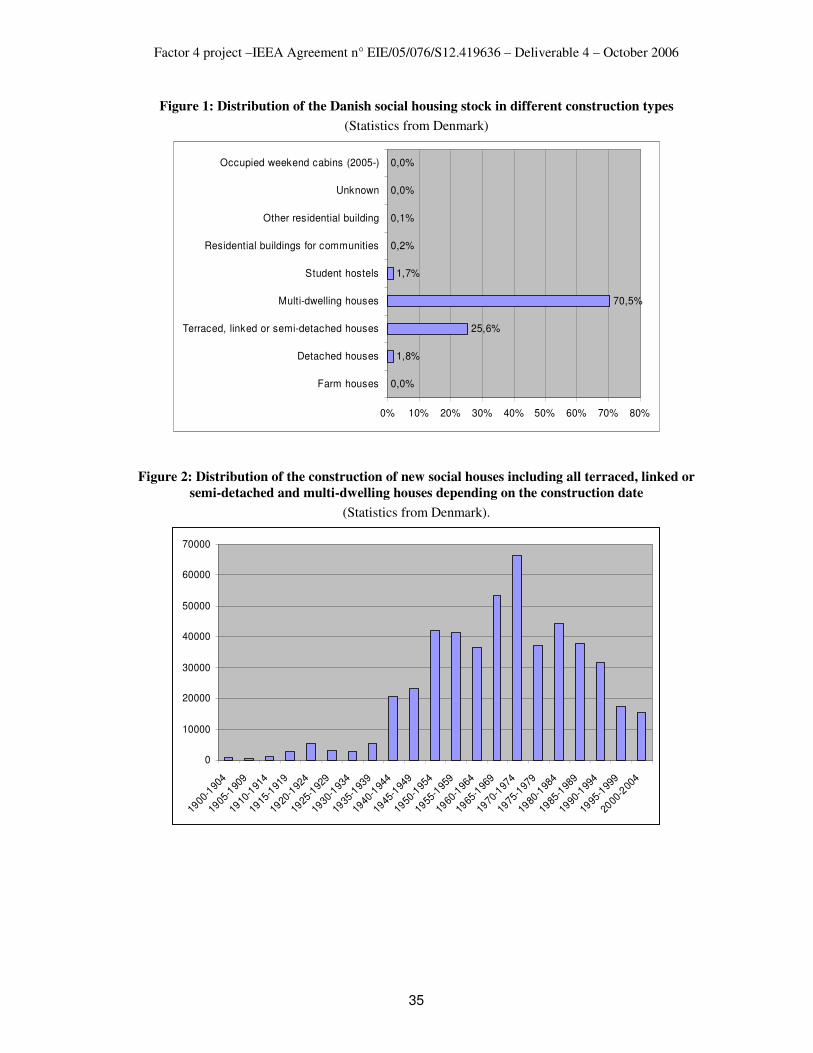
Figure 1. It seems from the figure that 70% of the housing is multi dwelling houses or building block and it correspond to the KAB Statistic of which 69% is building blocks.
The selection of the category in the Danish typology is based on the KAB Statistic where the type of construction doesn’t have the same grouping as the SD. The two categories: terraced, linked or semi-detached houses and detached houses are grouped in the KAB Statistic as
− houses in two floor level,
− houses in one floor level,
− mixed houses.
The total number of dwellings in the KAB Statistic is 17,189 out of the total social housing stock of 513,745 dwellings or 3,3%.
The distribution of new construction of social houses including all terraced, linked or semi-detached and multi-dwelling houses are shown in Figure 2 depending on the construction date. The constructions of new social houses were highest during the period from 1970 to1974 and then it has been decreasing.
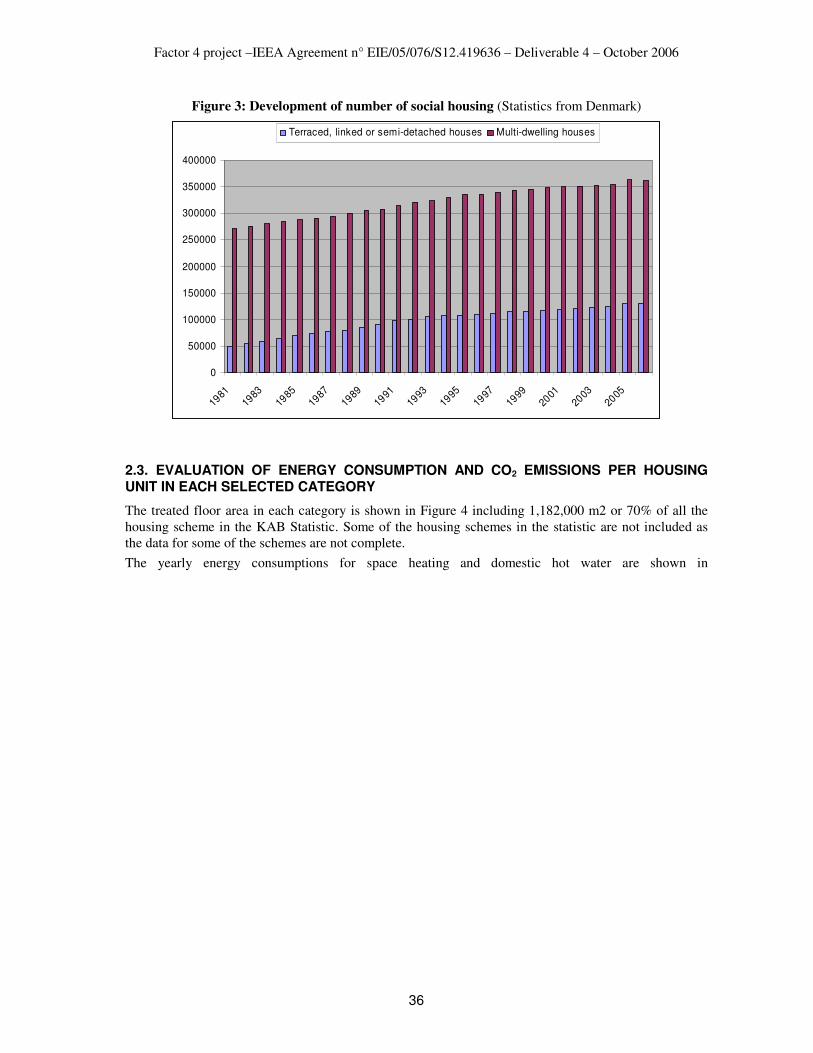
The development of number of social housing during the last 25 years is showing in

Factor 4 project –IEEA Agreement n° EIE/05/076/S12.419636 – Deliverable 4 – October 2006
34
Figure 3. In 1981 there were 334.000 houses and 513.000 houses in year 2005 or an increase on 2% per year.
Factor 4 project –IEEA Agreement n° EIE/05/076/S12.419636 – Deliverable 4 – October 2006
35
Figure 1: Distribution of the Danish social housing stock in different construction types
(Statistics from Denmark)
0,0%
1,8%
25,6%
70,5%
1,7%
0,2%
0,1%
0,0%
0,0%
0% 10% 20% 30% 40% 50% 60% 70% 80%
Farm houses
Detached houses
Terraced, linked or semi-detached houses
Multi-dwelling houses
Student hostels
Residential buildings for communities
Other residential building
Unknown
Occupied weekend cabins (2005-)
Figure 2: Distribution of the construction of new social houses including all terraced, linked or
semi-detached and multi-dwelling houses depending on the construction date
(Statistics from Denmark).
0
10000
20000
30000
40000
50000
60000
70000
1900
-190
4
1905
-190
9
1910
-191
4
1915
-191
9
1920
-192
4
1925
-192
9
1930
-193
4
1935
-193
9
1940
-194
4
1945
-194
9
1950
-195
4
1955
-195
9
1960
-196
4
1965
-196
9
1970
-197
4
1975
-197
9
1980
-198
4
1985
-198
9
1990
-199
4
1995
-199
9
2000
-200
4
Factor 4 project –IEEA Agreement n° EIE/05/076/S12.419636 – Deliverable 4 – October 2006
36
Figure 3: Development of number of social housing (Statistics from Denmark)
0
50000
100000
150000
200000
250000
300000
350000
400000
1981
1983
1985
1987
1989
1991
1993
1995
1997
1999
2001
2003
2005
Terraced, linked or semi-detached houses Multi-dwelling houses
2.3. EVALUATION OF ENERGY CONSUMPTION AND CO2 EMISSIONS PER HOUSING UNIT IN EACH SELECTED CATEGORY
The treated floor area in each category is shown in Figure 4 including 1,182,000 m2 or 70% of all the housing scheme in the KAB Statistic. Some of the housing schemes in the statistic are not included as the data for some of the schemes are not complete.
The yearly energy consumptions for space heating and domestic hot water are shown in
Factor 4 project –IEEA Agreement n° EIE/05/076/S12.419636 – Deliverable 4 – October 2006
37
Figure 5 as average values for each category.
By use of the treated floor area and the energy consumption per floor area the total energy consumption for each category are calculated and shown in

Factor 4 project –IEEA Agreement n° EIE/05/076/S12.419636 – Deliverable 4 – October 2006
38
Figure 6. The total energy consumption for all categories is 155GWh per year.
Based on the energy consumption in

Factor 4 project –IEEA Agreement n° EIE/05/076/S12.419636 – Deliverable 4 – October 2006
39
Figure 6 the CO2 emission is calculated and shown in each selected category. The total CO2 emission is 20,145 ton per year. The calculations of the CO2 emission are based on the following:
− District heating: 35 kgCO2/GJ
− Natural Gas: 57 kgCO2/GJ
− LKV: 35 kgCO2/GJ
The emission from District heating is the average for the country.
Factor 4 project –IEEA Agreement n° EIE/05/076/S12.419636 – Deliverable 4 – October 2006
40
Figure 4: Size of the houses (treated floor area x1000, total 1,182,000 m2) in each category
BR00 BR01 BR02 BR00 BR01 BR02 BR00 BR01 BR02 BR00 BR01 BR02
no 64
yes 241 102
no 22 31 54 11 3 20
yes 6 8 204 15 40 35
no 10
yes 6 24 84 4
no
yes
no 34 2 2
yes 9 7
no 1 1
yes 10
no 7 31
yes
no 25 57
yes
no 3 2
yes 7
Single pipe
Double pipe
Dis
tric
t hea
ting
Combined
Combined
CH
PN
atu
ral ga
s
Combined
Single pipe
Double pipe
Single pipe
Double pipe
Terrace houses Building block
Sup
ply Distribution BEMS
Single houses Mixed housing
Climatic data
Factor 4 project –IEEA Agreement n° EIE/05/076/S12.419636 – Deliverable 4 – October 2006
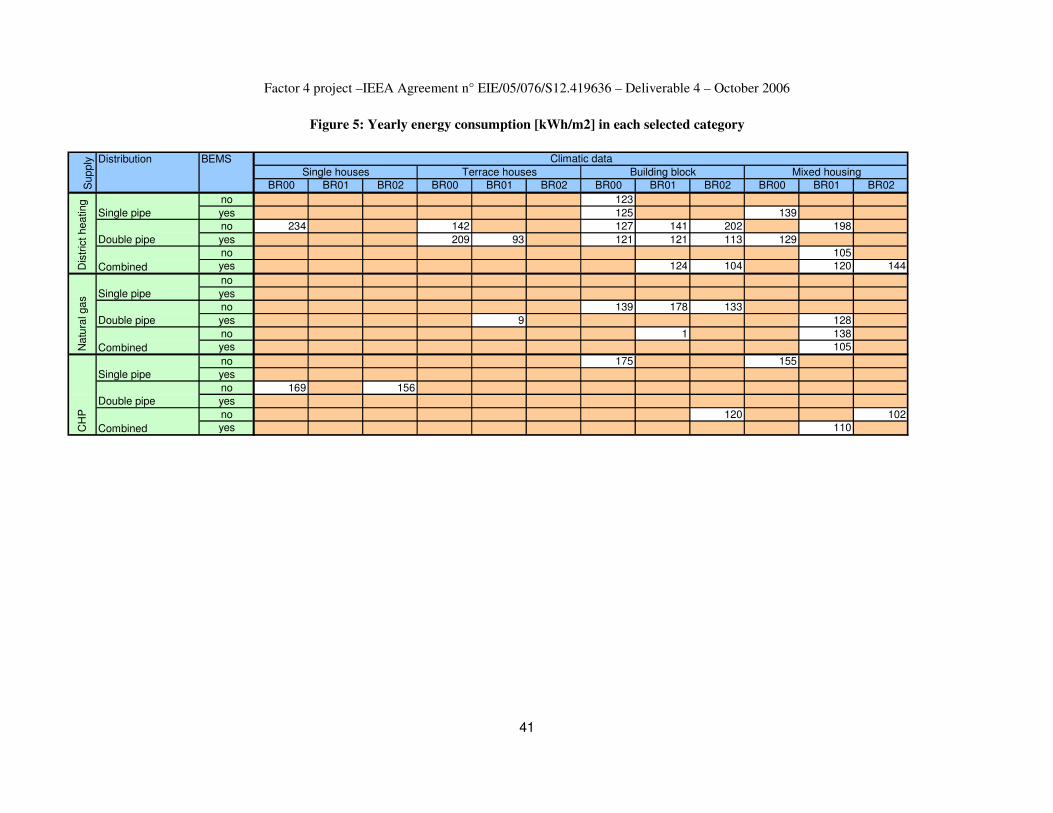
41
Figure 5: Yearly energy consumption [kWh/m2] in each selected category
BR00 BR01 BR02 BR00 BR01 BR02 BR00 BR01 BR02 BR00 BR01 BR02
no 123
yes 125 139
no 234 142 127 141 202 198
yes 209 93 121 121 113 129
no 105
yes 124 104 120 144
no
yes
no 139 178 133
yes 9 128
no 1 138
yes 105
no 175 155
yes
no 169 156
yes
no 120 102
yes 110
Double pipe
Combined
CH
P
Single pipe
Sup
ply Distribution BEMS Climatic data
Single houses Terrace houses Building block Mixed housing
Dis
tric
t hea
ting
Single pipe
Double pipe
Combined
Combined
Na
tura
l ga
s Single pipe
Double pipe

Factor 4 project –IEEA Agreement n° EIE/05/076/S12.419636 – Deliverable 4 – October 2006
42
Figure 6: Yearly energy consumption [GWh] in each selected category
BR00 BR01 BR02 BR00 BR01 BR02 BR00 BR01 BR02 BR00 BR01 BR02
no 0 0 0 0 0 0 7872 0 0 0 0 0
yes 0 0 0 0 0 0 30125 0 0 14178 0 0
no 5148 0 0 4402 0 0 6858 1551 606 0 3960 0
yes 0 0 0 1254 744 0 24684 1815 4520 4515 0 0
no 0 0 0 0 0 0 0 0 0 0 1050 0yes 0 0 0 0 0 0 0 744 2496 0 10080 576
no 0 0 0 0 0 0 0 0 0 0 0 0
yes 0 0 0 0 0 0 0 0 0 0 0 0
no 0 0 0 0 0 0 4726 356 266 0 0 0
yes 0 0 0 0 81 0 0 0 0 0 896 0
no 0 0 0 0 0 0 0 1 0 0 138 0yes 0 0 0 0 0 0 0 0 0 0 1050 0
no 0 0 0 0 0 0 1225 0 0 4805 0 0
yes 0 0 0 0 0 0 0 0 0 0 0 0
no 4225 0 8892 0 0 0 0 0 0 0 0 0
yes 0 0 0 0 0 0 0 0 0 0 0 0
no 0 0 0 0 0 0 0 0 360 0 0 204
yes 0 0 0 0 0 0 0 0 0 0 770 0
BEMS
Single houses Terrace houses Building block
Double pipe
CH
P
Single pipe
Supp
ly Distribution
Combined
Natu
ral g
as Single pipe
Double pipe
Combined
Mixed housing
Dis
tric
t h
eating
Single pipe
Double pipe
Combined

Factor 4 project –IEEA Agreement n° EIE/05/076/S12.419636 – Deliverable 4 – October 2006
43
Figure 7: Yearly CO2 emission (total 20,153 ton per year) in each selected category
BR00 BR01 BR02 BR00 BR01 BR02 BR00 BR01 BR02 BR00 BR01 BR02
no 0 0 0 0 0 0 937 0 0 0 0 0
yes 0 0 0 0 0 0 3.585 0 0 1.687 0 0
no 613 0 0 524 0 0 816 185 72 0 471 0
yes 0 0 0 149 89 0 2.937 216 538 537 0 0
no 0 0 0 0 0 0 0 0 0 0 125 0
yes 0 0 0 0 0 0 0 89 297 0 1.200 69
no 0 0 0 0 0 0 0 0 0 0 0 0
yes 0 0 0 0 0 0 0 0 0 0 0 0
no 0 0 0 0 0 0 496 37 28 0 0 0
yes 0 0 0 0 9 0 0 0 0 0 94 0
no 0 0 0 0 0 0 0 0 0 0 14 0
yes 0 0 0 0 0 0 0 0 0 0 110 0
no 0 0 0 0 0 0 146 0 0 572 0 0
yes 0 0 0 0 0 0 0 0 0 0 0 0
no 503 0 1.058 0 0 0 0 0 0 0 0 0
yes 0 0 0 0 0 0 0 0 0 0 0 0
no 0 0 0 0 0 0 0 0 43 0 0 24
yes 0 0 0 0 0 0 0 0 0 0 92 0CH
P
Single pipe
Double pipe
Combined
Na
tura
l gas Single pipe
Double pipe
Combined
Dis
tric
t hea
ting
Single pipe
Double pipe
Combined
Sup
ply Distribution BEMS
Single houses Terrace houses Building block Mixed housing

Factor 4 project –IEEA Agreement n° EIE/05/076/S12.419636 – Deliverable 4 – October 2006
44
2.4. ENERGY CONSUMPTION AND CO2 EMISSIONS ANALYSIS
The yearly energy consumption for space heating and domestic hot water in 17,189 dwellings in the selected category is 155 GWh. The 17,189 dwellings represent 3.3% of the whole social housing stock in Denmark. Extrapolating the data from the KAB Statistic to all social housing schemes in Denmark the total energy consumption in the social housing scheme is 4626 GWh or 11% of the whole building sector.
Table 1: Yearly energy consumption and CO2 emission from the social housing scheme in Denmark.
Number of
Dwellings
Energy
consumption
[GWh/year]
CO2 emission
[ton/year]
KAB estates
(KAB Statistic) 17,189 155 20,153
All social housing in
Denmark
(Statistics Denmark)
513,000 4,626 601,000
The CO2 emission from the social housing stock contributes by 15% of the whole building sector or 1% of CO2 emission of the country. 2.5. WORKING OUT SCENARY ON THE DEMOLITION AS WELL AS THE EVOLUATION OF THE SOCIAL HOUSING STOCK
The numbers of multi-dwelling houses which are constructed before 1980 are shown in Figure 8 during the last 25 years. Total of 775,000 dwellings of all kind exists in year 1981 and it is nearly unchanged until 2006. That means very few multi-dwelling houses are demolished in this period.
Figure 9 shows the development of terraced, linked or semi-detached houses and multi-dwelling houses in Denmark during the last 25 years. The trend shows a 60% increase in the social housing stock. The growth of the number of houses in Danish social housing stock will bee lower and it is set to 20% in the scenario.
The development of the CO2 emission from district heating during the last 25 years is shown on Figure 10. In general the CO2 emission from the housing stock is decreasing by 25% during the last 15 years even the energy consumption has been constant during the same period. The CO2 emission is reduced because of the use of sustainable energy in the district heating supply system (biofule and waste energy).
Figure 8: Number of multi dwelling houses constructed in the period from 1900 to 1979 in Denmark
during the last 25 years (Denmark Statistics)
1900-1979
700000
710000
720000
730000
740000
750000
760000
770000
780000
790000
800000
1981
1983
1985
1987
1989
1991
1993
1995
1997
1999
2001
2003
2005
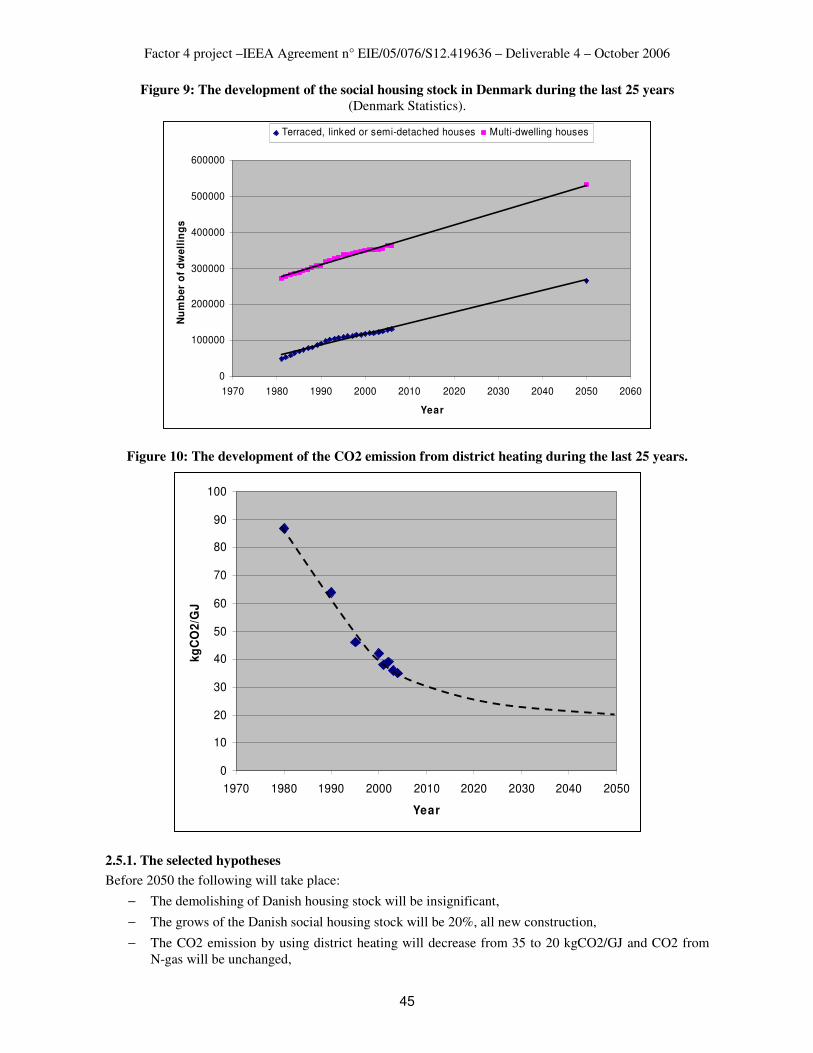
Factor 4 project –IEEA Agreement n° EIE/05/076/S12.419636 – Deliverable 4 – October 2006
45
Figure 9: The development of the social housing stock in Denmark during the last 25 years
(Denmark Statistics).
0
100000
200000
300000
400000
500000
600000
1970 1980 1990 2000 2010 2020 2030 2040 2050 2060
Year
Nu
mb
er o
f d
wel
lin
gs
Terraced, linked or semi-detached houses Multi-dwelling houses
Figure 10: The development of the CO2 emission from district heating during the last 25 years.
0
10
20
30
40
50
60
70
80
90
100
1970 1980 1990 2000 2010 2020 2030 2040 2050
Year
kgC
O2/
GJ
2.5.1. The selected hypotheses
Before 2050 the following will take place:
− The demolishing of Danish housing stock will be insignificant,
− The grows of the Danish social housing stock will be 20%, all new construction,
− The CO2 emission by using district heating will decrease from 35 to 20 kgCO2/GJ and CO2 from N-gas will be unchanged,

Factor 4 project –IEEA Agreement n° EIE/05/076/S12.419636 – Deliverable 4 – October 2006
46
− 94% of the dwellings are supplied by district heating and 6% by N-gas,
− With the present energy standard the average energy consumption per treated floor will be unchanged until 2050.
2.5.2. Results
The number dwellings in the social housing stock in Denmark are given in the table below as it is today and in year 2050 assuming a 20 % increase in the number of social housing (new construction). The distribution between district heating (93%) and N-gas (7%) correspond to the KAB Statistic. The total number of social housing in year 2006 and the distribution between building block (71%) and low rise buildings (29%) is from the Danish Statistic.
Table 1:
No Dwellings 2006 2050
District heating 93% Block 71% 338.579 406.295 Low 29% 138.801 166.561
N-gas 7% Block 71% 24.820 29.784 Low 29% 10.175 12.210 512.375 614.850
The number of sqm in the social housing stock is given in the Table . The average size of the dwellings in the selected category is from the KAB Statistic. The total sqm is found by multiplying the number of dwellings by the average size of the dwellings of the selected category.
Table 2
Sqm.
Average size per
dwelling 2006 2050
District heating Block 66,0 22.346.216 26.815.459 Low 75,3 10.451.716 12.542.060
N-gas Block 47,4 1.176.466 1.411.760 Low 74,0 752.949 903.539 34.727.348 41.672.818
The total energy consumption for space heating and domestic hot water is given in Table 3. The average energy consumption in the selected category is from KAB Statistic. The total energy consumption is found by multiplying the sqm from Table 2 by the average energy consumption of the selected category.
Table 3
Energy, PJ per year [kWh/m2] 2006 2050
District heating Block 123 9,9 11,9 Low 145 5,5 6,5
N-gas Block 150 0,6 0,8 Low 134 0,4 0,4 16,3 19,6
The total CO2 emission is given in Table 4 assuming the CO2 emission by using district heating decrease from 35 to 20 kgCO2/GJ and the CO2 emission from N-gas is unchanged.
Table 4
CO2, ton pr. year [kg/GJ] 2006 2050
District heating Block 35 346.322 237.478 Low 35 190.953 130.939
N-gas Block 57 36.212 43.454 Low 57 20.704 24.844 594.190 436.715

Factor 4 project –IEEA Agreement n° EIE/05/076/S12.419636 – Deliverable 4 – October 2006
47
2.6. THE SELECTED TYPOLOGIES FOR THE DANISH CASE STUDIES
Single houses BR00
Single houses BR02
Terrace houses BR01
Building block BR00
Building block BR02
Mixed housing BR01
0
5.000
10.000
15.000
20.000
25.000
30.000
35.000
Single houses BR00
Single houses BR01
Single houses BR02
Terrace houses BR00
Terrace houses BR01
Terrace houses BR02
Building block BR00
Building block BR01
Building block BR02
Mixed housing BR00
Mixed housing BR01
Mixed housing BR02
District heating
Natural gasCHP
MWh
2.7. THE DANISH SELECTED CASE STUDIES
Case study 1 :
Name of estate Kildevænget
Building type Building block
Number of units 450
Treated floor area 35,136 m2
Construction date 1958
Heating system and energy source District heating
Location Copenhagen/Søborg
Monitored data Heating: 135.1 kWh/m2 year
Electricity:: 6.4 kWh/m2
Water: 0.70 m3/m2
CO2: 910 ton
Case study 2 :
Name of estate Bøgehegnet
Building type Mixed housing
Number of units 298
Treated floor area 24,165 m2
Construction date 1985
Heating system and energy source District heating
Location Greve - suburbs
Monitored data Heating: 113.6 kWh/m2 year
Electricity:: 7.0 kWh/m2

Factor 4 project –IEEA Agreement n° EIE/05/076/S12.419636 – Deliverable 4 – October 2006
48
Water: 1.09 m3/m2
CO2: 493 ton
Case study 3 :
Name of estate Egebjergvang
Building type Mixed housing
Number of units 146
Treated floor area 10,248 m2
Construction date 1985
Heating system and energy source Natural Gas
Location Ballerup – suburbs
Monitored data Heating: 136.4 kWh/m2 year
Electricity:: 13.0 kWh/m2
Water: 0.92 m3/m2
CO2: 393 ton

Factor 4 project –IEEA Agreement n° EIE/05/076/S12.419636 – Deliverable 4 – October 2006
49
PART 3 : ITALY
3.1. THE ITALIAN SOCIAL HOUSING BUILDING STOCK
In the last five years social housing in Italy has gone through a period of terrible crisis. With the reappearance of the phenomenon of housing distress, the Government has not stepped in to support the supply of social housing.
The last financings date back to 2001, but due to budgetary reasons, those meant to provide for the completion of regional programs have been reduced by 50% of their original value.
The tradition channels destined to satisfy the demand for social housing, public building and subsidized housing, have passed respectively from 90,000 housings financed in 1984 to 13,000 housings in 2004.
Those who have managed the supply of social housing in Italy have traditionally been the following:
- the I.A.C.P. (Istituti Autonomi Case Popolari), associated with Federcasa – complete projects that are paid for by the State, and destined exclusively for rent-controlled use.
- Housing Cooperatives, associated with national groups which include principally: A.N.C.Ab and Federabitazione, which complete projects with subsidized mortgages or public subsidization, traditionally destined in the past mostly for property, but in the last several years exclusively for rent.
- Welfare agencies, which have in the past, with the investments of public welfare funds, created a portfolio of housings destined to supply lower-cost tenant housing.
- Town Councils which have proprietorship of various housings destined for rent-controlled leasing.
- Construction companies which create housings destined for ownership with a partial subsidization by the State.
In the beginning of 2000 the social housing supply was valued as the following:
- I.A.C.P.: 1,000,000 rent-controlled housings
- Cooperatives: 40,000 rent-stabilized housings plus around 35,000 housings per year destined to ownership at lower prices.
- Welfare agencies: 100,000 housings rent-stabilized housings
- Towns Governments: 100,000 rent-controlled housings
- Companies – 20,000 housings per year destined for ownership at lower prices
Following the launch of sales programs for the public housings, aimed at roommates and the reduction of public financing, the scenario has changed in the following ways:
- I.A.C.P.: 800,000 rent-controlled housings
- Cooperatives: 45,000 rent-stabilized housings plus around 6,500 housings per year destined to ownership at lower prices.
- Welfare agencies: complete cession of properties
- Town Councils: 80,000 rent-controlled housings
- Companies – 4,500 subsidized housings per year destined for ownership
In total, the number of social tenant housings in Italy destined for rent is therefore estimated at
925,000, compared to the 3,200,000 rental housings available on the free market.
The erosion of residential tenant property which is traditionally aimed at satisfying the social demand for habitation (70% for private property; 19% IACP and state administration property; 11% belong to private companies, welfare agencies, and cooperatives) derive from several overlapping factors: firstly, the lack of

Factor 4 project –IEEA Agreement n° EIE/05/076/S12.419636 – Deliverable 4 – October 2006
50
investment attractiveness due to an onerous fiscal regime and the uncertainty of contractual conditions (only recently an object of legislative intervention); the traditional tendency of Italians to prefer access to property, motivated also by the scarce presence of housing supply in the real-estate market which is affordable to middle-income individuals; a downturn in interest rates on mortgages, which has spurred the desire to acquire housing; finally, the huge shift of public residential properties from belonging to Istituti
Autonomi Case Popolari to belonging to both public and private welfare agencies.
The narrow dimensions and the rigidity of the residential tenant market have been accentuated by some recent dynamics related to the new housing demand:
- in 2005 the number of families which occupied a tenant housing on the free market was around 3.2 million, with rent accounting for an average of 24% of net income. For the weaker families, meaning those who have annual income of less than €10,000, the rent accounted for an alarming 47% of income. But even for the higher income families who earn from €10,000 to €20,000, housing costs still are fairly significant (29%). Considering that on average every year around 750,000 rental contracts are renewed, in the next two years the adjusting of rents to current levels will become result in a worsening of economic conditions for around 50% of families who rent.
- By 2007, for families with a net income of less than €10,000, the rent expenses will reach 66% of total income, while for those with income between €10000 – 20000, it will reach 38%. The increase in rent prices will negatively impact household expenses, thus amplifying the distress households will experience. In 2007, for 1.7 million families, the rent expenses will surpass the threshold of 30%, drastically reducing the income available and subtracting consumption resources for saving and investments.
- the increasing presence of foreigners in our country: in 2006 the immigrants made up comprehensively 4.6% of the resident population at the national level. Of these, about 40% have a precarious living situation
- the aging of the Italian population has been accentuated. In 2001 18.2% of Italians were above the age of 65; 26.8% of the elderly live alone and 40.2% live together with a spouse; 78% of the elderly are owners of the house in which they live.
- Changing locations for employment purposes has increased: over 100,000 families per year move definitively and about 750,000 temporarily.
- about 300,000 university students study in a city different from that of which they are originally from; of these only 30,000 have a stable living supply.
In 21st century Italy, living policies are continuously overlapping more with city and territorial policies. Living can’t be separate from a notion of quality of the settlement, availability of residential services, communication, and transport. It is precisely for this reason that in the course of the last 10 years of the century, through the strengthening of competencies related to laws which affected diverse spending channels, many house financings from the city and territory have looked to invest significantly in not only housings and their respective scenario, but also in the shortages which are still present today: infrastructure, services, open spaces, etc…
The revival programs as well as the urban redevelopment, launched in the second half of the decade, respond to this need of creating a city which is once again stable and functioning.
And then there is the issue of how to adapt the existent residential property with the current need to save energy.
The decentralization of competencies in the field of residential housing was launched, thus increasingly linking the living needs to specific subjects within the single territorial settings: the approval of the law n. 112/99 is following this reasoning, transferring the state competencies within this field to the region. However, there remain current problems owing to the exhaustion of traditional finance resources for the sector, which now require a new phase of defining the social politics at the regional level.
The support for house property is pursued, directly and indirectly, through a few laws, which in the last 5 years of the 1990’s have become operative: Law 560/93 defined the plan for the cession of IACP housing; Law 104/96 provided for the transferring of housing property belonging to welfare agencies. A final support

Factor 4 project –IEEA Agreement n° EIE/05/076/S12.419636 – Deliverable 4 – October 2006
51
also derived from fiscal detractions for the revival of a first place of living, which provided initially for a reduction of 41%, and then later changed to 35% with a VAT (value added tax) of 10%.
The objective of regaining equilibrium by the locative regime was undertaken by the passing of a specific law, 431/98. This law aims to provide support, through both the institution of an observatory on living conditions and a social fund for those low-income families in distress who are renting tenant housing.
Finally a new impulse for housing politics to reconstruct a framework together comes from new legislation, which has been recalled in the environment surrounding the finance laws 2000 and 2001 and current legal measures.
The new financial availability put aside by the state foresees the continuation of experimentation launched through city reconstruction programs. This applies particularly to “neighbourhood contracts” and the providing of incentives for building intervention aimed at increasing tenant property. It also aims to respond to the housing need of special social groups (elderly, students, non-UE citizens, migrant workers, ecc.) with particular attention paid to the problems linked to environmental sustainability and energy conservation.
In recent periods, the orientation of the local system has been consolidated so it can reconsider the expansive forecasts of general urban instruments. The downsizing is particularly focused on residence housing: the availability of constructible areas for the creation of new housings therefore tends to become continuously more marginal, producing inevitable price rises for the few areas already present. In addition, the prevailing choice of locating new residential building sites in the areas of urban transformation does not align well with the objective of creating equal access to the city. In fact, excluding the complex programs aimed at the revival and redevelopment of neighbourhoods with public housing, (such as the “neighbourhood contracts” and the “urban revival programs”), the other methods of intervention in the sector (integrated programs, urban revival programs, Prusst) are based upon the development of private areas which allow for the urban-economic exchange between the public and the private sector: completion of public-works projects by the private sector and concession of new cubatures by the public administration, even if they are an exception to urban instruments currently in effect.
Until now the cost for the area, net of urban expenses, for an intervention of a subsidized building which is part of the PEEP area, varied between 12-20% of the total construction cost. Now, with the exhaustion of and a lack of new proposals for areas with lower prices, this value tends to align with prices of free-market housing, which varies currently between 60-85%.
It is evident that such a situation may make difficult the completion of social building programs (low-cost tenant housings for special social groups). This thus would exclude the weaker segments of the housing market from new market dynamics, who in the past have traditionally be supported by subsidized housing (young couples, single-income individuals, the elderly, etc..).
Considering the need for social housing financings, some town councils have promoted initiatives that would support the supply by private companies of low-cost tenant housing.
Such initiatives consist of the possibility of creating more buildings on the company property, with the requirement that a part of this higher quantity is destined for social housing.
At the moment there are not yet quantitative results which can be analyzed for this initiative.
Sources: ISTAT, Osservatorio ANCAb-Cresme & Monitor Immobiliare: Rapporto nazionale Italiano – Istambul + 5

Factor 4 project –IEEA Agreement n° EIE/05/076/S12.419636 – Deliverable 4 – October 2006
52
3.2. THE ANALYSIS OF ENERGY CONSUMPTION AND OF CO2 EMISSIONS
ITALY - SOCIAL HOUSING BUILDINGS CO2 EMISSION (Tons)
Energy and heating
system Total nb of dwellings CO2 tons
Gas 722 147,50 1 534 924,51 Electricity 141 432,50 415 528,69 Oil 45 695,00 185 487,43 Coal 3 052,50 6 488,09 Other 12 672,50 37 231,81
925 000,00 2 179 660,52 Estimation by ABITA soc coop
1
Gas
Ele
ctricity
Oil
Coal
Oth
er
0100 000200 000300 000400 000500 000600 000700 000800 000900 0001 000 0001 100 0001 200 000
1 300 0001 400 0001 500 000
1 600 000
Gas
Electricity
Oil
Coal
Other
Source ABITA for Factor 4
3.3. DEMOLITION SCENARII AND THEIR IMPACTS
Demolition is not a potential scenario in Italy.
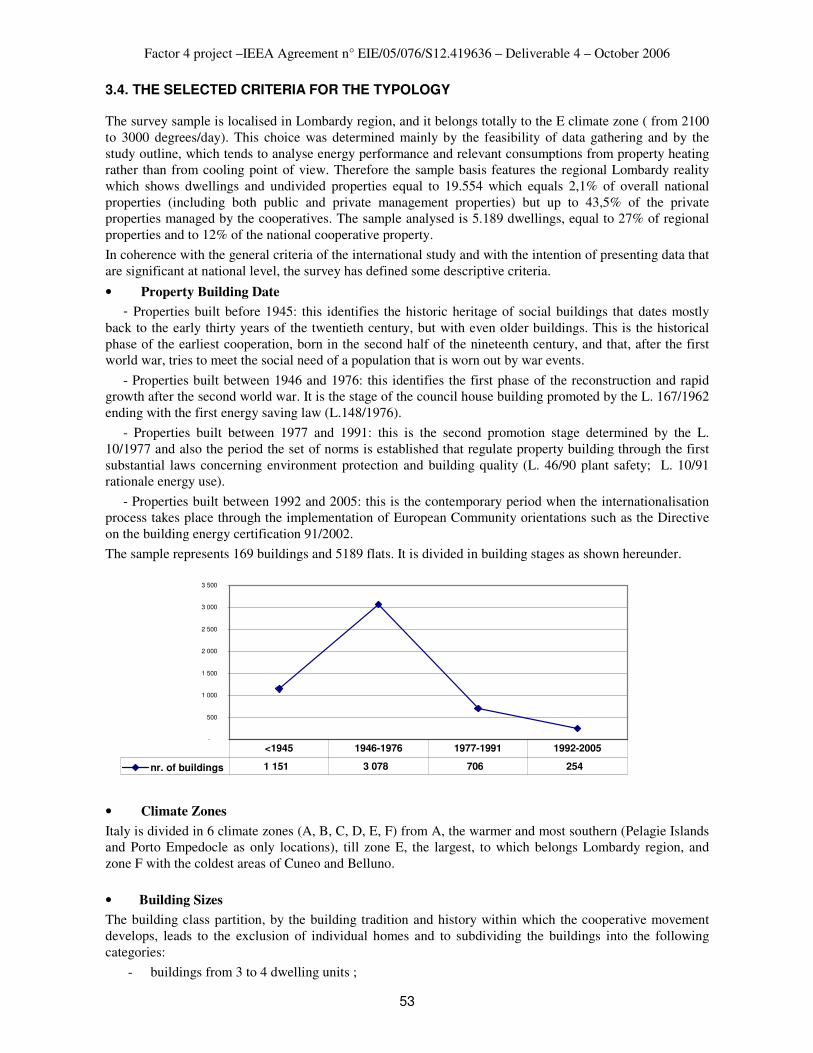
Factor 4 project –IEEA Agreement n° EIE/05/076/S12.419636 – Deliverable 4 – October 2006
53
3.4. THE SELECTED CRITERIA FOR THE TYPOLOGY
The survey sample is localised in Lombardy region, and it belongs totally to the E climate zone ( from 2100 to 3000 degrees/day). This choice was determined mainly by the feasibility of data gathering and by the study outline, which tends to analyse energy performance and relevant consumptions from property heating rather than from cooling point of view. Therefore the sample basis features the regional Lombardy reality which shows dwellings and undivided properties equal to 19.554 which equals 2,1% of overall national properties (including both public and private management properties) but up to 43,5% of the private properties managed by the cooperatives. The sample analysed is 5.189 dwellings, equal to 27% of regional properties and to 12% of the national cooperative property.
In coherence with the general criteria of the international study and with the intention of presenting data that are significant at national level, the survey has defined some descriptive criteria.
• Property Building Date
- Properties built before 1945: this identifies the historic heritage of social buildings that dates mostly back to the early thirty years of the twentieth century, but with even older buildings. This is the historical phase of the earliest cooperation, born in the second half of the nineteenth century, and that, after the first world war, tries to meet the social need of a population that is worn out by war events.
- Properties built between 1946 and 1976: this identifies the first phase of the reconstruction and rapid growth after the second world war. It is the stage of the council house building promoted by the L. 167/1962 ending with the first energy saving law (L.148/1976).
- Properties built between 1977 and 1991: this is the second promotion stage determined by the L. 10/1977 and also the period the set of norms is established that regulate property building through the first substantial laws concerning environment protection and building quality (L. 46/90 plant safety; L. 10/91 rationale energy use).
- Properties built between 1992 and 2005: this is the contemporary period when the internationalisation process takes place through the implementation of European Community orientations such as the Directive on the building energy certification 91/2002.
The sample represents 169 buildings and 5189 flats. It is divided in building stages as shown hereunder.
-
500
1 000
1 500
2 000
2 500
3 000
3 500
nr. of buildings 1 151 3 078 706 254
<1945 1946-1976 1977-1991 1992-2005
• Climate Zones
Italy is divided in 6 climate zones (A, B, C, D, E, F) from A, the warmer and most southern (Pelagie Islands and Porto Empedocle as only locations), till zone E, the largest, to which belongs Lombardy region, and zone F with the coldest areas of Cuneo and Belluno.
• Building Sizes
The building class partition, by the building tradition and history within which the cooperative movement develops, leads to the exclusion of individual homes and to subdividing the buildings into the following categories:
- buildings from 3 to 4 dwelling units ;

Factor 4 project –IEEA Agreement n° EIE/05/076/S12.419636 – Deliverable 4 – October 2006
54
- from 5 to 8;
- from 9 to 15;
- more than 16 units
This division features from the earlier production of buildings, with a small number of units, till the more recent, of larger size. To notice that the most interpretable results pertain to the class of larger size that gathers the most significant part of the sample: one can see the gradual increase of unit size and then, the larger buildings of the expansion years are followed by a tendentially smaller size edification.
Building size / building period <1945 1946-1976 1977-1991 1992-2005
3-4 dwelling units
42 5-8 dwelling units
8
60 56 72 58 9-15 dwelling units
12 59 12 13
48 59 60 73 < 16 dwelling units
33 61 55 44
Dwelling units size in sq m. Average nr. of dwelling units
per building
• Heating Plants
Typologies found and registered are the following:
- centralised gas
- autonomous gas
- mixed systems (central heating + electric hot water plant)
- mixed systems (stove or fireplace + electric hot water plant)
- fuel oil
The heating systems of the sample buildings are represented in the following graph. The centralised methane gas plant prevails, which means that the buildings have undergone a significant technological update in the recent years. Fuels such as oil are by now marginal; mixed systems with traditional stove of fireplace heating belong only to the oldest buildings and, anyway, to a residual quota already in a management substitution programme. Also autonomous heating is rather scant. To notice that the centralisation of plants and their renovation has sometimes brought about last generation plants with co-generation and/or preparation to future connections to district heating. It is also frequent that the management of the plants is entrusted to external companies, sometimes in connections with individual heat meter and energy supply.

Factor 4 project –IEEA Agreement n° EIE/05/076/S12.419636 – Deliverable 4 – October 2006
55
MIXED SYSTEMS
(centralized heating
+ electric water
plant)
1%
MIXED SYSTEMS
(stove or fireplace +
electric hot water
plant)
6% OIL
1%
AUTONOMOUS
GAS
5%
CENTRALIZED
GAS
87%
• Localization
The localisation of the cooperative properties is mostly central in the city fabric, taking into account that:
- The end 1800s and early 1900s they occupies central areas or reconstruction areas that have soon become consolidated;
- The production belonging to the urban expansion stage is within the metropolitan area of Milan, i.e. decentralized as regards as the heart of the capital city, but central as regards as the expansion of the historic settlements;
- The recent social production of buildings is in fact rather limited, the most recent production being oriented mostly to the private market, to renovation and extension works as determined by the possibility of using the attics.
The buildings have almost totally developed in accordance with various forms of public incentives, that vary from period to period and from administration to administration (use of public building areas, grants against building costs, etc.).
Therefore, since classification categories such as “social urban area/central areas/decentralised areas” are not necessarily alternative, and owing to the difficulty of attributing a reasonable and real significance to such definitions as “central/rural areas” in a geographic area that is subject to conurbation processes such as the one in Lombardy, this feature has not been studied.
• Management Organization
The sample has been chosen on the basis of its cooperative management, to which it belongs entirely.
• Maintenance
In accordance with the schema adopted by the project partners, the surveyed interventions are the following:
- Interventions of extraordinary maintenance: include façade and balcony maintenance works, possible overall enhancement works, technological service updating such as lift insertion. Most cases show property enhancement to abide by the security norms concerning gas and electric plants (as per L. 46/90);
- Interventions on windows (original windows being changed with others with double glazing and thermic features, although for the latter feature specific data were not available) ;
- interventions on walls (mostly insulation of external walls);
- Roof interventions (roof insulation);
- Airtightness interventions. A non surveyed category as it is not identified trough a specific intervention, other than the window change (although it does not accomplishes it entirely).

Factor 4 project –IEEA Agreement n° EIE/05/076/S12.419636 – Deliverable 4 – October 2006
56
All in all 8884 maintenance interventions have been registered on 90% surveyed homes. The building appear to be in general good, sometimes very good, conditions concerning mechanical plants, that have been totally changed in recent times. The range of characteristics of the outside covering on which maintenance interventions have been far less frequent, are quite different and more diverse.
To keep in mind some limits concerning the survey, i.e.: the high number of interventions is due to the way of counting them, made per living units – survey’s comparison base unit – and not per building. Although it is usual to refresh the flat at every tenant change, the most significant interventions in terms of energy concern the building more than the single living unit. One can therefore say that all buildings have undergone some maintenance, but that the category retrofit, in terms of extraordinary
maintenance, included mostly interventions of electric and gas plant enhancing and /or façade renovation or increase of the building technological equipment (lifts, autoclaves etc.), whilst the most “energy” significant interventions concern the windows, walls, roof category.
interventi di manutenzione
0
500
1000
1500
2000
2500
3000
3500
4000
4500
M ANUTENZIONE FINESTRE M URI TETTO ARIA
• Efficiency
The building energy efficiency is drawn from the opinions of the interviewed technician and from the interventions declared for each surveyed building. Nevertheless this remains a rough estimate. Coherently with the schema adopted by the parties, the following meanings have been established:
- poor efficiency: no intervention;
- medium efficiency: intervention due to abiding by norms;
- good efficiency: presence of innovative plants or special packages of external masonry. These include interventions in outer surface insulation of the external walls, and individual heat meter or co-generation.
Concerning the measurement of room heating temperature and hot water temperature, nothing was possible to account for but the declaration of presumptive law abiding; different and more operational elements should be the object of an energy survey on specific buildings.

Factor 4 project –IEEA Agreement n° EIE/05/076/S12.419636 – Deliverable 4 – October 2006
57
The estimate of the efficiency of the surveyed properties is represented in the following graph.
estimate of efficiency
POOR
EFFICIENCY
54%MEDIUM
EFFICIENCY
33%
GOOD
EFFICIENCY
13%
3.5. DESCRIPTION OF THE ITALIAN CASE STUDIES SELECTED
Together the three cases chosen cover the different construction phases of the cooperatives’ social housing, from the historical, to the expansion, to the most recent; thus one can grasp the diverse construction typologies and the problems determined by construction materials in long term energy performances. The cases proposed are 12.
Case study 1 :
Building description Neighbourhood of historical setting; some buildings have already undergone a total renovation, but there are still 9 at the original state for a total of 191 flats; the buildings consist in 4/5 storied houses. There is the interesting opportunity to compare the original settings and the ones that follow the retrofitting works already carried out, as well as their possible orientation for future interventions.

Factor 4 project –IEEA Agreement n° EIE/05/076/S12.419636 – Deliverable 4 – October 2006
58
Climatic area E Construction date 1912 Heating system Heating through stove and hot water through electric
boiler In Contratti dei quartieri or not no Location Como, Quartiere Giussani; outside the historical
centre but in an area by now central and consolidated.
Management type Società Cooperativa Edificatrice di Abitazioni per gli operai, Como
Case study 2 : Come
Building type
Number of units
Useful surface (m²)
Collective building with 5 floors
56 units
Climatic area E
Construction date 1927
Heating system and energy source Collective gas plant with individual heat meter
Location in a ZUS (Yes/No) No
Location (city centre, suburbs…) Quartiere Volta, in the consolidated area of city expansion
Description
Type of social owner (OP, SA, SEM) Società Cooperativa Edificatrice di Abitazioni per gli operai, Como
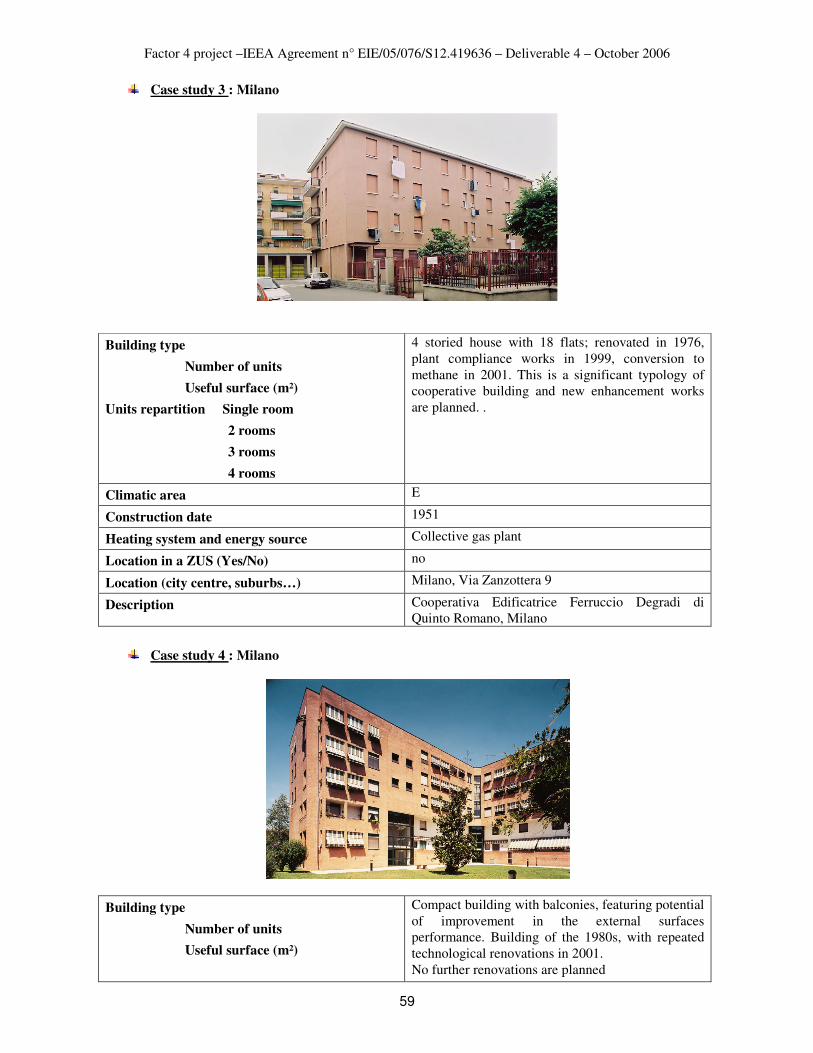
Factor 4 project –IEEA Agreement n° EIE/05/076/S12.419636 – Deliverable 4 – October 2006
59
Case study 3 : Milano
Building type
Number of units
Useful surface (m²)
Units repartition Single room
2 rooms
3 rooms
4 rooms
4 storied house with 18 flats; renovated in 1976, plant compliance works in 1999, conversion to methane in 2001. This is a significant typology of cooperative building and new enhancement works are planned. .
Climatic area E
Construction date 1951
Heating system and energy source Collective gas plant
Location in a ZUS (Yes/No) no
Location (city centre, suburbs…) Milano, Via Zanzottera 9
Description Cooperativa Edificatrice Ferruccio Degradi di Quinto Romano, Milano
Case study 4 : Milano
Building type
Number of units
Useful surface (m²)
Compact building with balconies, featuring potential of improvement in the external surfaces performance. Building of the 1980s, with repeated technological renovations in 2001. No further renovations are planned

Factor 4 project –IEEA Agreement n° EIE/05/076/S12.419636 – Deliverable 4 – October 2006
60
Climatic area E
Construction date 1986
Heating system and energy source Heating and hot water though individual boilers
Location in a ZUS (Yes/No) no
Location (city centre, suburbs…) Milano, Via Zoia 76.
Description Cooperativa Edificatrice Ferruccio Degradi di Quinto Romano, Milano
Type of social owner (OP, SA, SEM)
Case study 5 : Milano
Building description Historic building of early 20th century, headquarter of the cooperative; 42 flats. Meaningful building for historical typology of cooperative property. Building renovated in 1982 and technological adaptation works in 2001. No further interventions are planned
Climatic area E Construction date 1909 Heating system Collective gas plant In Contratti dei quartieri or not no Location Milano, Via Caldera 115 a Management type Cooperativa Edificatrice Ferruccio Degradi di
Quinto Romano, Milano
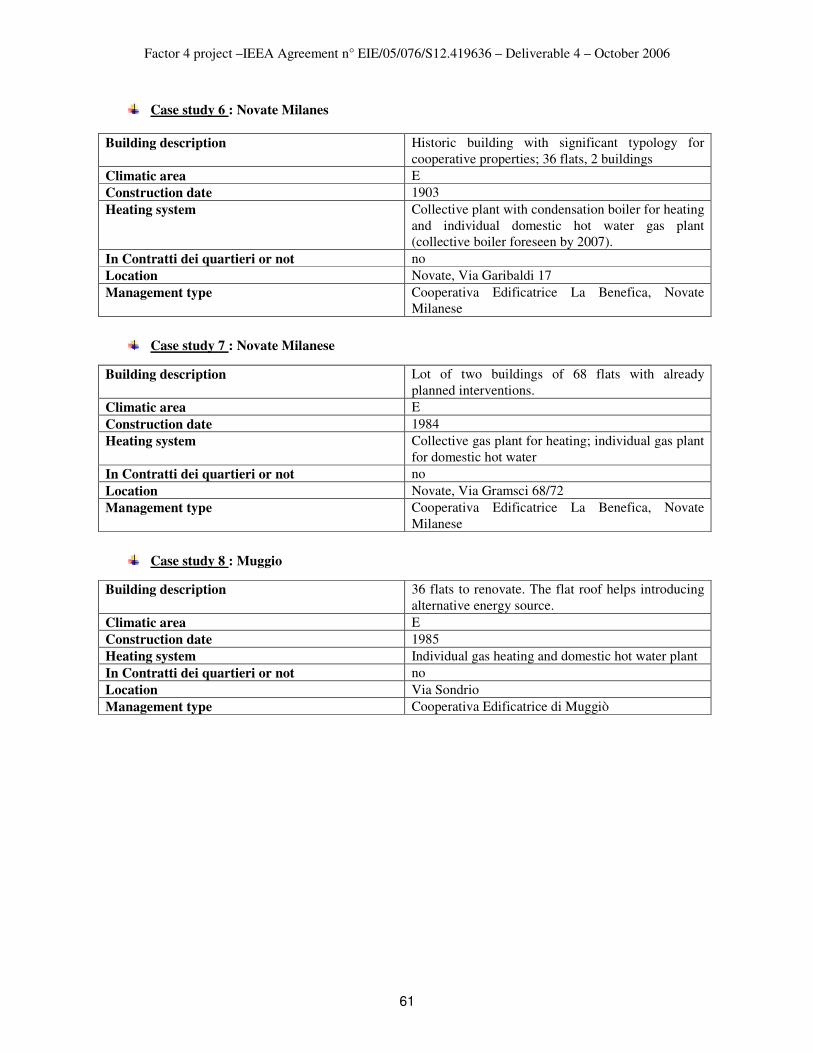
Factor 4 project –IEEA Agreement n° EIE/05/076/S12.419636 – Deliverable 4 – October 2006
61
Case study 6 : Novate Milanes
Building description Historic building with significant typology for cooperative properties; 36 flats, 2 buildings
Climatic area E Construction date 1903 Heating system Collective plant with condensation boiler for heating
and individual domestic hot water gas plant (collective boiler foreseen by 2007).
In Contratti dei quartieri or not no Location Novate, Via Garibaldi 17 Management type Cooperativa Edificatrice La Benefica, Novate
Milanese
Case study 7 : Novate Milanese
Building description Lot of two buildings of 68 flats with already planned interventions.
Climatic area E Construction date 1984 Heating system Collective gas plant for heating; individual gas plant
for domestic hot water In Contratti dei quartieri or not no Location Novate, Via Gramsci 68/72 Management type Cooperativa Edificatrice La Benefica, Novate
Milanese
Case study 8 : Muggio
Building description 36 flats to renovate. The flat roof helps introducing alternative energy source.
Climatic area E Construction date 1985 Heating system Individual gas heating and domestic hot water plant In Contratti dei quartieri or not no Location Via Sondrio Management type Cooperativa Edificatrice di Muggiò

Factor 4 project –IEEA Agreement n° EIE/05/076/S12.419636 – Deliverable 4 – October 2006
62
Case study 9 : Niguarda
Costruzione della nuova centrale termica con cogenerazione
Building description 84 flats; renovation on progress for complete retrofit with external wall insulation, ventilated roof, thermal station; end of works foreseen 2007. Energy audit useful to assess interventions carried out and actual performances.
Climatic area E Construction date 1952-55 Heating system Condensation boiler with micro co-generation,
collective domestic hot water plant; unified thermal station with Hermada 8, 14, Ornato 7 I/E
In Contratti dei quartieri or not no Location Via Hermada 14, “casa Verde” Management type Cooperativa Edificatrice Niguarda
Case study 10 : Niguarda
Building description 12 storied tower building, 2 staircases, 98 flats;
useful to assess renovation on similar typologies such as Ossola and Ledro. Total surface 6.419 sq. m.
Climatic area E

Factor 4 project –IEEA Agreement n° EIE/05/076/S12.419636 – Deliverable 4 – October 2006
63
Construction date 1989 Heating system Collective domestic hot water and heating plant,
with condensation boiler. Intervention date 2005. In Contratti dei quartieri or not no Location Via Grassini Management type Cooperativa Edificatrice Niguarda
Case study 11: Niguarda
Building description Tower building, 152 flats. Energy audit useful to
assess external surfaces enhancement works (small face bricks and double brick wall with air space). Surface 8094 sq. M.
Climatic area E Construction date 1966 Heating system Condensation boiler triple turn of fumes, collective
domestic hot water plant. In Contratti dei quartieri or not no Location Via Ossola Management type Cooperativa Edificatrice Niguarda
Case study 12: Niguarda
Building description Compact tower buildings with 159 flats. Energy
audit useful to assess external surfaces enhancement works (small face bricks and double brick wall with air space). Surface 10.614 sq. m.
Climatic area E Construction date 1969 Heating system Condensation boiler triple turn of fumes, collective
domestic hot water plant In Contratti dei quartieri or not no Location Via Maestri del Lavoro Management type Cooperativa Edificatrice Niguarda

Factor 4 project –IEEA Agreement n° EIE/05/076/S12.419636 – Deliverable 4 – October 2006
64

Factor 4 project –IEEA Agreement n° EIE/05/076/S12.419636 – Deliverable 4 – October 2006
65
PART 4 - GERMANY
4.1. REMINDER UPON THE TYPOLOGY FOR GERMANY
The criteria selected
Building types representing construction periods
In 1993, commissioned by a commission on climate change of the Bundestag the potential contributions to CO2-mitigation by the housing sector were investigated. In this context, a profile of typical existing buildings was developed by IWU – Institut Wohnen und Umwelt, Darmstadt and Forschungszentrum Jülich that allows a detailed calculation of the energy demand and (economic) energy conservation potential /4, 5/ for each of the building types. Using an estimate of the total number of existing buildings of the resp. type a calculation of the total potential of energy consumption resp. energy conservation is possible. This work was actualized by Diefenbach et al, also from IWU, in 2003, including cost structures of retrofit measures. The data were used within the comprehensive energy system model IKARUS to provide scenarios of the long-term energy demand of the housing sector in Germany /6/.
Since these building types include physical properties of the envelope (materials, U-values, thicknesses) and typical envelope areas for walls, windows, roofs and ceilings a heat energy balance can be calculated (for different heating systems) using conventional calculation methods and retrofit strategies can be investigated under economic aspects.
Climatic regions in Germany
For the calculation of the annual heating demand, DIN 4108 provides detailed information on degree days and solar irradiations for 15 different climatic zones in Germany. Hourly data on meteorological parameters are available for the planner from the German Meteorological Service (Deutscher Wetterdienst, DWD) in digital form that can be used by simulation programs. Multi-annual average values are used to provide monthly and yearly degree days that can be used for the calculation of the annual heat load.
Fig. 7: Five zones with comparable degree days in Germany (German Meteorological Service, DWD)

Factor 4 project –IEEA Agreement n° EIE/05/076/S12.419636 – Deliverable 4 – October 2006
66
For our purpose, only 4 different zones from the 5 zones in fig. 7 are relevant, since in the coldest zone (mountainous regions) the number of rented buildings is low.
Energy balances of buildings in different climatic zones can be corrected using local degree days. In Karlsruhe, located in the warmest climatic zone in Germany, the design outdoor temperature is -10 °C and the average of degree days (1970 – 2004) is 2.060 K·d8 (the average over the period 1998 – 2000 was 1.849 K·d, that means ~10 % less � a consequence of climate change?).
Heating systems
In multi-family buildings, the following heating systems are in use in Germany:
Collective heating system using heating oil
Frequently in use, primarily outside cities where no gas or district-heating networks are available.
Gas collective heating system
Has big increase rates because heating oil systems and old individual gas heating systems are often substituted by gas collective systems. In a minority of cases supplemented by small detached cogeneration plants that generate also electricity (base load supply of heat). Newer installations (since mid 90ies) often using condensing boilers.
High installation rates in the late 60ies until the beginning 80ies. Today often substituted by collective heating systems due to lower costs and lower technical risks (gas explosions in dwellings)
District Heating (DH)
In big cities broadly used (often in 30 – 50 % of the area of big cities available). Increase rates at present by the evolution of satellite DH grids und due to economic advantages because of recent price increases of oil and gas.
Electric heat storage systems
Still serving about 10 % of the heating demand in residential buildings, primarily outside cities and in small buildings.
Electric heat pumps
Show recent increase, the prevailing market being smaller buildings outside cities.
Others
Biomass, solar collectors, “passive houses” (buildings that do not have a heating system because of extremely reduced heating demand that can be covered by passive solar and heat recovery from ventilated air with almost no heating demand remaining). Have still no real relevance but show remarkable increase rates at present.
For Factor 4 (rented buildings as target) in the long term only collective heating systems (oil, gas, DH) are of relevance and, in addition, new systems such as solar (additive), biomass, small cogeneration plants (gas engines, Stirling engines, fuel cells) that may enter the market in the future. Due to the time horizon of 2050, one has to bear in mind that forecasts tell us that oil and gas will be more or less exhausted until then. Which heating system will survive such a development? Will it be “new oil” produced by liquefaction of coal and biomass? By which price? Under which restrictions due to GHG mitigation? Or other alternatives like big solar installations, geothermal, wood?
Considering the heating systems that are employed in the buildings of Volkswohnung, from the 12.264 dwellings that are operated at present in 354 buildings (35 dwellings per building in the average), 33 % are supplied with gas, 41 % are supplied by district heating (produced by large combined heat and power plants in Karlsruhe, utilizing coal and gas) and 26 % are being in the process of switching from gas (in the majority individual heating systems) to satellite district heating networks operating with cogeneration, biomass plants (wood-pellets or bio-oil) or industrial waste heat. Very few remaining buildings are still supplied with heating oil.
8 “Degree days” are defined as number of heating days in a specific year times the difference of the room temperature
and the mean of the outdoor temperature on every heating day. Using degree days, it is easy to calculate the annual heating demand. “Heating days” are defined as days with a mean outdoor temperature ≤ 15 °C. The room temperature is defined as 20 °C.

Factor 4 project –IEEA Agreement n° EIE/05/076/S12.419636 – Deliverable 4 – October 2006
67
4.1.1. THE MAIN CRITERIA
The main criteria relevant for the choice of typical rented residential buildings in the case of Germany are
� construction period
� size of buildings
� heating system.
The location of the buildings (in terms of “sensible zones” in cities or suburbs) is in general not really relevant in Germany (apart from rare hot spots) due to an effective mixture of population that is intended usually by housing companies. Also, the climate is in the case of rented multi-family buildings of minor relevance, since there is not a big interaction between climate and construction style (the differences in climate in the different zones of Germany are not large enough to cause different construction principles).
4.1.2. THE SECONDARY CRITERIA
Secondary criteria are the rent level (that differs between different cities/regions) and previous retrofitting works that was already realized. As a specific criterion in Germany buildings from East-Germany shall be included into the discussion because of the specific situation that has evolved there since 1990.
The tenants income level or the type of housing company that operates the rented buildings is considered to be of less importance for the building target that is of interest in the factor 4 project (“social housing”).
4.2. THE GERMAN SOCIAL HOUSING BUILDING STOCK
The statistics available at present on this issue is poor. “Social housing” is a phenomenon in Germany only since World War II, when due to the added effects of the destructions of buildings during the war and the huge number of displaced persons after the war millions of people were faced with housing shortages. A nation wide program to create new residential buildings with very big investments resulted in millions of new dwellings and solved the problem more or less until the seventies. During numerous adaptations of the first basic law on social housing that passed the Bundestag in 1949, the focus shifted gradually to the state support of individual housing property rather than “social dwellings” and eventually – the most recent development – a drastic reduction of financial means provided by the state for the housing sector anyway.
Since the time span where rents for social dwellings are reduced is limited, the rate of dwellings that drop out of rent limitation is since a number of years much larger than the creation of new social dwellings. As a result, in 2002 there was a stock of 1,9 mill. social dwellings still available (some 13 % of the total number of rented dwellings), whereas 2,4 mill. former social dwellings had dropped out of this system until 2002.
The present distribution of the stock of rented residential buildings in Germany (2004) according to construction period is shown here (see also del. 3):
The energy supply mix of these buildings differs from the general supply mix of buildings due to the
Stock of Rented Residential Buildings in Germany (2004)
0
200
400
600
800
1.000
1.200
1.400
1.600
1.800
2.000
until 1900 1901 -
1918
1919 -
1948
1949 -
1978
1979 -
1986
1987 -
1990
1991 and
later
* 1.
000

Factor 4 project –IEEA Agreement n° EIE/05/076/S12.419636 – Deliverable 4 – October 2006
68
enhanced availability of gas and district heating in cities. However, there are no general statistical data available on this subset of buildings, even on the urban level. It has therefore to be estimated based on plausible assumptions:
Source: author, based on plausible assumption
The rate of construction of new dwellings has reduced drastically over the past 10 years in Germany. In 2004, the rate of new rented dwellings in East-Germany has practically come to a halt (188 new units in 2004, compared to 2.357 units in 1994).
Source: GdW, Berlin (2005)
Heating Systems and their Distribution (%) in Rented Residential Buildings (2004) in Germany
16
12
35
22
110 4
Oil Collective Heating
Gas Individual
Gas Collective Heating
DH
Electric Storage
Heat Pumps
Others
Construction Rate of New Dwellings in Germany 1994 - 2004
0
10.000
20.000
30.000
40.000
50.000
60.000
1992 1994 1996 1998 2000 2002 2004 2006
Total Rented

Factor 4 project –IEEA Agreement n° EIE/05/076/S12.419636 – Deliverable 4 – October 2006
69
4.3. THE ANALYSIS OF ENERGY CONSUMPTION AND OF CO2 EMISSIONS
As it was derived in del. 3, the number of rented buildings that are operated by housing companies in
Germany was 3,66 mill. buildings in 2004. According to the distribution of these buildings with respect to their construction period as shown in del. 3, they have the following characteristics:
Rented Residential
Buildings Number of Dwellings Living Area
*1.000 *1.000 m2*1.000
until 1900 272,9 1.092 72.056
1901 -1918 204,7 819 54.042
1919 - 1948 443,5 1.774 117.091
1949 - 1978 1.850,9 12.956 855.097
1979 - 1986 409,4 1.638 108.084
1987 - 1990 102,4 409 27.021
1991 and later 375,3 1.501 99.077
3.659,1 20.189 1.332.468
Since the number of dwelling units per building with respect to the building period is not indicated in the statistics, it was assumed that buildings constructed in the period 1949 – 1978 have an average of 7 units per building, whereas all other buildings have an average of 4 units. The total average is then 5,61 units per building.
To be able to calculate the energy consumption and the corresponding CO2-emission, assumptions about the following items are necessary:
The mean of the specific primary energy consumption (kWhPE/m2) for heating and tap water preparation in the original building and after retrofit measures (partial retrofit, i.e. windows exchange, full retrofit according to standards before and after 1995) and the rates at which retrofit measures have been carried out dependant from the construction period. No detailed figures on that are available in the existing statistics; therefore plausible assumptions have to be made as shown in the following table.
Specific Primary Energy Demand for Heating of Rental Buildings according to Construction Periods and Estimate of Retrofit Rates
Constr. Period
original standard partial retrofit fully retrofit < 1995 fully retrofit > 1995
kWh/m2 rate % kWh/m
2 rate % kWh/m
2 rate % kWh/m
2 rate %
until 1900 180 15 172 30 118 33 91 22
1901 -1918 210 15 172 30 108 33 76 22
1919 - 1948 193 20 170 30 112 28 83 22
1949 - 1978 200 35 157 25 102 30 74 10
1979 - 1986 120 100 0 0 0
1987 - 1990 100 100 0 0 0
1991 and later 80 100 0 0 0
These figures combined with the living areas given above lead to the following mean specific and total energy consumption according to the construction period of rented residential buildings in 2004 in Germany:

Factor 4 project –IEEA Agreement n° EIE/05/076/S12.419636 – Deliverable 4 – October 2006
70
Constr. Period Mean Specific Primary Energy
Consumption for Heating (2004)
Total Primary Energy Consumption for
Heating
kWh/m2 GWh/a
until 1900 138 9.912
1901 -1918 135 7.321
1919 - 1948 139 16.301
1949 - 1978 147 125.828
1979 - 1986 120 12.970
1987 - 1990 100 2.702
1991 and later 80 7.926
Total 182.960
Assuming an average demand of 16 % of the heating demand for tap water preparation, we receive a demand of 29.300 GWh/a, or a primary energy demand for heating and tap water preparation of
212.263 GWh/a for rented residential buildings in Germany in 2004.
The corresponding CO2-Emissions are dependent from the mix of primary energy carriers that is used for the heating supply of these buildings. From the statistics, we only have the mix for all buildings. Therefore, the mix of the rented residential buildings must be guessed. It is assumed, that rented buildings, being located more frequently in larger cities, have a different energy mix than the average, since they will more often be supplied by gas or district heating. The assumptions that are shown below have been made and are used to calculate the resulting CO2-emissions using the CO2-emission-factors that are also given in that table:
Mix of Primary Energy Carriers
Primary Energy Consumption Rented
Buildings (Heating, Tap Water)
CO2-em. factor
CO2-emissions
% all
buldings
% rented
buildings GWhPE/a
t CO2-
equiv./MWhPE
mill. t CO2
equiv./a
Oil Collective Heating 31 16 33.957 0,318 10,80
Gas Individual 13 12 25.468 0,254 6,47
Gas Collective Heating 25 35 74.282 0,254 18,87
DH 11 22 46.691 0,21 9,81
Electric Storage 11 11 23.346 0,69 16,11
Heat Pumps 2 0 0,0 0,21 0,00
Others 7 4 8.489 0,33 2,80
100 100 212.263 64,85
The CO2-emission factors given above result from a model of the primary energy balance that is used to calculate the CO2-balance of Germany by Öko-Institut Darmstadt/Freiburg every year, as commissioned by the federal ministry for the environment. The corresponding calculation model is named GEMIS. In our case, the equivalent CO2-emission factors from GEMIS have been used, that include the emissions caused on the way from the well to the user and also the accompanying GHG-gases associated with the resp. energy carrier, such as methane. The term “others” in the table above includes a mix of solid fuels. I have assumed a mix of 80 % hard coal and 20 % wood.
As a result, the CO2-emissions that result from the supply of heat for heating and tap water preparation for rented buildings in Germany is calculated to be 64,85 mill. t CO2-equivalent in 2004.

Factor 4 project –IEEA Agreement n° EIE/05/076/S12.419636 – Deliverable 4 – October 2006
71
4.4. DEMOLITION SCENARII AND THEIR IMPACTS
The demolition-rate in West-Germany has been almost constant at 0,04 % of the building stock since 1990. In East-Germany, the situation was very different, because after the end of DDR the demolition rate was twice as high compared to West-Germany until 2001 and then rose up to 0,55 % of the building stock in East-Germany (13 times the rate in West-Germany) due to comprehensive urban renewal programs in East-Germany since then. It is expected that this rate will last for about another 10 years and then approach gradually the rate in West-Germany.
The future demolition rate in West-Germany can only be guessed. One factor will be the increasing aging of the building stock (average age today 50 years), another important factor will be the changes in demand that will develop.It is estimated that the demolition rate in West-Germany will gradually increase from 2016 until a rate that is in the range of one half of the present demolition rate of East-Germany (corresponding to 0,28 %) is achieved after 10 years time, due to the aging of the building stock, changes in population numbers and adjustments according to changing needs. From about 2020 until the end of the time horizon (2050), this demolition rate is expected to be more or less constant.
The following graph shows the result of these two different developments with real data from 1990 to 2005 /GdW 2006/ and a guess of the dynamics from 2006 to 2050 as described above, considering all dwelling units (private property and rented dwellings), presenting the accumulated number of demolished units in
East and West-Germany until 2050.
Source: GdW (Berlin 2005), 1990 – 2005; own estimate until 2050 (see text)
In the demolition statistics available, it is not distinguished between private and rented dwelling units. We assume that 75 % of the demolished dwelling units shown in the graph above were belonging to rented dwellings and 90 % of this number belong to housing companies.
The rate of new residential buildings was quite inhomogeneous in Germany since 1990. From over 300.000 new dwellings in 2005, about 25 % were erected by housing companies. However, this rate had been much higher in the 90ies and was rapidly decreasing since the end of the 90ies. It is expected that the rate of new rented dwellings will gradually decrease further until 2050 since the presently observed shift to private property will continue. The falling population in Germany will result in smaller households (average of 2 or less persons per household in the mean term) and therefore an increasing number of dwellings (new or refurbished), but this will compensate the gradually reducing demand of dwellings due to the decrease of the population in Germany only at the very beginning.
So, trying a guess of the development that is expected until 2050, the following graph shows the accumulated numbers of demolished and new rented dwellings in Germany.
Development of Demolished Units in Germany
0
500.000
1.000.000
1.500.000
2.000.000
2.500.000
3.000.000
3.500.000
1990 2000 2010 2020 2030 2040 2050
accumul. East-G. accumul. West-G.

Factor 4 project –IEEA Agreement n° EIE/05/076/S12.419636 – Deliverable 4 – October 2006
72
Source: GdW (Berlin 2005), 1990 – 2005; own estimate until 2050 (see text)
According to this graph, the balance of demolished and new rented dwellings would result in about 2 mio. additional dwellings operated by the housing companies in 2050 as compared to 1990, corresponding to a surplus of about 10 %. The big surplus of new buildings every year within the 90ies, as shown in the graph above, is changing to an equilibrium until about 2020 and then turning into a deficit between additional and demolished dwellings until 2050.
Remark:
Such a forecast deserves actually a complex analysis with scenario building, taking into account regional disparities, population changes, economic developments and changing needs, based on a comprehensive model. In the absence of such an investigation, we have to confine ourself to a first estimate of the long-term development based on the recent statistics and plausible assumptions about future changes.
4.5. THE SELECTED HYPOTHESES AND THE SELECTION OF CASE STUDIES
In the following, a subset of the building typology of IWU is shown. The next figure shows (with bad quality) an excerpt from the characteristic data for typical multi-family buildings from the IWU-typology, the over next two figures provide some technical details on the building design on the IWU-building type called HH_F.
Dynamics of Demolished and New Rented Units (accumulated)
0
500.000
1.000.000
1.500.000
2.000.000
2.500.000
3.000.000
3.500.000
4.000.000
4.500.000
5.000.000
1990 2000 2010 2020 2030 2040 2050
accumul. demolished accumul. new

Factor 4 project –IEEA Agreement n° EIE/05/076/S12.419636 – Deliverable 4 – October 2006
73
The provision of the corresponding design and construction data for the 8 case studies is under work.
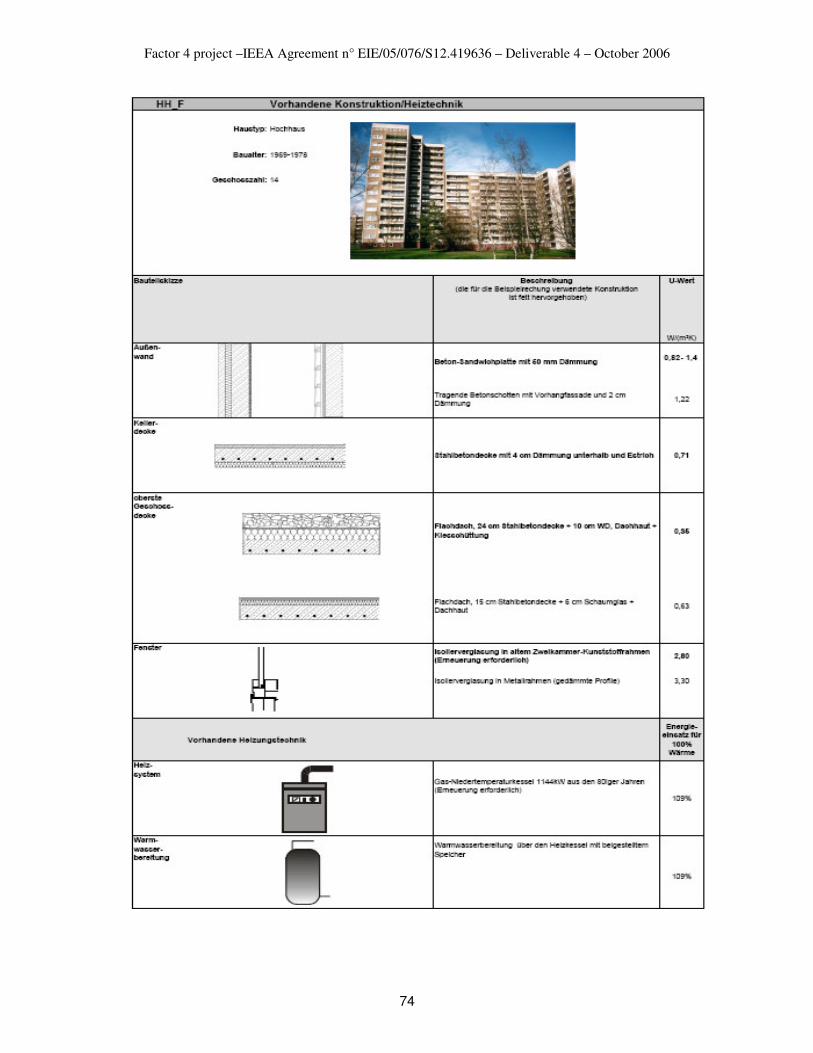
Factor 4 project –IEEA Agreement n° EIE/05/076/S12.419636 – Deliverable 4 – October 2006
74

Factor 4 project –IEEA Agreement n° EIE/05/076/S12.419636 – Deliverable 4 – October 2006
75
To define specific case studies, rented residential buildings have to be selected that are still in use after 2030. These are either new buildings, buildings from the construction periods after World War II that have been refurbished recently or that will be refurbished in the near term or buildings from earlier periods that

Factor 4 project –IEEA Agreement n° EIE/05/076/S12.419636 – Deliverable 4 – October 2006
76
will probably not be demolished due to their preservation value as a part of the building substance in the existing urban environment. The case studies shall be representative in building size and the heating-system used.
To achieve that, we make use
� of the existing building typology of IWU/Darmstadt that provides a representative set of 17 typical multi-family (and 20 single-family) residential building types of West-Germany with a detailed set of data describing the construction and physics of the buildings,
� of a set of data of dena – Deutsche Energie-Agentur/Berlin (federal program “low-energy retrofit of existing residential buildings”) describing in detail 2 residential buildings in East-Germany that have been recently retrofitted according to a low energy standard (< 50 kWhth/m2 heating demand) to include also buildings from East-Germany and
� of 2 buildings from our own stock in Karlsruhe.
The building types of IWU are characterized by capital letters A to G following the construction period of the resp. buildings type corresponding to the different construction characteristics of this period (see table below). Since the IWU-typology was made 1994, the types end with character G.
construction period character
< 1918 A
1919 – 1948 B
1949 – 1957 C
1958 – 1968 D
1969 – 1978 E
1979 - 1983 F
1984 - 1994 G
IWU case study nr. 1 2 3 4
IWU-type
multifamily
type B
large multifamily
type D
large multifamily
type F
highrise
residential Bld.
type F
year of construction < 1918 1949-1957 1969-1978 1969-1978
living area m2 284 1.457 3.020 18.012 height of rooms m 3 2,75 2,55 2,55
volume of building m3 1.360 4.808 9.805 68.360 number of floors - 4 5 8 14 number of units - 4 20 48 254
living area per unit m2 71,0 72,9 62,9 70,9 type of roof saddle roof flat roof flat roof flat roof
roof area m2 103 354 540 1.469
U-value roof W/m2·K 2,60 2,08 0,82 0,35
wall area m2 148 1.378 2.132 1.094
U-value walls W/m2·K 1,45 1,21 1,46 0,82
area basement ceiling m2 103 354 540 1.469

Factor 4 project –IEEA Agreement n° EIE/05/076/S12.419636 – Deliverable 4 – October 2006
77
U-value basement ceiling W/m2·K 1,37 1,55 0,97 0,71
area windows South m2 1,30 38,3 34 764
area windows West/East m2 53 257 458 1.520
area windows North m2 1,30 0 53 296
U-value windows W/m2·K 2,57 2,57 2,57 2,8 g-value windows 0,76 0,76 0,76 0,76 direction main axis south/north south/north south/north -
total windows area m2 55,4 294,9 545,0 2.580,0
total envelope area m2 409,0 2.379,9 3.757,0 6.612,0
Area/volume ratio A/V m-1 0,30 0,49 0,38 0,10
average U-value W/m2·K 1,87 1,56 1,46 1,46 heating energy demand
(EN 832, monthly balances, climate of Würzburg) kWh/m2
180 (DH)
173 (collective oil)
140 (individual gas)
103 (collective gas)
Building characteristics for 4 types of multi-family buildings /4, 7/ Source: IWU Darmstadt (1995, 2003)
2 Building types from East-Germany according to dena retrofit program:
dena case study nr.
5 6
Building type multi-family preserved city building
nr. of floors 4 3
nr. of units 48 12
living space m2 2.486 767
Construction date
1962 1900
heating system gas collective DH
location Lübbenau / Brandenburg Plauen / Saxony
qH before retrofit kWhth/m2
187 202
qH after retrofit kWhth/m2
62,7 53
no photograph of nr. 6 available so far
2 Building types from Volkswohnung:
VoWo case study nr.
7 8
Building type multi-family multi-family building group
nr. of floors 7 - 11 10 floors, 4 buildings
nr. of units 345 112

Factor 4 project –IEEA Agreement n° EIE/05/076/S12.419636 – Deliverable 4 – October 2006
78
living space m2 25.002 8.862
Construction date
1970 1969
heating system local DH collective biomass
location Karlsruhe / Goerdelerstraße
Karlsruhe / Rheinstrandallee
qH before retrofit
kWhth/m2
105 160
qH after retrofit kWhth/m2
55 45
Sources:
/1/ Statistisches Bundesamt, Fachserien 5 und 18, Wiesbaden (2005)
/2/ Yearbook on Housing Statistics 2005, GdW, Berlin (2006)
/3/ Energiekennwerte – Hilfen für den Wohnungswirt, Techem AG, Frankfurt (2005)
/4/ Ebel et a., Energieeinsparpotential im Gebäudebestand, IWU, Darmstadt (1995)
/5/ R. Rosin et al., Gebäudetypologie in den neuen Bundesländern, IKARUS-Bericht 5-06, Forschungszentrum Jülich (1991)
/6/ M. Kleemann et al., Die Entwicklung des Wärmemarktes für den Gebäudesektor bis 2050, Forschungszentrum Jülich (2000)

Factor 4 project –IEEA Agreement n° EIE/05/076/S12.419636 – Deliverable 4 – October 2006
79
PART 5 : THE VRANCEA COUNTY IN ROMANIA
5.1. REMINDER UPON THE TYPOLOGY FOR ROMANIA
5.1.1. The main criteria selected
Four main criteria have been selected for the social housing building stock analysis:
- the construction date
- the climatic area
- the building size
- the heating energy source
The construction date
The construction date is an essential criterion; thermal and seismic regulations are directly related to construction date. The relevant intervals for Vrancea County are as follows:
- before 1960
- between 1961 and 1977
- between 1978 and 1989
- between 1990 and 2000
- after 2000
The climatic areas
The climatic area location has very important effects on needs for heating. For Romania there are four climatic areas, Vrancea being in zone III.
The climatic areas in Romania

Factor 4 project –IEEA Agreement n° EIE/05/076/S12.419636 – Deliverable 4 – October 2006
80
Vrancea County is situated in the III climatic zone
The building size
The building size may be described within two categories:
• Individual buildings (single family or coupled,) • Collective buildings (block of flats) included
- units in a building with less than 40 units
- units in a building with 40 to 100 units
- units in a building with 100 units or more
Heating energy source
At last, the heating energy source is an important criteria and the typology is selected as regarding:
- central heating - including municipal/district plants
- collective central heating gas systems
- individual heating gas systems,
- wood/ liquid fuel heating systems,
- mixed - central heating and individual heating gas systems.
5.1.2. The secondary criteria
• Location
The housing construction activity was very dynamic between 1960 -1989, when in Romania was demolished a great part of the existing building stock, except the historic buildings. In order to sustain the migration of the rural labor force toward the urban areas was built dwellings stock near the industrial zones, at the peripheries, and also in the centre of the cities. After 2000, according to the National Program for Construction of the renting dwellings for the young people was built dwelling stock whit 1-3 rooms, concentrated in new neighbourhoods. • The unit size
The dwelling stock is widely represented by units with 2 or 3 rooms, (75.6 % of the stock), the units with only 1 room or only a single room being representing only 14.2 % of the stock and the bigger units with 4 rooms or more 10.2 %.
• The tenants’ income level
The dwelling stock units in the period 1960 – 1989 were not allocated upon the income of the beneficiaries. After 2000, the construction of the renting dwellings for the young professionals could be allocated to the single person or family who could not afford a decent dwelling for their own or to rent a house in the market condition.
Climatic
zone Reference
city
Period of
thermic energy
supply
days/year
Average
external
temperature
during the
heating period
External
temperature
for
calculation
I Constanţa 185 4,7 -12
II Bucureşti 190 3,4 -15
III Iaşi 205 2,8 -18
IV Braşov 228 2,4 -21

Factor 4 project –IEEA Agreement n° EIE/05/076/S12.419636 – Deliverable 4 – October 2006
81
The dwelling for the young of 18 years originating from the social care institution is not allocated upon the income of the beneficiaries.
The social dwellings could be allocated to the people with modest income (below the minimum level for subventions) and poor living conditions who do not afford to buy or to rent a dwelling at the market price. • The rent level
For the dwellings remained after 1989 in the administration of the local public authorities and for the dwellings for the young professionals is a very important reduction of the rent level. This rent level is related to a ceiling income and is calculated according to the unitary price on square metre.
Note
Romanian Government, according to the Low 211/2003 regarding the thermo rehabilitation of the multi-storied residential buildings, starts up a multi annual programme for retrofitting about 4 millions of units in the blocks which need such interventions. The target for this programme it to reduce the thermal energy consumption by 35%. 5.2. THE SOCIAL HOUSING CONTEXT
The driving forces having a definite impact on the present national context were:
- The structural changes (political, economical, social, legal etc) started at the turning point - December 1989
- The commitment to respect some major international documents such as: Agenda 21(Rio,1992) , Local Agenda 21 (1996), HABITAT II Declaration (Istanbul,1996), Millennium Declaration (New York, 2001), Johannesburg Summit Declaration (2002)
- The European integration process
Some of the measures had important consequences for the housing sector and this result from the following features:
� Political background
- Facilitating the access to home by building a dwelling stock at the local authorities service for the people – especially youngs and young families who could not afford a decent dwelling for their own or to rent a house in the market condition
- Improving the living conditions by rehabilitation, reinforcing and upgrading the present dwelling stock
- Avoiding social segregation
- Developping the free market instruments
- Improving the ratio between the market dwellings price and the average income of a families
- Stimulating the private investment
� Strategic vision
- Construction of the new residential buildings
- Improvement of the present dwelling stock
- Structuring the legal, institutional and regulations framework
� Specific Programmes
The strategic objectives are implemented by programmes which are directly or indirectly supported by the government. They are:
1) Programmes aiming to provide accesibility to a dwelling
1.1) Construction of the renting dwellings for the young people (the National Agency for Dwellings- the implementation institution)
a) sub-program – renting dwellings for the young of 18 years originating from the social care institutions
b) subprogram - renting dwellings for the resident phisicians and other yound professionals
1.2) Social dwellings construction

Factor 4 project –IEEA Agreement n° EIE/05/076/S12.419636 – Deliverable 4 – October 2006
82
1.3) Construction of the individual private dwellings by mortgage system (the National Agency for Dwellings- the implementation institution)
1.4) Completion of the apartments in the unfinished buildings
2) Programs aiming to improve the present dwelling stock
2.1) Consolidation of the multi-storeyed residential buildings damaged by earthquakes
2.2) Thermal rehabilitation of the multi-storied residential buildings
� The legal/institutional framework
� Law on establishing of the National Agency for Dwellings (152/1998)
� Housing Law (114/1996)
� Low on mortgage for the real estate investments (190/1999)
� Government Ordinance on stimulating the investments for public works and dwellings construction (19/1994)
� Government Ordinance on special measures for thermal rehabilitation of the multi-storied residential buildings (174/2002)
� Government Ordinance on thermal rehabilitation of the existent dwelling stock and stimulating the thermal energy savings (29/2000)
� Law on quality in construction (10/1995)
� Law on efficient use of energy (199/2000)
� Order for the approval of the “Guide on energetic auditors certifying for the buildings and equipment” (550/2003)
� Law on energetic performance of the buildings (372/2005)
� The regulations for the new buildings and rehabilitation works
� Norms regarding design and execution of the thermic insulation works for buildings (C107/0-02)
� Norms on calculation of the thermic insulation coefficients for the residential buildings (C107/1-97)
� Norms on calculation of the thermo-technic performances of the residential buildings (C107/4-97)
� Guide on optimizing the thermic protection level for the residential buildings (G058/2000)
� Normative on residential buildings design (NP 057-02)
� Normative on thermic and energetic expertize of the existent buildings and instalations for heating and warm water (NP 048-00)
� Normative on elaboration and delivery of the energetic certificate for the existent residential buildings (NP 049-00)
� Normative on energetic audit for the existent buildings and instalations for heating and warm water (NP 047-00)
� Framework solutions for the thermo-hydro-energetic rehabilitation of the envelope of the existent residential buildings (SC 007-02)
� Framework solutions for the rehabilitation and upgrading of the heating installations of the residential buildings (SC 006 - 01)
� Guide on evaluation of the thermic insulation level of the construction elements in the existent buildings for the purpose of thermal rehabilitation (GT 040-02)
� Methodology on evaluation of the thermo-technic performances of the construction materials and products (MP 022-02)
� Methodology on evaluation of the energetic performance of the buildings (March 2007)
A special note for the technical literature in the field – Exemple:
MLADIN, E.C. & others: GUIDE ON ENERGETIC EFFICIENCY OF THE BUILDINGS, MTM, 2003

Factor 4 project –IEEA Agreement n° EIE/05/076/S12.419636 – Deliverable 4 – October 2006
83
5.3. THE SOCIAL HOUSING PROFILE
According the Census of Population and Dwellings from March 2002 the total number of the recorded dwellings was over 8 millions, out of which 52,5% situated in urban areas.
Most of the existing residential buildings are of age 15 to 55 years (see the next chart), obsolete and have the thermal insulation in bad condition.
Some major changes produced within the Romanian society after 1989, especially the reconsideration of the property right including land property, had important consequences for the housing field. These consequences ended to reshape the profile of the sector which presents now some reversed features:
● The share of the dwellings private ownership passed over 97%
● The number of the households in the rented dwellings decreased from about 1,600 000 in 1992 to around 320000 in 2002
● The dominant new dwellings type became the single family houses (95% out of the total between 1990-2000)
At present, the social housing sector represents around 2.4% of the total and comprises some old buildings with rental dwellings and some new dwellings built by the auspices of the National Agency of Dwellings (NAD) since 1997 (see the chart below).
The structure of the dwelling stock in Romania as the buildings
age
0%
3%
7%
37%
28%
25% Age
< 10 years
10-20 years
20-40 years
40-55 years
> 55 years
Social Housing in use, between 1997 - 2003
215
444 441
746 743
1000
100
200
300
400
500
600
700
800
1997 1998 1999 2000 2001 2002 2003
Social Housing

Factor 4 project –IEEA Agreement n° EIE/05/076/S12.419636 – Deliverable 4 – October 2006
84
The social dwellings sector was stimulated by a new legal and institutional framework (i.e. Housing Law -114/1996; Law on establishing of the National Agency for Dwellings -152/1998), so the total number of such units built between 2001 and 2005 reached 14 846. These new dwellings were designed according to some high standards with respect to energetic performances and confort level. Most of them are destinated to the young people, are not high (maximum P+3E +M) and have 1-2 rooms.
The completed social dwellings and the land are the public ownership of the local authorities who are
responsible for their administration (the category of “social owners” like USH in France, or KAB in Denmark, does not exist in Romania)
Some general data regarding the housing stock in Romania and the social dwellings component could be find in the official data sources, but they does not cover all the criteria adopted in Factor 4. There is no information, for instance, related to the distribution of the dwellings by climatic areas (4 –in Romania); the available statistical documents indicate the geographical distribution by regions (8 development regions), counties (41), or urban localities – in some cases. An explanation is connected to the exceptional high share of the private sector (over 97% in 2005) and inadequate institutional framework. One of the most recent documents∗ indicate the following data:
The structure of the dwelling stock at the end of 2005
Indicators Data
Dwellings numbers – thousands- 8201.5 Rooms number – thousands- 21153.1 Living floor area – million m2- 312.0 Average number of rooms per dwelling 2.6 Living floor area (m2) per - dwelling - room - person
38.0 14.8 14.4
Relative similar data are available for the social dwellings, but only for those completed in 2005
The structure of the social dwellings completed in 2005
Indicators Data
Dwellings numbers – thousands 3532 Rooms number (thousands) , out of which
- 1 room - 2 rooms - 3 rooms - 4 rooms - 5 rooms
5502 - 1707 - 1680 - 145 - None - None
Living floor area – million m2- 312.0 Average number of rooms per dwelling 1.5 Living floor area (m2) 108158 Useful floor area (m2) 182282
5.4. THE ANALYSIS OF ENERGY CONSUMPTION
During the last decades Romania faced a sharp decline of its energetic resources and a steady increasing of its dependency on the imports.
The data included in the table below indicate the natural gas as the most important resources and a high dependency rate of imports, especially for crude oil; the share of renewable resources (included in the category „others”) is very low (around 7%).
∗ National Institute of Statistics: “Dwelling stock”,2006

Factor 4 project –IEEA Agreement n° EIE/05/076/S12.419636 – Deliverable 4 – October 2006
85
According to the „National Strategic Reference Framework”**this dependency rate will increase till 2015 to over 50%
Primary energy resources in 2004 (%)
Energy resources Production Import Total
Crude oil 13.5 15.5 29.0
Natural gas 22.7 8.7 31.4
Coal +coke 15.3 6.7 22.0
Electricity 5.9 0.5 6.4
others 7.3 3.9 11.2
(Source:National Institute of Statistics, Romanian Statistical Yearbook,2005)
These factors together with the expected economic growth and the low efficiency performances of the national energetic system imposed some urgent interventions. Many of them were focused on the human habitat which is the second major energy consumer after the industry (see the next figure). The yearly share for the heating, including the warm water, in a conventional building is around 75% out of the total energy consumption (see the chart below), while the efficiency of the system utilization is below 50%. The unit consumptions are higher than the EU levels so the pollutant emissions.
** National Strategic Reference Framework 2007-2013, April 2006
Final energy consumption, 2004 (thou tonnes of oil equivalent)
41%
1%22%
7%
29%
Industry (including
construction)
Agriculture/Sylviculture/F
isgery
Transport and
Communications
Other activities
Population
The structure of the energetic consumptions for a
conventional apartment built in 1970-1985
0%
55%21%
14%10% Types
Space heating
Warm water
Lighting
Others

Factor 4 project –IEEA Agreement n° EIE/05/076/S12.419636 – Deliverable 4 – October 2006
86
Some important measures aimed to raise the level of the thermal insulation coefficient and to improve the internal comfort were implemented since 1984. Nowadays the major part of the dwelling stock includes the building of ages between 15 and 55 years having a low degree of thermal insulation and bad general condition, so the experts consider unanimously as a priority the thermal rehabilitation of the urban block of flats. The most recent regulations related to this sector are:
- the Romanian Government Ordinance on the thermal insulation of the buildings and the saving stimulation of the thermal energy (29/2000 approved by the Law 325/2002): stipulates the elaboration of the „National Programs on the thermal rehabilitation and up-grading of the buildings”, of some national standards on energetic efficiency and the obligation to set up the energetic certificate of the
building
- the Law on energetic efficiency (199/2000 followed by the methodological guide approved in 2002): gives the legal framework for the elaboration and implementation of the national policy on energy use; includes incentives and obligations for the efficient energy use by the producers and consumers
- the technical regulations on energetic audit and energetic certification of the existing buildings (NP047-2000; NP048-2000; NP04902000), elaborated by the experts of the National Building Research Institute (INCERC)
The national context as it was forged after 1989 is based on some important elements able to induce synergetic effects on the measures presented above. Such examples are:
National Strategy on Environment Protection (1995); Quality Law in Construction (10/1995); Law on Environment Protection (137/1995); Sustainable Development National Strategy (1999,2002); Strategy on Public Works, Housing and Transports (1996)) etc
Another favorable factor was the implementation of the Local Agenda 21, several municipalities being now beneficiaries of these local strategies in compliance with the sustainable development principles.
The European context and also the exigencies related to the European integration process influenced in a great extend the Romanian strategic vision and the regulations in the energy field as well in the others. The most relevant documents like Energy Chart, the Protocol of Energy Chart or Europeans Directives 89/106/CEE, 2002/91/CEE became reference framework for the Romanian decision makers.
5.5. FUTURE’S SCENARIOS
As regards the future of the social dwelling stock, there are many factors with a potential increasing effect on the sector, such as:
- The extending of the present definition that refers only to the rented dwellings based on rent subvention so it might contains all the rental dwellings based on the public support
- The stimulation of the new constructions, including social dwellings
- The change of the private property-oriented mentality corroborated with a higher mobility of the people
- The increasing of the costs for the new constructions (reducing of the people’s affordability) and for building operation , including energy consumption costs
- The increased demand on behalf of vulnerable categories (young/old people; poor people∗, etc)
- The adoption of the European models after the integration, including the actors involved (e.g. social owners)
In this case during the next four decades the future social dwelling stock could reach between 500000 and 1000000 units (ascending scenario)
However, we have to take into consideration also the factors with potential negative effect on the mentioned sector, such as:
- The decreasing tendency of the population **
∗ According to some recent studies and documents, the share of the poor population passed over 30%; only 2/3 of the total households include an active person; the number of the retired people exceeds the number of the total employees **21680974 in 2002 as against 22810035 in 1992 (Statistical Yearbook 2005)

Factor 4 project –IEEA Agreement n° EIE/05/076/S12.419636 – Deliverable 4 – October 2006
87
- The intensification of the migration movement, especially of the young people
- The reduction of the society capacity to support this sector (reduced financial sources)
- Unbalanced proportion between the demolished and the new constructions, if the demolition process is accelerated
- The persistence of the population reserve to the estate ownership
Under these circumstances the number of the social dwellings could be around 500000 (moderate scenario)
In order to make some assumptions regarding the long term evolution of the energy consumptions in the social housing sector, we need to review some relevant data:
� The population is the second major consumer after the industry with around 20% of the total in 2004, this share having a slight decreasing tendency during the last years.
� The National Strategy on Energetic Efficiency stipulate a 40% reduction of the energetic intensity (consumption per 1000 Euro of GDP).
� A share increasing to 33% of the electricity produced from renewable sources is also foreseen for 2010 and it’s expected the electricity mainly produced from fosil oil (around 57% in the present) to be lower.
� The measures oriented to the reducing of the energy consumption in the existing constructions (thermal rehabilitation) will contribute to a lower specific energy consumption.
� More restrictive regulations regarding thermal insulation of the new constructions will provide important energy savings sources. (The standard values of the thermal transfer coefficient in Romania – U (W/m2K) = 1/Rt – are: 0,55 for walls, 0,33 for roof, 0,60 for floors).
Based on these information and by coroborating them with the two alternatives regarding the social housing sector we could preliminate an increase of the energy consumption as absolute values, but not directly proportional to the dwellings number as it’s expected the values of specific energy consumption to be steadilly decreasing.
As regards the CO2 emissions it’s expected their level to decrease on the short, medium and long term do to the planed actions in this respect:
� The stimulation of the energy savings by improving the thermal insulation of the existing buildings. (There are around 2.4 millions of apartments built before 1985. If we assume that the present specific consumption of 5.4 Gcal/ap/year will be reduced due to the energetic efficiency measures with at least 40% then result energy savings of over 5 millions of Gcal/year).
� The structure of the primary energy resources will be improved by reducing the fossil fuel (especially coal )component and increasing the share of the renewable energy sources (over 10% of the total consumption in 2030)*
� Introducing some technical instruments (the building certification regarding the energetic performance), or financial instruments (tax exemptions, subventions etc)
5.6. THE SELECTION OF CASE STUDIES
For the case studies we selected 3 buildings which can be representative for existing buildings which will be still in use in 2050.
Main criteria
• Construction date
- Dwelling built between 1960 and 1977: 1
- Dwelling built between 1977 and 1989: 1
- Dwelling built between 1990 and 2000: 1
• Climatic area
- H3 area: 3 * Energetic Policy in Romania, 2006-2009

Factor 4 project –IEEA Agreement n° EIE/05/076/S12.419636 – Deliverable 4 – October 2006
88
• Building size
- Building with less than 40 units : 2
- Building with 40 to 100 units : 1
• Heating systems
- mixed - central heating and individual heating gas systems 3
DESCRIPTION OF THE ROMANIAN CASE STUDIES SELECTED
Case study 1 :
Building type
Number of units
Useful surface (m²)
Building
1 x 40 units
3328 m² (living floor area)
Climatic area H3
Construction date 1973
Heating system and energy source Mixed - central heating and individual heating gas systems
Location (city centre, suburbs…) Centre
Description 1 buildings multi stories 9 floors, in the centre of Focsani
Type of social owner (OP, SA,
SEM)
Case study 2 :
Building type
Number of units
Useful surface (m²)
Building
1 x 14 units
835 m² (living floor area)
Climatic area H3
Construction date 1980
Heating system and energy
source
Mixed - central heating and individual heating gas systems
Location (city centre,
suburbs…)
Centre
Description 1 buildings multi stories P+4 in the centre of Focsani

Factor 4 project –IEEA Agreement n° EIE/05/076/S12.419636 – Deliverable 4 – October 2006
89
Case study 3 :
Building type
Number of units
Useful surface (m²)
Building
1 x 12 units
722 m² (living floor area)
Climatic area H3
Construction date 1990
Heating system and energy source Mixed - central heating and individual heating gas systems
Location (city centre, suburbs…) centre
Description 1 building multi stories P+3 floors, in Focsani