Delimiting Species Using Single-Locus Data and the ...
18
Syst. Biol. 62(5):707–724, 2013 © The Author(s) 2013. Published by Oxford University Press, on behalf of the Society of Systematic Biologists. This is an Open Access article distributed under the terms of the Creative Commons Attribution License (http://creativecommons.org/licenses/by/3.0/), which permits unrestricted reuse, distribution, and reproduction in any medium, provided the original work is properly cited. DOI:10.1093/sysbio/syt033 Advance Access publication May 16, 2013 Delimiting Species Using Single-Locus Data and the Generalized Mixed Yule Coalescent Approach: A Revised Method and Evaluation on Simulated Data Sets TOMOCHIKA FUJISAWA 1,2 AND TIMOTHY G. BARRACLOUGH 1∗ 1 Department of Life Sciences, Imperial College London, Silwood Park Campus, Ascot, Berkshire SL5 7PY, UK; and 2 Department of Entomology, Natural History Museum, London SW7 5BD, UK ∗ Correspondence to be sent to: Department of Life Sciences, Imperial College London, Silwood Park Campus, Ascot, Berkshire SL5 7PY, UK; E-mail: [email protected]. Received 11 August 2012; reviews returned 19 November 2012; accepted 3 May 2013 Associate Editor: Richard Glor Abstract.—DNA barcoding-type studies assemble single-locus data from large samples of individuals and species, and have provided new kinds of data for evolutionary surveys of diversity. An important goal of many such studies is to delimit evolutionarily significant species units, especially in biodiversity surveys from environmental DNA samples. The Generalized Mixed Yule Coalescent (GMYC) method is a likelihood method for delimiting species by fitting within- and between-species branching models to reconstructed gene trees. Although the method has been widely used, it has not previously been described in detail or evaluated fully against simulations of alternative scenarios of true patterns of population variation and divergence between species. Here, we present important reformulations to the GMYC method as originally specified, and demonstrate its robustness to a range of departures from its simplifying assumptions. The main factor affecting the accuracy of delimitation is the mean population size of species relative to divergence times between them. Other departures from the model assumptions, such as varying population sizes among species, alternative scenarios for speciation and extinction, and population growth or subdivision within species, have relatively smaller effects. Our simulations demonstrate that support measures derived from the likelihood function provide a robust indication of when the model performs well and when it leads to inaccurate delimitations. Finally, the so-called single-threshold version of the method outperforms the multiple-threshold version of the method on simulated data: we argue that this might represent a fundamental limit due to the nature of evidence used to delimit species in this approach. Together with other studies comparing its performance relative to other methods, our findings support the robustness of GMYC as a tool for delimiting species when only single-locus information is available. [Clusters; coalescent; DNA; genealogical; neutral; speciation; species.] A fundamental pattern of nature is that organisms diversify into more or less discrete entities that we call species. The term “species” is used to encompass many facets of the pattern of diversity and its underlying causes (Hey 2001; Coyne and Orr 2004; De Queiroz 2007; Shaffer and Thomson 2007). However, in general evolutionary terms (e.g., as encapsulated by the general lineage concept of species, De Queiroz 2007), species are groups of organisms that evolve independently from other such groups (because of barriers to the spread of genes from one species to another), which therefore diverge into discrete units of morphological and genetic variation apparent from surveys of higher clades. Increasingly, studies on the nature and origins of species use empirical tools to delimit evolutionarily significant taxa based on measurable quantities, for example, reproductive isolation (Coyne and Orr 1998; Knowles and Carstens 2007), ecological divergence (Fontaneto et al. 2007; Leaché et al. 2009), and other traits (Feulner et al. 2007), rather than relying on qualitative taxonomic methods (see discussion by Sites and Marshall 2003). Gene trees provide a valuable source of information for inferring the pattern and processes of diversification. Until recently, studies of diversification were constrained by a trade-off in numbers of loci, numbers of individuals per species, and numbers of species that could be sampled, leading to either data sets of many loci in a few species or a few loci for many species. Population genetic and phylogeographic studies investigated population history and gene flow in related sister species or species complexes (Templeton 2001; Avise 2009). These studies typically sampled large numbers of individuals per species and often multiple molecular markers (Koufopanou et al. 1997), yet because of the level of sampling needed to infer population processes, by necessity a given study usually focused on few species. In contrast, phylogenetic studies reconstructed speciation events leading to extant species and inferred macroevolutionary processes at broad taxonomic and geographical scales (Barraclough and Nee 2001). However, because phylogenetic studies require a large sample of species for a large clade, by necessity these studies, until recently (Carstens and Dewey 2010; Camargo et al. 2012), mostly sampled only one exemplar per taxonomic species. Theory to analyze population versus phylogenetic data also developed separately. It is now feasible to sample multiple individuals from most species across a wider clade. For example, DNA barcoding projects perform molecular inventories of large samples of species and multiple individuals within species (Hebert et al. 2003; Meyer and Paulay 2005; Monaghan et al. 2009). Similarly, environmental samples of unculturable organisms, such as bacteria and microbial eukaryotes, can be sequenced from marine and terrestrial ecosystems (Acinas et al. 2004). These data offer the potential to delimit evolutionarily significant 707
Transcript of Delimiting Species Using Single-Locus Data and the ...

[09:56 27/7/2013 Sysbio-syt033.tex] Page: 707 707–724
Syst. Biol. 62(5):707–724, 2013© The Author(s) 2013. Published by Oxford University Press, on behalf of the Society of Systematic Biologists.This is an Open Access article distributed under the terms of the Creative Commons Attribution License (http://creativecommons.org/licenses/by/3.0/), which permitsunrestricted reuse, distribution, and reproduction in any medium, provided the original work is properly cited.DOI:10.1093/sysbio/syt033Advance Access publication May 16, 2013
Delimiting Species Using Single-Locus Data and the Generalized Mixed Yule CoalescentApproach: A Revised Method and Evaluation on Simulated Data Sets
TOMOCHIKA FUJISAWA1,2 AND TIMOTHY G. BARRACLOUGH1∗1Department of Life Sciences, Imperial College London, Silwood Park Campus, Ascot, Berkshire SL5 7PY, UK; and 2Department of Entomology, Natural
History Museum, London SW7 5BD, UK∗Correspondence to be sent to: Department of Life Sciences, Imperial College London, Silwood Park Campus, Ascot, Berkshire SL5 7PY, UK;
E-mail: [email protected].
Received 11 August 2012; reviews returned 19 November 2012; accepted 3 May 2013Associate Editor: Richard Glor
Abstract.—DNA barcoding-type studies assemble single-locus data from large samples of individuals and species, andhave provided new kinds of data for evolutionary surveys of diversity. An important goal of many such studies is todelimit evolutionarily significant species units, especially in biodiversity surveys from environmental DNA samples. TheGeneralized Mixed Yule Coalescent (GMYC) method is a likelihood method for delimiting species by fitting within- andbetween-species branching models to reconstructed gene trees. Although the method has been widely used, it has notpreviously been described in detail or evaluated fully against simulations of alternative scenarios of true patterns ofpopulation variation and divergence between species. Here, we present important reformulations to the GMYC method asoriginally specified, and demonstrate its robustness to a range of departures from its simplifying assumptions. The mainfactor affecting the accuracy of delimitation is the mean population size of species relative to divergence times betweenthem. Other departures from the model assumptions, such as varying population sizes among species, alternative scenariosfor speciation and extinction, and population growth or subdivision within species, have relatively smaller effects. Oursimulations demonstrate that support measures derived from the likelihood function provide a robust indication of whenthe model performs well and when it leads to inaccurate delimitations. Finally, the so-called single-threshold versionof the method outperforms the multiple-threshold version of the method on simulated data: we argue that this mightrepresent a fundamental limit due to the nature of evidence used to delimit species in this approach. Together with otherstudies comparing its performance relative to other methods, our findings support the robustness of GMYC as a toolfor delimiting species when only single-locus information is available. [Clusters; coalescent; DNA; genealogical; neutral;speciation; species.]
A fundamental pattern of nature is that organismsdiversify into more or less discrete entities that we callspecies. The term “species” is used to encompass manyfacets of the pattern of diversity and its underlyingcauses (Hey 2001; Coyne and Orr 2004; De Queiroz2007; Shaffer and Thomson 2007). However, in generalevolutionary terms (e.g., as encapsulated by the generallineage concept of species, De Queiroz 2007), speciesare groups of organisms that evolve independentlyfrom other such groups (because of barriers to thespread of genes from one species to another), whichtherefore diverge into discrete units of morphologicaland genetic variation apparent from surveys of higherclades. Increasingly, studies on the nature and originsof species use empirical tools to delimit evolutionarilysignificant taxa based on measurable quantities, forexample, reproductive isolation (Coyne and Orr 1998;Knowles and Carstens 2007), ecological divergence(Fontaneto et al. 2007; Leaché et al. 2009), and othertraits (Feulner et al. 2007), rather than relying onqualitative taxonomic methods (see discussion by Sitesand Marshall 2003).
Gene trees provide a valuable source of informationfor inferring the pattern and processes of diversification.Until recently, studies of diversification were constrainedby a trade-off in numbers of loci, numbers ofindividuals per species, and numbers of species thatcould be sampled, leading to either data sets ofmany loci in a few species or a few loci for many
species. Population genetic and phylogeographic studiesinvestigated population history and gene flow inrelated sister species or species complexes (Templeton2001; Avise 2009). These studies typically sampledlarge numbers of individuals per species and oftenmultiple molecular markers (Koufopanou et al. 1997),yet because of the level of sampling needed to inferpopulation processes, by necessity a given study usuallyfocused on few species. In contrast, phylogenetic studiesreconstructed speciation events leading to extant speciesand inferred macroevolutionary processes at broadtaxonomic and geographical scales (Barraclough andNee 2001). However, because phylogenetic studiesrequire a large sample of species for a large clade,by necessity these studies, until recently (Carstens andDewey 2010; Camargo et al. 2012), mostly sampled onlyone exemplar per taxonomic species. Theory to analyzepopulation versus phylogenetic data also developedseparately.
It is now feasible to sample multiple individualsfrom most species across a wider clade. For example,DNA barcoding projects perform molecular inventoriesof large samples of species and multiple individualswithin species (Hebert et al. 2003; Meyer and Paulay2005; Monaghan et al. 2009). Similarly, environmentalsamples of unculturable organisms, such as bacteria andmicrobial eukaryotes, can be sequenced from marine andterrestrial ecosystems (Acinas et al. 2004). These dataoffer the potential to delimit evolutionarily significant
707
[09:56 27/7/2013 Sysbio-syt033.tex] Page: 708 707–724
708 SYSTEMATIC BIOLOGY VOL. 62
units of diversity at broad taxonomic scales. However,at present, large-scale biodiversity surveys still mostlyrely on single loci, such as cytochrome oxidase I foranimal barcodes or 16S rDNA for bacterial diversitysurveys (note that plant DNA barcoding uses multipleloci but often multiple linked loci on the plastid genome,which equates to a single locus in terms of genealogicalinformation, see CBOL Plant Working Group 2009).Despite advances in genomic technology, it remainsdifficult to sample multiple variable and orthologousnuclear markers at equivalent taxonomic breadth anddepth (but see Brito and Edwards 2009). In addition,for unculturable organisms, sampling multiple markersfrom individuals (as opposed to pooled environmentalsamples sensu Venter et al. 2004) is challenging(Barraclough et al. 2009). Evolutionary inference fromsingle-locus data has limitations, including lower powerfor detecting independent evolution compared withmultilocus approaches (Knowles and Carstens 2007;Dupuis et al. 2012), the potential discordance betweengene trees and species trees (Hailer et al. 2012), andthe lack of information on adaptive divergence (Willand Rubinoff 2004). Nonetheless, single-locus data doprovide a genetic record of evolutionary histories (Avise2009) and, therefore, provide useful information forsurveying evolutionary patterns of diversity acrossbroad scales (Monaghan et al. 2009).
Several methods have been proposed that aresuitable for delimiting species from single-locus data.The simplest approach is to define species basedon a percentage cut-off rule, such as the 1% or3% rule used to delimit bacterial species from 16SrDNA sequences (Schloss and Handelsman 2006) orcytochrome oxidase I for insect species (Brower 1994).This method suffers from a weak connection toevolutionary theory, from variation in typical levels ofintraspecific and interspecific variation among clades,and from substitution rate variation among lineages(Barraclough et al. 2009). Although pairwise distancethresholds might often work well in practise (Tang et al.2012), evolutionary methods are needed to validate theiruse. Also, an underlying evolutionary model is neededto assign uncertainty in the resulting delimitationand to compare alternative evolutionary hypothesesstatistically, such as whether a clade has diversified intospecies or not (e.g., Fontaneto et al. 2007).
Evolutionary methods have focused on detectinggenetic signatures indicative of independent evolution,such as evidence of fixed differences (Hey 1991; Davisand Nixon 1992) or reciprocal monophyly (Wiens andPenkrot 2002) between population samples. However,these approaches require a priori hypotheses of putativespecies groupings, based on traditional taxonomy,morphospecies, or population samples, against whichcriteria such as monophyly can then be assessed. Thiscan introduce biases into delimitation (e.g., crypticsympatric species would not be delimited because therewould be no independent data for judging monophylyor fixed differences) and the additional informationrequired is not available in extreme cases, such as
delimiting bacterial species from a single environmentalsample solely from DNA sequence data (Acinas et al.2004; Venter et al. 2004). In more recent studies,Bayesian methods to delimit species using multilocussequence without a priori species boundaries have beenproposed (O’Meara 2010; Yang and Rannala 2010). Theseapproaches can handle uncertainty of delimitation andutilize multilocus data. However, they are currently toocomputationally intensive to apply to large samples.
The Generalized Mixed Yule Coalescent (GMYC)method, devised by T.G.B. and first introduced in Ponset al. (2006) and Fontaneto et al. (2007), is one methoddesigned to delimit independently evolving speciesusing single-locus data. By “independent evolution,”we mean that new mutations arising in one speciescannot spread readily into another species (Templeton1989; Barraclough et al. 2003; De Queiroz 2007).The GMYC method relies on the prediction thatindependent evolution leads to the appearance ofdistinct genetic clusters, separated by longer internalbranches (Barraclough et al. 2003; Acinas et al. 2004).It delimits such genetic clusters by optimizing the setof nodes that define the transitions between inter-and intra-specific processes. Optimization proceeds byfinding the maximum likelihood (ML) solution for amodel that combines diversification between species(based on a Yule model, Nee et al. 1994) and genealogicalbranching within species (based on a neutral coalescent,Hudson 1990). Because it does not rely on additionalevidence to formulate hypotheses of putative species,the method can be applied in cases lacking additionaldata with which to infer putative species limits.Other methods have been proposed based on similarpredictions to those used by GMYC, and these oftenlead to similar outputs (e.g., the K/theta method ofBirky et al. 2010). An advantage of GMYC is that thelikelihood framework allows for statistical inference andhypothesis testing across the entire sampled clade. Therelative performance of GMYC and alternative methodsis compared elsewhere (Birky et al. 2010; Tang et al. 2012).
The method has been applied to single-locus data ofmany organisms (e.g., Fontaneto et al. 2007; Lahaye et al.2008; Papadopoulou et al. 2008), and extensions of thealgorithm have been proposed (Monaghan et al. 2009;Powell 2012). The method has not, however, previouslybeen fully described or had its performance evaluatedagainst simulated data under a wide range of conditions(although see Papadopoulou et al. 2008 for the effectsof restricted dispersal and Esselstyn et al. 2012 forthe effects of varying effective population sizes andspeciation rates). Here, we present the algorithms usedin detail and determine the power and error rates ondata sets simulated under a wide range of conditions.In addition, we describe the statistical properties of theGMYC delimitation method, and make an adjustmentin its formulation. The threshold times used to specifythe location of nodes defining species are now correctlytreated as a model constraint, rather than (incorrectly)as a parameter. This change does not affect the MLdelimitation found by the method, but it does affect the

[09:56 27/7/2013 Sysbio-syt033.tex] Page: 709 707–724
2013 FUJISAWA AND BARRACLOUGH—DELIMITING SPECIES USING GMYC 709
power to reject the null model that all individuals belongto a single species cluster.
METHODS
AssumptionsAssume that a single locus has been sequenced for a
sample of individuals from a monophyletic clade. Thesample is sufficient that multiple individuals have beensampled per species, should different species be present,and that most if not all species are sampled. Differentsampling schemes will be considered below. Assumethat the true genealogy of the locus is known (i.e., thereare no reconstruction artefacts), that the locus is a neutralmarker, and that there is no geographic substructurewithin each species. Departures from these assumptionswill be discussed below. The goal is to determinewhether the clade has diversified into independentlyevolving groups, namely species and, if so, to delimitthose species.
The null model is that all individuals within thesample belong to a single species or population. Theexpected patterns for gene trees in a single populationare well established. Sampled genes coalesce to a singlecommon ancestor at a mean rate proportional to theeffective population size, Ne, in the case of a strict neutralcoalescent (Hudson 1990; Rosenberg and Nordborg2002). Coalescence occurs because population size islimited: the chance that each individual contributesoffspring to subsequent generations depends on thecontribution of the other individuals in the population.
Our alternative model is that the clade has diversifiedinto separate species, each of which is considered as asingle entity in the sense outlined for the null model.Gene copies will tend to coalesce back to a singlecommon ancestor within each species. If the time tomost recent common ancestor (Tmrca) within speciesis younger than the time since the species split fromtheir nearest sisters, this will lead to a pattern ofgenetic clusters: clusters of closely related individualseparated from other such clusters by longer internalbranches (Fig. 1; Barraclough et al. 2003). Branchingrates between clusters will reflect speciation events,as well as extinction and the degree of samplingof species entities (Nee et al. 1994; Barraclough andHerniou 2003). Branching within clusters will reflect thesame population processes outlined for the null modelbut now occurring independently in separate species.However, if the Tmrca within species tends to be olderthan the time since each split from its nearest sisterspecies, then clusters may not be observed and we may beunable to reject a null model of no species diversification.Note that our definition is similar to the general lineageconcept of species although it differs in focusing on thegenetic signatures that we use to delimit such groups(De Queiroz 2007).
The above scheme assumes two extreme cases: oneunstructured population versus diversification into two
x1 x3 ...x2
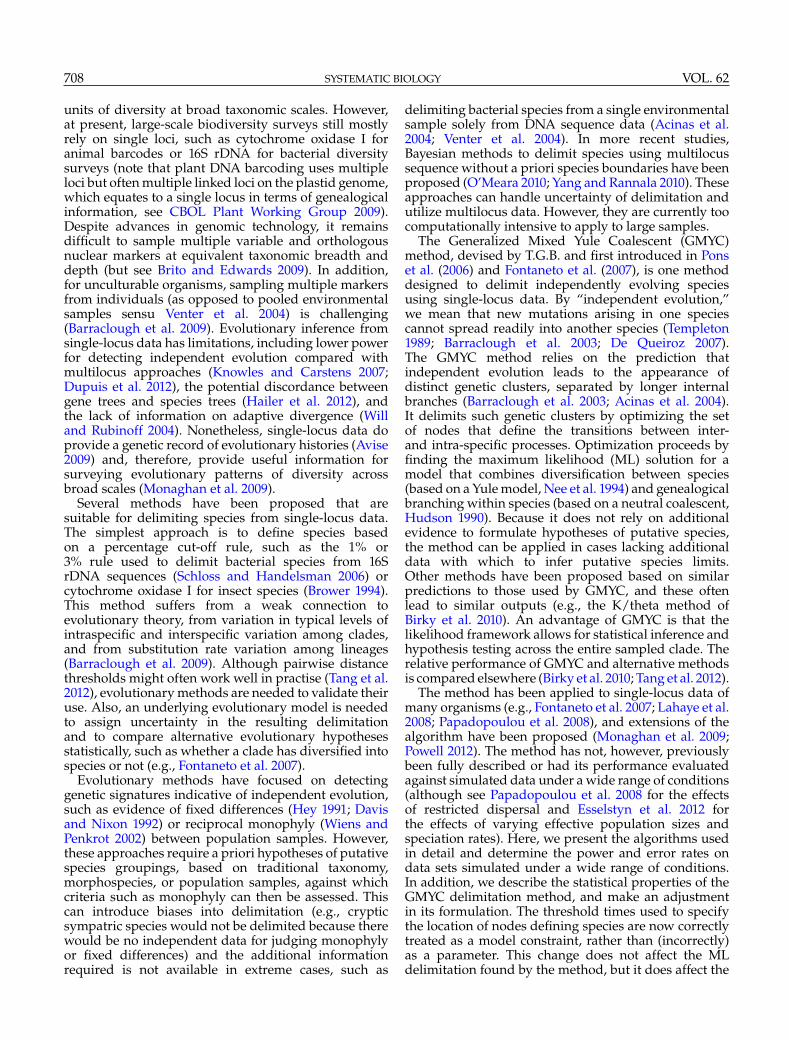
FIGURE 1. Schematic diagram showing how nodes are used todefine species on a hypothetical gene tree. Black diamonds indicatethe MRCA nodes that define species in a particular delimitation.Branches in dashed and solid lines represent speciation and coalescentbranches, respectively. Bars next to the tips represent two alternativedelimitations. Solid bars indicate the delimitation defined by theMRCA nodes shown on the tree. Dashed black bars indicate analternative delimitation (i.e., splitting the top species into two) thatcould be assigned by the multiple-threshold method but not by thesingle-threshold method. Dashed gray vertical lines show the waitingtimes ×1, ×2, etc. that are used in the GMYC likelihood model.
or more populations, each of which is unstructuredbut fully isolated from the others. In reality, there willoften be some degree of geographical structure withinmost species as well (Avise 2009). This could lead eitherto signatures intermediate between the two extremecases or to hierarchical clustering, with populationclusters apparent within species clusters (Lohse 2009;Papadopoulou et al. 2009). Expressions are available forscenarios departing from the assumptions of neutrality,constant population size, and unstructured populations(e.g., Charlesworth et al. 2003). For now, we ignorethis complication and address how to detect significantsignatures of diversification in the simple case. Note thatthis issue does not affect application of the method todelimit species within a single environmental sample,where geographical subdivision within species cannotoccur.
Likelihood ModelThe GMYC approach extends existing likelihood
methods for analyzing the timing of branching eventsin gene trees. The raw data for comparing differentmodels are waiting times between successive branchingevents, xi (Fig. 1). Under the null model that the entireclade represents a single population (Hudson 1990), thelikelihood of waiting time i under a neutral coalescentmodel with an effective population size of Ne and n

[09:56 27/7/2013 Sysbio-syt033.tex] Page: 710 707–724
710 SYSTEMATIC BIOLOGY VOL. 62
lineages present is given by:
L(xi)=�e−�xi (1)
�= ni(ni −1)2Ne
(2)
The alternative model is that the clade has diversifiedinto k species, each of which is treated as an independentpopulation with effective size, Nj,j=1 to k. The modelsplits the tree into two types of branching events.First, branching events within species are determinedby k independent neutral coalescent processes (shownby the black branches on Fig. 1). Second, branchingamong species (shown by the dashed branches onFig. 1), which we refer to as diversification, is treatedas a stochastic birth–death process as developed foranalyzing speciation and extinction on species-levelphylogenetic trees (Nee et al. 1994; Morlon et al. 2011;Etienne et al. 2012). By convention, the simplest modelis a Yule model that the number of species growsexponentially over time, with constant average birth rate,�spec, and no extinction. The likelihood of waiting timesbetween successive branching events among-species is:
L(xi)=�specni,spece−�specni,specxi (3)
We modified the diversification process slightly topermit comparison of null and alternative models.By convention, phylogenetic branching models take aforward perspective, starting at the root and havingM-2 speciation events, where M is the number oftips. Coalescent approaches take a reverse perspective,starting at the tips and having M-1 coalescent events.Hence, if we took a forward time approach for thediversification part of our mixed model we would haveone less event than in the null model that the sampleis drawn from a single population. To account for this,we adopt a reverse approach for the diversificationbranching process, that is, starting from the stembranches for each species, using equation (3) as thelikelihood that the previous branching event occurredxi time units previously (cf. Hey 1992). A furthercomplication is that stem branches leading to eachspecies have a different probability distribution thaneither diversification or coalescent branches, because(in reverse time) each stem branch starts at a commonancestor node for an entity and ends at a diversificationevent. The simplest approximation, which we adopt, isto assume that these branches have the same probabilitydistribution as the diversification branching process.
The final step is to calculate the likelihood of observedwaiting times on the tree assuming a mixed model ofcoalescence within species and diversification amongspecies. The combined series of events resulting from thecombination of k independent Poisson processes followsa Poisson process with rate b equal to the sum of the ratesof the separate processes (Cox and Miller 1965, p. 154).Hence, for a Yule diversification process and a set of kneutral coalescent processes within a given assignment
of species, the likelihood of each waiting time is:
L(xi
)=be−bxi , (4)
where b=�specni,spec +∑
j=1,k
(�jni,j
(ni,j −1
)), (5)
where �spec and nspec are used to indicate thediversification process, and ni,j is the number of lineagesin waiting interval i belonging to process j. Calculationof the relevant number of lineages for waiting timesmust take account of which lineages at any time pointare taking part in which branching process (Fig. 1).The model is fitted by maximizing the sum of loglikelihood of waiting times for both classes of branchingevents across the entire tree. Note that, in commonwith previous approaches for modeling diversificationprocesses (Hey 1992), we do not model gene treetopology (cf. Rannala and Yang 2003), but instead modelthe distribution of waiting intervals between branchingevents.
Generalized ModelThe above equations make strict assumptions about
the constant rate of branching in both populationand diversification processes that seem unlikely tohold widely. One solution would be to compare alarge array of specific population and diversificationmodels using the Akaike Information Criterion (AIC,Rabosky and Lovette 2008). For example, a birth–deathbranching process for diversification could be addedby substituting the equations from Nee et al. (1994).This exercise might be useful for specific hypothesesof prior interest, but it is unwieldy due to the vastnumber of possible models, many of which might beindistinguishable (Kubo and Iwasa 1995; Barracloughand Nee 2001). An alternative solution is to generalizethe above equations to fit a range of qualitativelydifferent models, without specifying the underlyingprocesses. Nee et al. (1994) and Nee (2001) discussedtransformations of waiting intervals that allow derivedmodels to be treated as exponential processes with asingle rate parameter. These accounts imply a simplegeneral expression for the likelihood of waiting timesof a single branching process:
L(xi)=ni,specp�spece−ni,spec
p�specxi , (6)
where p is a scaling parameter. A value of p=1 indicatesa constant per lineage branching rate, p>1 indicatesthat the apparent branching rate accelerates toward thetips, and p<1 indicates an apparent deceleration in ratetoward the tips. For coalescent processes within entities,ni is substituted with ni(ni −1).
The value of p is optimized during model fitting,allowing a range of qualitatively different models.Interpretation of p depends on which class of branchingevents are considered. Barraclough and Nee (2001)reviewed interpretations of changes in diversification
[09:56 27/7/2013 Sysbio-syt033.tex] Page: 711 707–724
2013 FUJISAWA AND BARRACLOUGH—DELIMITING SPECIES USING GMYC 711
rate on phylogenetic trees, which apply exactly tointerpretation of p. For example, p>1 indicates anapparent increase in diversification rate toward thepresent, as might be expected under a real increasein birth rate or under a model with a constant birthrate but adding a constant death rate (Nee et al. 1994).p<1 represents an apparent decrease in diversificationrate toward the present, consistent with niche-fillingmodels, or incomplete sampling of species within theclade (Pybus and Harvey 2000; Nee 2001; Phillimore andPrice 2008; Rabosky and Lovette 2008).
Similarly, p for a coalescent model will reflect processesaffecting the timing of coalescent events within entities.p<1 indicates a deficit of recent coalescent events,for example, if populations are growing in size or ifthe marker has experienced a selective sweep. p>1indicates an excess of recent coalescent events, forexample, if populations were declining in size, if therewas geographic subdivision within species or as aresult of balancing selection on the marker. (Note thatthe description in Pons et al. 2006 of interpretingthe effects of selection on coalescent p was incorrect.)Hence, by optimizing across possible values of pfor both classes of branching events, our method isqualitatively robust to the details of the models. Notethat the power transformation might not provide alinear approximation to particular process. However, itdoes allow smooth changes in branching rate over timeto be fitted, and the fitted parameter values indicatewhich detailed models might be explored as possibleexplanations for the data.
Using the notation outlined earlier, the GMYC modelis specified by substituting b in equation (5) with b∗:
b∗ =�spec
(ni,spec
)pspec +∑
j=1,k
(�j
(ni,j
(ni,j −1
))pj)
(7)
The ML estimate of � for a given assignment of nodesis calculated using the Moran estimator of Nee (2001),namely the number of branching events divided by thetotal length of between-species branches. The estimatoris modified to incorporate the scaling of branch lengths,that is, the number of diversification events divided bythe sum of (ni,spec)pspecxi across all waiting intervals. Theequivalent expression but using (ni,j(ni,j −1))pj xi for thedenominator is used for the coalescent processes. Thescaling parameters are optimized using Nelder–Meadoptimization as implemented in the “optim” functionof R.
The simplest formulation is to assume that allthe sampled entities have the same branchingparameters, which we call the minimum model. Inreality, different sampled entities might have differentparameters, if their population sizes differ or theyhave experienced different demographic or selectivehistories. A maximum model would include separate�j and pj for each entity. A more frugal approach is toallow for variation in parameter values among entitiesbut only introducing a few additional parameters to
the minimum model. We have tried fitting separateparameters for each cluster and results do not seemto greatly differ (see Pons et al. 2006) although futurework could explore this further. For conciseness andsimplicity we only consider the minimum model versionhere.
Single-Threshold Approach to Delimiting SpeciesDelimitation with the GMYC approach is based on
assigning branching events to two categories, speciationand coalescent within species. With the simplifyingassumption that species are monophyletic, a set ofmost recent common ancestor (MRCA) nodes can bespecified that determines the type of branching events(Fig. 1). Branches descending from the MRCA nodesare coalescent branches within the species, and cladesdefined by each MRCA node are species clusters.Because a given set of MRCA nodes specifies a form ofthe likelihood function, equation (7), and represents aunique testable hypothesis of memberships of putativespecies, each set of MRCAs can be treated as a candidatemodel of delimitation. The models are compared toobtain the best set of MRCA nodes within a ML scheme.Equations (6) and (7) are first optimized separatelyfor each model then the likelihood values of theoptimization results are compared. The set of MRCAswith the highest ML is selected as the best modelof delimitation. This process is analogous to the two-step process of phylogenetic inference with ML, whichis treated as model selection instead of parameteroptimization (Yang et al. 1995; Yang 2006).
The challenge is that, even with the simplifyingassumption of monophyly and a gene tree of modestsize, there is an enormous number of possible candidatedelimitation models (approximately 4.11×10²² modelsfor a balanced tree with 128 tips, online Appendix 1).The simplest approach, proposed by Pons et al. (2006), isto assume that there is a threshold time, T, before whichall nodes reflect diversification events and after which allnodes reflect coalescent events. This reduces the numberof candidate models to equal the number of nodes inthe tree. It does not assume that all species have thesame Tmrca, which would be violated even in an equalpopulation size model due to the expected variancein the Tmrca. Instead, it assumes that the most recentdiversification event occurred before the oldest within-species coalescent event. If we assume for parsimony thatall species have the same effective population size, thisversion of the GMYC model introduces two additionalparameters compared to the null model: a diversificationrate parameter, �spec, and scaling parameter, pspec. Thethreshold time, T, which was treated as a parameterin Pons et al. (2006), is now correctly treated as aconstraint of search space. The ML threshold, andhence assignment of species, is found by calculating thelikelihood of the alternative model for all possible valuesof T. Multimodel comparison with the AIC can be usedto assess the relative importance of alternative models

[09:56 27/7/2013 Sysbio-syt033.tex] Page: 712 707–724
712 SYSTEMATIC BIOLOGY VOL. 62
and whether the ML alternative model is preferred overthe null model of no such shift in branching process(Powell 2012). Note that with the reformulation of T asa constraint rather than a parameter, then the degreesof freedom for a log likelihood comparison of the nullmodel with the single-threshold model is now 2, not 3as proposed in Pons et al. (2006). The ML solution isunaltered with the new formulation, but the power is:any result using the former formulation with a P-valueof 0.112 or less will be significant at 0.05 with the revisedmodel.
Multiple-Threshold Approach to Delimiting SpeciesThe multiple-threshold approach, devised by TF
and first described in Monaghan et al. (2009), relaxesthe assumption of the single-threshold version thatspeciation events are older than all coalescent events inthe gene tree. Instead, from a given starting assignmentof MRCA nodes, it searches alternative models viaan heuristic algorithm that iteratively splits and fusesexisting species clusters (see fig. 1 in Monaghan et al.2009). The algorithm keeps exploring additional setsuntil the last round of trials found no sets of MRCAwith an improved likelihood on the previous ML set.We tried two versions of this process differing in thehow the starting set of MRCA nodes is chosen. First,we started with arbitrary sets as described in Monaghanet al. (2009). In this case, optimization is often attracted tolocal optima, necessitating repeats with multiple startingsets, which greatly increases the run time. Second, westarted with the set of MRCA found using the single-threshold method. To check the performance of theseapproaches we simulated 100 gene trees assuming aconstant speciation rate and a population size of 105 (asdescribed further below) with four species and five tipsper species; small enough to allow an exhaustive searchof all delimitation models. These simulations showedthat the multiple threshold starting from the best single-threshold solution more frequently finds the globaloptima and better solutions than the search startingfrom multiple arbitrary sets (Supplementary material atDryad, doi: 10.5061/dryad.0hv88, Table S1, Fig. S1). Wetherefore use this approach.
In Monaghan et al. (2009), we treated additionalthresholds needed to assign classes in the multiple-threshold algorithm as additional parameters, but herewe redefine these as a constraint of search spacerather than parameters, for the reasons describedearlier. Therefore, the numbers of parameters are nowidentical in both the single-threshold version andthe minimal model version of the multiple-thresholdversion. The two versions can no longer be comparedby likelihood ratio tests, because they contain the samenumber of parameters. Instead, alternative assignmentsare considered together in a multimodel comparisonframework.
Uncertainty in DelimitationWe specify uncertainty in assignment using the AIC-
based approach for multimodel comparison describedby Powell (2012). Akaike weights and model-averagedestimates of GMYC parameters and their standard errorsare defined in Powell (2012, equations 4–9). Also, the �%confidence set of candidate models can be obtained byadding the Akaike weights cumulatively starting fromthe minimum AIC model with increasing order until �%is attained (Burnham and Anderson 2002). The supportvalue of a species cluster, which we call GMYC support,is given by the sum of the Akaike weights of models inwhich the MRCA node appears as follows.
wMRCA =R∑
i=1
wiI(Mi), (8)
I(Mi)={
1, if the MRCA belongs to the ith model0, otherwise
where wi is the Akaike weight of ith model, Miand R are the number of total model considered.Note that this represents support for the node amongthe alternative models of delimitation consideredduring model comparison. Although not all possibledelimitation models can be compared, comparisonof models specified by all possible single thresholdstogether with additional models searched with themultiple-threshold algorithm is a judicious approach.
SimulationsTo assess the properties of the method, genealogies
were simulated under several scenarios of evolution andsampling schemes, which were expected to affect theperformance of the method. In each following treatmentexcept for A, species trees were first simulated underdifferent diversification models, then gene genealogieswithin the species trees were simulated. One hundredreplicated gene trees were simulated for each scenario.Species trees were simulated in Phylogen (Rambaut2002) and gene trees in ms (Hudson 2002), usingscripts in R to generate ms command files specifyingphylogenetic history among species based on thesimulated species tree. We modified ms to output branchlengths to seven decimal places instead of three to avoidthe simulation of simultaneous coalescent events for thelarge samples being studied here.
(A) Null model: The null model was simulated assum-ing a neutral coalescent process in a singlepopulation and a sample of 150 individuals. Branchlengths in the resulting trees are in units of 4 Negenerations. Because the GMYC method relies onrelative branch lengths rather than absolute branchlengths, we scaled branch lengths in the simulatedtrees to have a root age of 1.0 before running theGMYC analyses, to maintain consistent scale acrossthe different simulations.
[09:56 27/7/2013 Sysbio-syt033.tex] Page: 713 707–724
2013 FUJISAWA AND BARRACLOUGH—DELIMITING SPECIES USING GMYC 713
(B) Diversification (coalescence within a species tree):Gene trees were simulated assuming 30independently evolving species. First, speciestrees were simulated under a constant birth (Yule)model without extinction. Species trees werescaled so that the root node age was 10 milliongenerations, yielding a net per lineage speciationrate of approximately (log(30)−log(2))/107 =0.27,which falls within typical values (Barraclough andVogler 2002). Then, gene trees within species treeswere simulated assuming that five individualswere sampled from each entity. Numbers werechosen to match realistic yet conservative samplesizes (e.g., Pons et al. 2006). The effects of samplingmore individuals per species versus samplingmore species are being investigated by simulationelsewhere (Ahrens D., Krammer H.J., FujisawaT., Fabrizi S., Vogler A.P., unpublished data).Population sizes for each species were assumedto be the same, and set in repeated simulations as104, 105, 5×10⁵, and 106 in turn. Larger populationsizes increase the genetic variation within speciesand, consequently, are expected to make thetransition from inter- to intra-specific processesharder to detect. Population sizes used herewere chosen based on preliminary simulationsto be representative of a trend from reciprocalmonophyly of all species to the case in whichfew species are monophyletic on gene treeswith population size of 5×10⁵ better reflectingthis trend than just powers of 10. The range ofpopulation size covers the estimated effectivepopulation sizes of common eukaryotic species(Charlesworth 2009). Note that the performanceof the GMYC method will depend on relativediversification and coalescent rates, not onabsolute rates: for example, doubling populationsize and halving diversification rate would notchange the shape of the resulting gene trees.
(C) Alternative diversification models: Simulation B as-sumes constant speciation rate and no extinction.However, this assumption is often violated inreal data sets (Phillimore and Price 2008; Morlonet al. 2011; Etienne et al. 2012). We repeatedthe simulations with alternative diversificationmodels. In C1, 30 species were sampled froma tree containing 50 species generated under aconstant speciation rate. This model creates arecent deficit of speciation events, a situation thatmight arise due to incomplete species samplingor an actual slow down in the net diversificationrate over time. Simulation C2 was simulatedwith constant speciation and extinction rate, withextinction rate 30% of the speciation rate. Themodel with extinction produces a recent excessof diversification events, the so-called “pull ofthe present” (Nee et al. 1994). Repeating thesimulation with an extinction rate of 80% led
to more extreme findings in the same directionas reported here. The GMYC model is designedto fit these different diversification processes byoptimizing values of the scaling parameters asdescribed earlier (i.e., pspec <1 for C1 and pspec >1for C2). However, delimitation is expected to beeasier in C1 than in simulation B, because terminalspecies divergence times will tend to be longer,and harder in C2, because terminal divergenceswill be shorter. Coalescent trees were simulatedwithin species trees of both C1 and C2 with thesame population and sample sizes as simulation B.
(D) Alternative population models: growing or declin-ing populations: Simulation B assumes that spe-cies have had constant Ne over time. To check theability of the scaling parameters to fit differentpopulation processes, we simulated two differentmodels. In D1, we simulated gene trees assumingrecent exponential growth within species. Thereare many potential versions that could besimulated, but we assumed that species wereaffected by an instantaneous population bottleneckTb generations ago (arbitrarily choosing Tb tobe half the age of the penultimate diversificationevent), followed by exponential growth to thepresent day. The rate of growth was assignedto generate a 10-fold increase in population size,and the severity of bottleneck was chosen so thatthe harmonic mean effective population size overthe growth period was equal to Ne, with thesimulation repeated with Ne equal to 104, 105,5×10⁵, and 106 for comparability with simulationB. Effective population sizes before Tb generationsago were assigned as constant and equal toNe. In D2, we followed the same approach, butwith an instantaneous growth in populations Tbgenerations ago followed by exponential decline.We predict that D1 should yield pk <1 and D2should yield pk >1, reflecting a relative deficit andexcess of recent coalescent events within species,respectively. We also predict that delimitationshould be more accurate in D1 than in D2, becausein D1 there will tend to be relatively shorterbranching intervals near the most recent commonancestral node for a species. In reality, it is unlikelythat all species would show the same populationtrends, but the simulations allow the broad effectsof alternative models to be compared.
(E) Diversification with different sized populations:The above simulations assume that populationsizes are equal among species. To investigate theeffect of varying population sizes, we simulatedeffective population sizes drawn from a log-normal distribution with means equal 104, 105,5×10⁵, and 106 in successive simulations. We areunaware of any comparative data on effectivepopulation sizes among species, but speciesabundances typically follow a roughly log-normal

[09:56 27/7/2013 Sysbio-syt033.tex] Page: 714 707–724
714 SYSTEMATIC BIOLOGY VOL. 62
distribution (Green and Plotkin 2007). Populationsizes of each species of the species trees simulatedin B were assigned from a log-normal distributionwith means equal to 104, 105, 5×10⁵, and 106 insuccessive simulations. Ancestral species wereassigned the population size of the species withthe lower index in the representation in Ms format.
(F) Alternative sampling scheme: random sample acr-oss the clades: Even if the alternative model istrue, random sampling could bias the detectionof true clusters if there is no prior knowledge ofentities. To check the effect of random sampling,we simulated gene trees sampling 150 individualsin total, but choosing individuals at random withrespect to species membership. Simulation F1mirrored simulation B, with equal population sizesamong species and hence equal probability that asampled individual belongs to any species. In F2,we assumed log-normally distributed populationsizes and species are sampled in proportion totheir population sizes, that is, a species withtwice the population size is likely to be sampledtwice as often. Note that this simulation addressesthe question of how the proportion of singletonswithin samples affects the accuracy of delimitation(Lim et al. 2011), since many species are sampledonly once by chance.
(G) Geographical structure within species: For this sce-nario, we assumed that each species divided intotwo populations halfway along its terminal branchin the species tree and that two individuals weresampled from population 1 and three individualsfrom population 2. We then assigned a migrationrate, m, such that Nem has a random uniformdistribution between 0 and 1. All species in agiven species tree were assumed to have the samemigration rate, but a different migration rate waschosen for replicate species trees to explore howthe performance of the GMYC method varied withmigration rate. For m=0, the two populations arecompletely isolated and the method should detecttwo separate clusters within each species. Forhigher m, the method should gradually shift fromdelimiting populations as clusters to delimiting thespecies.
(H) Sequence simulation and reconstructed gene trees:All simulations above assume that the truegenealogy of sampled genes is known. In reality,however, true gene trees are unknown andestimated from DNA sequences. The uncertaintyof tree inference may reduce the performance ofdelimitation. To assess the effect of tree inference,we conducted sequence simulations followed bytree inference and delimitation. DNA sequenceswere simulated along the branches of genetrees in simulation B using Seq-Gen (Rambautand Grassly 1997), using the HKY+G model
and average mutation rate of 0.02 per milliongenerations (Brower 1994). Sequence lengths ofsamples were taken from a uniform distributionbetween 200 and 1800, which is the range ofmitochondrial protein-coding genes (Luo et al.2011). Gene trees were inferred from the simulatedsequences using RAxML (Stamatakis 2006)with 100 bootstrap pseudoreplicates, then madeultrametric with the molecular clock assumptionusing the Langley–Fitch method implementedin r8s (Sanderson 2003). Identical sequences(haplotypes) were pruned to a single copy beforeimplementation, because of known problems forGMYC caused by identical sequences (Monaghanet al. 2009): zero length terminal branches lead tocalculation of an infinite coalescent �.
Both the single-threshold and multiple-thresholdalgorithms were run on the simulated gene trees. The95% confidence set was constructed for each simulationrun first using all models defined by single thresholdsand then adding models found with the multiple-threshold search. The size of the confidence set wasrecorded, and the rate of false negatives was measuredas the rate of erroneously including the null modelin the confidence set when the alternative model wastrue. When the null model was the true model, therate of excluding the null model from the confidenceset was calculated as the rate of false positives. Theaverage proportion of species correctly delimited withan exact match was recorded as a measure of accuracy.Support values described above were calculated foreach run of the simulations and their means wereused to summarize the uncertainty of delimitation. MLestimates of numbers of clusters and scaling parametersfor both speciation and coalescent part were alsorecorded. For simulation H, the GMYC results werecompared with clusters inferred using a 2% distancethreshold on a neighbor-joining tree of the simulatedsequences.
To explore the effect of tree shape on delimitation,separately from the major differences amongsimulations, several tree-shape indices for bothsimulated species and gene trees were calculated. Meanbranching times (Mean Tspec) and � statistics (Pybusand Harvey 2000) of the species trees were recordedto summarize the pattern of speciation events. The�-statistic describes a tree’s departure from the constantspeciation model: �<0 indicates an apparent decreaseof speciation rates, and �>0 indicates an apparentincrease in speciation rate toward the tips. Note thatthe scaling parameters p correspond with � as bothindicate departure from constant speciation (e.g., when�<0, p<1 is expected). Colless’s index (Icolless, Agapowand Purvis 2002) was calculated for each species treeto check the effect of tree imbalance on delimitation.Mean Tmrca (Mean Tmrca) across species on gene treeswas used as a measure of variation within populations.Multiple regression analysis was then performed withthe number of exact matches as the response variable

[09:56 27/7/2013 Sysbio-syt033.tex] Page: 715 707–724
2013 FUJISAWA AND BARRACLOUGH—DELIMITING SPECIES USING GMYC 715
and the gene-tree indices and effective populationsize as explanatory variables. The importance of eachindex in predicting performance was expressed asits Akaike weight across models including it. Forsimulation G, the effect of the degree of populationstructure on delimitation success was also assessed witha regression analysis. All data processing and analyseswere performed in R (R Development Core Team2010) using the splits package (Ezard et al. 2009) withcustom scripts, and the APE and apTreeshape packages(Paradis et al. 2004; Bortolussi et al. 2006). The latestversion of GMYC in the splits package with the newformulation of parameters (version ≥1.0–15) is availableat http://r-forge.r-project.org/projects/splits and inthe Supplementary material deposited in Dryad. Notethat R-forge only maintains versions compatible withthe latest version of R. Previously available versionsof GMYC used the previous formulation of thresholdtimes.
Case Studies: Tiger BeetlesSingle-threshold versions of GMYC were applied
to the data of Pons et al. (2006) and Pons et al.(2011). Solutions were compared to those obtained withthe previous versions. Pons et al. (2006) sampled 468individuals of tiger beetles of the genus Rivacindela fromacross 65 sites in Australia. The Rivacindela group waslargely undescribed and, therefore, the samples werechosen from 108 local sets of individuals to representtheir morphological and geographical diversity. Upto five individuals were sampled per morphospeciesper site. Pons et al. (2006) sampled 161 individualsof the genus Neocicindela across New Zealand from13 known taxa. Multiple individuals were sampledper site together with additional representatives ofdescribed species to cover their known range. Gene treeswere inferred from three mitochondrial gene regions(cytochrome oxidase subunit 1, cytochrome b and 16SrRNA plus adjacent regions) in both studies. We usedthe dated gene trees from the source paper in both cases.
RESULTS
Error RatesThe rates of false positives (rejecting the null
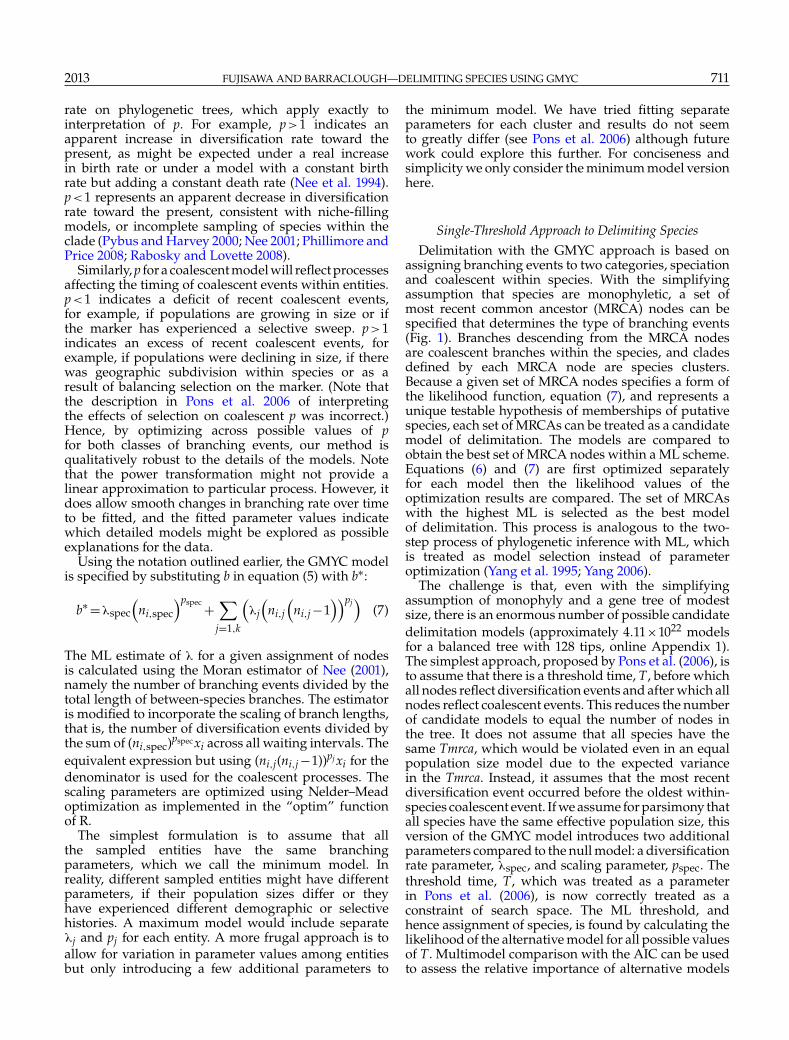
hypothesis at a 95% level when it is true) were �=0.02 and �=0.07 for the single- and multiple-thresholdmethods, respectively. The multiple-threshold methodis, therefore, marginally less conservative than thesingle-threshold method. The rate of false negatives(accepting the null hypothesis when the alternativehypothesis is true) was zero or near zero in allsimulations with low Ne (104 and 105, Fig. 2). Bothmethods, therefore, perform with similarly high powerwhen effective population sizes are low relative tobranching times between species. The rate of false
negatives rose steeply, however, for high Ne (5×10⁵ and106, Fig. 2). The multiple-threshold model had greaterpower in all cases, for example, rejecting the null modelin 1.1–2.4 times more cases than the single thresholdwhen Ne =106.
Error rates also varied with the generating processesused in the simulations. As predicted, the rate offalse negatives was always lower in C1 (decreasingapparent diversification rate= longer divergence timesbetween closely related species) and higher in simulationC2 (increasing apparent diversification rate=shorterrelative divergence times between closely relatedspecies) than in simulation B (constant diversificationrate). Contrary to predictions, the rate of false negativeswas lower in D2 (recently declining populations) than ineither D1 (recently growing populations) or B. With log-normally distributed Ne (E), the rate of false negativeswas much lower than the equivalent simulations withequal population sizes across species. Random samplingby clade rather than by species led to marginally reducedfalse negative rates when species had the same Ne (F1vs. B, Fig. 2), but to increased false negative rates whenspecies had different Ne (F2 vs. E, Fig. 2). Varying thedegree of migration between two subpopulations withineach species did not greatly affect the false negative rate(G, Fig. 2). The error rates of the reconstructed gene treeswere comparable with the ones of the true gene treesexcept for Ne =104 (H, Fig. 2), in which case they weremarginally higher.
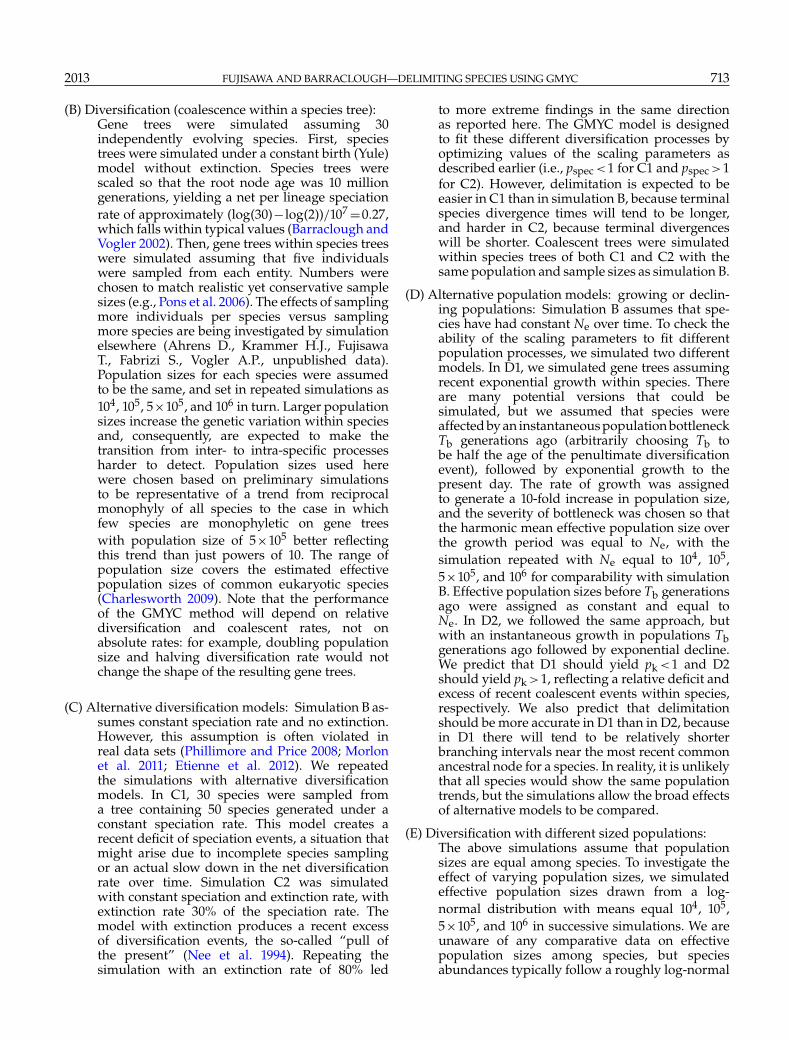
Accuracy of DelimitationThe mean percentage of species that were delimited
correctly with exact match, which we refer to as accuracy,fell from over 90% with Ne =104 to below 20% withNe =106 (Fig. 3). The accuracy of delimitation decreasedmarginally with the multiple-threshold method inall cases (0.6–0.9 times less accurate than the singlethreshold). Among the different simulations, accuracywas higher in C1 (decreasing apparent diversificationrate) than C2 (increasing apparent diversification rate)and in D1 (recently growing populations) than D2(recently declining populations) at all Ne, as predicted.The apparent discrepancy between results for errorrates and accuracy in the relative performance of themethods in D1 and D2 is explained because the excessof recent coalescent events in D2 created artefactualclusters within species: the null model was more easilyrejected, but only because of incorrect delimitation ofclusters. Similarly, although simulation E (lognormalNe) displayed much lower false negative rates thansimulation B, the accuracy did not differ greatly andindeed for higher Ne was lower than in simulation B(Fig. 3).
The accuracy of reconstruction was not greatlyaffected by random sampling across the clade ratherthan by species (B vs. F1 and F2, Fig. 3), indeed beingmarginally higher at low Ne even though a relatively

[09:56 27/7/2013 Sysbio-syt033.tex] Page: 716 707–724
716 SYSTEMATIC BIOLOGY VOL. 62
Type of simulation
Fal
se n
egat
ive
rate
0.0
0.2
0.4
0.6
0.8
B C1 C2 D1 D2 E F1 F2 G H
● ● ● ● ● ● ● ● ●
●
Single threshold
B C1 C2 D1 D2 E F1 F2 G H
● ● ● ● ● ● ● ● ●
●
Multiple threshold
10000 1e+05 5e+05 1e+06●
FIGURE 2. The mean false negative rate for each type of simulation and each effective population size from a sample of 100 simulated trees foreach simulation type and population size combination. Simulation types are described in the ‘Methods’ section: B is the constant speciation ratescenario; C1 is the incomplete sampling of species scenario; C2 is the constant background extinction rate scenario; D1 is growing populations;D2 is declining populations; E is variable population sizes among species; F1 is random sampling across the clade, equal population sizes; F2is random sampling across the clade, unequal population sizes; G is with geographical structure within species; H is from inferred trees fromsimulated sequence data.
Type of simulation
Acc
urac
y of
del
imita
tion
0.2
0.4
0.6
0.8
1.0
B C1 C2 D1 D2 E F1 F2 G H
●●
● ●●
●
●● ●
●
Single threshold
B C1 C2 D1 D2 E F1 F2 G H
● ●●
●
●
●
●●
●
●
Multiple threshold
10000 1e+05 5e+05 1e+06●
FIGURE 3. The mean accuracy of delimitation, expressed as the proportion of species correctly delimited, across the simulation types (B toH, see legend to Fig. 2) and across the four effective population sizes. Each point summarizes accuracy across 100 simulated trees.
[09:56 27/7/2013 Sysbio-syt033.tex] Page: 717 707–724
2013 FUJISAWA AND BARRACLOUGH—DELIMITING SPECIES USING GMYC 717
high proportion of species were represented only by oneor two individuals (simulation F1: number of samplesper species ranged from 1 to 18, with 3.3% and 8.7% ofspecies represented by 1 and 2 sequences, respectively;simulation F2 number of samples per species rangedfrom 1 to 67, with 18.2% and 15.3% of species representedby 1 and 2 sequences, respectively). Similarly, varyingthe degree of migration between two subpopulationswithin each species did not greatly affect the accuracycompared to the equivalent simulation assuming nostructure within species (G vs. B, Fig. 3).
In simulation H, many sequences had to be pruned asidentical haplotypes due to low variation. When Ne was104, 67% of sequences were removed and 49% of specieswere represented only by single sequences (singletons):this had the lowest accuracy of all simulation types butaccuracy was still above 80% with the single-thresholdmethod. The proportion of identical sequences andsingletons decreased as Ne increased (singleton=5%and identical=33% for Ne =105. Singleton �0.01% andidentical=7% for Ne =106) and in those simulationsaccuracy was unaffected compared to analyses ofthe true genealogy (H vs. B, Fig. 3). Accuracy was,therefore, unaffected by inferring the genealogyfrom DNA sequences except when intraspecificvariation was low enough to yield numerous identicalsequences.
UncertaintyThe size of the 95% confidence set of models increased
as Ne increased (Fig. S2). Trends among differentsimulations mirrored those for accuracy: simulationsthat displayed a higher accuracy retained a smallerconfidence set. The distribution of GMYC supportvalues also shifted similarly among simulations. Forexample, in simulation B with the single-thresholdmethod, the mean support value across nodes was0.96 for Ne =104, 0.63 for Ne =105, 0.35 for Ne =5×10⁵, and 0.30 for Ne =106. This demonstrates that themethod of judging uncertainty adequately reflects thereduced performance of the model when the shift inbranching patterns within versus between species is lessdistinct.
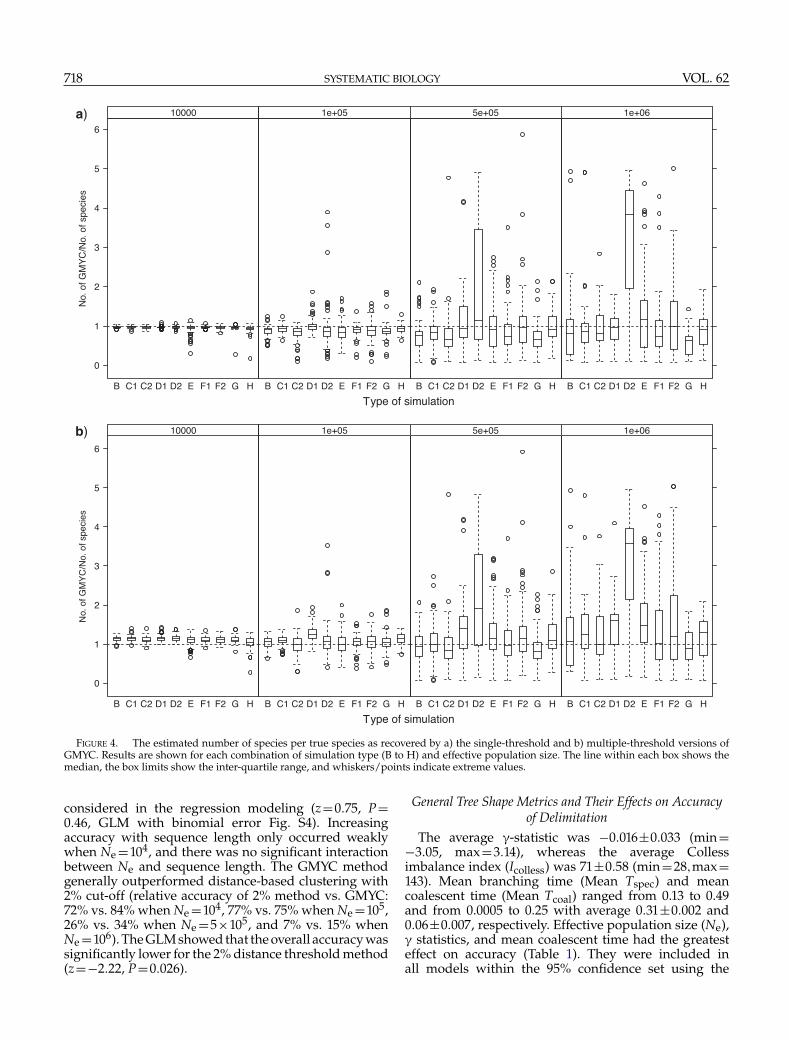
Parameter EstimationThe estimated number of clusters, that is, inferred
species, matched well with real number of speciesfor Ne =104 across all simulations (Fig. 4). Estimatesdeclined and their range increased with increasingpopulation size and the differences among thesimulation types matched those reported for accuracyabove. The discrepancy was largest in simulationD2 because of the spurious clusters within speciesdiscussed above. The multiple-threshold method tendedto overestimate the number of clusters marginallycompared to the single-threshold method, even when
Ne was small. Variation among the simulation typesmirrored those reported for accuracy above, with higheraccuracy associated with better estimates of the numberof clusters. The tree inference did not affect the numberof estimated clusters even with the amounts of singletonsfor Ne =104 (Fig. 4, H).
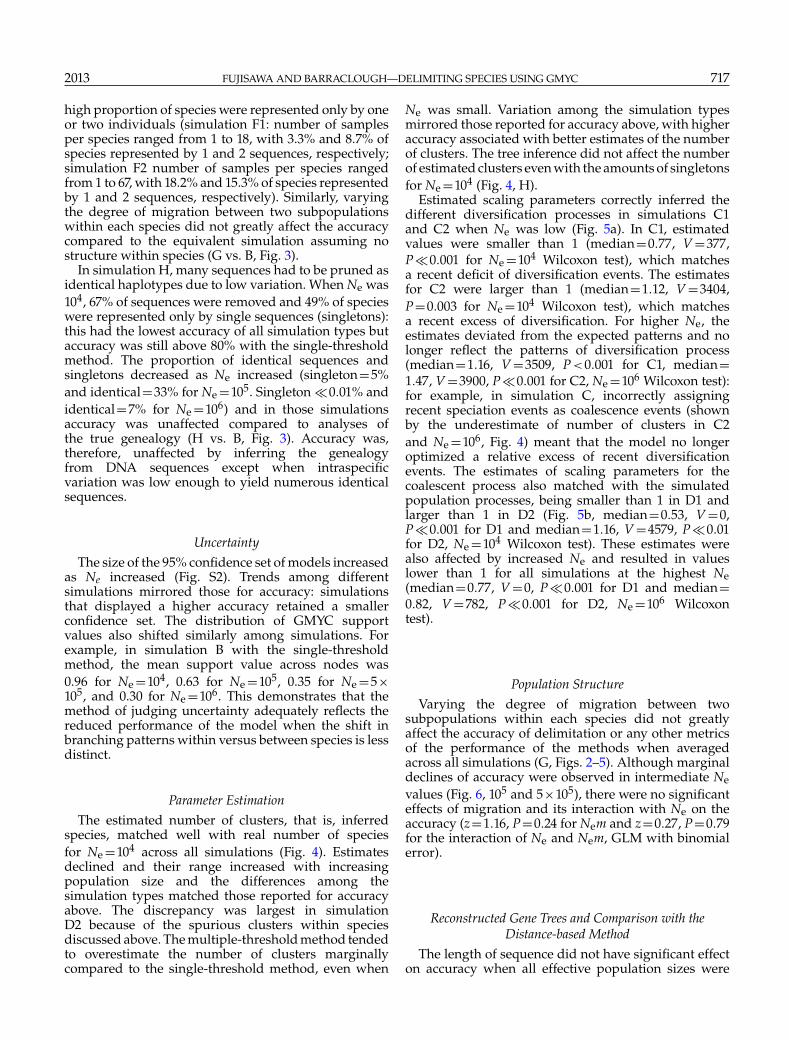
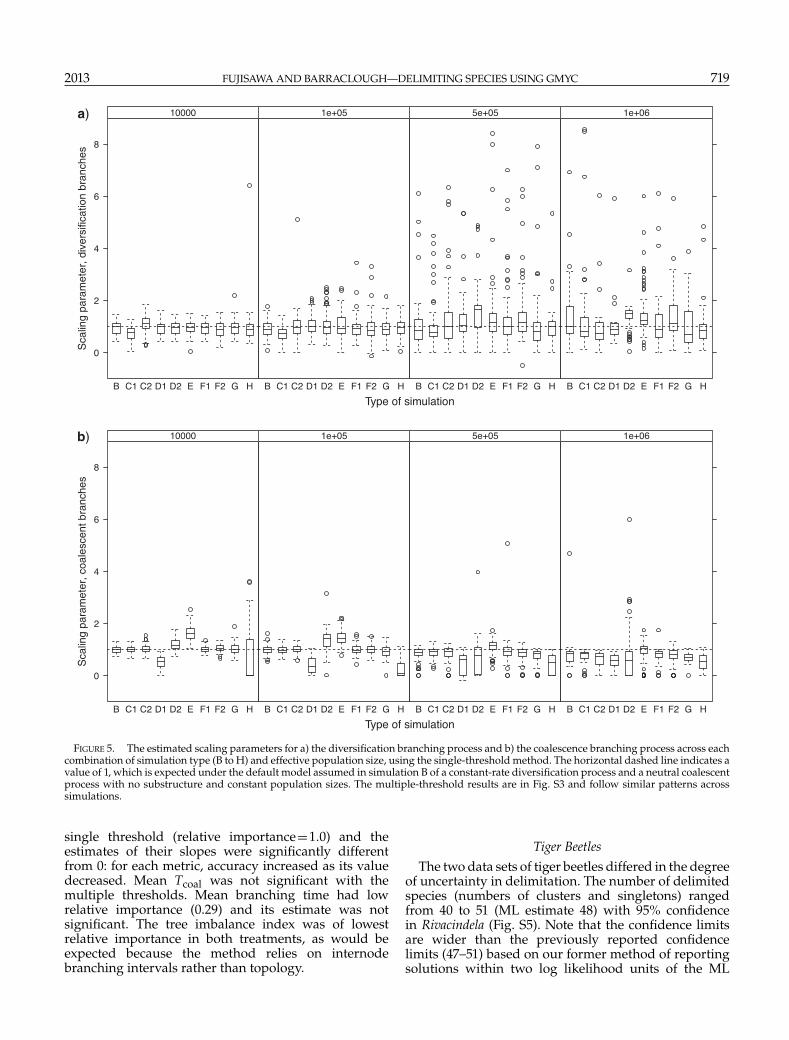
Estimated scaling parameters correctly inferred thedifferent diversification processes in simulations C1and C2 when Ne was low (Fig. 5a). In C1, estimatedvalues were smaller than 1 (median=0.77, V =377,P�0.001 for Ne =104 Wilcoxon test), which matchesa recent deficit of diversification events. The estimatesfor C2 were larger than 1 (median=1.12, V =3404,P=0.003 for Ne =104 Wilcoxon test), which matchesa recent excess of diversification. For higher Ne, theestimates deviated from the expected patterns and nolonger reflect the patterns of diversification process(median=1.16, V =3509, P<0.001 for C1, median=1.47, V =3900, P�0.001 for C2, Ne =106 Wilcoxon test):for example, in simulation C, incorrectly assigningrecent speciation events as coalescence events (shownby the underestimate of number of clusters in C2and Ne =106, Fig. 4) meant that the model no longeroptimized a relative excess of recent diversificationevents. The estimates of scaling parameters for thecoalescent process also matched with the simulatedpopulation processes, being smaller than 1 in D1 andlarger than 1 in D2 (Fig. 5b, median=0.53, V =0,P�0.001 for D1 and median=1.16, V =4579, P�0.01for D2, Ne =104 Wilcoxon test). These estimates werealso affected by increased Ne and resulted in valueslower than 1 for all simulations at the highest Ne(median=0.77, V =0, P�0.001 for D1 and median=0.82, V =782, P�0.001 for D2, Ne =106 Wilcoxontest).
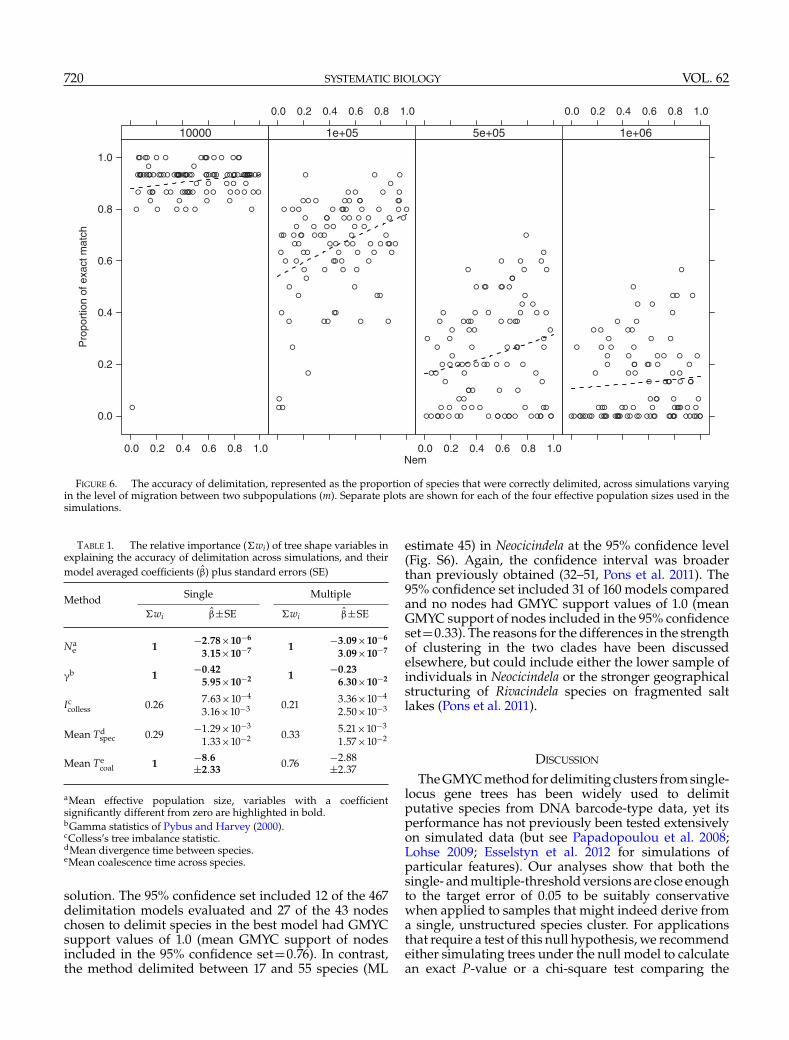
Population StructureVarying the degree of migration between two
subpopulations within each species did not greatlyaffect the accuracy of delimitation or any other metricsof the performance of the methods when averagedacross all simulations (G, Figs. 2–5). Although marginaldeclines of accuracy were observed in intermediate Nevalues (Fig. 6, 105 and 5×10⁵), there were no significanteffects of migration and its interaction with Ne on theaccuracy (z=1.16, P=0.24 for Nem and z=0.27, P=0.79for the interaction of Ne and Nem, GLM with binomialerror).
Reconstructed Gene Trees and Comparison with theDistance-based Method
The length of sequence did not have significant effecton accuracy when all effective population sizes were
[09:56 27/7/2013 Sysbio-syt033.tex] Page: 718 707–724
718 SYSTEMATIC BIOLOGY VOL. 62
a)
b)
FIGURE 4. The estimated number of species per true species as recovered by a) the single-threshold and b) multiple-threshold versions ofGMYC. Results are shown for each combination of simulation type (B to H) and effective population size. The line within each box shows themedian, the box limits show the inter-quartile range, and whiskers/points indicate extreme values.
considered in the regression modeling (z=0.75, P=0.46, GLM with binomial error Fig. S4). Increasingaccuracy with sequence length only occurred weaklywhen Ne =104, and there was no significant interactionbetween Ne and sequence length. The GMYC methodgenerally outperformed distance-based clustering with2% cut-off (relative accuracy of 2% method vs. GMYC:72% vs. 84% when Ne =104, 77% vs. 75% when Ne =105,26% vs. 34% when Ne =5×10⁵, and 7% vs. 15% whenNe =106). The GLM showed that the overall accuracy wassignificantly lower for the 2% distance threshold method(z=−2.22, P=0.026).
General Tree Shape Metrics and Their Effects on Accuracyof Delimitation
The average �-statistic was −0.016±0.033 (min=−3.05, max=3.14), whereas the average Collessimbalance index (Icolless) was 71±0.58 (min=28,max=143). Mean branching time (Mean Tspec) and meancoalescent time (Mean Tcoal) ranged from 0.13 to 0.49and from 0.0005 to 0.25 with average 0.31±0.002 and0.06±0.007, respectively. Effective population size (Ne),� statistics, and mean coalescent time had the greatesteffect on accuracy (Table 1). They were included inall models within the 95% confidence set using the
[09:56 27/7/2013 Sysbio-syt033.tex] Page: 719 707–724
2013 FUJISAWA AND BARRACLOUGH—DELIMITING SPECIES USING GMYC 719
a)
b)
Sca
ling
para
met
er, d
iver
sific
atio
n br
anch
esS
calin
g pa
ram
eter
, coa
lesc
ent b
ranc
hes
FIGURE 5. The estimated scaling parameters for a) the diversification branching process and b) the coalescence branching process across eachcombination of simulation type (B to H) and effective population size, using the single-threshold method. The horizontal dashed line indicates avalue of 1, which is expected under the default model assumed in simulation B of a constant-rate diversification process and a neutral coalescentprocess with no substructure and constant population sizes. The multiple-threshold results are in Fig. S3 and follow similar patterns acrosssimulations.
single threshold (relative importance=1.0) and theestimates of their slopes were significantly differentfrom 0: for each metric, accuracy increased as its valuedecreased. Mean Tcoal was not significant with themultiple thresholds. Mean branching time had lowrelative importance (0.29) and its estimate was notsignificant. The tree imbalance index was of lowestrelative importance in both treatments, as would beexpected because the method relies on internodebranching intervals rather than topology.
Tiger BeetlesThe two data sets of tiger beetles differed in the degree
of uncertainty in delimitation. The number of delimitedspecies (numbers of clusters and singletons) rangedfrom 40 to 51 (ML estimate 48) with 95% confidencein Rivacindela (Fig. S5). Note that the confidence limitsare wider than the previously reported confidencelimits (47–51) based on our former method of reportingsolutions within two log likelihood units of the ML
[09:56 27/7/2013 Sysbio-syt033.tex] Page: 720 707–724
720 SYSTEMATIC BIOLOGY VOL. 62
Nem
Pro
port
ion
of e
xact
mat
ch
0.0
0.2
0.4
0.6
0.8
1.0
0.0 0.2 0.4 0.6 0.8 1.0
●
●
●
●
●●●
●
● ●
●
● ●
●
●
●
●
●
●
● ●● ● ●●
●
●
●
● ●●
●
●●
●
●
●● ●
●
●
●
●
●
●
●
●
● ●
●
●
●
●
●
●
●●
●
●
●
●●
●
●
●
● ●
● ●
●
●
●●
●
●
●
●
●
●
●
●
●
●
●
●
●
●
●●
●●
●
●
●
● ●
●
● ●●
10000
0.0 0.2 0.4 0.6 0.8 1.0
●
●●
●
●
●
●
●
●
●
●
●
●
●
●
● ●
●
●
●●
●
●●
●
●
●
●
●
●
● ●
●
●
●
●
●
●
●
●●
●
●
●
●
●
●
●
●
●
●
●
●
●
●
●
●
●
●
●
●
●
●
●
●
●
●
●
●
●
●
●
●
●
●
●
●
●●
●
●
●
●●
●
●
●
●
●
●
●
●
●
●
●
●
●
●
●
●
1e+05
0.0 0.2 0.4 0.6 0.8 1.0
●
●
●
●
●
●
●
●
●
●
●
●
●
●
●
●
● ●
●
●
●
●
●
●
●
●
●
●
●
●
●
●
●
●
● ●
●
●
●
●
●
●
●
●●
●
●●●
●
●
●
●●
●
●
●
●
●
●
●
●
●
●
●
●
●
●
●
●
●
●
●
●
●
●
●●
●
●
●
●● ●
●
●
●
●
●
●
● ●●
●
●
●
●
●
●
●
5e+05
0.0 0.2 0.4 0.6 0.8 1.0
●
●
●
●
●
●
●
●
●
●
●
●
●
● ●●
●
●
●
●●
●
●
●
●
●
●
●
●
●
●
●
●
●
●
●
● ●
●
●
●
●
●
●
●
●● ●
●
●
●
● ●
●
●
●
●
●
●
●
●
●
●
● ●●
●
●
●
●
●
●
●
●
●
●
●
● ● ● ●●
●
●
●
●
●
●
●
●
●● ●
●
●
●
●●
●
●
1e+06
FIGURE 6. The accuracy of delimitation, represented as the proportion of species that were correctly delimited, across simulations varyingin the level of migration between two subpopulations (m). Separate plots are shown for each of the four effective population sizes used in thesimulations.
TABLE 1. The relative importance (�wi) of tree shape variables inexplaining the accuracy of delimitation across simulations, and theirmodel averaged coefficients (�̂) plus standard errors (SE)
Method Single Multiple
�wi �̂±SE �wi �̂±SE
Nae 1 −2.78×10⁻⁶
1 −3.09×10⁻⁶
3.15×10⁻⁷ 3.09×10⁻⁷
�b 1 −0.42 1 −0.235.95×10−2 6.30×10⁻²
Iccolless 0.26 7.63×10⁻⁴
0.21 3.36×10⁻⁴
3.16×10⁻³ 2.50×10⁻³
Mean Tdspec 0.29 −1.29×10⁻³
0.33 5.21×10⁻³
1.33×10⁻² 1.57×10⁻²
Mean Tecoal 1 −8.6 0.76 −2.88
±2.33 ±2.37
aMean effective population size, variables with a coefficientsignificantly different from zero are highlighted in bold.bGamma statistics of Pybus and Harvey (2000).cColless’s tree imbalance statistic.dMean divergence time between species.eMean coalescence time across species.
solution. The 95% confidence set included 12 of the 467delimitation models evaluated and 27 of the 43 nodeschosen to delimit species in the best model had GMYCsupport values of 1.0 (mean GMYC support of nodesincluded in the 95% confidence set=0.76). In contrast,the method delimited between 17 and 55 species (ML
estimate 45) in Neocicindela at the 95% confidence level(Fig. S6). Again, the confidence interval was broaderthan previously obtained (32–51, Pons et al. 2011). The95% confidence set included 31 of 160 models comparedand no nodes had GMYC support values of 1.0 (meanGMYC support of nodes included in the 95% confidenceset=0.33). The reasons for the differences in the strengthof clustering in the two clades have been discussedelsewhere, but could include either the lower sample ofindividuals in Neocicindela or the stronger geographicalstructuring of Rivacindela species on fragmented saltlakes (Pons et al. 2011).
DISCUSSION
The GMYC method for delimiting clusters from single-locus gene trees has been widely used to delimitputative species from DNA barcode-type data, yet itsperformance has not previously been tested extensivelyon simulated data (but see Papadopoulou et al. 2008;Lohse 2009; Esselstyn et al. 2012 for simulations ofparticular features). Our analyses show that both thesingle- and multiple-threshold versions are close enoughto the target error of 0.05 to be suitably conservativewhen applied to samples that might indeed derive froma single, unstructured species cluster. For applicationsthat require a test of this null hypothesis, we recommendeither simulating trees under the null model to calculatean exact P-value or a chi-square test comparing the
[09:56 27/7/2013 Sysbio-syt033.tex] Page: 721 707–724
2013 FUJISAWA AND BARRACLOUGH—DELIMITING SPECIES USING GMYC 721
single-threshold GMYC model to the null model for aconservative P-value.
Our simulations also confirm previous intuitionabout the key parameters determining the power andaccuracy of GMYC. When effective population sizeswere low relative to species divergence times, thenspecies were monophyletic and the method delimitedclusters accurately, irrespective of detailed assumptionsconcerning the diversification and population processes.As the mean or variance in effective population sizeincreased, then the accuracy of delimitation declined.In the extreme case, species were no longer reciprocallymonophyletic and therefore could not be accuratelydelimited by the method (which assumes reciprocalmonophyly). These results match with the findings ofEsselstyn et al. (2012) who compared species richnessestimates for trees simulated with different ratios of Neto speciation rate.
Accuracy varied among the different simulationsmostly in accordance with predicted patterns basedon the effects of particular processes. The scalingparameters did accurately represent the diversificationand coalescent processes in the simulations whenpopulation sizes were low. Nonetheless, incorporatingmore realistic macroevolutionary models might improvethe performance with real data. For example, empiricalstudies have reported that the background extinctionrate can be around 90% of speciation rate (Ricklefs2007; Etienne et al. 2012). This will tend to blur thesharpness of transition from interspecific to intraspecificbranching, and therefore to reduce the accuracy ofthe GMYC method. Although the scaling parameterwas able to fit this trend in apparent diversificationrate, more accurate delimitation might be obtained byincorporating extinction explicitly in the model. A finalassumption concerning the diversification part of themodel is that diversification rates are uniform across allclades. Again, models allowing for this departure couldbe implemented (Morlon et al. 2011).
The performance of the method also depends onsampling in several ways. Increased sampling ofindividuals per species will increase performance. Here,we only simulated a sample of five individuals perspecies, to reflect the likely limited sampling withinspecies for broad biodiversity surveys. Increasing thatnumber might increase the apparent branching ratewithin clusters and, hence, the ability of the methodto detect a threshold in branching rates (see Reid andCarstens 2012). For example, in the tiger beetle studies,the mean number of individuals per delimited specieswas 9.75 (min=1,max=63, 10% and 13% of clustersrepresented by 1 and 2 sequences, respectively) forRivacindela, in which high support values were obtained,but only 3.58 (min=1,max=21, 51% and 9% of clustersrepresented by 1 and 2 sequences, respectively) forNeocicindela, in which GMYC support was much lower.Conversely, increased sampling of species within a clade(but holding the number of individuals sampled perspecies constant) might reduce the ability to delimitspecies included in the sample. This occurs because
random omission of species reduces the probability thateach species’ closest related species will be sampled, andhence reduces the chance of finding nonmonophyleticspecies. This result has been shown empirically forincreasing spatial scales of sampling in European waterbeetles (Bergsten et al. 2012). The effects of numbersof individuals per species versus number of speciessampled on the accuracy of the method are beinginvestigated by simulation elsewhere: GMYC can workaccurately with as few as 3 species, but it is more robustwith more than 10 species (Ahrens D., Krammer H.J.,Fujisawa T., Fabrizi S., Vogler A.P., unpublished data).
Finally, although random sampling across the cladeversus random sampling within each species mightbe expected to affect the method, our results showedthat the effect was small relative to the effects of Ne(compare B and F2 in Fig. 3). The proportion of speciesrepresented by only one or two sequences in thesesimulations (12% in F1 and 33.5% in F2) reflects realisticlevels of rarity in many biodiversity surveys (Lim et al.2011). This result means that the method is likely tobe little affected by whether samples are taken evenlybased on prior inferences on species limits (as in manyDNA barcoding studies of multicellular eukaryotes) orwithout such knowledge (as in studies of unculturablebacteria or eukaryotes from environmental samples).Our simulation code is available in the Supplementarymaterial for users wishing to investigate possible effectsof their own sampling design.
We found that relaxing the constraint of the singlethreshold does not lead to increased performance ofthe method. The multiple-threshold version yields fairlysimilar results to the single-threshold version, butwith a tendency to over-split. Where this happens,the node recovered by the single-threshold version isnormally still included in the 95% confidence set ofMRCA nodes, but with reduced confidence. While itis possible that future work could describe a multiple-threshold algorithm that could improve delimitation,for example, more exhaustive searching using BayesianMarkov Chain Monte Carlo (Reid and Carstens 2012),we believe instead that this might reflect a fundamentallimitation to the potential for the method. Imagine anextreme case in which each species had a different timeto MRCA and rate of branching within clusters. In thiscase, there would be no average signal across the treefrom which to reconstruct the shift in branching process.It is only when the shifts do coincide at a particular levelin the tree that we are able to find statistical evidence forclustering. Our results do not rule out that the multiple-threshold version might yield improved results in somecases (which would be signified by the exclusion of anMRCA node detected from the single-threshold version).We recommend therefore that the multiple-thresholdversion be used, with caution, as a way to explore howdelimitation changes when the assumptions of the singlethreshold are relaxed.
The GMYC model has previously been criticized forassuming that species comprise a single, unstructuredpopulation. Geographical structure is a common feature

[09:56 27/7/2013 Sysbio-syt033.tex] Page: 722 707–724
722 SYSTEMATIC BIOLOGY VOL. 62
of many real species and, combined with nonrandomsampling of species ranges, this could introducebiases into species delimitation. Previous simulationsto investigate this problem concerned the ability ofGMYC to delimit clusters along a continuum froma single population to a population structured intosubpopulations with no gene flow (e.g., Papadopoulouet al. 2008, 2009; Lohse 2009). In such cases, it wasshown that GMYC could delimit partially isolatedpopulations as separate species, especially if linkingpopulations were not sampled. More pertinent for mostreal applications of GMYC, however, is to consider howgeographic structure within each species affects theability of GMYC to delimit species across a wider cladecomprising multiple distinct species. Our simulationshere show that, as long as the conditions for accuratedelimitation of species are met (i.e., low effectivepopulation size relative to species divergences), thenfurther geographic structuring within species does notgreatly affect the accuracy of the method: because ofthe low variation within each species, the threshold wasoptimized at the correct level of the tree.
The GMYC method requires identical sequences tobe removed beforehand because zero length terminalbranches hampers the likelihood estimation; that is,the Moran estimator of � cannot be properly evaluateddue to zero total branch length within clusters. Thiscan be particularly problematic when subject genetrees are reconstructed from slowly evolving markers,which leads to reduced total sample size and variationwithin species. However, the simulation studies showedthat the method is tolerant to moderate amount ofidentical sequences and singletons, delimiting themby correctly assigning them speciation branching. Theaccuracy on reconstructed gene trees—simulated for arate of variability and range of marker lengths typicalof mtDNA and other single-locus studies—was alsocomparable to the results using the true genealogy. Inaddition, the GMYC generally performed better thanthe 2% cut-off clustering, indicating the advantage ofvarying the boundary of species over the fixed cut-offvalue, although accuracy was equivalent when Ne =105.The relative performance of these methods will dependon typical levels of Ne and variation in substitution rates:in a recent survey of animal taxa, GMYC and use of a 3%threshold yielded similar results (Tang et al. 2012).
One clear limitation of GMYC is that it assumesspecies are monophyletic. This assumption is violated forreal species when divergence time was insufficient forentities to gain monophyly (Hudson and Coyne 2002).The decline of the matches between true entities andestimated clusters reflects this violation. According totheoretical studies, the time for reciprocal monophyly ofa neutral marker to arise with 95% probability betweena pair of species is 8.7 Ne for a single nuclear marker and2.2 Ne for mtDNA (Hudson and Coyne 2002). The rangeof nonmonophyly of species in our simulation studieswere between 0% and 87% (median 20%), which coveredwell the rate of 23% reported from a meta-analysis ofpopulation genetic studies (Funk and Omland 2003). The
proportion of non-monophyletic species was stronglycorrelated with the accuracy of delimitation (Fig. S7).The predicted accuracy on 20% of non-monophyly wasaround 50% of exact matches.
Signatures of recent speciation events, therefore,cannot be detected with the method (or any othermethod using monophyly of single genes), although 50%of accuracy could be still useful in the rapid assessmentof species diversity. This limitation can be addressedwith multilocus analyses, which permit delimitationof more recently diverged sister species (Knowlesand Carstens 2007). However, the methods currentlyrequire prior hypotheses of species populations andwould be computationally intensive for large samplesizes. A key challenge for multilocus approaches isto find efficient algorithms for searching alternativedelimitations (Yang and Rannala 2010). Note that GMYCcan be used to delimit clusters from any ultrametrictrees, including those derived from concatenatedmultilocus data: although it will be less powerfulthan multilocus methods in sexual organisms (Knowlesand Carstens 2007), perhaps it could be used to findstarting delimitations for evaluation with multilocusapproaches.
CONCLUSIONS
The GMYC method was devised originally as amethod for delimiting species from single-locus genetrees in the absence of any additional information. Itdoes so by detecting genetic clustering beyond levelsexpected in a null model that all sampled individualsbelong to a single interacting population. In groupsin which effective population sizes tend to be lowand divergence times between species tend to behigh, then the method is accurate and conservative.In many eukaryotes and prokaryotes, there are strongpatterns of genetic clustering apparent in gene trees forclades or environmental samples, indicating that theconditions for GMYC are often met. Wherever additionalinformation is available, such as the sampling localityof individuals, quantitative or qualitative informationon phenotypic traits, or additional gene sequences,then this information should be used to cross-checkthe entities delimited by GMYC. In larger eukaryotes,such information is usually available, and the utilityof GMYC comes from providing an objective means todelimit genetic clusters for comparison with other data.Efforts should be made to sample individuals across arepresentative range occupied by the species and to keepin mind potential limits of the accuracy of the methoddiscussed above. The task that GMYC is most wellsuited to is delimiting units of diversity when only DNAsequence data are available, such as in environmentalDNA surveys. There it provides an evolutionaryframework to complement existing pragmatic methodsbased on empirically based thresholds.

[09:56 27/7/2013 Sysbio-syt033.tex] Page: 723 707–724
2013 FUJISAWA AND BARRACLOUGH—DELIMITING SPECIES USING GMYC 723
SUPPLEMENTARY MATERIAL
Data files and/or other supplementary informationrelated to this paper have been deposited at Dryad underdoi: 10.5061/dryad.0hv88.
FUNDING
T.G.B.’s time was supported by the Biotechnologyand Biological Sciences Research council (BBSRC) grant[BB/G004250/1].
ACKNOWLEDGEMENTS
We thank Michael Monaghan, Johannes Bergsten,Sean Nee, and Alfried Vogler for discussing ideas inthis manuscript, Ziheng Yang for discussions leading tothe reinterpretation of the threshold parameter, KevinBalbi for running some of the simulations, Tom Ezardfor preparing the R package splits, and Richard Glor andfour anonymous reviewers for comments.
REFERENCES
Acinas S.G., Klepac-Ceraj V., Hunt D.E., Pharino C., Ceraj I., Distel D.L.,Polz M.F. 2004. Fine-scale phylogenetic architecture of a complexbacterial community. Nature 430:551–554.
Agapow P.-M., Purvis A. 2002. Power of eight tree shape statistics todetect non-random diversification: a comparison by simulation oftwo models of cladogenesis. Syst. Biol. 51:866–872.
Avise J.C. 2009. Phylogeography: retrospect and prospect. J. Biogeog.36:3–15.
Barraclough T.G., Birky C.W. Jr., Burt A. 2003. Diversification in sexualand asexual organisms. Evolution 57:2166–2172.
Barraclough T.G., Herniou E. 2003. Why do species exist? Insights fromsexuals and asexuals. Zoology 106:275–282.
Barraclough T.G., Hughes M., Ashford-Hodges N., Fujisawa T. 2009.Inferring evolutionarily significant units of bacterial diversity frombroad environmental surveys of single-locus data. Biol. Lett. 5:425–428.
Barraclough T.G., Nee S. 2001. Phylogenetics and speciation. TrendsEcol. Evol. 16:391–399.
Barraclough T.G., Vogler A.P. 2002. Recent diversification rates in NorthAmerican tiger beetles estimated from a dated mtDNA phylogenetictree. Mol. Biol. Evol. 19:1706–1716.
Bergsten J., Bilton D.T., Fujisawa T., Elliot M., Monaghan M.T., Balke M.,Hendrich L., Geijer J., Herrmann J., Foster G.N., Ribera I., NilssonA.N., Barraclough T.G., Vogler A.P. 2012. The effect of geographicalscale of sampling on DNA barcoding. Syst. Biol. 61:851–869.
Birky C.W. Jr., Adams J., Gemmel M., Perry J. 2010. Using populationgenetic theory and dna sequences for species detection andidentification in asexual organisms. Plos One 5:e10609.
Bortolussi N., Durand E., Blum M., Francois O. 2006. apTreeshape:statistical analysis of phylogenetic tree shape. Bioinformatics22:363–364.
Brito P., Edwards S.V. 2009. Multilocus phylogeography andphylogenetics using sequence-based markers. Genetica 135:439–455.
Brower A.V.Z. 1994. Rapid morphological radiation and convergenceamong races of the butterfly Heliconius erato inferred from patternsof mitochondrial-DNA evolution. Proc. Natl. Acad. Sci. USA91:6491–6495.
Burnham K.P., Anderson D.R. 2002. Model selection and multimodelinference: a practical information-theoritic approach. New York:Springer Science+Business Media, Inc.
Camargo A., Avila L.J., Morando M., Sites J.W. Jr. 2012. Accuracyand precision of species trees: effects of locus, individual, and
base pair sampling on inference of species trees in lizards of theLiolaemus darwinii group (Squamata, Liolaemidae). Syst. Biol. 61:272–288.
Carstens B.C., Dewey T.A. 2010. Species delimitation using a combinedcoalescent and information-theoretic approach: an example fromnorth american Myotis bats. Syst. Biol. 59:400–414.
CBOL Plant Working Group. 2009. A DNA barcode for land plantsProc. Natl. Acad. Sci. USA 106:12794–12797.
Charlesworth B. 2009. Effective population size and patterns ofmolecular evolution and variation. Nat. Rev. Genet. 10:195–205.
Charlesworth B., Charlesworth D., Barton N.H. 2003. The effects ofgenetic and geographic structure on neutral variation. Ann. Rev.Ecol. Evol. Syst. 34:99–125.
Cox D.R., Miller H.D. 1965. The theory of stochastic processes. London:Chapman & Hall.
Coyne J.A., Orr H.A. 1998. The evolutionary genetics of speciation. Phil.Trans. R. Soc. Lond. B 353:287–305.
Coyne J.A., Orr H.A. 2004. Speciation. Sunderland (MA): SinauerAssociates. Inc.
Davis J.I., Nixon K.C. 1992. Populations, genetic variation, and thedelimitation of phylogenetic species. Syst. Biol. 41:421–435.
De Queiroz K. 2007. Species concepts and species delimitation. Syst.Biol. 56:879–886.
Dupuis J.R., Roe A.D., Sperling F.A.H. 2012. Multi-locus speciesdelimitation in closely related animals and fungi: one marker is notenough. Mol. Ecol. 21:4422–4436.
Esselstyn J.A., Evans B.J., Sedlock J.L., Anwarali Khan F.A., HeaneyL.R. 2012. Single-locus species delimitation: a test of the mixedYule-coalescent model, with an empirical application to Philippineround-leaf bats. Proc. R. Soc. Lond. B. 279:3678–3686.
Etienne R.S., Haegeman B., Stadler T., Aze T., Pearson P.N., PurvisA., Phillimore A.B. 2012. Diversity-dependence brings molecularphylogenies closer to agreement with the fossil record. Proc. R. Soc.Lond. B 279:1300–1309.
Ezard T., Fujisawa T., Barraclough T.G. 2009. SPLITS: SPecies’ LImits byThreshold Statistics. R package version 1.0-18/r45. Available from:URL http://R-Forge.R-project.org/projects/splits/, last accessedJune 2013.
Feulner P.G.D., Kirschbaum F., Mamonekene V., Ketmaier V.,Tiedemann R. 2007. Adaptive radiation in African weaklyelectric fish (Teleostei: Mormyridae: Campylomormyrus): a combinedmolecular and morphological approach. J. Evol. Biol. 20:403–414.
Fontaneto D., Herniou E.A., Boschetti C., Caprioli M., Melone G., RicciC., Barraclough T.G. 2007. Independently evolving species in asexualbdelloid rotifers. PLoS Biol. 5:e87.
Funk D.J., Omland K.E. 2003. Species-level paraphyly and polyphyly:frequency, causes, and consequences, with insights from animalmitochondrial DNA. Ann. Rev. Ecol. Evol. Syst. 34:397–423.
Green J.L., Plotkin J.B. 2007. A statistical theory for sampling speciesabundances. Ecol. Lett. 10:1037–1045.
Hailer F., Kutschera V.E., Hallstrom B.M., Klassert D., Fain S.R.,Leonard J.A., Arnason U., Janke A. 2012. Nuclear genomic sequencesreveal that polar bears are an old and distinct bear lineage. Science336:344–347.
Hebert P.D.N., Cywinska A., Ball S.L., DeWaard J.R. 2003. Biologicalidentifications through DNA barcodes. Proc. R. Soc. Lond. B270:313–321.
Hey J. 1991. The structure of genealogies and the distribution offixed differences between DNA-sequence samples from natural-populations. Genetics 128:831–840.
Hey J. 1992. Using phylogenetic trees to study speciation andextinction. Evolution 46:627–640.
Hey J. 2001. The mind of the species problem. Trends Ecol. Evol. 16:326–329.
Hudson R.R. 1990. Gene genealogies and coalescent process. In:Futuyma D.J., Antonivics J., editors. Oxford Surveys in EvolutionaryBiology. Oxford: Oxford University Press. p. 1–44.
Hudson R.R. 2002. Generating samples under a Wright-Fisher neutralmodel of genetic variation. Bioinformatics 18:337–338.
Hudson R.R., Coyne J.A. 2002. Mathematical consequences of thegenealogical species concept. Evolution 56:1557–1565.
Knowles L.L., Carstens B.C. 2007. Delimiting species withoutmonophyletic gene trees. Syst. Biol. 56:887–895.

[09:56 27/7/2013 Sysbio-syt033.tex] Page: 724 707–724
724 SYSTEMATIC BIOLOGY VOL. 62
Koufopanou V., Burt A., Taylor J.W. 1997. Concordance of genegenealogies reveals reproductive isolation in the pathogenicfungus Coccidioides immitis. Proc. Natl. Acad. Sci. USA 94:5478–5482.
Kubo T., Iwasa Y. 1995. Inferring the rates of branching and extinctionfrom molecular phylogenies. Evolution 49:694–704.
Lahaye R., van Der Bank M., Bogarin D., Warner J., Pupulin F., Gigot G.,Maurin O., Duthoit S., Barraclough T.G., Savolainen V. 2008. DNAbarcoding the floras of biodiversity hotspots. Proc. Natl. Acad. Sci.USA 105:2923–2928.
Leaché A.D., Koo M.S., Spencer C.L., Papenfuss T.J., Fisher R.N.,McGuire J.A. 2009. Quantifying ecological, morphological, andgenetic variation to delimit species in the coast horned lizardspecies complex (Phrynosoma). Proc. Natl. Acad. Sci. USA 106:12418–12423.
Lim G.S., Balke M., Meier R. 2011. Determining species boundaries ina world full of rarity: sngletons, species delimitation methods. Syst.Biol. 61:165–169.
Lohse K. 2009. Can mtDNA barcodes be used to delimit species? Aresponse to Pons et al. (2006). Syst. Biol. 58:439–442.
Luo A., Zhang A., Ho S.Y., Xu W., Zhang Y, Shi W., Cameron S.L., ZhuC. 2011. Potential efficacy of mitochondrial genes for animal DNAbarcoding: a case study using eutherian mammals BMC Genomics12:84.
Meyer C.P., Paulay G. 2005. DNA Barcoding: error rates based oncomprehensive sampling. PLoS Biol. 3:e422.
Monaghan M.T., Wild R., Elliot M., Fujisawa T., Balke M., InwardD.J.G., Lees D.C., Ranaivosolo R., Eggleton P., Barraclough T.G.,Vogler A.P. 2009. Accelerated species inventory on madagascarusing coalescent-based models of species delineation. Syst. Biol. 58:298–311.
Morlon H., Parsons T.L., Plotkin J.B. 2011. Reconciling molecularphylogenies with the fossil record. Proc. Natl. Acad. Sci. USA108:16327–16332.
Nee S. 2001. Inferring speciation rates from phylogenies. Evolution55:661–668.
Nee S., May R.M., Harvey P.H. 1994. The reconstructed evolutionaryprocess. Phil. Trans. R. Soc. Lond. B 344:305–311.
O’Meara B.C. 2010. New heuristic methods for joint speciesdelimitation and species tree inference. Syst. Biol. 59:59–73.
Papadopoulou A., Bergsten J., Fujisawa T., Monaghan M.T.,Barraclough T.G., Vogler A.P. 2008. Speciation and DNA barcodes:testing the effects of dispersal on the formation of discrete sequenceclusters. Phil. Trans. R. Soc. Lond. B 363:2987–2996.
Papadopoulou A., Monaghan M.T., Barraclough T.G., Vogler A.P. 2009.Sampling error does not invalidate the Yule-coalescent model forspecies delimitation. A response to Lohse (2009). Syst. Biol. 58:442–444.
Paradis E., Claude J., Strimmer K. 2004. APE: Analyses of Phylogeneticsand Evolution in R language. Bioinformatics 20:289–290.
Phillimore A.B., Price T.D. 2008. Density-dependent cladogenesis inbirds. PLoS Biol. 6:e71.
Pons J., Barraclough T.G., Gomez-Zurita J., Cardoso A., Duran D.P.,Hazell S., Kamoun S., Sumlin W.D., Vogler A.P. 2006. Sequence-based species delimitation for the DNA taxonomy of undescribedinsects. Syst. Biol. 55:595–609.
Pons J., Fujisawa T., Claridge E.M., Savill R.A., Barraclough T.G., VoglerA.P. 2011. Deep mtDNA subdivision within Linnean species inan endemic radiation of tiger beetles from New Zealand (genusNeocicindela). Mol. Phyl. Evol. 59:251–262.
Powell J.R. 2012. Accounting for uncertainty in species delineationduring the analysis of environmental DNA sequence data. MethodsEcol. Evol. 3:1–11.
Pybus O.G., Harvey P.H. 2000. Testing macro-evolutionary modelsusing incomplete molecular phylogenies. Proc. R. Soc. Lond. B267:2267–2272.
R Development Core Team. 2010. R: a language and environment forstatistical computing. Vienna (Austria): R Foundation for StatisticalComputing.
Rabosky D.L., Lovette I.J. 2008. Density-dependent diversificationin North American wood warblers. Proc. R. Soc. Lond. B 275:2363–2371.
Rambaut A. 2002. Phylo-O-Gen: Phylogenetic tree simulatorpackage v1.1. Available from: URL http://tree.bio.ed.ac.uk/software/phylogen/, last accessed June 2013.
Rambaut A., Grassly N.C. 1997. Seq-Gen: an application for the MonteCarlo simulation of DNA sequence evolution along phylogenetictrees. CABIOS 13:235–238.
Rannala B., Yang Z. 2003. Bayes estimation of species divergence timesand ancestral population sizes using DNA sequences from multipleloci. Genetics 164:1645–1656.
Reid N.M., Carstens B.C. 2012. Phylogenetic estimation errorcan decrease the accuracy of species delimitation: a Bayesianimplementation of the General Mixed Yule Coalescent model. BMCEvol. Biol. 12:196.
Ricklefs R.E. 2007. Estimating diversification rates from phylogeneticinformation. Trends Ecol. Evol. 22:601–610.
Rosenberg N.A., Nordborg M. 2002. Genealogical trees, coalescenttheory and the analysis of genetic polymorphisms. Nat. Rev. Genet.3:380–390.
Sanderson M.J. 2003. r8s: inferring absolute rates of molecularevolution and divergence times in the absence of a molecular clock.Bioinformatics 19:301–302.
Schloss P.D., Handelsman J. 2006. Toward a census of bacteria in soil.PLoS Comp. Biol. 2:786–793.
Shaffer H.B., Thomson R.C. 2007. Delimiting species in recentradiations. Syst. Biol. 56:896–906.
Sites J.W., Marshall J.C. 2003. Delimiting species: a renaissance issuein systematic biology. Trends Ecol. Evol. 18:462–470.
Stamatakis A. 2006. RAxML-VI-HPC: maximum likelihood-basedphylogenetic analyses with thousands of taxa and mixed models.Bioinformatics 22:2688–2690.
Tang C.Q., Leasi F., Obertegger U., Kieneke A., Barraclough T.G.,Fontaneto D. 2012. The widely used small subunit 18S rDNAmolecule greatly underestimates true diversity in biodiversitysurveys of the meiofauna. Proc. Natl. Acad. Sci. USA 109:16208–16212.
Templeton A. 1989. The meaning of species and speciation: apopulation genetics approach. In: Otte D., Endler J., editors.Speciation and its consequences. Sunderland (MA): SinauerAssociates.
Templeton A.R. 2001. Using phylogeographic analyses of gene trees totest species status and processes. Mol. Ecol. 10:779–791.
Venter J.C., Remington K., Heidelberg J.F., Halpern A.L., Rusch D.,Eisen J.A., Wu D., Paulsen I., Nelson K.E., Nelson W., Fouts D.E.,Levy S., Knap A.H., Lomas M.W., Nealson K., White O., PetersonJ., Hoffman J., Parsons R., Baden-Tillson H., Pfannkoch C., RogersY.H., Smith H.O. 2004. Environmental genome shotgun sequencingof the Sargasso sea. Science 304:66–74.
Wiens J.J., Penkrot T.A. 2002. Delimiting species using DNA andmorphological variation and discordant species limits in spinylizards (Sceloporus). Syst. Biol. 51:69–91.
Will K.W., Rubinoff D. 2004. Myth of the molecule: DNA barcodesfor species cannot replace morphology for identification andclassification. Cladistics 20:47–55.
Yang Z. 2006. Computational molecular evolution. Oxford: OxfordUniversity Press.
Yang Z., Goldman N., Friday A. 1995. Maximum likelihood trees fromDNA sequences: a peculiar statistical estimation problem. Syst. Biol.44:384–399.
Yang Z., Rannala B. 2010. Bayesian species delimitation usingmultilocus sequence data. Proc. Natl. Acad. Sci. USA 107:9264–9269.