Delighted to inform you that PropIndex completes 2...
23
Transcript of Delighted to inform you that PropIndex completes 2...

Delighted to inform you that PropIndex completes 2 years!!
In its Eighth edition, a relatively flat quarterly MagicBricks PropIndexreflects the market conditions that arise out of weak policy direction and asluggish economy. Any strong trend in any city has been largely due to localdrivers. Clearly housing sentiment follows economic activity. Despite globalslowdown and domestic policy paralysis, the last two quarters have witnessedsome positive policy boosts and consequent response by industry. This hasimpacted consumer sentiment and delivery of housing products. This isreflected in the 3% rise in the National Property Index (NPI), an indicator ofsome optimism in the market. The Reserve Bank of India’s repeated CRR cutsleading to a marginal drop in home loan interest rates and easing of tightmoney market conditions after the risk weightage on real estate was reducedmay be the reasons for this optimism.
Bangalore city has shown the most positive growth trends. This is followed byNoida and Gurgaon and then Mumbai and Kolkata. Delhi, Pune andGhaziabad followed with 3 per cent rise. Chennai, Hyderabad and Ahmedabadhave seen a dip in the city indices. Unnatural drop in stock because projectapprovals are delayed by authorities creates a skew in market which resultsin these blips. Political uncertainty can also result in a drop. Rapidly risingvalues or misreading of consumer preferences also lead to fluctuations.Housing stats are considered the best indicator of the state of the economy indeveloped countries. The Indian market is maturing to reach those levels.PropIndex has become a statistical tool to capture these changing trends.We’ve now got into a partnership with the Indian Institute of Management(Bangalore) and will shortly release the Housing Sentiment Index (HSI) whichwill attempt to capture the mood of the market. Together the PropIndex andthe HSI will be the bell-weather monitor of the country’s housing perspective.
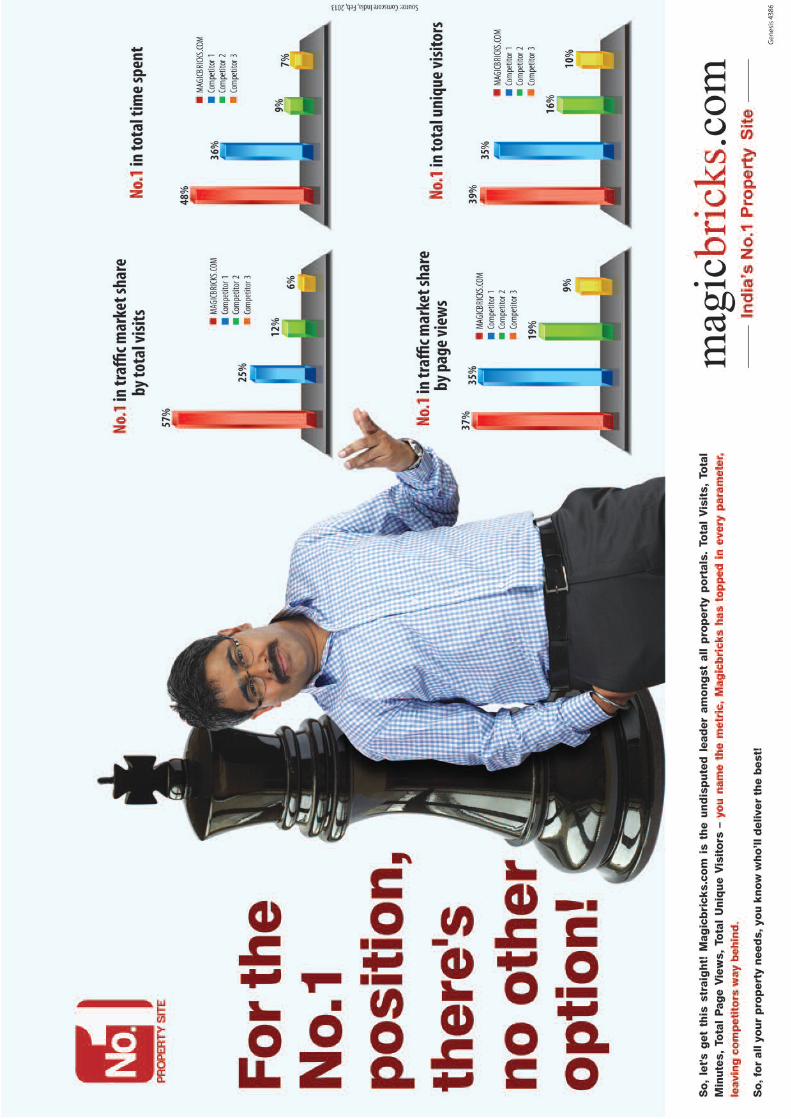
Your support has been very valuable to us. I am happy to share with you thatthe March report of Comscore (which is the leading online media monitor)indicated that MagicBricks is now the dominant No 1 player in Onlineproperty category – the average daily visitors on Magicbricks.com arenow more than the next three competitors added together. Thank you foryour support in making this possible. Do write in with your suggestions onhow you would like the PropIndex to work for you. We will make best effortsto see that your wishes are met to the best of our ability. Do write in!
FOREWORD
Sudhir PaiBusiness Head, [email protected]

MagicBricksPropIndexMagicBricks.comPropIndex is a tool whichempowers propertyseekers and investors withdetailed information onthe movement ofresidential apartmentprices and supply ofproperties in India. Nocredible property indexcan be a function of directvalues as the changes aregoverned by multiplefactors.
MagicBricks.comPropIndex has taken thisreality into account andproduced an index basedon listing of apartmentsand their capital andrental values on thewebsite.
MagicBricks.com has over 500,000 active propertiesposted by more than1,50,000 active users in 300cities and 10,000 localities.Our users include owners,agents and developers.
MethodologyApartment values arebased on listings onMagicBricks.com. Theseinclude multistoreyapartments and singleunits on plotteddevelopments, referred toas builder floors onMagicBricks.com.
The Index is structured in
such a way that individualproperties are aggregatedinto their respective citiesand then to the NationalIndex. Weightages forPropIndex are based on thesupply of propertieswithin the locality/city.Based on this structure,PropIndex gives a realisticpicture of trends inprice/supply acrossdifferent property marketsin each city. We have useddifferent weightages forListed Price Monitor/RentMonitor. Therefore, read asa whole, PropIndex alongwith tables provided forListed Price Monitor, RentMonitor, Yield Monitor andCapital Values, gives anexcellent perspective ofthe property marketperformance in thequarter.
While listing and itsvalues/supply provide alevel of understandinginto the market, there aremeticulous data checks toprevent aberrationscreeping into the Index.These are based onstatistical calculations,industry inputs and logicalinterpretations.
The National PropertyIndex (NPI) is indicative ofthe extent of activity aswell as price movementsacross cities and localitiesin the major cities activeon MagicBricks.com. Theindex includes the top 11
cities (these have beenchosen based on theiractivity levels) and has anindividual city report foreach of these cities. Whilethe NPI and its movementsare of interest to theexpert community ofbankers, builders andinvestors, the PropIndexhas also taken care toexplain the nuances ofindex movements at thelocality level that wouldhelp the huge base ofMagicBricks.comconsumers.
Insights into consumerdemand have beengathered through analysisof search information onthe site. This helpsunderstand the bestlocalities by demand, thetype and configuration ofunits as well as the budget-wise preferences.
The PropIndex is the resultof meticulous research atthe locality level andthrough detaileddiscussions with experts atMagicBricks.com’s offlineand online initiatives.
The Indian real estatemarket is dynamic and thePropIndex reflects thosechanges. Since it is derivedfrom a dynamic database,additions and deletions oflocalities happen as afunction of marketdynamics.
METHODOLOGY
There is a wealth of information within these pages. For better readability, we have presented some data as tablesand others as graphs. Between them, you will find how property markets have performed in the Jan-Mar 2013quarter from many different perspectives – from that of capital appreciation, from a rental/yield realisationperspective and from the stand of supply of properties. Also understand what consumers want in the DemandAnalysis section.
We recommend that you evaluate the city report in its entirety and that will provide a rounded perspective of theperformance of the property market within each city. Here are details of what you will find in each of the cityreports enclosed within -
1. City Property Index – This is a composite index which is a function of supply of properties as well as theaverage capital appreciation/drop in various localities of the city in the quarter. The city index is theweighted average of the average rate per square foot in that locality and the supply of properties from thatlocality. Premium localities (with higher average rate per square foot) as well as localities with higher supplyof properties will have a bigger impact on the Index. For example, if the supply of properties from apremium locality drops, that locality will end up having a lower weightage in the index which in turn willpush the Index downwards (and vice-versa). On the other hand, supply of properties remaining unchanged,the index will be influenced by capital appreciation within the locality.
2. Listed Price Monitor – This metric shows the capital appreciation/drop within a locality and is calculatedon the basis of movement in the “average rate per square foot” within that locality. By and large, themovement in the “average rate per square foot” reflects capital appreciation/ drops. However, in a few selectcases, we have observed that the average rate per square foot moves due to a change in the mix of apartmentswithin that locality (e.g. if the ratio of premium apartments, which command a higher per square foot rate,changes over the quarter). In these few circumstances, the Listed Price Monitor will, in turn, reflect thisinput. Such changes have been explained in the text of the City Reports.
3. Rent Monitor – This reflects the rental appreciation/drop within a locality. It is calculated on the basis ofmovement in the “average rent per square foot” within that locality. By and large, the movement in the“average rent per square foot” reflects rental appreciation/drops. However, in a few selected cases, we haveobserved that the average rent per square foot moves due to a change in the mix of apartments within thatlocality (e.g. if the ratio of premium apartments, which command a higher per square foot rent, changes overthe quarter). In these few circumstances, the Rent Monitor will, in turn, reflect this input. Such changes havebeen explained in the text of the City Reports.
4. Yield Meter – Yield is the annual rate of return earned on property. The Yield Meter depicts the gross yieldpercentages across various localities. Gross yield is a ratio of average annual rental value to the averagecapital value of the property.
5. Capital Value Tables (given in Annexures) – This shows the actual range of prices within which propertieswere available in each locality in the quarter. Prices are shown in Rupees per square foot basis; these are theprevailing rates for properties in each locality.
6. Demand Analysis –This analysis of consumer demand is based on searches and requirements that usershave performed on MagicBricks.com. The top localities by demand gives an insight into consumerpeferences. The demand data has been used to arrive at various aspects of consumer requirements includingBudget-wise analysis, Property type analysis and BHK configuration analysis. This section also provides acomparison between demand and supply in the Oct-Dec, 2012 and Jul-Sept, 2012 quarters.
7. Realty News – Property market performance is also dependent on drivers outside the purview of buyingand selling. There are broadly four key drivers that determine the prospects of real estate – infrastructuresuch as water and power, transport links creating new growth corridors, policy such as rental laws, propertytax, etc and return on investment. From this issue onwards, PropIndex focuses on news bytes that impactfuture prospects of real estate in the city.
GLOSSARY & DEFINITIONS
JAN-MAR 2013
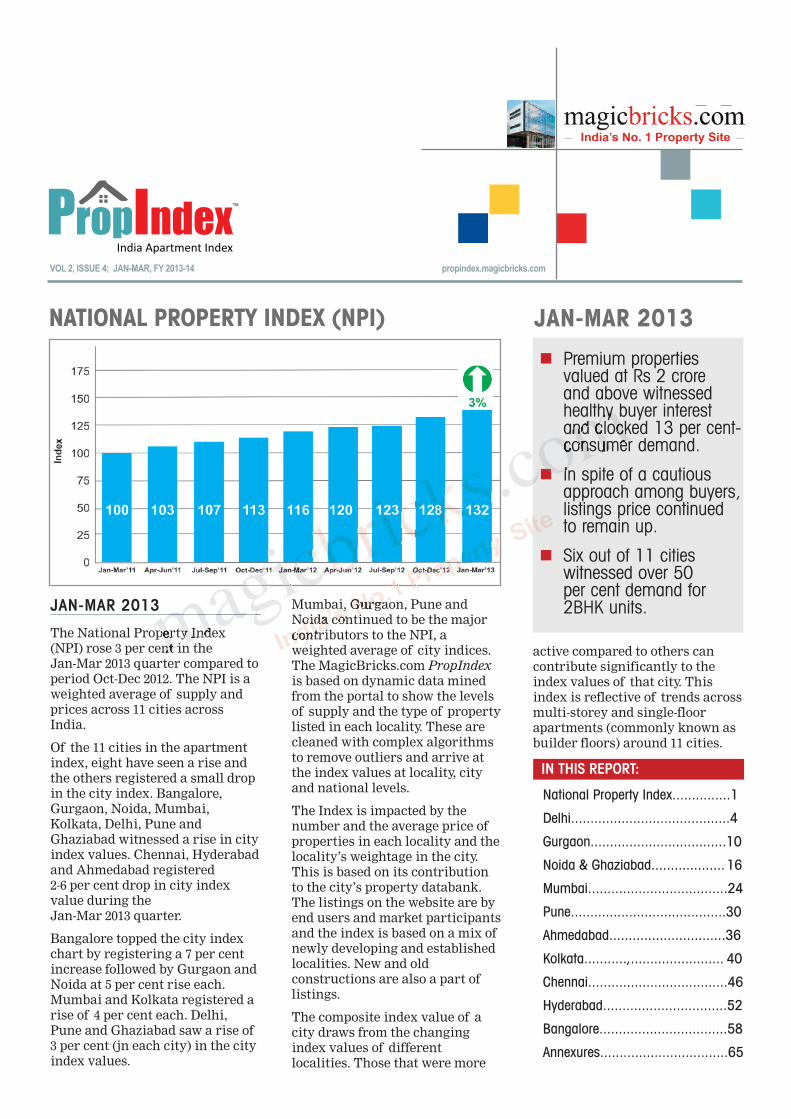
The National Property Index(NPI) rose 3 per cent in the Jan-Mar 2013 quarter compared toperiod Oct-Dec 2012. The NPI is aweighted average of supply andprices across 11 cities acrossIndia.
Of the 11 cities in the apartmentindex, eight have seen a rise andthe others registered a small dropin the city index. Bangalore,Gurgaon, Noida, Mumbai,Kolkata, Delhi, Pune andGhaziabad witnessed a rise in cityindex values. Chennai, Hyderabadand Ahmedabad registered 2-6 per cent drop in city indexvalue during the Jan-Mar 2013 quarter.
Bangalore topped the city indexchart by registering a 7 per centincrease followed by Gurgaon andNoida at 5 per cent rise each.Mumbai and Kolkata registered arise of 4 per cent each. Delhi,Pune and Ghaziabad saw a rise of3 per cent (jn each city) in the city index values.
Mumbai, Gurgaon, Pune andNoida continued to be the majorcontributors to the NPI, aweighted average of city indices.The MagicBricks.com PropIndexis based on dynamic data minedfrom the portal to show the levelsof supply and the type of propertylisted in each locality. These arecleaned with complex algorithmsto remove outliers and arrive atthe index values at locality, cityand national levels.
The Index is impacted by thenumber and the average price ofproperties in each locality and thelocality’s weightage in the city.This is based on its contributionto the city’s property databank.The listings on the website are byend users and market participantsand the index is based on a mix ofnewly developing and establishedlocalities. New and oldconstructions are also a part oflistings.
The composite index value of acity draws from the changingindex values of differentlocalities. Those that were more
active compared to others cancontribute significantly to theindex values of that city. Thisindex is reflective of trends acrossmulti-storey and single-floorapartments (commonly known asbuilder floors) around 11 cities.
n Premium propertiesvalued at Rs 2 crore and above witnessedhealthy buyer interestand clocked 13 per cent-consumer demand.
n In spite of a cautiousapproach among buyers,listings price continuedto remain up.
n Six out of 11 citieswitnessed over 50 per cent demand for 2BHK units.
IN THIS REPORT:
National Property Index...............1
Delhi.........................................4
Gurgaon...................................10
Noida & Ghaziabad................... 16
Mumbai....................................24
Pune........................................30
Ahmedabad..............................36
Kolkata...........,........................ 40
Chennai....................................46
Hyderabad................................52
Bangalore.................................58
Annexures.................................65
NATIONAL PROPERTY INDEX (NPI)
VOL 2, ISSUE 4; JAN-MAR, FY 2013-14
JAN-MAR 2013
propindex.magicbricks.com
2
NATIONAL PROPERTY INDEX
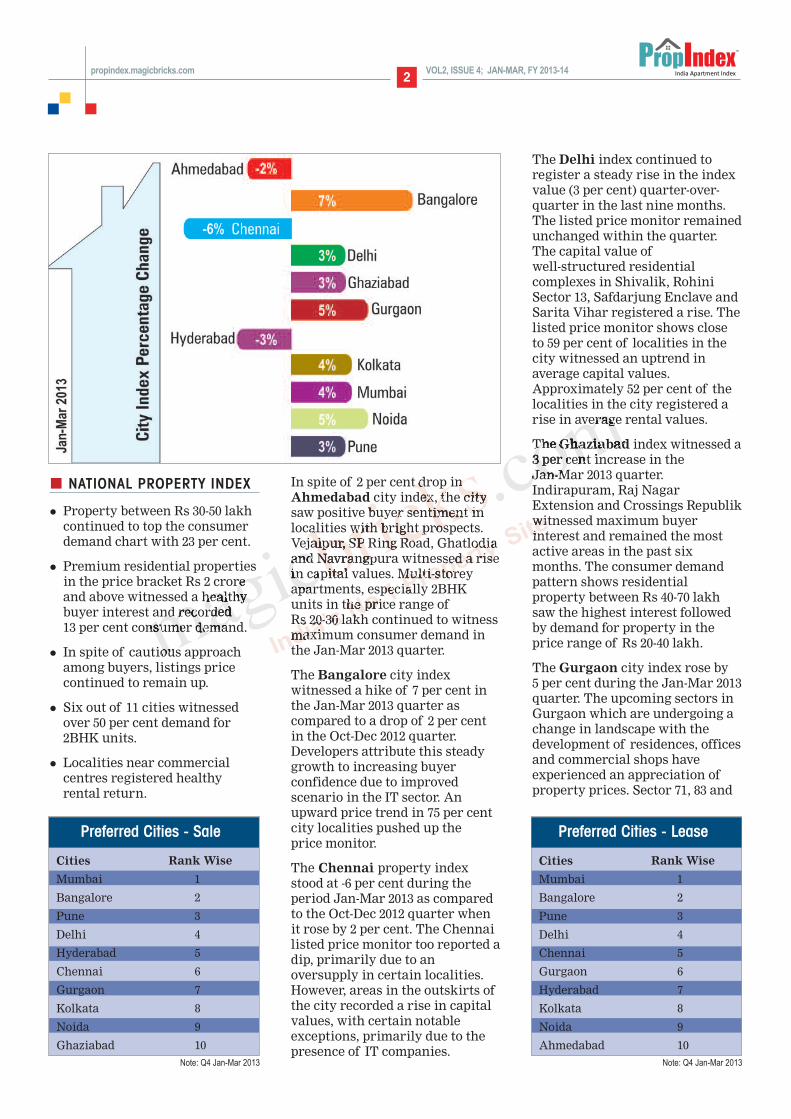
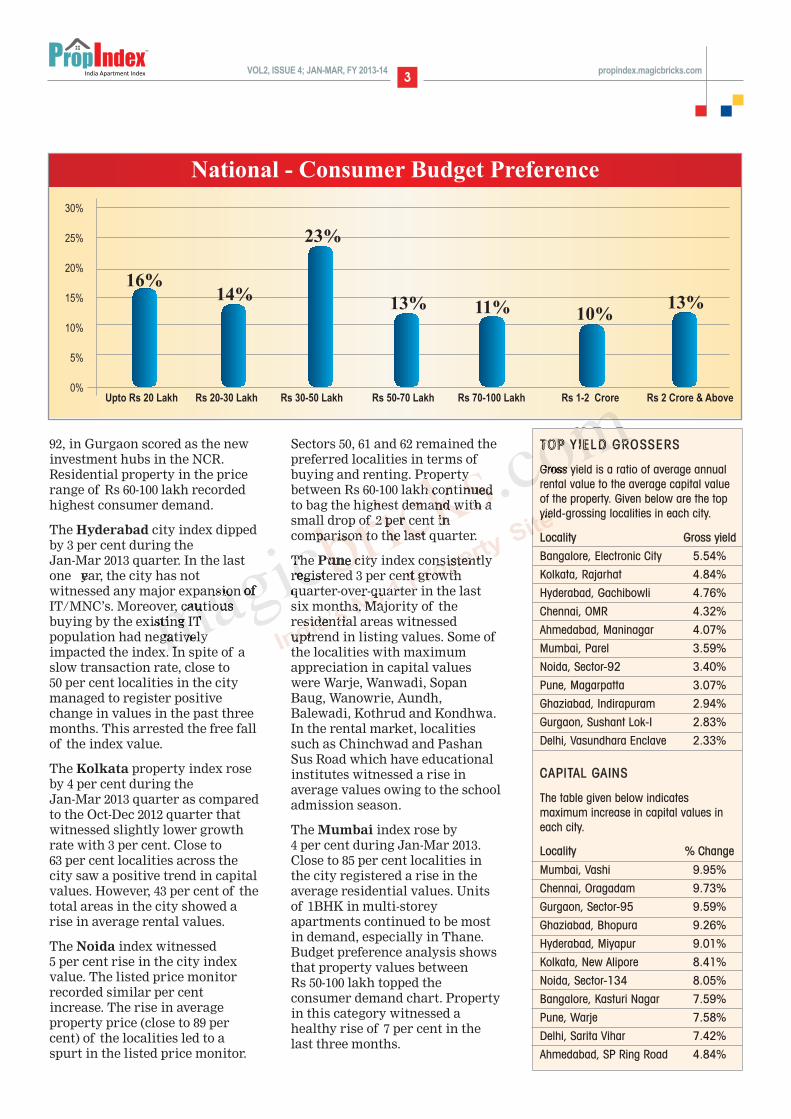
l Property between Rs 30-50 lakhcontinued to top the consumerdemand chart with 23 per cent.
l Premium residential propertiesin the price bracket Rs 2 croreand above witnessed a healthybuyer interest and recorded 13 per cent consumer demand.
l In spite of cautious approachamong buyers, listings pricecontinued to remain up.
l Six out of 11 cities witnessedover 50 per cent demand for 2BHK units.
l Localities near commercialcentres registered healthyrental return.
In spite of 2 per cent drop inAhmedabad city index, the citysaw positive buyer sentiment inlocalities with bright prospects.Vejalpur, SP Ring Road, Ghatlodiaand Navrangpura witnessed a risein capital values. Multi-storeyapartments, especially 2BHKunits in the price range of Rs 20-30 lakh continued to witnessmaximum consumer demand inthe Jan-Mar 2013 quarter.
The Bangalore city indexwitnessed a hike of 7 per cent inthe Jan-Mar 2013 quarter ascompared to a drop of 2 per centin the Oct-Dec 2012 quarter.Developers attribute this steadygrowth to increasing buyerconfidence due to improvedscenario in the IT sector. Anupward price trend in 75 per centcity localities pushed up the price monitor.
The Chennai property indexstood at -6 per cent during theperiod Jan-Mar 2013 as comparedto the Oct-Dec 2012 quarter whenit rose by 2 per cent. The Chennailisted price monitor too reported adip, primarily due to anoversupply in certain localities.However, areas in the outskirts ofthe city recorded a rise in capitalvalues, with certain notableexceptions, primarily due to thepresence of IT companies.
The Delhi index continued toregister a steady rise in the indexvalue (3 per cent) quarter-over-quarter in the last nine months.The listed price monitor remainedunchanged within the quarter.The capital value of well-structured residentialcomplexes in Shivalik, RohiniSector 13, Safdarjung Enclave andSarita Vihar registered a rise. Thelisted price monitor shows closeto 59 per cent of localities in thecity witnessed an uptrend inaverage capital values.Approximately 52 per cent of thelocalities in the city registered arise in average rental values.
The Ghaziabad index witnessed a3 per cent increase in the Jan-Mar 2013 quarter.Indirapuram, Raj NagarExtension and Crossings Republikwitnessed maximum buyerinterest and remained the mostactive areas in the past sixmonths. The consumer demandpattern shows residentialproperty between Rs 40-70 lakhsaw the highest interest followedby demand for property in theprice range of Rs 20-40 lakh.
The Gurgaon city index rose by 5 per cent during the Jan-Mar 2013quarter. The upcoming sectors inGurgaon which are undergoing achange in landscape with thedevelopment of residences, officesand commercial shops haveexperienced an appreciation ofproperty prices. Sector 71, 83 and
Preferred Cities - Sale
Cities Rank Wise
Mumbai 1
Bangalore 2
Pune 3
Delhi 4
Hyderabad 5
Chennai 6
Gurgaon 7
Kolkata 8
Noida 9
Ghaziabad 10
VOL2, ISSUE 4; JAN-MAR, FY 2013-14
Preferred Cities - Lease
Cities Rank Wise
Mumbai 1
Bangalore 2
Pune 3
Delhi 4
Chennai 5
Gurgaon 6
Hyderabad 7
Kolkata 8
Noida 9
Ahmedabad 10Note: Q4 Jan-Mar 2013 Note: Q4 Jan-Mar 2013
propindex.magicbricks.com
3
92, in Gurgaon scored as the newinvestment hubs in the NCR.Residential property in the pricerange of Rs 60-100 lakh recordedhighest consumer demand.
The Hyderabad city index dippedby 3 per cent during the Jan-Mar 2013 quarter. In the lastone year, the city has notwitnessed any major expansion ofIT/MNC’s. Moreover, cautiousbuying by the existing ITpopulation had negativelyimpacted the index. In spite of aslow transaction rate, close to 50 per cent localities in the citymanaged to register positivechange in values in the past threemonths. This arrested the free fallof the index value.
The Kolkata property index roseby 4 per cent during the Jan-Mar 2013 quarter as comparedto the Oct-Dec 2012 quarter thatwitnessed slightly lower growthrate with 3 per cent. Close to 63 per cent localities across thecity saw a positive trend in capitalvalues. However, 43 per cent of thetotal areas in the city showed arise in average rental values.
The Noida index witnessed 5 per cent rise in the city indexvalue. The listed price monitorrecorded similar per centincrease. The rise in averageproperty price (close to 89 percent) of the localities led to aspurt in the listed price monitor.
Sectors 50, 61 and 62 remained thepreferred localities in terms ofbuying and renting. Propertybetween Rs 60-100 lakh continuedto bag the highest demand with asmall drop of 2 per cent incomparison to the last quarter.
The Pune city index consistentlyregistered 3 per cent growthquarter-over-quarter in the lastsix months. Majority of theresidential areas witnesseduptrend in listing values. Some ofthe localities with maximumappreciation in capital valueswere Warje, Wanwadi, SopanBaug, Wanowrie, Aundh,Balewadi, Kothrud and Kondhwa.In the rental market, localitiessuch as Chinchwad and PashanSus Road which have educationalinstitutes witnessed a rise inaverage values owing to the schooladmission season.
The Mumbai index rose by 4 per cent during Jan-Mar 2013.Close to 85 per cent localities inthe city registered a rise in theaverage residential values. Unitsof 1BHK in multi-storeyapartments continued to be mostin demand, especially in Thane.Budget preference analysis showsthat property values between Rs 50-100 lakh topped theconsumer demand chart. Propertyin this category witnessed ahealthy rise of 7 per cent in thelast three months.
VOL2, ISSUE 4; JAN-MAR, FY 2013-14
Upto Rs 20 Lakh Rs 20-30 Lakh Rs 30-50 Lakh Rs 50-70 Lakh Rs 70-100 Lakh Rs 1-2 Crore Rs 2 Crore & Above
National - Consumer Budget Preference
30%
25%
20%
15%
10%
5%
0%
16%14%
23%
13% 11% 10%13%
TOP Y IELD GROSSERS
Gross yield is a ratio of average annualrental value to the average capital valueof the property. Given below are the topyield-grossing localities in each city.
Locality Gross yield
Bangalore, Electronic City 5.54%
Kolkata, Rajarhat 4.84%
Hyderabad, Gachibowli 4.76%
Chennai, OMR 4.32%
Ahmedabad, Maninagar 4.07%
Mumbai, Parel 3.59%
Noida, Sector-92 3.40%
Pune, Magarpatta 3.07%
Ghaziabad, Indirapuram 2.94%
Gurgaon, Sushant Lok-I 2.83%
Delhi, Vasundhara Enclave 2.33%
CAPITAL GAINS
The table given below indicatesmaximum increase in capital values ineach city.
Locality % Change
Mumbai, Vashi 9.95%
Chennai, Oragadam 9.73%
Gurgaon, Sector-95 9.59%
Ghaziabad, Bhopura 9.26%
Hyderabad, Miyapur 9.01%
Kolkata, New Alipore 8.41%
Noida, Sector-134 8.05%
Bangalore, Kasturi Nagar 7.59%
Pune, Warje 7.58%
Delhi, Sarita Vihar 7.42%
Ahmedabad, SP Ring Road 4.84%
propindex.magicbricks.com
NOIDA-GHAZIABAD 16VOL2, ISSUE 4; JAN-MAR, FY 2013-14
NOIDA INDEX
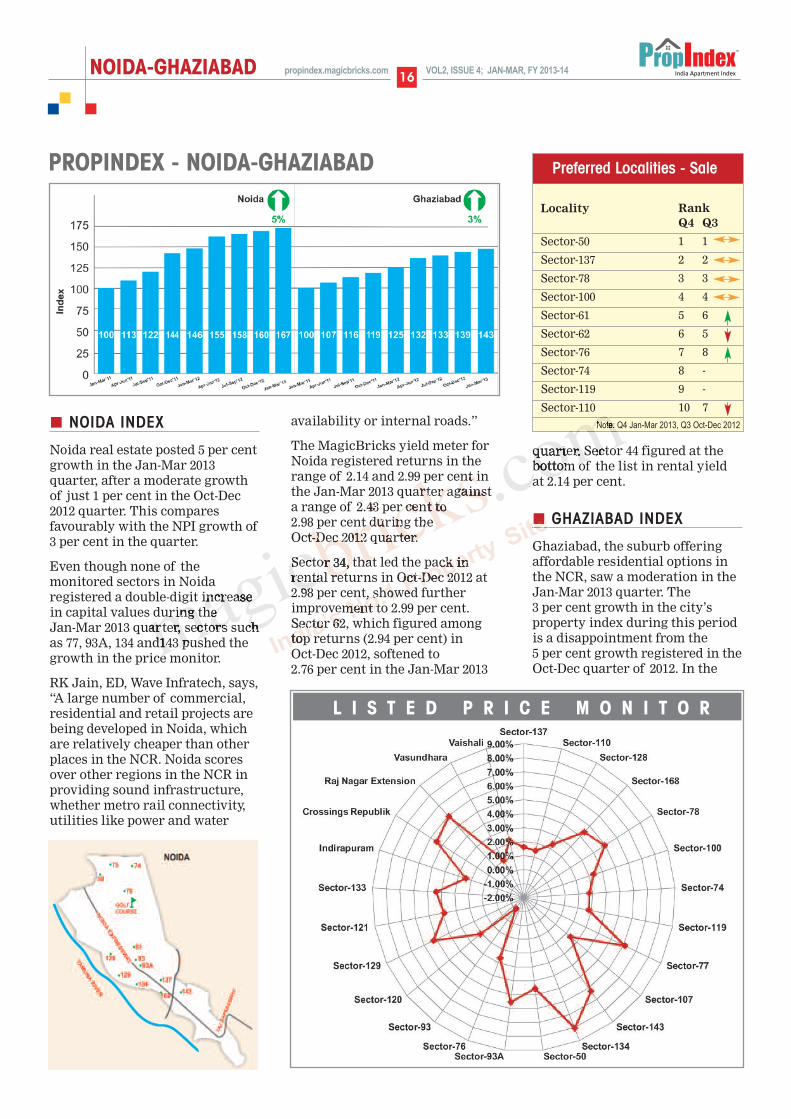
Noida real estate posted 5 per centgrowth in the Jan-Mar 2013quarter, after a moderate growthof just 1 per cent in the Oct-Dec2012 quarter. This comparesfavourably with the NPI growth of3 per cent in the quarter.
Even though none of themonitored sectors in Noidaregistered a double-digit increasein capital values during the Jan-Mar 2013 quarter, sectors suchas 77, 93A, 134 and143 pushed thegrowth in the price monitor.
RK Jain, ED, Wave Infratech, says,“A large number of commercial,residential and retail projects arebeing developed in Noida, whichare relatively cheaper than otherplaces in the NCR. Noida scoresover other regions in the NCR inproviding sound infrastructure,whether metro rail connectivity,utilities like power and water
availability or internal roads.”
The MagicBricks yield meter forNoida registered returns in therange of 2.14 and 2.99 per cent inthe Jan-Mar 2013 quarter againsta range of 2.43 per cent to 2.98 per cent during the Oct-Dec 2012 quarter.
Sector 34, that led the pack in rental returns in Oct-Dec 2012 at2.98 per cent, showed furtherimprovement to 2.99 per cent.Sector 62, which figured amongtop returns (2.94 per cent) in Oct-Dec 2012, softened to 2.76 per cent in the Jan-Mar 2013
quarter. Sector 44 figured at thebottom of the list in rental yield at 2.14 per cent.
GHAZIABAD INDEX
Ghaziabad, the suburb offeringaffordable residential options inthe NCR, saw a moderation in theJan-Mar 2013 quarter. The 3 per cent growth in the city’sproperty index during this periodis a disappointment from the 5 per cent growth registered in theOct-Dec quarter of 2012. In the
L I S T E D P R I C E M O N I T O R
PROPINDEX - NOIDA-GHAZIABAD
Locality RankQ4 Q3
Sector-50 1 1
Sector-137 2 2
Sector-78 3 3
Sector-100 4 4
Sector-61 5 6
Sector-62 6 5
Sector-76 7 8
Sector-74 8 -
Sector-119 9 -
Sector-110 10 7
Preferred Localities - Sale
Note: Q4 Jan-Mar 2013, Q3 Oct-Dec 2012
propindex.magicbricks.com
NOIDA-GHAZIABAD17VOL2, ISSUE 4; JAN-MAR, FY 2013-14
same quarter, the NPI registered agrowth of 3 per cent.
The average listed price monitorrose by 3 per cent in the Jan-Mar quarter 2013, showingimprovement over the 2 per centin Oct-Dec 2012. The performanceof the suburb was triggered bysteady growth in areas like Raj Nagar Extension andCrossings Republik.
The yield meter of MagicBricksfor Ghaziabad remained subduedin Jan-Mar 2013 at 1.96 to 2.94 percent compared to 2.25 per cent to2.90 per cent in Oct-Dec 2012. Ofthe monitored areas inGhaziabad, Indirapuram
remained on top of the list interms of yield. Its yield improvedto 2.94 per cent from 2.90 per centin the Oct-Dec 2012 quarter.
Deepak Kapoor, Director, GulshanHomz, says, “The property pricetrends have shown that people areconsidering this place better tolive in due to its proximity toNoida and Delhi. The propertyprices have appreciated on an
average rate of 5 per cent withinthree months of this year.”
LISTED PRICE MONITOR - NOIDA
Progress in the planneddevelopment of metro network,improvement of road transportincluding widening of the Delhi-UP Link Road and openingof more offices and setting up ofmulti-national offices havecontributed to the growth ofcapital values in Noida.
In April 2013, the Uttar PradeshChief Minister Akhilesh Yadavunveiled projects worth Rs 3,300crore for the development ofNoida and Greater Noida. The CMsaid that Noida, Greater Noidaand Yamuna Expresswayauthorities had a budget almostequalling Delhi and so the
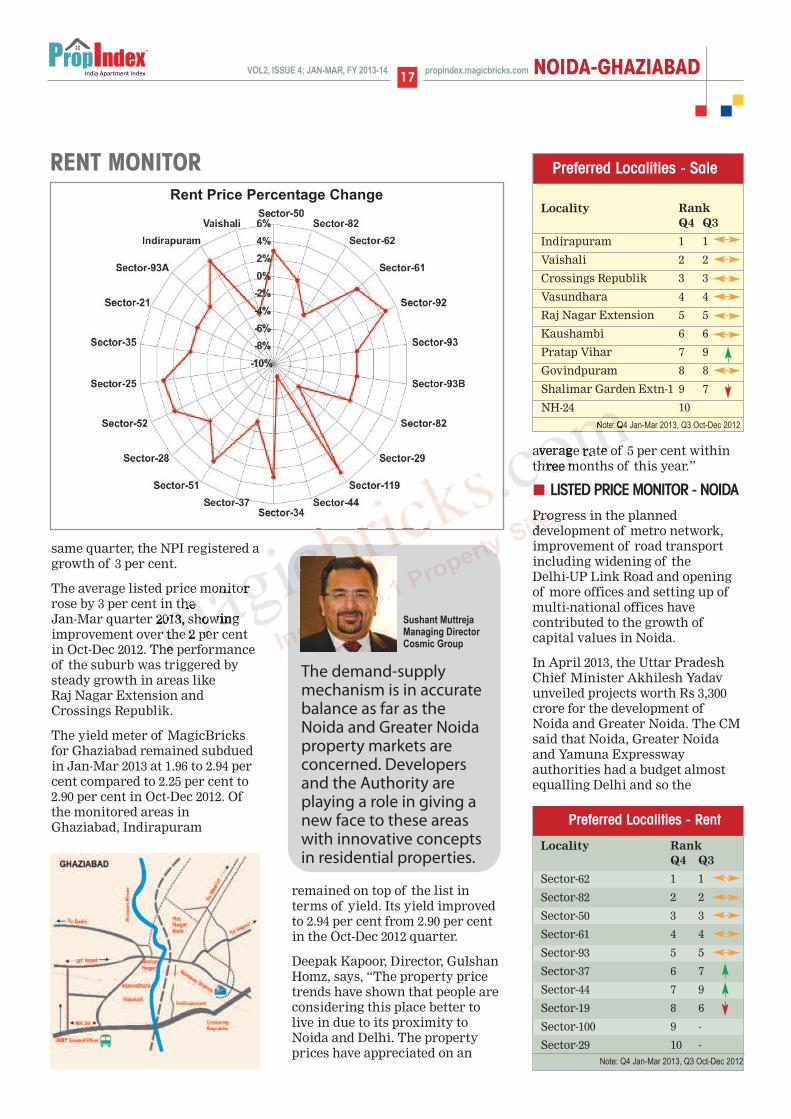
RENT MONITOR Rent Price Percentage Change
The demand-supplymechanism is in accuratebalance as far as theNoida and Greater Noidaproperty markets areconcerned. Developersand the Authority areplaying a role in giving anew face to these areaswith innovative conceptsin residential properties.
Sushant MuttrejaManaging DirectorCosmic Group
Locality RankQ4 Q3
Indirapuram 1 1
Vaishali 2 2
Crossings Republik 3 3
Vasundhara 4 4
Raj Nagar Extension 5 5
Kaushambi 6 6
Pratap Vihar 7 9
Govindpuram 8 8
Shalimar Garden Extn-1 9 7
NH-24 10
Preferred Localities - Sale
Note: Q4 Jan-Mar 2013, Q3 Oct-Dec 2012
Preferred Localities - Rent
Locality RankQ4 Q3
Sector-62 1 1
Sector-82 2 2
Sector-50 3 3
Sector-61 4 4
Sector-93 5 5
Sector-37 6 7
Sector-44 7 9
Sector-19 8 6
Sector-100 9 -
Sector-29 10 -Note: Q4 Jan-Mar 2013, Q3 Oct-Dec 2012
propindex.magicbricks.com
NOIDA-GHAZIABAD 18VOL2, ISSUE 4; JAN-MAR, FY 2013-14
development work in the twocities should be expedited. Theprojects include two sub-stationsat the cost of Rs 1,016 crore, aproposed district hospital worthRs 424 crore in Noida, a medicaluniversity with an estimated costof Rs 500 crore and an
administrative block to be set upat a cost of Rs 300 crore at Greater Noida.
It also includes an underpass atthe crossing of Sectors 32, 35, 39and 51 costing Rs 50 crore,underpass at crossing of Sectors94 and 95 costing Rs 40 crore andmulti-level car parking at Sector18 costing Rs 250 crore. A Rs 40 crore sewage treatmentplant in Sector 123 was alsoannounced.
For Greater Noida, foundation ofa medical university costing Rs 500 crore was laid.Administrative block of theGreater Noida Authority costingRs 300 crore and 7,200 affordableflats were to be constructed at acost of Rs 400 crore.
Sushant Muttreja, MD, CosmicGroup commented, “The realestate market in Noida andGreater Noida was promising inthe last quarter. Major developerslaunched their projects onYamuna Expressway and GreaterNoida West along with a fewsectors in Noida. Most projectswere serviced residences andcommercial projects offeringoffice spaces, retail and studioapartments.”
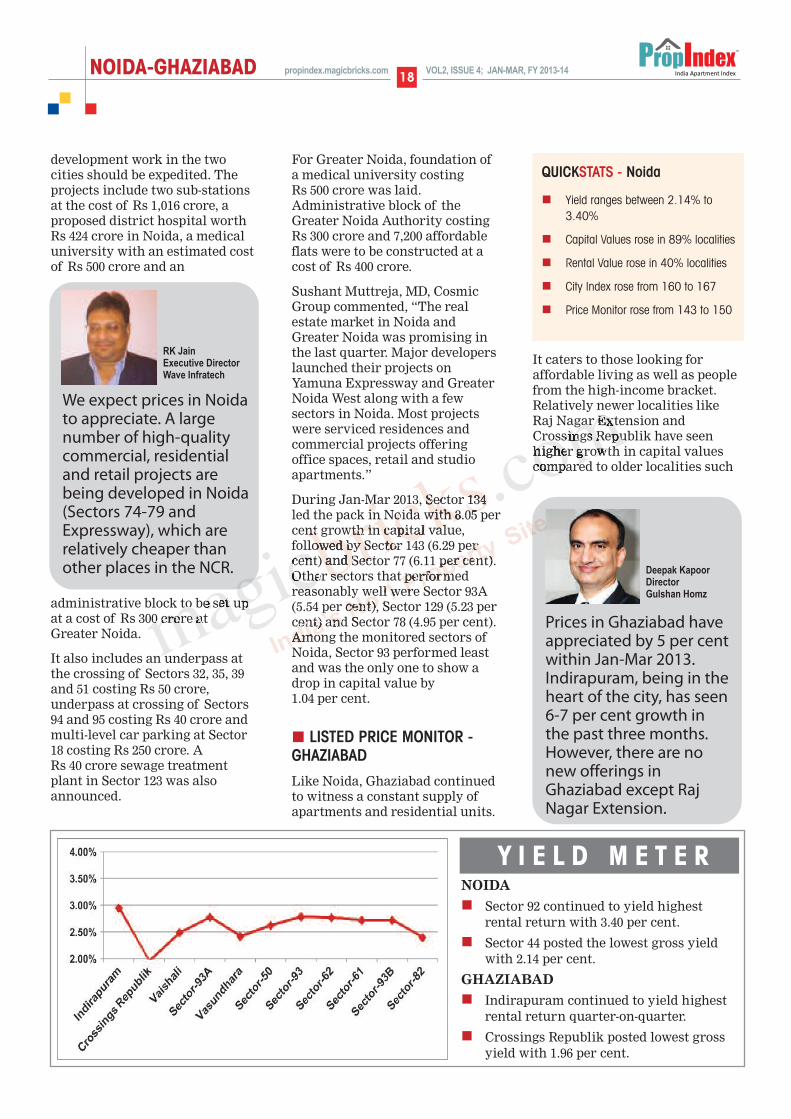
During Jan-Mar 2013, Sector 134led the pack in Noida with 8.05 percent growth in capital value,followed by Sector 143 (6.29 percent) and Sector 77 (6.11 per cent).Other sectors that performedreasonably well were Sector 93A(5.54 per cent), Sector 129 (5.23 percent) and Sector 78 (4.95 per cent).Among the monitored sectors ofNoida, Sector 93 performed leastand was the only one to show adrop in capital value by 1.04 per cent.
LISTED PRICE MONITOR -GHAZIABAD
Like Noida, Ghaziabad continuedto witness a constant supply ofapartments and residential units.
It caters to those looking foraffordable living as well as peoplefrom the high-income bracket.Relatively newer localities likeRaj Nagar Extension andCrossings Republik have seenhigher growth in capital valuescompared to older localities such
NOIDA
n Sector 92 continued to yield highestrental return with 3.40 per cent.
n Sector 44 posted the lowest gross yieldwith 2.14 per cent.
GHAZIABAD
n Indirapuram continued to yield highestrental return quarter-on-quarter.
n Crossings Republik posted lowest grossyield with 1.96 per cent.
Y I E L D M E T E R
QUICKSTATS - Noida
n Yield ranges between 2.14% to3.40%
n Capital Values rose in 89% localities
n Rental Value rose in 40% localities
n City Index rose from 160 to 167
n Price Monitor rose from 143 to 150
We expect prices in Noidato appreciate. A largenumber of high-qualitycommercial, residentialand retail projects arebeing developed in Noida(Sectors 74-79 andExpressway), which arerelatively cheaper thanother places in the NCR.
RK JainExecutive Director Wave Infratech
Prices in Ghaziabad haveappreciated by 5 per centwithin Jan-Mar 2013.Indirapuram, being in theheart of the city, has seen6-7 per cent growth inthe past three months.However, there are nonew offerings inGhaziabad except RajNagar Extension.
Deepak KapoorDirectorGulshan Homz
propindex.magicbricks.com

NOIDA-GHAZIABAD19VOL2, ISSUE 4; JAN-MAR, FY 2013-14
as Indirapuram and Vasundhara.Against a 5.94 and 5.47 per centappreciation seen in Raj NagarExtension and CrossingsRepublik, Indirapuram andVasundhara reportedappreciation of 2.42 and 1.02 per cent respectively.
Balwant Singh, Chairman,Ramprastha Group, says,“Ghaziabad has benefitted fromthe dearth of space in Delhi forcommercial as well as residentialrequirement. Many buyers arenow moving towards this area.Due to the easy availability ofoptions and low rental rates,many companies are also
planning to set up their offices inthese areas. The authorities haveput special emphasis onstrengthening the infrastructurein the city.”
RENT MONITOR - NOIDA Sectors 34, 62, 93 and 119 werepopular residential destinationsand showed a maximum rentalyield in Jan-Mar 2013.
Most of the monitored sectors sawa yield of over 2.50 per cent. Otherhigh yield sectors were 50, 82, 93Aand 93B. Sector 62 remained a toppick in terms of rental incomeshowing a growth of 7 per cent inOct-Dec quarter 2012 but in Jan-Mar 2013 it slipped intonegative territory of 3 per cent.
Sectors 29 and 44 also saw a highdrop in rental values at 6 and 9per cent, respectively. Sectors 92and 119 each posted a growth of 5 per cent.
RENT MONITOR - GHAZIABADGhaziabad maintained a healthyrental yield in the Jan-Mar 2013quarter even though the growthwas muted compared to Oct-Dec 2012.
Newly-developed areas such asRaj Nagar Extension andCrossings Republik picked up dueto low and affordable rent incomparison to Noida.
Indirapuram topped the list inGhaziabad with 2.94 per centyield. Rental values havecorrected in Vasundhara,Crossings Republik andKaushambi. Vasundhara andCrossings have seen maximumcorrection at 9 and 8 per cent,respectively.
Yamuna Expressway poised as new growth hubYamuna Expressway is India’s longest access controlledexpressway with six-lane concrete pavement. The 165km-longexpressway connecting Noida with Agra is poised to be thegrowth engine for all-round economic and industrial growth inwestern UP. It covers around 30 lakh people under its sphere ofinfluence. The Yamuna Expressway Industrial DevelopmentAuthority (YEIDA or Yamuna Expressway Authority) has laiddown a ribbon development model along the Yamuna Expresswayto promote special economic zones in core activities like IT,industry, and commercial enterprise.
n Times Property, The Times of India, Delhi/NCR
Green building developers in Noida to get free 5% FAR To encourage green buildings, the Noida Authority has decided toreward about two dozen developers who have opted for eco-friendly construction by giving them 5 per cent floor area ratio(FAR) for free. In the last six months, layout plans of about 20buildings that have been designed completely on the greenconcept have been approved by the Authority. The Authoritycharges a hefty sum from those builders who want to purchase anadditional 5 per cent FAR. “The city’s green areas are slowlydwindling. About 20 developers are on way to construct iconicgreen buildings after due approvals,” an Authority official says.
n The Times of India, Delhi/NCR
The two cities have diverse markets and cater to different segment of buyers, yet both are witnessing rapid infrastructureboost, thereby attracting demand from end-users as well as investors. Also, both Noida and Ghaziabad have rapidlyexpanded to cater to an increase in demand from the mid-segment buyer.
The recent widening ofthe NH24 will benefitthe real estate market inGhaziabad. It isexpected that thedemand and prices ofresidential properties inIndirapuram andVaishali will increasewith the widening ofthe road.
Balwant SinghChairmanRamprastha Group
To read full story and more news go to www.content.magicbricks.com
QUICKSTATS - Ghaziabad
n Yield ranges between 1.96% to2.94%
n Capital Values rose in 87% localities
n Rental Value rose in 33% localities
n City Index rose from 139 to 143
n Price Monitor rose from 135 to 139
Preferred Localities - Rent
Locality RankQ4 Q3
Indirapuram 1 1
Vaishali 2 2
Crossings Republik 3 3
Vasundhara 4 4
Raj Nagar Extension 5 6
Kaushambi 6 5
Govindpuram 7 -
Sahibabad 8 8
Mohan Nagar 9 10
Pratap Vihar 10 9Note: Q4 Jan-Mar 2013, Q3 Oct-Dec 2012
R E A L T Y N E W S
propindex.magicbricks.com
NOIDA-GHAZIABAD 20VOL2, ISSUE 4; JAN-MAR, FY 2013-14
Budget wise Analysis - DEMAND
120
100
80
60
40
20
0
Q3 (Oct-Dec 2012)
Q4 (Jan-Mar 2013)
Fig
ures
in p
erce
ntag
e(%
)
New Developing Sectors Noida-Greater Noida Expressway Old Noida
<20 lakh Rs 20-40 lakh Rs 40-60 lakh Rs 60-100 lakh Rs 1 crore and above
Q3 Q4
35 38
Q3 Q4 Q3 Q4
16
29
23
Budget wise Analysis - SUPPLY
120
100
80
60
40
20
0
Q3 (Oct-Dec 2012)
Q4 (Jan-Mar 2013)
Fig
ures
in p
erce
ntag
e(%
)
New Developing Sectors Noida-Greater Noida Expressway Old Noida
Q3 Q4
10
Q3 Q4 Q3 Q473 75
23
25
15
21
35
18
12
3539
13
25
3535
1314
43
99
39
36
36
13
33
38
11
33
31
31
30
13
1520
12 14 25
16
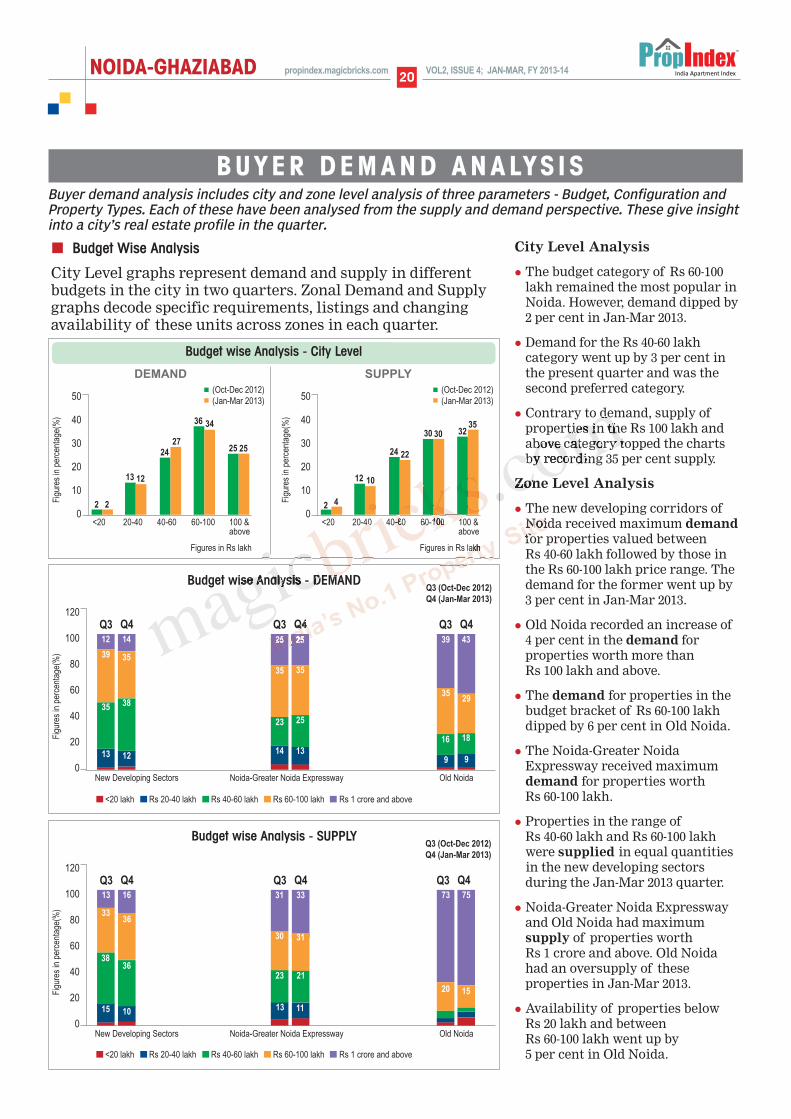
City Level Analysis
l The budget category of Rs 60-100lakh remained the most popular inNoida. However, demand dipped by2 per cent in Jan-Mar 2013.
l Demand for the Rs 40-60 lakhcategory went up by 3 per cent inthe present quarter and was thesecond preferred category.
l Contrary to demand, supply ofproperties in the Rs 100 lakh andabove category topped the chartsby recording 35 per cent supply.
Zone Level Analysis
l The new developing corridors ofNoida received maximum demandfor properties valued between Rs 40-60 lakh followed by those inthe Rs 60-100 lakh price range. Thedemand for the former went up by 3 per cent in Jan-Mar 2013.
l Old Noida recorded an increase of4 per cent in the demand forproperties worth more than Rs 100 lakh and above.
l The demand for properties in thebudget bracket of Rs 60-100 lakhdipped by 6 per cent in Old Noida.
l The Noida-Greater NoidaExpressway received maximumdemand for properties worth Rs 60-100 lakh.
l Properties in the range of Rs 40-60 lakh and Rs 60-100 lakhwere supplied in equal quantitiesin the new developing sectorsduring the Jan-Mar 2013 quarter.
l Noida-Greater Noida Expresswayand Old Noida had maximumsupply of properties worth Rs 1 crore and above. Old Noidahad an oversupply of theseproperties in Jan-Mar 2013.
l Availability of properties below Rs 20 lakh and between Rs 60-100 lakh went up by 5 per cent in Old Noida.
50
40
30
20
10
0<20 20-40 40-60 60-100 100 &
above
2
Fig
ures
in p
erce
ntag
e(%
)
Figures in Rs lakh
2
13 12
2427
36 34
25 25
(Oct-Dec 2012)
(Jan-Mar 2013)
Budget wise Analysis - City Level
DEMAND
50
40
30
20
10
0<20 20-40 40-60 60-100 100 &
above
2
Fig
ures
in p
erce
ntag
e(%
)
Figures in Rs lakh
4
12 10
24 22
30 30 3235
(Oct-Dec 2012)
(Jan-Mar 2013)
SUPPLY
<20 lakh Rs 20-40 lakh Rs 40-60 lakh Rs 60-100 lakh Rs 1 crore and above
BUYER DEMAND ANALYS I S
Budget Wise Analysis
City Level graphs represent demand and supply in differentbudgets in the city in two quarters. Zonal Demand and Supplygraphs decode specific requirements, listings and changingavailability of these units across zones in each quarter.
Buyer demand analysis includes city and zone level analysis of three parameters - Budget, Configuration andProperty Types. Each of these have been analysed from the supply and demand perspective. These give insightinto a city’s real estate profile in the quarter.
propindex.magicbricks.com
NOIDA-GHAZIABAD21VOL2, ISSUE 4; JAN-MAR, FY 2013-14
Property wise Analysis - City Level
100
80
60
40
20
0
85 84
5 59 10
1 1
(Oct-Dec 2012)
(Jan-Mar 2013)
Fig
ures
in p
erce
ntag
e(%
)
Multistorey Residential Residential Villaapartment house plot
DEMAND
100
80
60
40
20
0
83 81
6 79 10
2 2
(Oct-Dec 2012)
(Jan-Mar 2013)
Fig
ures
in p
erce
ntag
e(%
)
Multistorey Residential Residential Villaapartment house plot
SUPPLY
Property wise Analysis - DEMAND
120
100
80
60
40
20
0
Q3 (Oct-Dec 2012)
Q4 (Jan-Mar 2013)
Fig
ures
in p
erce
ntag
e(%
)
New Developing Sectors Noida-Greater Noida Expressway Old Noida
Multistorey apartment Residential house Residential plot Villa
Q3 Q4 Q3 Q4 Q3 Q4
13 1591
6
91
6 11
8586
10
74
109
77
Property wise Analysis - SUPPLY
120
100
80
60
40
20
0
Q3 (Oct-Dec 2012)
Q4 (Jan-Mar 2013)
Fig
ures
in p
erce
ntag
e(%
)
New Developing Sectors Noida-Greater Noida Expressway Old Noida
Multistorey apartment Residential house Residential plot Villa
Q3 Q4 Q3 Q4 Q3 Q4
3130
92
6
92
6 11
8587
9
47
1511
51
87
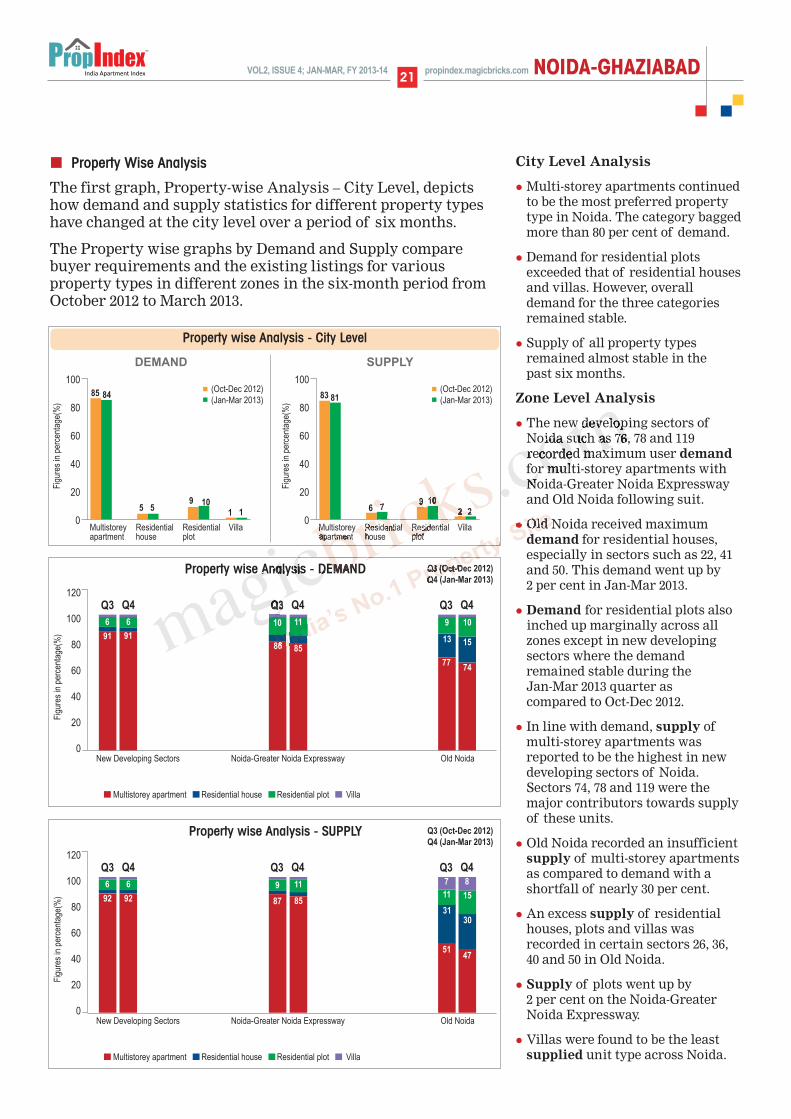
City Level Analysis
l Multi-storey apartments continuedto be the most preferred propertytype in Noida. The category baggedmore than 80 per cent of demand.
l Demand for residential plotsexceeded that of residential housesand villas. However, overalldemand for the three categoriesremained stable.
l Supply of all property typesremained almost stable in the past six months.
Zone Level Analysis
l The new developing sectors ofNoida such as 76, 78 and 119recorded maximum user demandfor multi-storey apartments withNoida-Greater Noida Expresswayand Old Noida following suit.
l Old Noida received maximumdemand for residential houses,especially in sectors such as 22, 41and 50. This demand went up by 2 per cent in Jan-Mar 2013.
l Demand for residential plots alsoinched up marginally across allzones except in new developingsectors where the demandremained stable during the Jan-Mar 2013 quarter as compared to Oct-Dec 2012.
l In line with demand, supply ofmulti-storey apartments wasreported to be the highest in newdeveloping sectors of Noida.Sectors 74, 78 and 119 were themajor contributors towards supplyof these units.
l Old Noida recorded an insufficientsupply of multi-storey apartmentsas compared to demand with ashortfall of nearly 30 per cent.
l An excess supply of residentialhouses, plots and villas wasrecorded in certain sectors 26, 36,40 and 50 in Old Noida.
l Supply of plots went up by 2 per cent on the Noida-GreaterNoida Expressway.
l Villas were found to be the leastsupplied unit type across Noida.
Property Wise Analysis
The first graph, Property-wise Analysis – City Level, depictshow demand and supply statistics for different property typeshave changed at the city level over a period of six months.
The Property wise graphs by Demand and Supply comparebuyer requirements and the existing listings for variousproperty types in different zones in the six-month period fromOctober 2012 to March 2013.
propindex.magicbricks.com
NOIDA-GHAZIABAD 22VOL2, ISSUE 4; JAN-MAR, FY 2013-14
BHK Configuration - City Level
50
40
30
20
10
0
7 6
45 4642 41
7 7
(Oct-Dec 2012)
(Jan-Mar 2013)
Fig
ures
in p
erce
ntag
e(%
)
1 BHK 2BHK 3 BHK 4BHK &above
DEMAND SUPPLY
50
40
30
20
10
0
5 4
32 31
45 45
19 20
(Oct-Dec 2012)
(Jan-Mar 2013)
Fig
ures
in p
erce
ntag
e(%
)
1 BHK 2BHK 3 BHK 4BHK &above
BHK Configuration - DEMAND
120
100
80
60
40
20
0
Q3 (Oct-Dec 2012)
Q4 (Jan-Mar 2013)
Fig
ures
in p
erce
ntag
e(%
)
New Developing Sectors Noida-Greater Noida Expressway Old Noida
1 BHK 2 BHK 3 BHK 4 BHK & above
Q3 Q4 Q3 Q4 Q3 Q4
50 5044 4542 44
BHK Configuration - SUPPLY
120
100
80
60
40
20
0
Q3 (Oct-Dec 2012)
Q4 (Jan-Mar 2013)
Fig
ures
in p
erce
ntag
e(%
)
New Developing Sectors Noida-Greater Noida Expressway Old Noida
1 BHK 2 BHK 3 BHK 4 BHK & above
Q3 Q4 Q3 Q4 Q3 Q3
46 484747
33
46
33
48
7
39
7
408
42
67
44
7
40
9
41
40
87
40
18
32
17
32
1620
10
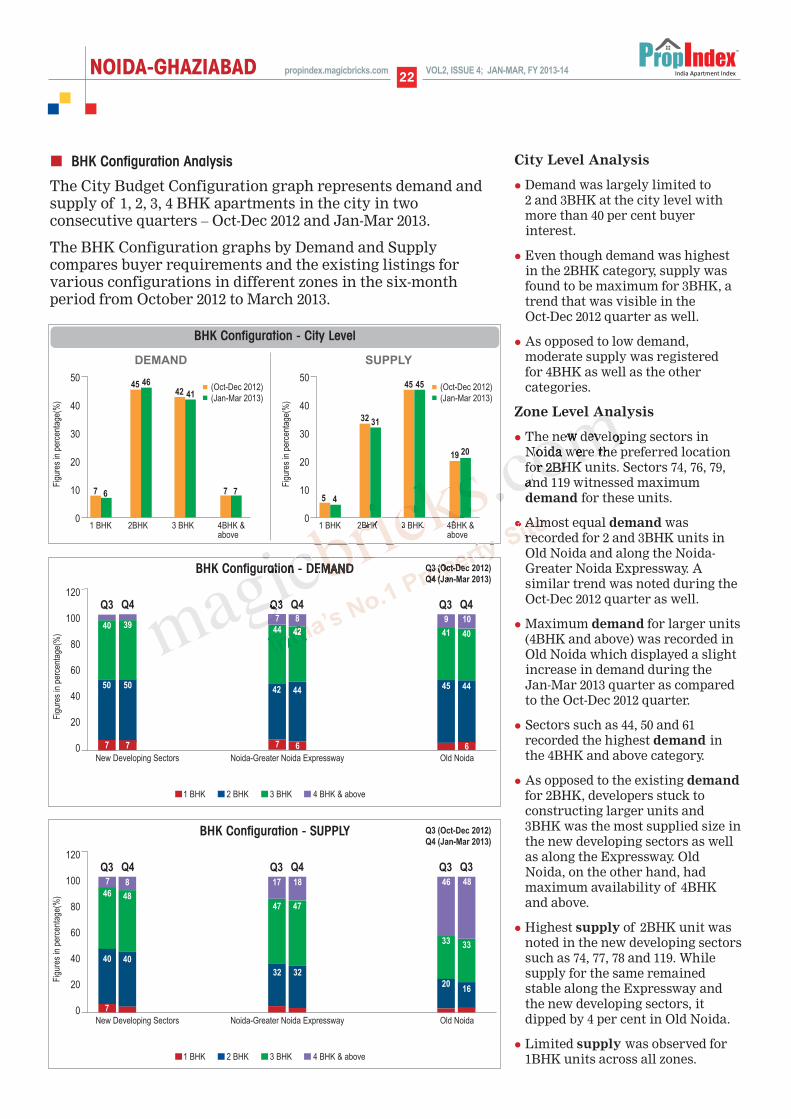
City Level Analysis
l Demand was largely limited to 2 and 3BHK at the city level withmore than 40 per cent buyerinterest.
l Even though demand was highestin the 2BHK category, supply wasfound to be maximum for 3BHK, atrend that was visible in the Oct-Dec 2012 quarter as well.
l As opposed to low demand,moderate supply was registered for 4BHK as well as the othercategories.
Zone Level Analysis
l The new developing sectors inNoida were the preferred locationfor 2BHK units. Sectors 74, 76, 79,and 119 witnessed maximumdemand for these units.
l Almost equal demand wasrecorded for 2 and 3BHK units inOld Noida and along the Noida-Greater Noida Expressway. Asimilar trend was noted during theOct-Dec 2012 quarter as well.
l Maximum demand for larger units(4BHK and above) was recorded inOld Noida which displayed a slightincrease in demand during the Jan-Mar 2013 quarter as comparedto the Oct-Dec 2012 quarter.
l Sectors such as 44, 50 and 61recorded the highest demand in the 4BHK and above category.
l As opposed to the existing demandfor 2BHK, developers stuck toconstructing larger units and3BHK was the most supplied size inthe new developing sectors as wellas along the Expressway. OldNoida, on the other hand, hadmaximum availability of 4BHKand above.
l Highest supply of 2BHK unit wasnoted in the new developing sectorssuch as 74, 77, 78 and 119. Whilesupply for the same remainedstable along the Expressway andthe new developing sectors, itdipped by 4 per cent in Old Noida.
l Limited supply was observed for1BHK units across all zones.
7
6
BHK Configuration Analysis
The City Budget Configuration graph represents demand andsupply of 1, 2, 3, 4 BHK apartments in the city in twoconsecutive quarters – Oct-Dec 2012 and Jan-Mar 2013.
The BHK Configuration graphs by Demand and Supplycompares buyer requirements and the existing listings forvarious configurations in different zones in the six-monthperiod from October 2012 to March 2013.
propindex.magicbricks.com
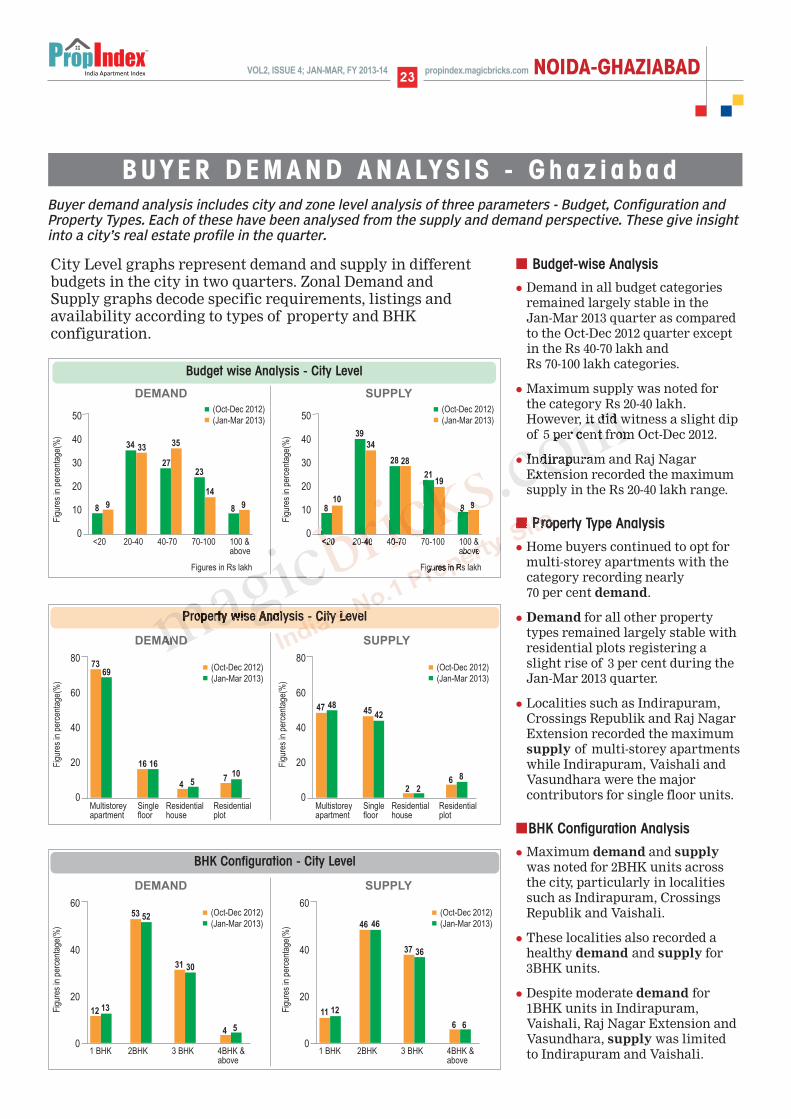
Budget-wise Analysis
l Demand in all budget categoriesremained largely stable in the Jan-Mar 2013 quarter as comparedto the Oct-Dec 2012 quarter exceptin the Rs 40-70 lakh and Rs 70-100 lakh categories.
l Maximum supply was noted for the category Rs 20-40 lakh.However, it did witness a slight dipof 5 per cent from Oct-Dec 2012.
l Indirapuram and Raj NagarExtension recorded the maximumsupply in the Rs 20-40 lakh range.
Property Type Analysis
l Home buyers continued to opt formulti-storey apartments with thecategory recording nearly 70 per cent demand.
l Demand for all other propertytypes remained largely stable withresidential plots registering aslight rise of 3 per cent during theJan-Mar 2013 quarter.
l Localities such as Indirapuram,Crossings Republik and Raj NagarExtension recorded the maximumsupply of multi-storey apartmentswhile Indirapuram, Vaishali andVasundhara were the majorcontributors for single floor units.
BHK Configuration Analysis
l Maximum demand and supplywas noted for 2BHK units acrossthe city, particularly in localitiessuch as Indirapuram, CrossingsRepublik and Vaishali.
l These localities also recorded ahealthy demand and supply for3BHK units.
l Despite moderate demand for1BHK units in Indirapuram,Vaishali, Raj Nagar Extension andVasundhara, supply was limitedto Indirapuram and Vaishali.
NOIDA-GHAZIABAD23VOL2, ISSUE 4; JAN-MAR, FY 2013-14
50
40
30
20
10
0<20 20-40 40-70 70-100 100 &
above
8
Fig
ures
in p
erce
ntag
e(%
)
Figures in Rs lakh
9
34 33
27
35
23
14
8 9
(Oct-Dec 2012)
(Jan-Mar 2013)
Budget wise Analysis - City Level
DEMAND
50
40
30
20
10
0<20 20-40 40-70 70-100 100 &
above
8
Fig
ures
in p
erce
ntag
e(%
)
Figures in Rs lakh
10
39
34
28 28
2119
8 9
(Oct-Dec 2012)
(Jan-Mar 2013)
SUPPLY
Property wise Analysis - City Level
80
60
40
20
0
7369
16 16
4 5 710
(Oct-Dec 2012)
(Jan-Mar 2013)
Fig
ures
in p
erce
ntag
e(%
)
Multistorey Single Residential Residentialapartment floor house plot
DEMAND
80
60
40
20
0
47 4845 42
2 26 8
(Oct-Dec 2012)
(Jan-Mar 2013)
Fig
ures
in p
erce
ntag
e(%
)
Multistorey Single Residential Residentialapartment floor house plot
SUPPLY
BHK Configuration - City Level
60
40
20
0
12 13
53 52
31 30
4 5
(Oct-Dec 2012)
(Jan-Mar 2013)
Fig
ures
in p
erce
ntag
e(%
)
1 BHK 2BHK 3 BHK 4BHK &above
DEMAND SUPPLY
60
40
20
0
11 12
46 46
37 36
6 6
(Oct-Dec 2012)
(Jan-Mar 2013)
Fig
ures
in p
erce
ntag
e(%
)
1 BHK 2BHK 3 BHK 4BHK &above
BUYER DEMAND ANALYS I S - G h a z i a b a d
City Level graphs represent demand and supply in differentbudgets in the city in two quarters. Zonal Demand andSupply graphs decode specific requirements, listings andavailability according to types of property and BHKconfiguration.
Buyer demand analysis includes city and zone level analysis of three parameters - Budget, Configuration andProperty Types. Each of these have been analysed from the supply and demand perspective. These give insightinto a city’s real estate profile in the quarter.
propindex.magicbricks.com

ANNExURES
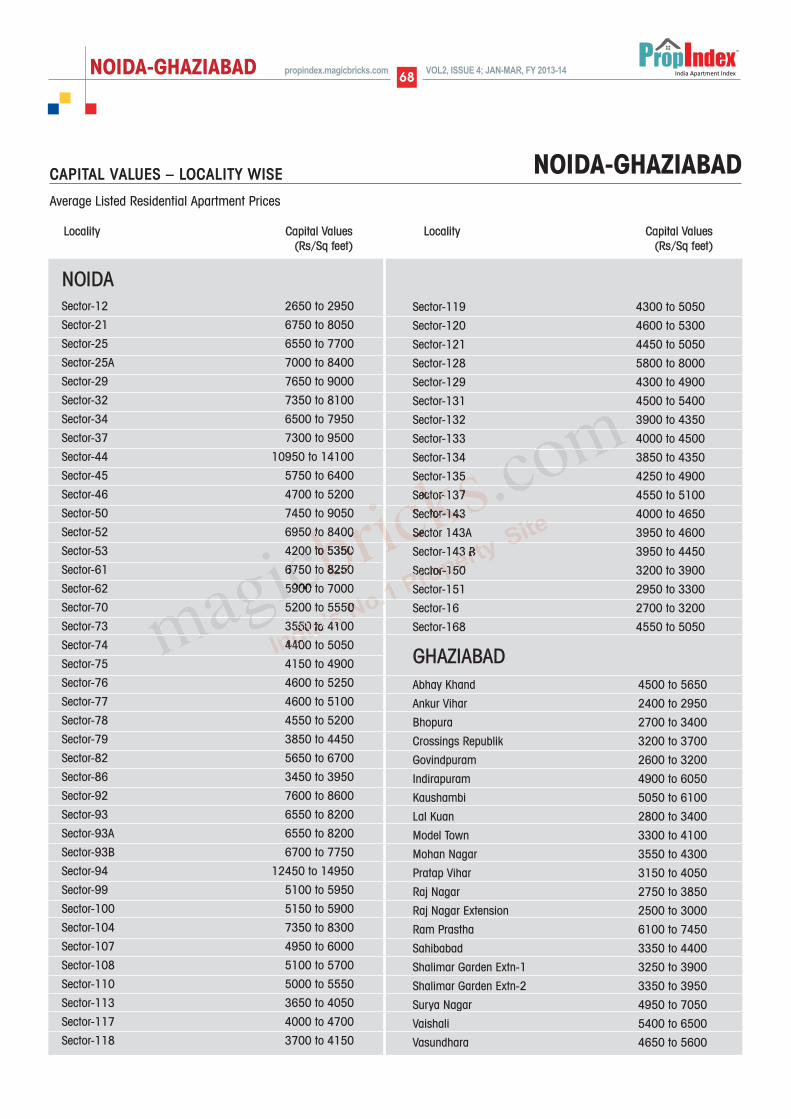
NOIDASector-12 2650 to 2950
Sector-21 6750 to 8050
Sector-25 6550 to 7700
Sector-25A 7000 to 8400
Sector-29 7650 to 9000
Sector-32 7350 to 8100
Sector-34 6500 to 7950
Sector-37 7300 to 9500
Sector-44 10950 to 14100
Sector-45 5750 to 6400
Sector-46 4700 to 5200
Sector-50 7450 to 9050
Sector-52 6950 to 8400
Sector-53 4200 to 5350
Sector-61 6750 to 8250
Sector-62 5900 to 7000
Sector-70 5200 to 5550
Sector-73 3550 to 4100
Sector-74 4400 to 5050
Sector-75 4150 to 4900
Sector-76 4600 to 5250
Sector-77 4600 to 5100
Sector-78 4550 to 5200
Sector-79 3850 to 4450
Sector-82 5650 to 6700
Sector-86 3450 to 3950
Sector-92 7600 to 8600
Sector-93 6550 to 8200
Sector-93A 6550 to 8200
Sector-93B 6700 to 7750
Sector-94 12450 to 14950
Sector-99 5100 to 5950
Sector-100 5150 to 5900
Sector-104 7350 to 8300
Sector-107 4950 to 6000
Sector-108 5100 to 5700
Sector-110 5000 to 5550
Sector-113 3650 to 4050
Sector-117 4000 to 4700
Sector-118 3700 to 4150
Sector-119 4300 to 5050
Sector-120 4600 to 5300
Sector-121 4450 to 5050
Sector-128 5800 to 8000
Sector-129 4300 to 4900
Sector-131 4500 to 5400
Sector-132 3900 to 4350
Sector-133 4000 to 4500
Sector-134 3850 to 4350
Sector-135 4250 to 4900
Sector-137 4550 to 5100
Sector-143 4000 to 4650
Sector 143A 3950 to 4600
Sector-143 B 3950 to 4450
Sector-150 3200 to 3900
Sector-151 2950 to 3300
Sector-16 2700 to 3200
Sector-168 4550 to 5050
GHAZIABADAbhay Khand 4500 to 5650
Ankur Vihar 2400 to 2950
Bhopura 2700 to 3400
Crossings Republik 3200 to 3700
Govindpuram 2600 to 3200
Indirapuram 4900 to 6050
Kaushambi 5050 to 6100
Lal Kuan 2800 to 3400
Model Town 3300 to 4100
Mohan Nagar 3550 to 4300
Pratap Vihar 3150 to 4050
Raj Nagar 2750 to 3850
Raj Nagar Extension 2500 to 3000
Ram Prastha 6100 to 7450
Sahibabad 3350 to 4400
Shalimar Garden Extn-1 3250 to 3900
Shalimar Garden Extn-2 3350 to 3950
Surya Nagar 4950 to 7050
Vaishali 5400 to 6500
Vasundhara 4650 to 5600
CAPITAL VALUES – LOCALITY WISE
Average Listed Residential Apartment Prices
Locality Capital Values (Rs/Sq feet)
Locality Capital Values (Rs/Sq feet)
NOIDA-GHAZIABAD
NOIDA-GHAZIABAD 68VOL2, ISSUE 4; JAN-MAR, FY 2013-14propindex.magicbricks.com


D I S C L A I M E REvery effort has been made to make this Index as complete and as accurate as possible. MagicBricksaccepts no responsibility for inaccuracies in the information/data contained in this book. It shall haveneither liability nor responsibility to any person or entity with respect to any loss or damage caused, oralleged to have been caused, directly or indirectly, by the information contained in this book. Theinformation/data in this book is subject to change from time to time due to market condition.
CONTACT US
l Post your feedback to -
propindex @timesgroup.com
l Join our discussion forum at -
openhouse.magicbricks.com
l For business enquiries -
PROPINDEX TEAM
l Content & Research: E Jayashree Kurup,
Dipti Tandon, Rishab Jain, Sruthi Kailas,
Indrani Rajkhowa Banerjee, Neha Nagpal,
Shradha Goyal, Bhawna Mongia,
Namrata Ekka, Ajay Modi, Renu Arya,
Puneet Kukreja & Bikash Kumar,
l Layout Design: Harsha Khattar
l Cover Page Design: Raghav Krishnan &
Rahul Nair
VOL2, ISSUE 4; JAN-MAR, FY 2013-14propindex.magicbricks.com