Delfi Limited Unaudited Financial Statements and Dividend...
26
1 Delfi Limited Unaudited Financial Statements and Dividend Announcement For the 3 rd Quarter and Nine Months Ended 30 September 2019 TABLE OF CONTENTS PART I - INFORMATION REQUIRED FOR ANNOUNCEMENT OF QUARTERLY (1Q, 2Q, 3Q & 4Q), HALF YEAR AND FULL YEAR RESULTS 1(a) Income Statement 2 1(b) Statement of Financial Position 5 1(c) Cash Flow Statement 9 1(d) Statement of Changes in Equity 12 2 Audit 15 3 Auditors' Report 15 4 Accounting Policies 16 5 Changes in Accounting Policies 16 6 Earnings per Ordinary Share 17 7 Net Asset Value per Share 17 8 Review of Group Performance 18 9 Variance from Prospect Statement 24 10 Prospects 24 11 Dividend 25 12 Statement relating to Dividend 25 13 General Mandate 26 14 Negative Confirmation 26 15 Undertakings from Directors and Executive Officers 26
Transcript of Delfi Limited Unaudited Financial Statements and Dividend...
1
Delfi Limited Unaudited Financial Statements and Dividend Announcement For the 3rd Quarter and Nine Months Ended 30 September 2019
TABLE OF CONTENTS
PART I - INFORMATION REQUIRED FOR ANNOUNCEMENT OF QUARTERLY (1Q, 2Q, 3Q & 4Q), HALF YEAR AND FULL YEAR RESULTS
1(a) Income Statement 2
1(b) Statement of Financial Position 5
1(c) Cash Flow Statement 9
1(d) Statement of Changes in Equity 12
2 Audit 15
3 Auditors' Report 15
4 Accounting Policies 16
5 Changes in Accounting Policies 16
6 Earnings per Ordinary Share 17
7 Net Asset Value per Share 17
8 Review of Group Performance 18
9 Variance from Prospect Statement 24
10 Prospects 24
11 Dividend 25
12 Statement relating to Dividend 25
13 General Mandate 26
14 Negative Confirmation 26
15 Undertakings from Directors and Executive Officers 26

2
1(a) An income statement and statement of comprehensive income, or a statement of comprehensive income, for the group, together with a comparative statement for the corresponding period of the immediately preceding financial year.
Group Group
3Q ended 30 September 9M ended 30 September
2019 2018 Change 2019 2018 Change
Notes US$'000 US$'000 % US$'000 US$'000 %
Revenue 1 112,158 102,692 9.2 352,726 319,103 10.5
Cost of Sales (73,230) (67,908) 7.8 (227,217) (209,651) 8.4
Gross Profit 38,928 34,784 11.9 125,509 109,452 14.7
Other operating income 760 843 (9.8) 2,204 2,667 (17.4)
Expenses
Selling and distribution costs (22,879) (20,989) 9.0 (71,159) (63,196) 12.6
Administrative expenses (6,699) (5,866) 14.2 (19,796) (17,785) 11.3
Finance costs 2 (753) (711) 5.9 (2,821) (2,237) 26.1
Other operating expenses (166) (852) (80.5) (507) (855) (40.7)
Exceptional items 3 (59) (403) (85.4) (242) (855) (71.7)
Share of loss of associated companies and joint ventures (252) (18) 1,331.2 (779) (180) 333.3
Profit before income tax 8,880 6,788 30.8 32,409 27,011 20.0
Income tax expense (2,984) (2,791) 6.9 (11,144) (10,282) 8.4
Total profit 4 5,896 3,997 47.5 21,265 16,729 27.1
Profit/(loss) attributable to:
Equity holders of the Company 5,897 3,997 47.5 21,266 16,730 27.1
Non-controlling interest (1) - NM (1) (1) (29.3)
5,896 3,997 47.5 21,265 16,729 27.1
EBITDA 12,749 10,429 22.2 44,190 37,850 16.8
Earnings per ordinary share (US cents) - Basic and Diluteda
- Exclude exceptional items 0.97 0.72 35.3 3.52 2.88 22.3
- Include exceptional items 0.96 0.65 47.5 3.48 2.74 27.1
Return on equity
- Include exceptional items 13.4% 10.2%c 3.2% pt
- Exclude exceptional itemsb 13.5% 11.2%c 2.3% pt
Notes
a. As there are no potentially dilutive ordinary shares, diluted Earnings per share (EPS) is the same as basic Earnings per Share. EPS is calculated by dividing the net profit attributable to shareholders of the Company by the number of shares of 611,157,000.
b. Computed based on Net Profit excluding the exceptional charges in 9M 2019 and FY2018.
c. Computed based on FY2018 audited figures.
NM - Not meaningful.
3
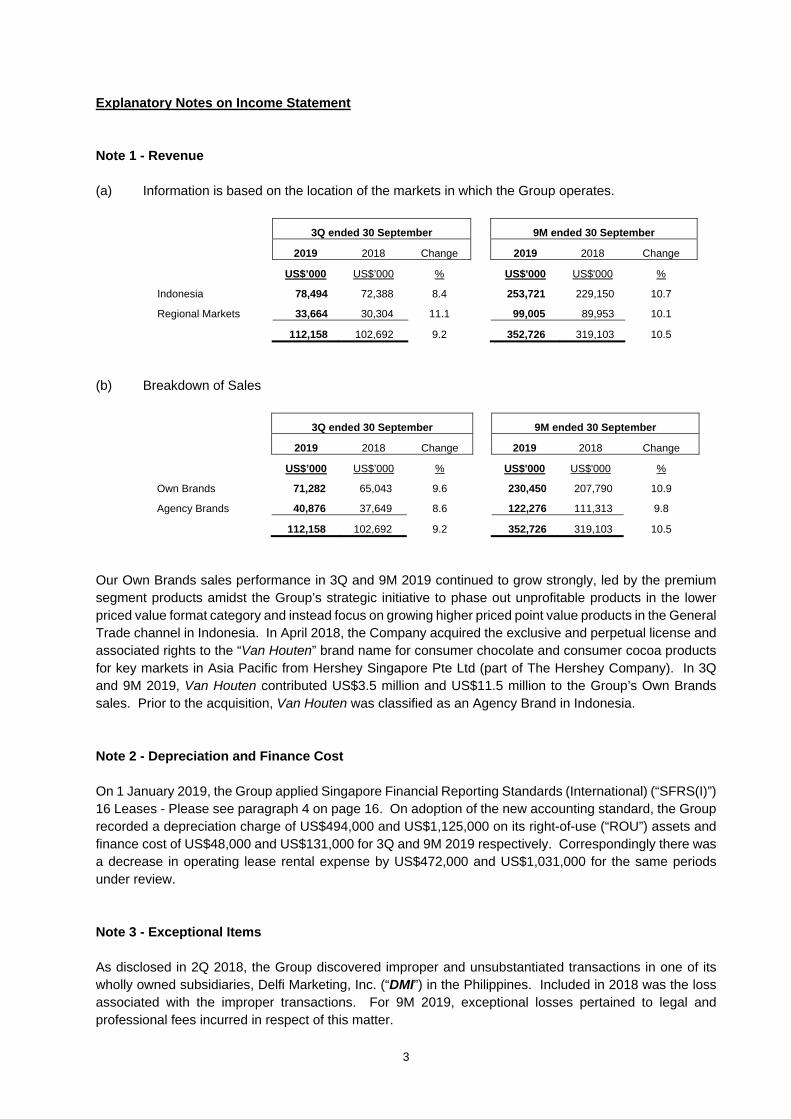
Explanatory Notes on Income Statement Note 1 - Revenue
(a) Information is based on the location of the markets in which the Group operates.
3Q ended 30 September 9M ended 30 September
2019 2018 Change 2019 2018 Change
US$’000 US$’000 % US$'000 US$'000 %
Indonesia 78,494 72,388 8.4 253,721 229,150 10.7
Regional Markets 33,664 30,304 11.1 99,005 89,953 10.1
112,158 102,692 9.2 352,726 319,103 10.5
(b) Breakdown of Sales
3Q ended 30 September 9M ended 30 September
2019 2018 Change 2019 2018 Change
US$’000 US$’000 % US$'000 US$'000 %
Own Brands 71,282 65,043 9.6 230,450 207,790 10.9
Agency Brands 40,876 37,649 8.6 122,276 111,313 9.8
112,158 102,692 9.2 352,726 319,103 10.5
Our Own Brands sales performance in 3Q and 9M 2019 continued to grow strongly, led by the premium segment products amidst the Group’s strategic initiative to phase out unprofitable products in the lower priced value format category and instead focus on growing higher priced point value products in the General Trade channel in Indonesia. In April 2018, the Company acquired the exclusive and perpetual license and associated rights to the “Van Houten” brand name for consumer chocolate and consumer cocoa products for key markets in Asia Pacific from Hershey Singapore Pte Ltd (part of The Hershey Company). In 3Q and 9M 2019, Van Houten contributed US$3.5 million and US$11.5 million to the Group’s Own Brands sales. Prior to the acquisition, Van Houten was classified as an Agency Brand in Indonesia. Note 2 - Depreciation and Finance Cost On 1 January 2019, the Group applied Singapore Financial Reporting Standards (International) (“SFRS(I)”) 16 Leases - Please see paragraph 4 on page 16. On adoption of the new accounting standard, the Group recorded a depreciation charge of US$494,000 and US$1,125,000 on its right-of-use (“ROU”) assets and finance cost of US$48,000 and US$131,000 for 3Q and 9M 2019 respectively. Correspondingly there was a decrease in operating lease rental expense by US$472,000 and US$1,031,000 for the same periods under review. Note 3 - Exceptional Items As disclosed in 2Q 2018, the Group discovered improper and unsubstantiated transactions in one of its wholly owned subsidiaries, Delfi Marketing, Inc. (“DMI”) in the Philippines. Included in 2018 was the loss associated with the improper transactions. For 9M 2019, exceptional losses pertained to legal and professional fees incurred in respect of this matter.
4
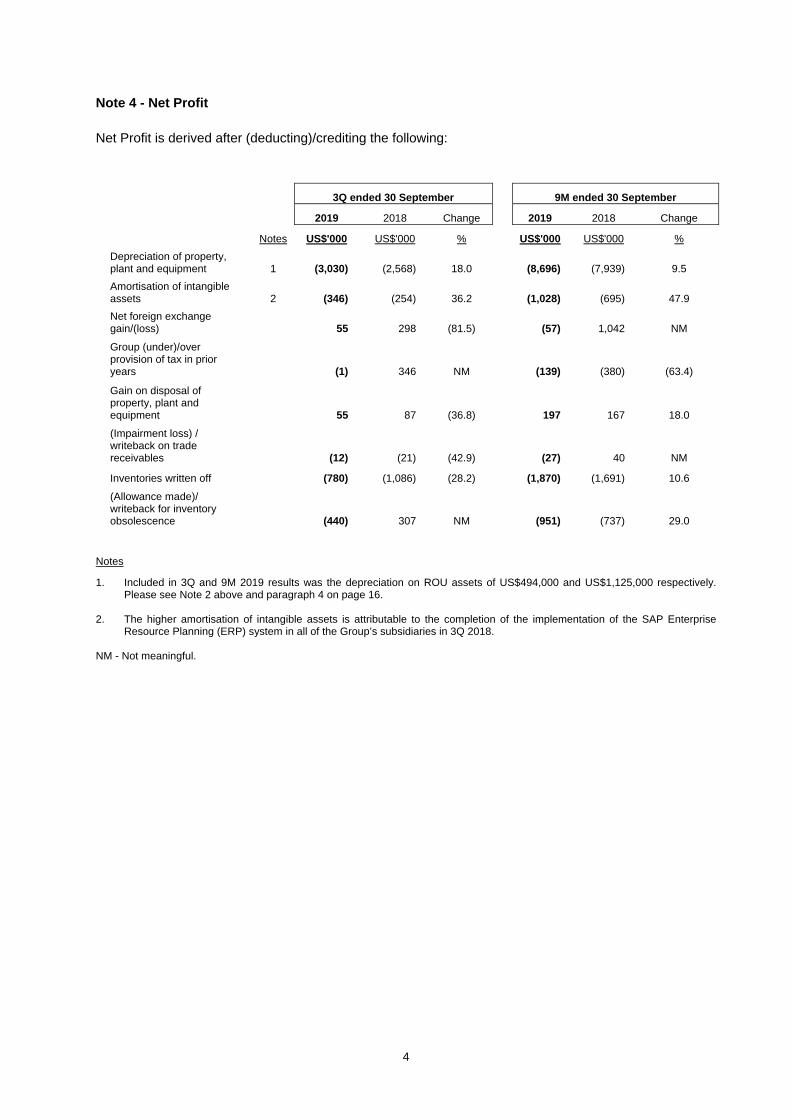
Note 4 - Net Profit
Net Profit is derived after (deducting)/crediting the following:
3Q ended 30 September 9M ended 30 September
2019 2018 Change 2019 2018 Change
Notes US$'000 US$'000 % US$'000 US$'000 %
Depreciation of property, plant and equipment 1 (3,030) (2,568) 18.0 (8,696) (7,939) 9.5
Amortisation of intangible assets 2 (346) (254) 36.2 (1,028) (695) 47.9
Net foreign exchange gain/(loss) 55 298 (81.5) (57) 1,042 NM
Group (under)/over provision of tax in prior years (1) 346 NM (139) (380) (63.4)
Gain on disposal of property, plant and equipment 55 87 (36.8) 197 167 18.0
(Impairment loss) / writeback on trade receivables (12) (21) (42.9) (27) 40 NM
Inventories written off (780) (1,086) (28.2) (1,870) (1,691) 10.6
(Allowance made)/ writeback for inventory obsolescence (440) 307 NM (951) (737) 29.0
Notes
1. Included in 3Q and 9M 2019 results was the depreciation on ROU assets of US$494,000 and US$1,125,000 respectively. Please see Note 2 above and paragraph 4 on page 16.
2. The higher amortisation of intangible assets is attributable to the completion of the implementation of the SAP Enterprise
Resource Planning (ERP) system in all of the Group’s subsidiaries in 3Q 2018. NM - Not meaningful.
5
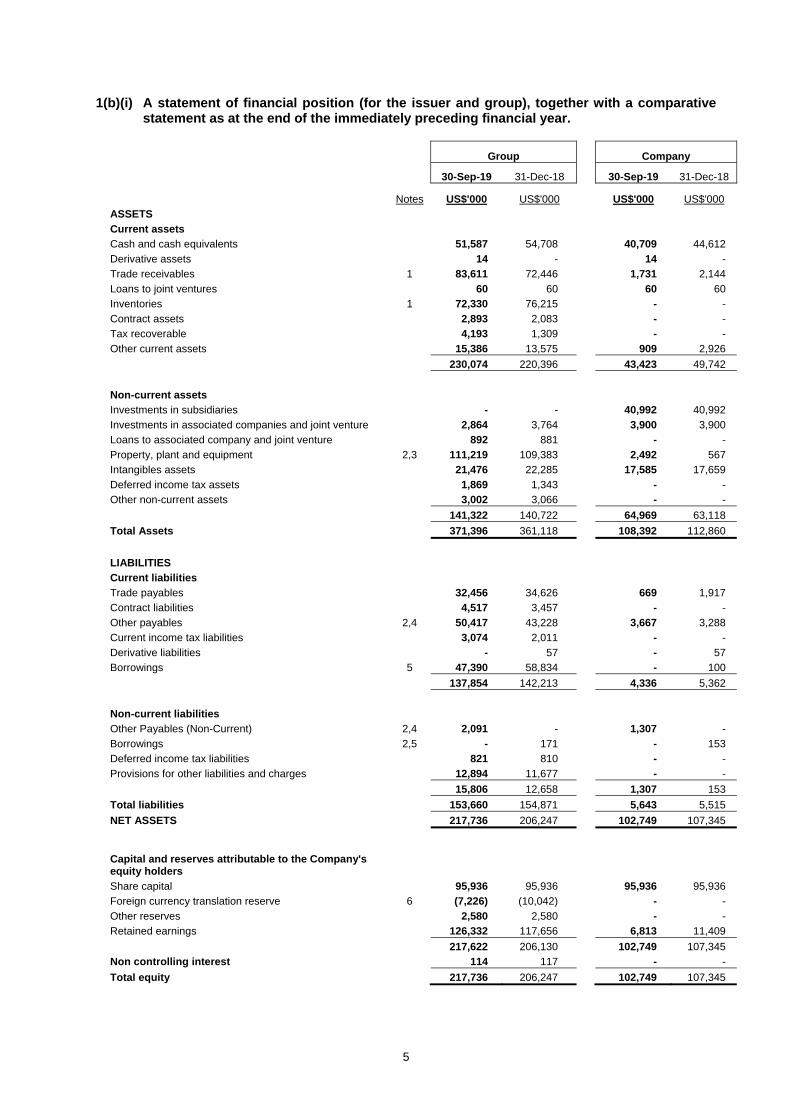
1(b)(i) A statement of financial position (for the issuer and group), together with a comparative statement as at the end of the immediately preceding financial year.
Group Company
30-Sep-19 31-Dec-18 30-Sep-19 31-Dec-18
Notes US$'000 US$'000 US$'000 US$'000
ASSETS
Current assets
Cash and cash equivalents 51,587 54,708 40,709 44,612
Derivative assets 14 - 14 -
Trade receivables 1 83,611 72,446 1,731 2,144
Loans to joint ventures 60 60 60 60
Inventories 1 72,330 76,215 - -
Contract assets 2,893 2,083 - -
Tax recoverable 4,193 1,309 - -
Other current assets 15,386 13,575 909 2,926
230,074 220,396 43,423 49,742
Non-current assets
Investments in subsidiaries - - 40,992 40,992
Investments in associated companies and joint venture 2,864 3,764 3,900 3,900
Loans to associated company and joint venture 892 881 - -
Property, plant and equipment 2,3 111,219 109,383 2,492 567
Intangibles assets 21,476 22,285 17,585 17,659
Deferred income tax assets 1,869 1,343 - -
Other non-current assets 3,002 3,066 - -
141,322 140,722 64,969 63,118
Total Assets 371,396 361,118 108,392 112,860
LIABILITIES
Current liabilities
Trade payables 32,456 34,626 669 1,917
Contract liabilities 4,517 3,457 - -
Other payables 2,4 50,417 43,228 3,667 3,288
Current income tax liabilities 3,074 2,011 - -
Derivative liabilities - 57 - 57
Borrowings 5 47,390 58,834 - 100
137,854 142,213 4,336 5,362
Non-current liabilities
Other Payables (Non-Current) 2,4 2,091 - 1,307 -
Borrowings 2,5 - 171 - 153
Deferred income tax liabilities 821 810 - -
Provisions for other liabilities and charges 12,894 11,677 - -
15,806 12,658 1,307 153
Total liabilities 153,660 154,871 5,643 5,515
NET ASSETS 217,736 206,247 102,749 107,345
Capital and reserves attributable to the Company's equity holders
Share capital 95,936 95,936 95,936 95,936
Foreign currency translation reserve 6 (7,226) (10,042) - -
Other reserves 2,580 2,580 - -
Retained earnings 126,332 117,656 6,813 11,409
217,622 206,130 102,749 107,345
Non controlling interest 114 117 - -
Total equity 217,736 206,247 102,749 107,345

6
Explanatory Notes on Statement of Financial Position Note 1 - Trade Receivables and Inventories Compared to end-2018, the higher trade receivables at end-September 2019 is in line with the higher sales generated over 9M 2019, especially to our Modern Trade customers. In Indonesia, the Group is progressively extending its direct shipment initiative to its Modern Trade customers’ distribution centres in order to improve the service levels to these customers. The increase in trade receivables was partially offset by lower inventories of US$3.9 million. Note 2 - ROU Assets and Lease Liabilities As at 30 September 2019, amounts recognised in the balance sheet after adoption of “SFRS (I) 16 - Leases” are as follows:
Group Company
US$'000 US$'000
Property, plant and equipment
Right-of-use assets, net of depreciation 3,947 2,268
Other payables
Lease liabilities - Current 1,539 648
Lease liabilities - Non-current 2,091 1,307 Included in the carrying amounts of property, plant and equipment and other payables as at 30 September 2019 were the ROU assets acquired under the Group’s finance leases of US$0.3 million and its corresponding lease liabilities of US$0.2 million respectively. Please see paragraph 4 on page 16. Note 3 - Capital Expenditure on Property, Plant and Equipment and Intangible Assets (Software) The allocation of capital expenditure for 3Q and 9M 2019 by geographical region is as follows:
3Q 2019 3Q 2018 9M 2019 9M 2018
US$'000 US$'000
US$'000 US$'000
Indonesia 1,158 870
2,983 2,377
Regional Markets 2,502 1,746 2,973 2,641
3,660 2,616 5,956 5,018
The 3Q 2019 Capex for the Regional Markets included US$2.0 million addition to ROU assets from the lease of office space. Note 4 - Other Payables In line with the higher sales achieved, accrued operating expenses increased during 9M 2019. This comprised mainly: (1) advertising and promotion expenses incurred (which forms part of the trading terms) for the Modern Trade channel in Indonesia; and (2) freight cost. Included in other payables were lease liabilities recognised under “SFRS(I) 16 - Leases” as disclosed in Note 2 above.
7
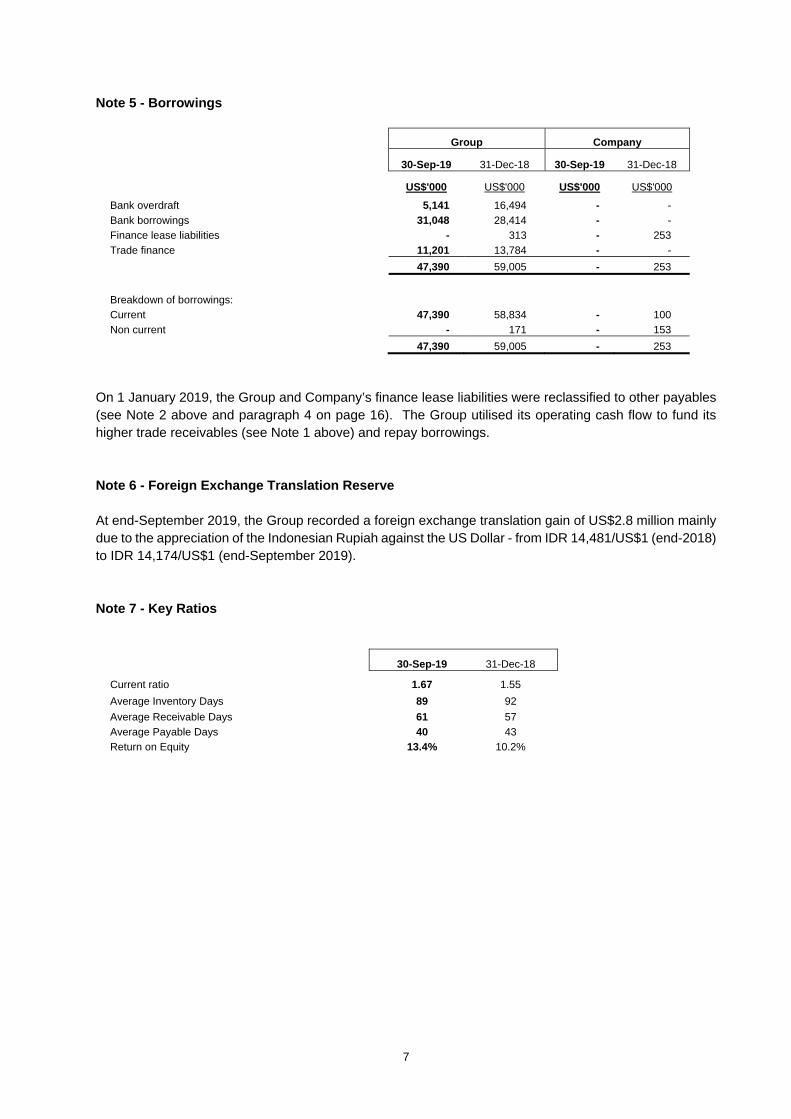
Note 5 - Borrowings
Group Company
30-Sep-19 31-Dec-18 30-Sep-19 31-Dec-18
US$'000 US$'000 US$'000 US$'000
Bank overdraft 5,141 16,494 - -
Bank borrowings 31,048 28,414 - -
Finance lease liabilities - 313 - 253
Trade finance 11,201 13,784 - -
47,390 59,005 - 253
Breakdown of borrowings:
Current 47,390 58,834 - 100
Non current - 171 - 153
47,390 59,005 - 253
On 1 January 2019, the Group and Company’s finance lease liabilities were reclassified to other payables (see Note 2 above and paragraph 4 on page 16). The Group utilised its operating cash flow to fund its higher trade receivables (see Note 1 above) and repay borrowings. Note 6 - Foreign Exchange Translation Reserve At end-September 2019, the Group recorded a foreign exchange translation gain of US$2.8 million mainly due to the appreciation of the Indonesian Rupiah against the US Dollar - from IDR 14,481/US$1 (end-2018) to IDR 14,174/US$1 (end-September 2019). Note 7 - Key Ratios
30-Sep-19 31-Dec-18
Current ratio 1.67 1.55
Average Inventory Days 89 92
Average Receivable Days 61 57
Average Payable Days 40 43
Return on Equity 13.4% 10.2%

8
1(b)(ii) In relation to the aggregate amount of the group’s borrowings and debt securities, specify the following as at the end of the current financial period reported on with comparative figures as at the end of the immediately preceding financial year:
(a) the amount repayable in one year or less, or on demand (b) the amount repayable after one year; (c) whether the amounts are secured or unsecured; and (d) details of any collaterals.
Aggregate amount of the group’s borrowings and debt securities
Group Company
30-Sep-19 31-Dec-18 30-Sep-19 31-Dec-18
US$’000 US$’000 US$’000 US$’000
Amount repayable in one year or less, or on demand
- Secured 16,293 18,194 - 100
- Unsecured 31,097 40,640 - -
47,390 58,834 - 100
Amount repayable after one year
- Secured - 171 - 153
- Unsecured - - - -
- 171 - 153
Details of collateral Of the Group’s total bank borrowings at 30 September 2019, US$16.3 million (2018: US$18.4 million) are secured on inventories, property, plant and equipment and building of certain subsidiaries of the Group.
9
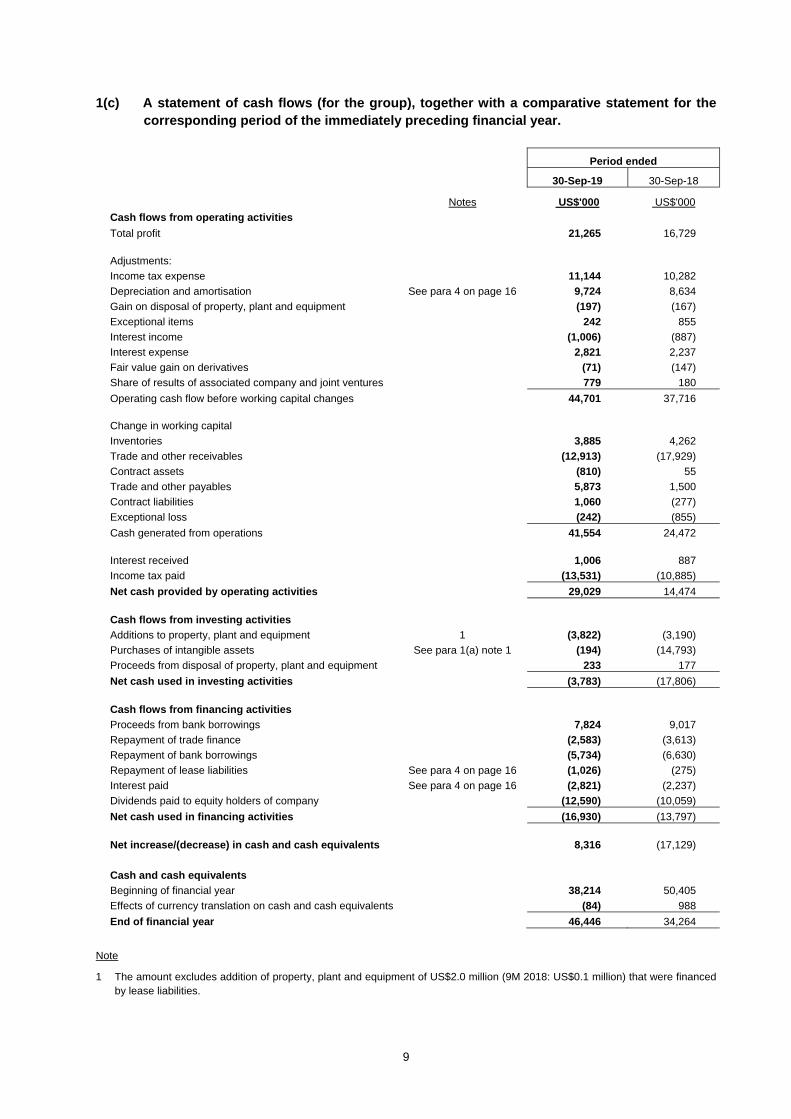
1(c) A statement of cash flows (for the group), together with a comparative statement for the corresponding period of the immediately preceding financial year.
Period ended
30-Sep-19 30-Sep-18
Notes US$'000 US$'000
Cash flows from operating activities
Total profit 21,265 16,729
Adjustments:
Income tax expense 11,144 10,282
Depreciation and amortisation See para 4 on page 16 9,724 8,634
Gain on disposal of property, plant and equipment (197) (167)
Exceptional items 242 855
Interest income (1,006) (887)
Interest expense 2,821 2,237
Fair value gain on derivatives (71) (147)
Share of results of associated company and joint ventures 779 180
Operating cash flow before working capital changes 44,701 37,716
Change in working capital
Inventories 3,885 4,262
Trade and other receivables (12,913) (17,929)
Contract assets (810) 55
Trade and other payables 5,873 1,500
Contract liabilities 1,060 (277)
Exceptional loss (242) (855)
Cash generated from operations 41,554 24,472
Interest received 1,006 887
Income tax paid (13,531) (10,885)
Net cash provided by operating activities 29,029 14,474
Cash flows from investing activities
Additions to property, plant and equipment 1 (3,822) (3,190)
Purchases of intangible assets See para 1(a) note 1 (194) (14,793)
Proceeds from disposal of property, plant and equipment 233 177
Net cash used in investing activities (3,783) (17,806)
Cash flows from financing activities
Proceeds from bank borrowings 7,824 9,017
Repayment of trade finance (2,583) (3,613)
Repayment of bank borrowings (5,734) (6,630)
Repayment of lease liabilities See para 4 on page 16 (1,026) (275)
Interest paid See para 4 on page 16 (2,821) (2,237)
Dividends paid to equity holders of company (12,590) (10,059)
Net cash used in financing activities (16,930) (13,797)
Net increase/(decrease) in cash and cash equivalents 8,316 (17,129)
Cash and cash equivalents
Beginning of financial year 38,214 50,405
Effects of currency translation on cash and cash equivalents (84) 988
End of financial year 46,446 34,264
Note
1 The amount excludes addition of property, plant and equipment of US$2.0 million (9M 2018: US$0.1 million) that were financed by lease liabilities.
10
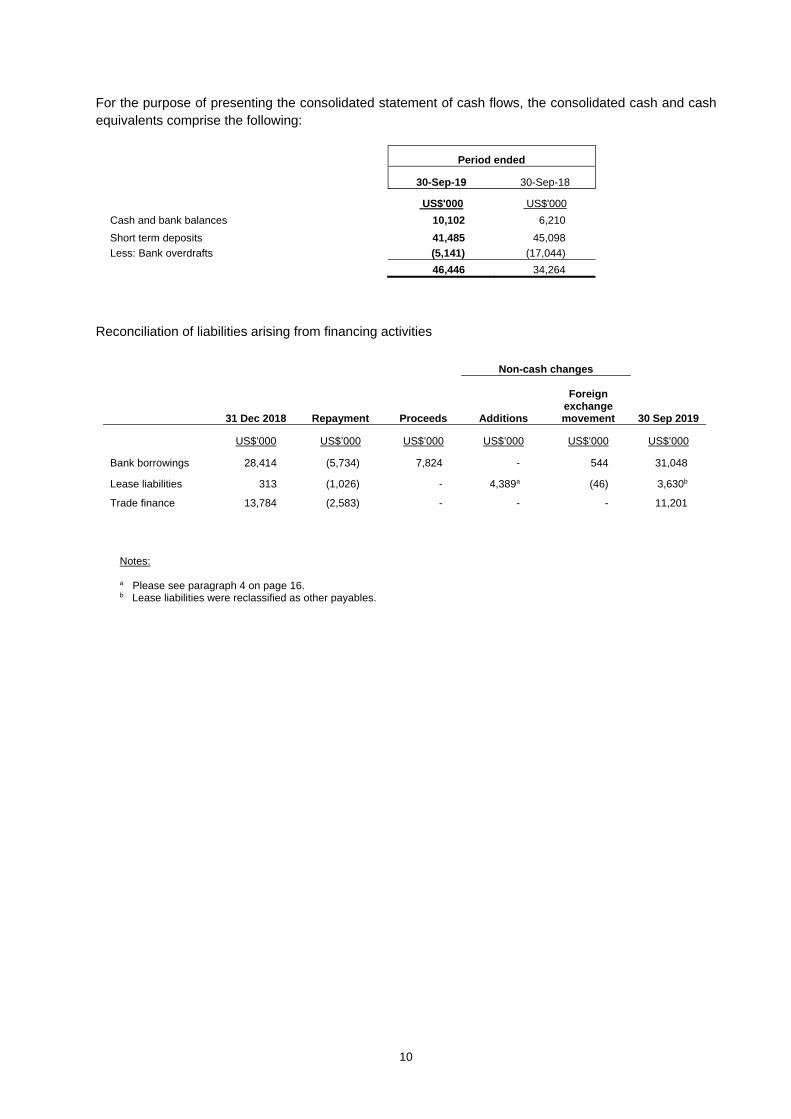
For the purpose of presenting the consolidated statement of cash flows, the consolidated cash and cash equivalents comprise the following:
Period ended
30-Sep-19 30-Sep-18
US$'000 US$'000
Cash and bank balances 10,102 6,210
Short term deposits 41,485 45,098
Less: Bank overdrafts (5,141) (17,044)
46,446 34,264
Reconciliation of liabilities arising from financing activities
Non-cash changes
31 Dec 2018 Repayment Proceeds Additions
Foreign exchange movement 30 Sep 2019
US$’000 US$’000 US$’000 US$’000 US$’000 US$’000
Bank borrowings 28,414 (5,734) 7,824 - 544 31,048
Lease liabilities 313 (1,026) - 4,389a (46) 3,630b
Trade finance 13,784 (2,583) - - - 11,201
Notes:
a Please see paragraph 4 on page 16. b Lease liabilities were reclassified as other payables.
11
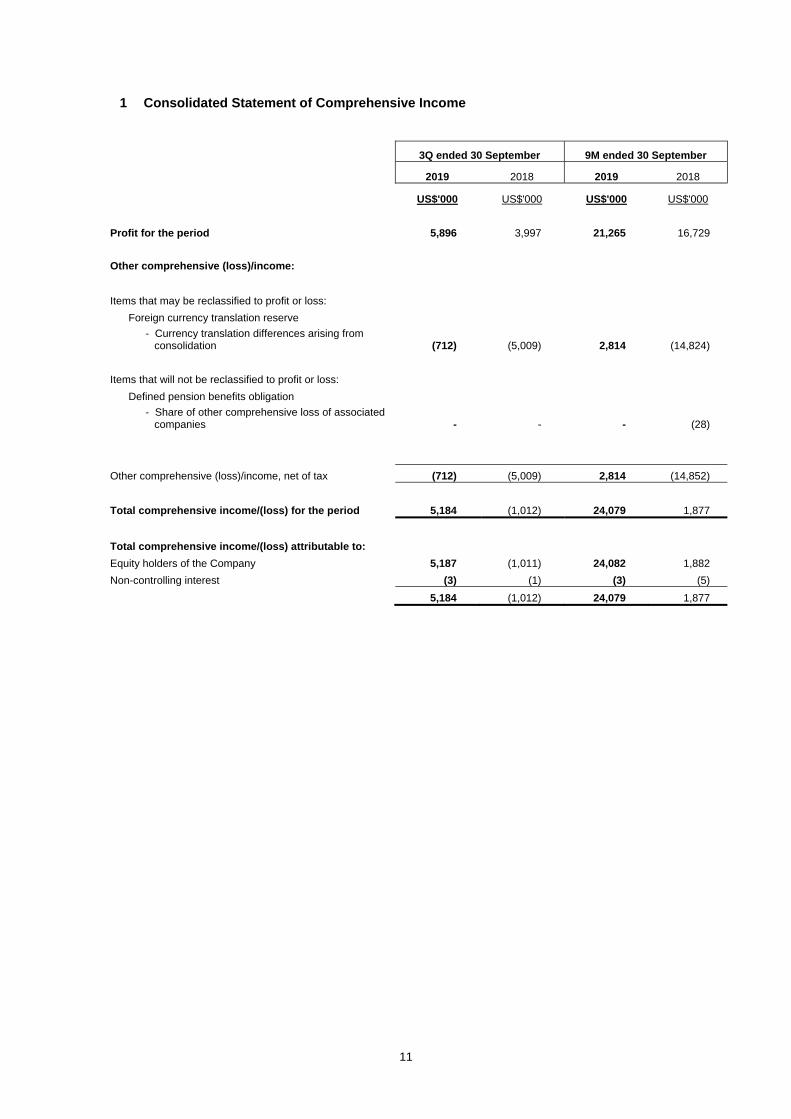
1 Consolidated Statement of Comprehensive Income
3Q ended 30 September 9M ended 30 September
2019 2018 2019 2018
US$'000 US$'000 US$'000 US$'000
Profit for the period 5,896 3,997 21,265 16,729
Other comprehensive (loss)/income:
Items that may be reclassified to profit or loss:
Foreign currency translation reserve
- Currency translation differences arising from consolidation (712) (5,009) 2,814 (14,824)
Items that will not be reclassified to profit or loss:
Defined pension benefits obligation
- Share of other comprehensive loss of associated companies - - - (28)
Other comprehensive (loss)/income, net of tax (712) (5,009) 2,814 (14,852)
Total comprehensive income/(loss) for the period 5,184 (1,012) 24,079 1,877
Total comprehensive income/(loss) attributable to:
Equity holders of the Company 5,187 (1,011) 24,082 1,882
Non-controlling interest (3) (1) (3) (5)
5,184 (1,012) 24,079 1,877
12
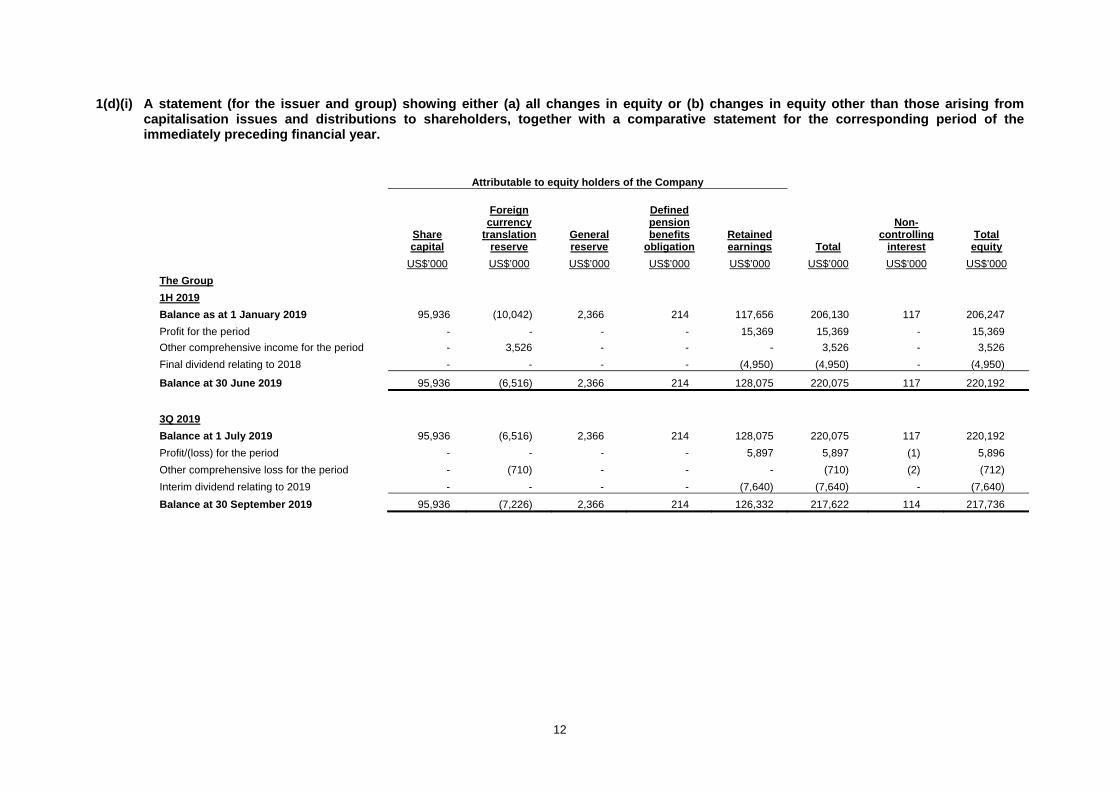
1(d)(i) A statement (for the issuer and group) showing either (a) all changes in equity or (b) changes in equity other than those arising from capitalisation issues and distributions to shareholders, together with a comparative statement for the corresponding period of the immediately preceding financial year.
Attributable to equity holders of the Company
Share capital
Foreign currency
translation reserve
General reserve
Defined pension benefits
obligation Retained earnings Total
Non-controlling
interest Total
equity
US$’000 US$’000 US$’000 US$’000 US$’000 US$’000 US$’000 US$’000
The Group
1H 2019
Balance as at 1 January 2019 95,936 (10,042) 2,366 214 117,656 206,130 117 206,247
Profit for the period - - - - 15,369 15,369 - 15,369
Other comprehensive income for the period - 3,526 - - - 3,526 - 3,526
Final dividend relating to 2018 - - - - (4,950) (4,950) - (4,950)
Balance at 30 June 2019 95,936 (6,516) 2,366 214 128,075 220,075 117 220,192
3Q 2019
Balance at 1 July 2019 95,936 (6,516) 2,366 214 128,075 220,075 117 220,192
Profit/(loss) for the period - - - - 5,897 5,897 (1) 5,896
Other comprehensive loss for the period - (710) - - - (710) (2) (712)
Interim dividend relating to 2019 - - - - (7,640) (7,640) - (7,640)
Balance at 30 September 2019 95,936 (7,226) 2,366 214 126,332 217,622 114 217,736
13
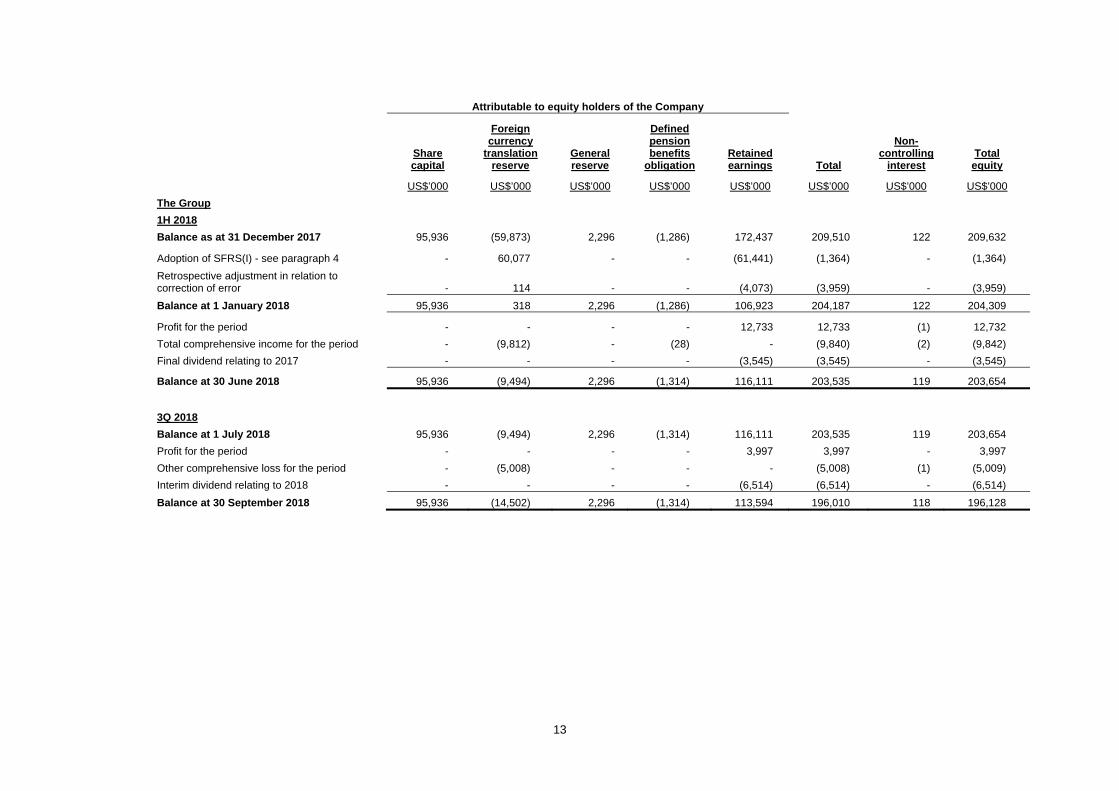
Attributable to equity holders of the Company
Share capital
Foreign currency
translation reserve
General reserve
Defined pension benefits
obligation Retained earnings Total
Non-controlling
interest Total
equity
US$’000 US$’000 US$’000 US$’000 US$’000 US$’000 US$’000 US$’000
The Group
1H 2018
Balance as at 31 December 2017 95,936 (59,873) 2,296 (1,286) 172,437 209,510 122 209,632
Adoption of SFRS(I) - see paragraph 4 - 60,077 - - (61,441) (1,364) - (1,364)
Retrospective adjustment in relation to correction of error - 114 - - (4,073) (3,959) - (3,959)
Balance at 1 January 2018 95,936 318 2,296 (1,286) 106,923 204,187 122 204,309
Profit for the period - - - - 12,733 12,733 (1) 12,732
Total comprehensive income for the period - (9,812) - (28) - (9,840) (2) (9,842)
Final dividend relating to 2017 - - - - (3,545) (3,545) - (3,545)
Balance at 30 June 2018 95,936 (9,494) 2,296 (1,314) 116,111 203,535 119 203,654
3Q 2018
Balance at 1 July 2018 95,936 (9,494) 2,296 (1,314) 116,111 203,535 119 203,654
Profit for the period - - - - 3,997 3,997 - 3,997
Other comprehensive loss for the period - (5,008) - - - (5,008) (1) (5,009)
Interim dividend relating to 2018 - - - - (6,514) (6,514) - (6,514)
Balance at 30 September 2018 95,936 (14,502) 2,296 (1,314) 113,594 196,010 118 196,128

14
Statement of Changes in Equity for the Company
Attributable to equity holders of the Company
Share capital
Retained earnings
Total equity
US$’000 US$’000 US$’000
The Company
1H 2019
Balance as at 1 January 2019 95,936 11,409 107,345
Profit for the period - 8,109 8,109
Final dividend relating to 2018 - (4,950) (4,950)
Balance at 30 June 2019 95,936 14,568 110,504
3Q 2019
Balance at 1 July 2019 95,936 14,568 110,504
Profit for the period - (115) (115)
Interim dividend relating to 2019 - (7,640) (7,640)
Balance at 30 September 2019 95,936 6,813 102,749
Attributable to equity holders of the Company
Share capital
Retained earnings
Total equity
US$’000 US$’000 US$’000
The Company
1H 2018
Balance at 1 January 2018 95,936 8,765 104,701
Profit for the period - 4,055 4,055
Final dividend relating to 2017 - (3,545) (3,545)
Balance at 30 June 2018 95,936 9,275 105,211
3Q 2018
Balance at 1 July 2018 95,936 9,275 105,211
Profit for the period - 3,189 3,189
Interim dividend relating to 2018 - (6,514) (6,514)
Balance at 30 September 2018 95,936 5,950 101,886

15
1(d)(ii) Details of any changes in the company’s share capital arising from rights issue, bonus issue, share buy-backs, exercise of share options or warrants, conversion of other issues of equity securities, issue of shares for cash or as consideration for acquisition or for any other purpose since the end of the previous period reported on. State the number of shares that may be issued on conversion of all the outstanding convertibles, if any, against the total number of issued shares excluding treasury shares and subsidiary holdings of the issuer, as at the end of the current financial period reported on and as at the end of the corresponding period of the immediately preceding financial year. State also the number of shares held as treasury shares and the number of subsidiary holdings, if any, and the percentage of the aggregate number of treasury shares and subsidiary holdings held against the total number of shares outstanding in a class that is listed as at the end of the current financial period reported on and as at the end of the corresponding period of the immediately preceding financial year.
For 3Q and 9M ended 30 September 2019, there was no change in the Company’s issued and paid up share capital.
The Company has not issued any convertibles nor holds any treasury shares. There is no subsidiary holdings held against the total number of shares outstanding in a class that is listed.
1(d)(iii) To show the total number of issued shares excluding treasury shares as at the end of the
current financial period and as at the end of the immediately preceding year. The Company’s total number of issued shares is 611,157,000. 1(d)(iv) A statement showing all sales, transfers, cancellation and/or use of treasury shares as at
the end of the current financial period reported on.
Not applicable - See para 1(d)(ii) above.
1(d)(v) A statement showing all sales, transfers, cancellation and/or use of subsidiary holdings as at the end of the current financial period reported on.
Not applicable - See para 1(d)(ii) above. 2. Whether the figures have been audited or reviewed, and in accordance with which auditing
standard or practice. The figures have not been audited or reviewed. 3. Whether the figures have been audited or reviewed, the auditors’ report (including any
qualifications or emphasis of a matter). Not applicable.
16
4. Whether the same accounting policies and methods of computation as in the issuer’s most recently audited annual financial statements have been applied. The accounting policies and methods of computation are the same as the Company’s audited financial statements for the financial year ended 31 December 2018 except for the adoption of “SFRS(I) 16 - Leases” which took effect on 1 January 2019 as described below: In adopting SFRS (I) 16, the Group has applied the simplified transition approach and has not restated the comparative amounts for 2018. Leases are recognised as a ROU assets and corresponding lease liabilities at the date of which leased asset is available for use by the Group. ROU assets for operating leases were measured at the amount equal to the lease liability, adjusted by the amount of any prepaid or accrual lease payments relating to the lease recognized on the balance sheet as at 31 December 2018. Lease liabilities were measured at the present value of the remaining lease payments, discounted using applicable incremental borrowing rates as of 1 January 2019. As a result, the Group recognised ROU assets (classified as property, plant and equipment) and lease liabilities (classified as other payables) of US$2,383,000 and US$2,343,000 respectively on 1 January 2019 (after adjustments for prepayments). The Group has also reclassified its assets acquired under finance leases of US$1,477,000 and its corresponding lease liabilities of US$313,000 as at 1 January 2019 to ROU assets and other payables respectively for consistency in financial presentation. Each lease payment is then allocated between the liability and finance cost. The finance cost is charged to profit or loss over the lease period so as to produce a constant periodic rate of interest on the remaining balance of the liability for each period. The ROU asset is depreciated over the shorter of the asset’s useful life and the lease term on a straight-line basis. The adoption of SFRS(I) 16 is not expected to have a material impact on the Group’s profit or loss.
5. If there are any changes in the accounting policies and methods of computation, including
any required by an accounting standard, what has changed, as well as the reasons for, and the effect of, the change.
Please refer to paragraph 4 above.
17
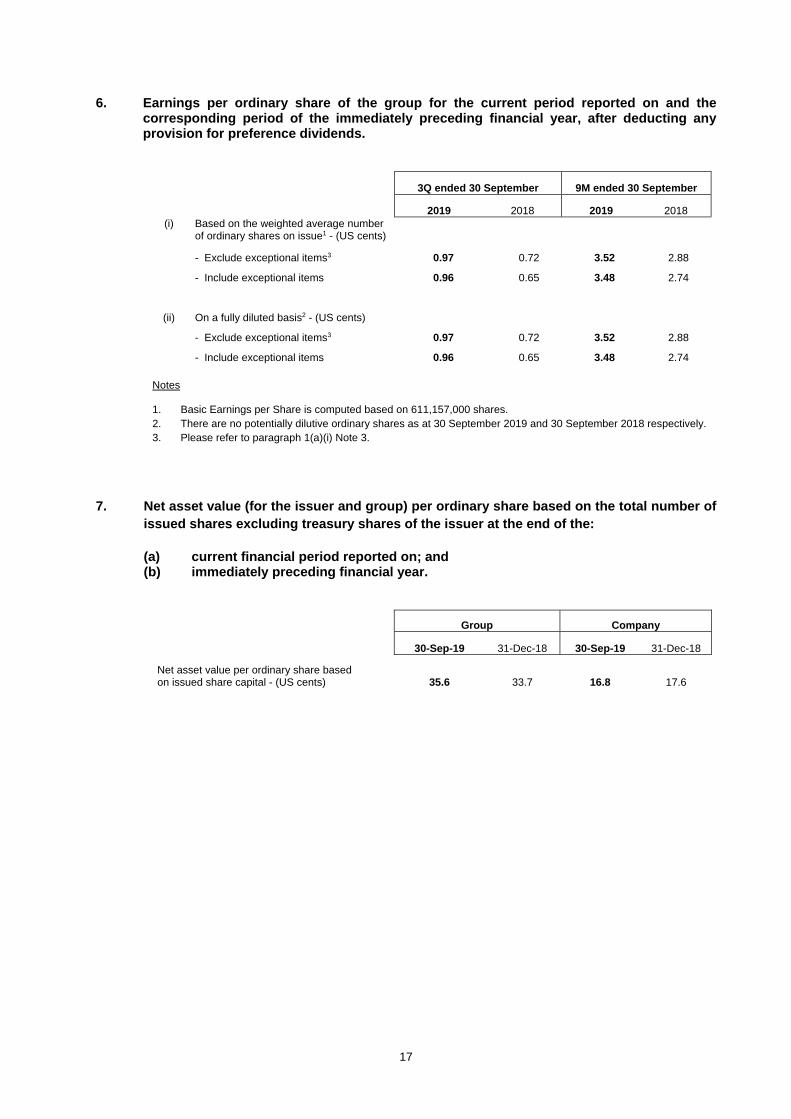
6. Earnings per ordinary share of the group for the current period reported on and the corresponding period of the immediately preceding financial year, after deducting any provision for preference dividends.
3Q ended 30 September 9M ended 30 September
2019 2018 2019 2018 (i) Based on the weighted average number
of ordinary shares on issue1 - (US cents)
- Exclude exceptional items3 0.97 0.72 3.52 2.88
- Include exceptional items 0.96 0.65 3.48 2.74
(ii) On a fully diluted basis2 - (US cents)
- Exclude exceptional items3 0.97 0.72 3.52 2.88
- Include exceptional items 0.96 0.65 3.48 2.74
Notes 1. Basic Earnings per Share is computed based on 611,157,000 shares. 2. There are no potentially dilutive ordinary shares as at 30 September 2019 and 30 September 2018 respectively. 3. Please refer to paragraph 1(a)(i) Note 3.
7. Net asset value (for the issuer and group) per ordinary share based on the total number of
issued shares excluding treasury shares of the issuer at the end of the: (a) current financial period reported on; and (b) immediately preceding financial year.
Group Company
30-Sep-19 31-Dec-18 30-Sep-19 31-Dec-18
Net asset value per ordinary share based on issued share capital - (US cents) 35.6 33.7 16.8 17.6
18
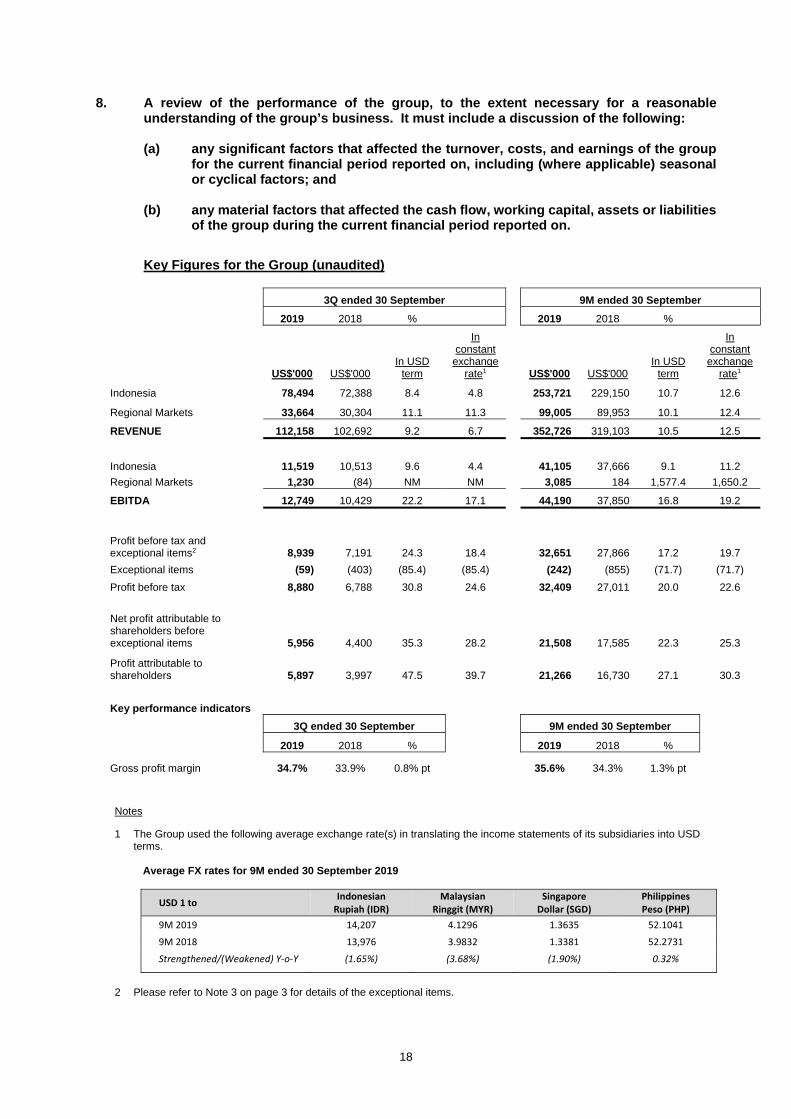
8. A review of the performance of the group, to the extent necessary for a reasonable understanding of the group’s business. It must include a discussion of the following:
(a) any significant factors that affected the turnover, costs, and earnings of the group
for the current financial period reported on, including (where applicable) seasonal or cyclical factors; and
(b) any material factors that affected the cash flow, working capital, assets or liabilities
of the group during the current financial period reported on. Key Figures for the Group (unaudited)
3Q ended 30 September 9M ended 30 September 2019 2018 % 2019 2018 %
US$'000 US$'000 In USD
term
In constant
exchange rate1 US$'000 US$'000
In USD term
In constant
exchange rate1
Indonesia 78,494 72,388 8.4 4.8 253,721 229,150 10.7 12.6
Regional Markets 33,664 30,304 11.1 11.3 99,005 89,953 10.1 12.4
REVENUE 112,158 102,692 9.2 6.7 352,726 319,103 10.5 12.5
Indonesia 11,519 10,513 9.6 4.4 41,105 37,666 9.1 11.2
Regional Markets 1,230 (84) NM NM 3,085 184 1,577.4 1,650.2
EBITDA 12,749 10,429 22.2 17.1 44,190 37,850 16.8 19.2
Profit before tax and exceptional items2 8,939 7,191 24.3 18.4 32,651 27,866 17.2 19.7
Exceptional items (59) (403) (85.4) (85.4) (242) (855) (71.7) (71.7)
Profit before tax 8,880 6,788 30.8 24.6 32,409 27,011 20.0 22.6
Net profit attributable to shareholders before exceptional items 5,956 4,400 35.3 28.2 21,508 17,585 22.3 25.3
Profit attributable to shareholders 5,897 3,997 47.5 39.7 21,266 16,730 27.1 30.3
Key performance indicators
3Q ended 30 September 9M ended 30 September
2019 2018 % 2019 2018 %
Gross profit margin 34.7% 33.9% 0.8% pt 35.6% 34.3% 1.3% pt
Notes 1 The Group used the following average exchange rate(s) in translating the income statements of its subsidiaries into USD
terms.
Average FX rates for 9M ended 30 September 2019
USD 1 to IndonesianRupiah (IDR)
MalaysianRinggit (MYR)
Singapore Dollar (SGD)
PhilippinesPeso (PHP)
9M 2019 14,207 4.1296 1.3635 52.1041
9M 2018 13,976 3.9832 1.3381 52.2731
Strengthened/(Weakened) Y‐o‐Y (1.65%) (3.68%) (1.90%) 0.32%
2 Please refer to Note 3 on page 3 for details of the exceptional items.
19
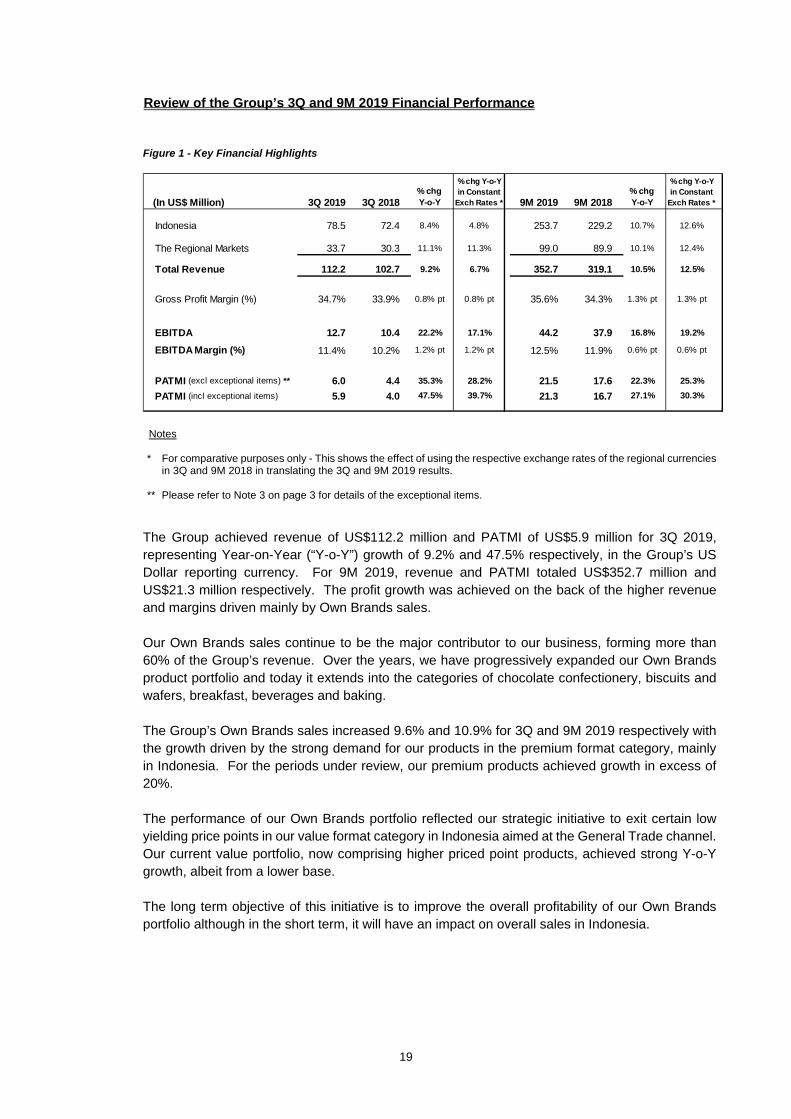
Review of the Group’s 3Q and 9M 2019 Financial Performance Figure 1 - Key Financial Highlights
Notes * For comparative purposes only - This shows the effect of using the respective exchange rates of the regional currencies
in 3Q and 9M 2018 in translating the 3Q and 9M 2019 results. ** Please refer to Note 3 on page 3 for details of the exceptional items.
The Group achieved revenue of US$112.2 million and PATMI of US$5.9 million for 3Q 2019, representing Year-on-Year (“Y-o-Y”) growth of 9.2% and 47.5% respectively, in the Group’s US Dollar reporting currency. For 9M 2019, revenue and PATMI totaled US$352.7 million and US$21.3 million respectively. The profit growth was achieved on the back of the higher revenue and margins driven mainly by Own Brands sales. Our Own Brands sales continue to be the major contributor to our business, forming more than 60% of the Group’s revenue. Over the years, we have progressively expanded our Own Brands product portfolio and today it extends into the categories of chocolate confectionery, biscuits and wafers, breakfast, beverages and baking. The Group’s Own Brands sales increased 9.6% and 10.9% for 3Q and 9M 2019 respectively with the growth driven by the strong demand for our products in the premium format category, mainly in Indonesia. For the periods under review, our premium products achieved growth in excess of 20%. The performance of our Own Brands portfolio reflected our strategic initiative to exit certain low yielding price points in our value format category in Indonesia aimed at the General Trade channel. Our current value portfolio, now comprising higher priced point products, achieved strong Y-o-Y growth, albeit from a lower base. The long term objective of this initiative is to improve the overall profitability of our Own Brands portfolio although in the short term, it will have an impact on overall sales in Indonesia.
(In US$ Million) 3Q 2019 3Q 2018 9M 2019 9M 2018
Indonesia 78.5 72.4 8.4% 4.8% 253.7 229.2 10.7% 12.6%
The Regional Markets 33.7 30.3 11.1% 11.3% 99.0 89.9 10.1% 12.4%
Total Revenue 112.2 102.7 9.2% 6.7% 352.7 319.1 10.5% 12.5%
Gross Profit Margin (%) 34.7% 33.9% 0.8% pt 0.8% pt 35.6% 34.3% 1.3% pt 1.3% pt
EBITDA 12.7 10.4 22.2% 17.1% 44.2 37.9 16.8% 19.2%
EBITDA Margin (%) 11.4% 10.2% 1.2% pt 1.2% pt 12.5% 11.9% 0.6% pt 0.6% pt
PATMI (excl exceptional items) ** 6.0 4.4 35.3% 28.2% 21.5 17.6 22.3% 25.3%
PATMI (incl exceptional items) 5.9 4.0 47.5% 39.7% 21.3 16.7 27.1% 30.3%
% chg Y-o-Y
% chg Y-o-Y in Constant
Exch Rates *
% chg Y-o-Y
% chg Y-o-Y in Constant
Exch Rates *

20
In 3Q 2019, our Agency Brands business across our markets achieved Y-o-Y revenue growth of 8.6% with revenue in 9M 2019 registering a growth of 9.8%. However, the underlying performance for the nine months would be higher at 12.4% as sales of Van Houten in Indonesia from 2Q 2018 onwards have been reclassified as Own Brands.
Figure 2 - Own Brands & Agency Brands Revenue Performance (Quarterly and Full Year)
The Group’s Gross Profit Margin (“GPM”) was higher Y-o-Y by 0.8% point for 3Q 2019 and 1.3% point for 9M 2019 on the back of higher Own Brands margins achieved. The improved margin can be attributed to the increased sales of our higher margin premium products in Indonesia amidst pruning of unprofitable value products and ongoing cost containment initiatives. With higher sales and higher GPM achieved, the Group generated 3Q and 9M 2019 EBITDA of US$12.7 million (Y-o-Y growth 22.2%) and US$44.2 million (Y-o-Y growth 16.8%) respectively. The Group’s 9M 2019 PATMI of US$21.3 million (higher Y-o-Y by 27.1%) reflected the increase in operating profit achieved and lower effective tax rate. Included in PATMI was an exceptional item comprising US$0.2 million of fees incurred in relation to the ongoing legal and professional work related to the improper and unsubstantiated transactions discovered in the Philippines, which was disclosed previously in 2Q 2018. Excluding this, the Group’s 9M 2019 PATMI growth would have been 22.3%. For 9M 2019, the Group generated Free Cash Flow of US$25.2 million on the back of higher profitability achieved, tighter control of working capital and lower capital expenditure. In addition, the Group’s cash balance at 30 September 2019 of US$51.6 million is more than adequate to support the Group’s foreseeable near term business and investment needs.
21
Performance Review by Markets
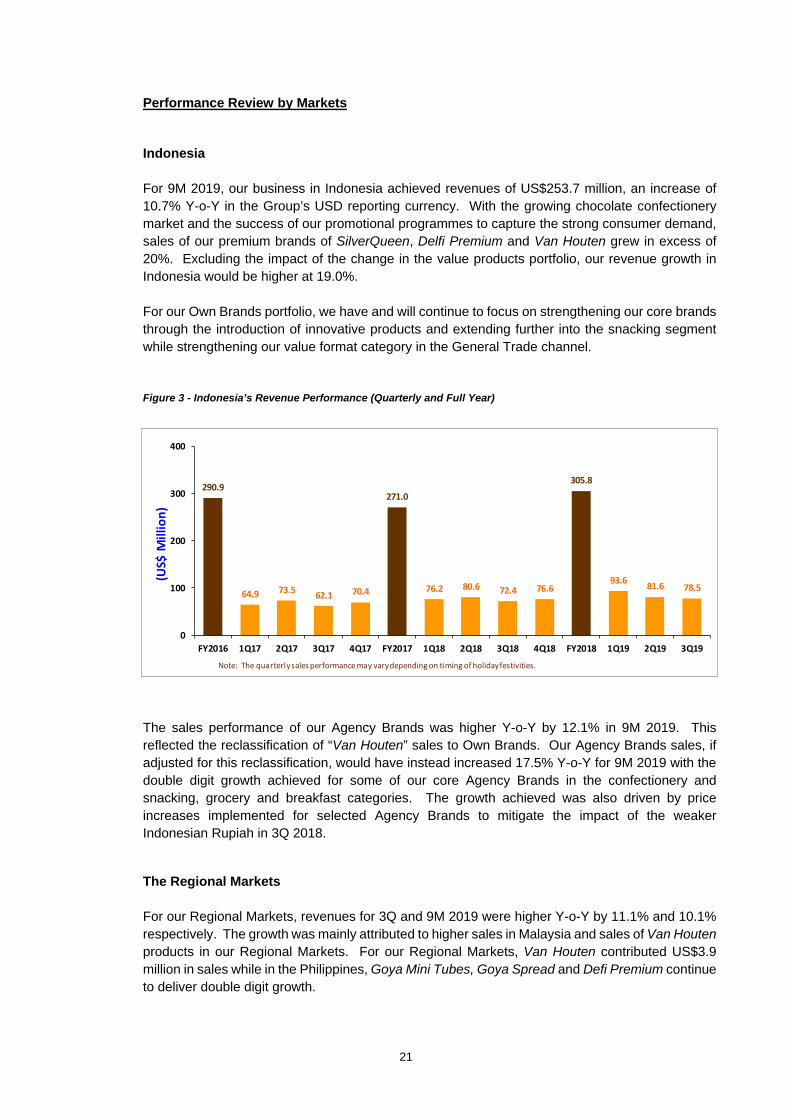
Indonesia For 9M 2019, our business in Indonesia achieved revenues of US$253.7 million, an increase of 10.7% Y-o-Y in the Group’s USD reporting currency. With the growing chocolate confectionery market and the success of our promotional programmes to capture the strong consumer demand, sales of our premium brands of SilverQueen, Delfi Premium and Van Houten grew in excess of 20%. Excluding the impact of the change in the value products portfolio, our revenue growth in Indonesia would be higher at 19.0%. For our Own Brands portfolio, we have and will continue to focus on strengthening our core brands through the introduction of innovative products and extending further into the snacking segment while strengthening our value format category in the General Trade channel. Figure 3 - Indonesia’s Revenue Performance (Quarterly and Full Year)
The sales performance of our Agency Brands was higher Y-o-Y by 12.1% in 9M 2019. This reflected the reclassification of “Van Houten” sales to Own Brands. Our Agency Brands sales, if adjusted for this reclassification, would have instead increased 17.5% Y-o-Y for 9M 2019 with the double digit growth achieved for some of our core Agency Brands in the confectionery and snacking, grocery and breakfast categories. The growth achieved was also driven by price increases implemented for selected Agency Brands to mitigate the impact of the weaker Indonesian Rupiah in 3Q 2018.
The Regional Markets
For our Regional Markets, revenues for 3Q and 9M 2019 were higher Y-o-Y by 11.1% and 10.1% respectively. The growth was mainly attributed to higher sales in Malaysia and sales of Van Houten products in our Regional Markets. For our Regional Markets, Van Houten contributed US$3.9 million in sales while in the Philippines, Goya Mini Tubes, Goya Spread and Defi Premium continue to deliver double digit growth.
290.9
64.9 73.562.1 70.4
271.0
76.2 80.6 72.4 76.6
305.8
93.681.6 78.5
0
100
200
300
400
FY2016 1Q17 2Q17 3Q17 4Q17 FY2017 1Q18 2Q18 3Q18 4Q18 FY2018 1Q19 2Q19 3Q19
(US$ M
illion)
Note: The quarterly sales performance may vary depending on timing of holiday festivities.

22
Review of Profitability For 3Q 2019, the Group generated EBITDA of US$12.7 million, higher Y-o-Y by 22.2%, with 9M 2019 totaling US$44.2 million. The growth was driven by the Group’s higher revenue and improvement in our GP Margin. The Group for 9M 2019 achieved a GP Margin of 35.6% (higher Y-o-Y by 1.3% point). The improvement can be attributed to the higher sales of our premium products amid ongoing efforts to strengthen our value format category in the General Trade channel and our cost containment initiatives. To mitigate the impact of higher input costs, we had implemented a product resizing programme on some of our Own Brands products as well as price increases in 3Q 2018 for selected Agency Brands.
Figure 4 - Gross Profit Margin (Quarterly and Full Year) - As reported
Note: * It should be highlighted that quarterly margins achieved may vary depending on composition of sales mix, both within Own
Brands and Agency Brands.
For Own Brands, our ongoing strategy to mitigate higher input costs includes a combination of the following: pro-active price adjustments and product right-sizing and reformulation; launches of new higher margined products; and cost containment initiatives. In addition, the strategy of buying forward our main raw material requirements in a timely manner allows us to lock-in forward costs to a major extent thus providing greater cost visibility and margin stability. The Group’s 9M 2019 EBITDA growth of 16.8% was achieved despite sales and distribution costs remaining high as a percentage of sales. The increase in Selling and Distribution costs reflected higher promotional spending targeted to drive consumer buying during the festive periods and in response to increased competition. The higher costs also reflected our investments to grow our shelf space presence across all retail channels for our strategic brands and in-store promotions to increase consumer sales in Indonesia. The Group achieved 9M 2019 EBITDA margin of 12.5% (higher Y-o-Y by 0.6% points) reflected the higher GP Margin achieved.
34.8%
33.1% 33.1%
34.7% 35.1%34.0% 34.5% 34.5%
33.9%
35.7%34.6%
35.8% 36.2%
34.7%
20%
25%
30%
35%
40%
FY2016 1Q17 2Q17 3Q17 4Q17 FY2017 1Q18 2Q18 3Q18 4Q18 FY2018 1Q19 2Q19 3Q19
23
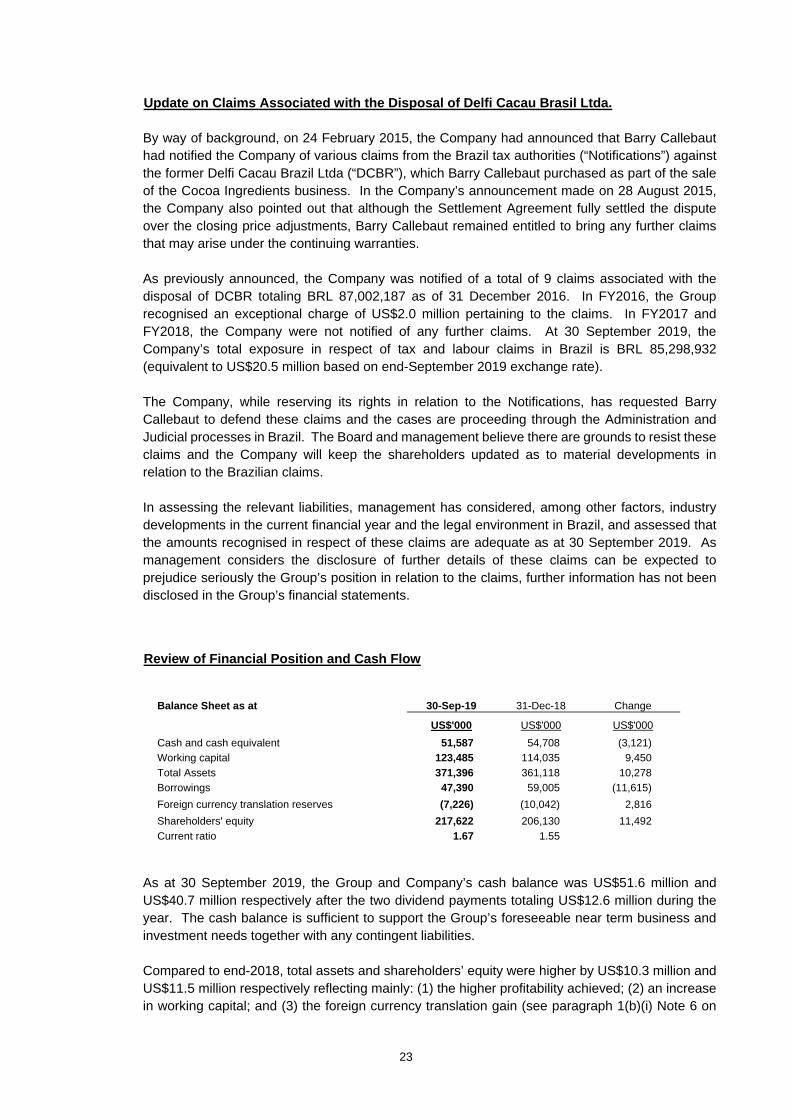
Update on Claims Associated with the Disposal of Delfi Cacau Brasil Ltda.
By way of background, on 24 February 2015, the Company had announced that Barry Callebaut had notified the Company of various claims from the Brazil tax authorities (“Notifications”) against the former Delfi Cacau Brazil Ltda (“DCBR”), which Barry Callebaut purchased as part of the sale of the Cocoa Ingredients business. In the Company’s announcement made on 28 August 2015, the Company also pointed out that although the Settlement Agreement fully settled the dispute over the closing price adjustments, Barry Callebaut remained entitled to bring any further claims that may arise under the continuing warranties. As previously announced, the Company was notified of a total of 9 claims associated with the disposal of DCBR totaling BRL 87,002,187 as of 31 December 2016. In FY2016, the Group recognised an exceptional charge of US$2.0 million pertaining to the claims. In FY2017 and FY2018, the Company were not notified of any further claims. At 30 September 2019, the Company’s total exposure in respect of tax and labour claims in Brazil is BRL 85,298,932 (equivalent to US$20.5 million based on end-September 2019 exchange rate). The Company, while reserving its rights in relation to the Notifications, has requested Barry Callebaut to defend these claims and the cases are proceeding through the Administration and Judicial processes in Brazil. The Board and management believe there are grounds to resist these claims and the Company will keep the shareholders updated as to material developments in relation to the Brazilian claims. In assessing the relevant liabilities, management has considered, among other factors, industry developments in the current financial year and the legal environment in Brazil, and assessed that the amounts recognised in respect of these claims are adequate as at 30 September 2019. As management considers the disclosure of further details of these claims can be expected to prejudice seriously the Group’s position in relation to the claims, further information has not been disclosed in the Group’s financial statements.
Review of Financial Position and Cash Flow
Balance Sheet as at 30-Sep-19 31-Dec-18 Change
US$'000 US$'000 US$'000
Cash and cash equivalent 51,587 54,708 (3,121)
Working capital 123,485 114,035 9,450
Total Assets 371,396 361,118 10,278
Borrowings 47,390 59,005 (11,615)
Foreign currency translation reserves (7,226) (10,042) 2,816
Shareholders' equity 217,622 206,130 11,492
Current ratio 1.67 1.55
As at 30 September 2019, the Group and Company’s cash balance was US$51.6 million and US$40.7 million respectively after the two dividend payments totaling US$12.6 million during the year. The cash balance is sufficient to support the Group’s foreseeable near term business and investment needs together with any contingent liabilities.
Compared to end-2018, total assets and shareholders’ equity were higher by US$10.3 million and US$11.5 million respectively reflecting mainly: (1) the higher profitability achieved; (2) an increase in working capital; and (3) the foreign currency translation gain (see paragraph 1(b)(i) Note 6 on

24
page 7). The Group has utilised its operating cash flow of US$44.7 million (see paragraph 1(c) on page 9) to fund its higher working capital and repay its borrowings (see paragraph 1(b)(i) Note 5 on page 7).
9. Where a forecast, or a prospect statement, has been previously disclosed to shareholders,
any variance between it and the actual results.
The Group’s results for 3Q and 9M 2019 are in line with the commentary made on 13 August 2019 in paragraph 10 of the Group’s “2Q and 1H 2019 Unaudited Financial Statements and Dividend Announcement”.
10. A commentary at the date of the announcement of significant trends and the competitive
conditions of the industry in which the group operates and any known factors or events that may affect the group in the next reporting period and the next 12 months.
With the operating environment expected to become more challenging with intensifying competition and growing demands from trade customers and consumers, the Group’s focus is to continuously work closely with our trade customers and partners to grow our business by ensuring that our brands are always available, properly displayed and at the correct price points. We will focus our brand building initiatives and trade promotions for our core products while ensuring that our products continue to maintain significant shelf space presence. In addition to growing our sales, we will focus on driving cost efficiencies throughout our organisation, in particular, our supply chain. Through our continued focus on top line expansion by further growing our core premium brands, extending into the snacking category and strengthening our value product portfolio in the General Trade channel; and stepped up productivity efforts, we are cautiously optimistic about the growth prospects of FY2019.
Over the long term, we believe the consumption environment in our markets will continue to be supported by robust economies and the growing middle income classes. To capture the growth opportunities and drive the long term growth of our business, we will work to: 1. Grow our key brands in our markets. Innovation remains a key part of this strategy, whether
it is through product innovation in order to provide us with a competitive edge or through continuous marketing reinvention to stay relevant by creating excitement at the shelf space while focusing on the core brands and products that can deliver growth in sales and margins;
2. Extend market reach by having better channel segmentation for both the Modern Trade and
General Trade retail formats in order to widen and strengthen our distribution coverage to capture the growth opportunities; and
3. Prudently invest to build capacity and capabilities where there are clear expansion
opportunities into new and attractive categories; and increase our productivity and efficiency targets within our existing production and distribution infrastructure.
To add further value over the longer term to our quality earnings, we will continue to explore opportunities to enter new markets and to extend to new categories if suitable acquisitions or partnerships meet our investment criteria.

25
11. If a decision regarding dividend has been made:
a. Whether an interim (final) ordinary dividend has been declared (recommended)? No.
b. (i) Amount per share ……. cents. Not applicable. (ii) Previous corresponding period ……. cents. Not applicable.
c. Whether the dividend is before tax, net of tax or tax exempt. If before tax or net of
tax, state the tax rate and the country where the dividend is derived.
Not applicable.
d. The date the dividend is payable.
Not applicable.
e. The date on which Registrable Transfers received by the Company (up to 5.00 pm)
will be registered before entitlements to the dividend are determined.
Not applicable.
12. If no dividend has been declared (recommended), a statement to that effect and the
reason(s) for the decision. No dividend has been declared for 3Q 2019 as the interim dividend was declared during 1H 2019.
26
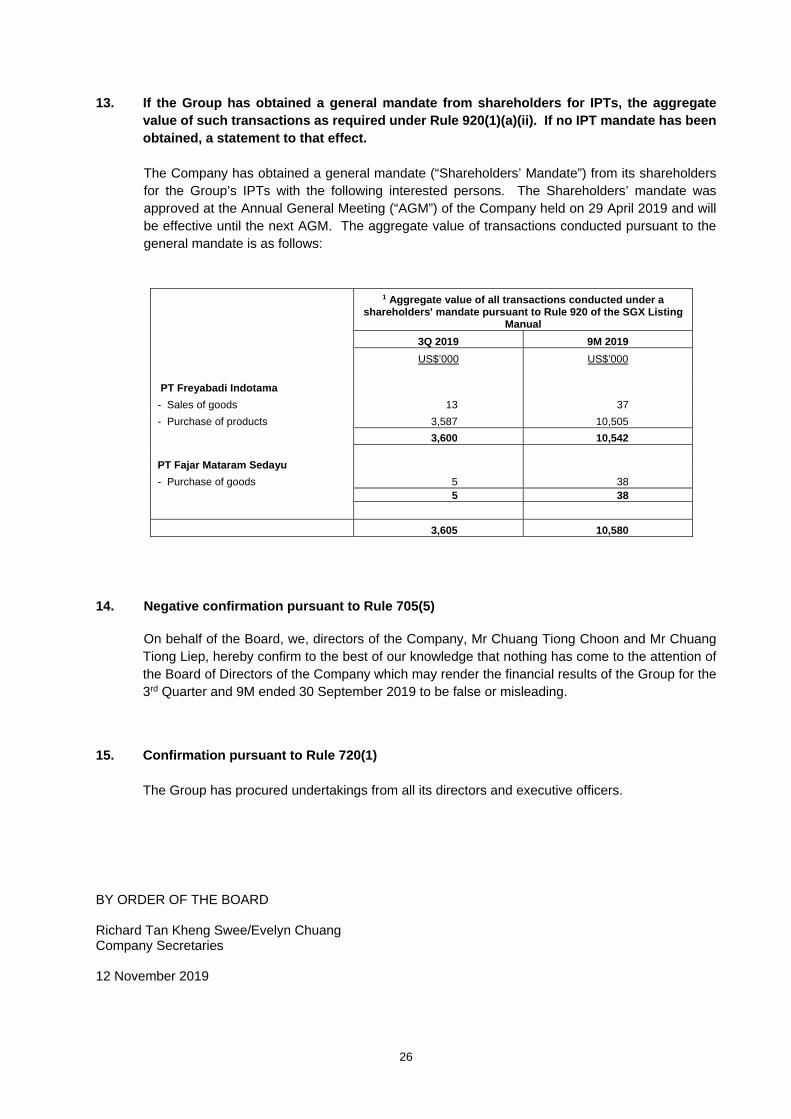
13. If the Group has obtained a general mandate from shareholders for IPTs, the aggregate value of such transactions as required under Rule 920(1)(a)(ii). If no IPT mandate has been obtained, a statement to that effect. The Company has obtained a general mandate (“Shareholders’ Mandate”) from its shareholders for the Group’s IPTs with the following interested persons. The Shareholders’ mandate was approved at the Annual General Meeting (“AGM”) of the Company held on 29 April 2019 and will be effective until the next AGM. The aggregate value of transactions conducted pursuant to the general mandate is as follows:
1 Aggregate value of all transactions conducted under a shareholders' mandate pursuant to Rule 920 of the SGX Listing
Manual
3Q 2019 9M 2019
US$’000 US$’000
PT Freyabadi Indotama
- Sales of goods 13 37
- Purchase of products 3,587 10,505
3,600 10,542
PT Fajar Mataram Sedayu
- Purchase of goods 5 38 5 38
3,605 10,580
14. Negative confirmation pursuant to Rule 705(5)
On behalf of the Board, we, directors of the Company, Mr Chuang Tiong Choon and Mr Chuang Tiong Liep, hereby confirm to the best of our knowledge that nothing has come to the attention of the Board of Directors of the Company which may render the financial results of the Group for the 3rd Quarter and 9M ended 30 September 2019 to be false or misleading.
15. Confirmation pursuant to Rule 720(1)
The Group has procured undertakings from all its directors and executive officers. BY ORDER OF THE BOARD Richard Tan Kheng Swee/Evelyn Chuang Company Secretaries 12 November 2019


![Delfi Common Rail Sistem[1]](https://static.fdocuments.us/doc/165x107/54559817b1af9f26548b4bb8/delfi-common-rail-sistem1.jpg)