Delayed Diagnosis of Sarcoidosis - AASOG Conference...116,537 enrollees with sarcoidosis diagnosis...
26
Delayed Diagnosis of Sarcoidosis using large data source to detect and study diagnostic opportunities Aaron Miller, Philip Polgreen, Alicia Gerke
Transcript of Delayed Diagnosis of Sarcoidosis - AASOG Conference...116,537 enrollees with sarcoidosis diagnosis...

Delayed Diagnosis of Sarcoidosis
using large data source to detect and study diagnostic opportunities
Aaron Miller, Philip Polgreen, Alicia Gerke
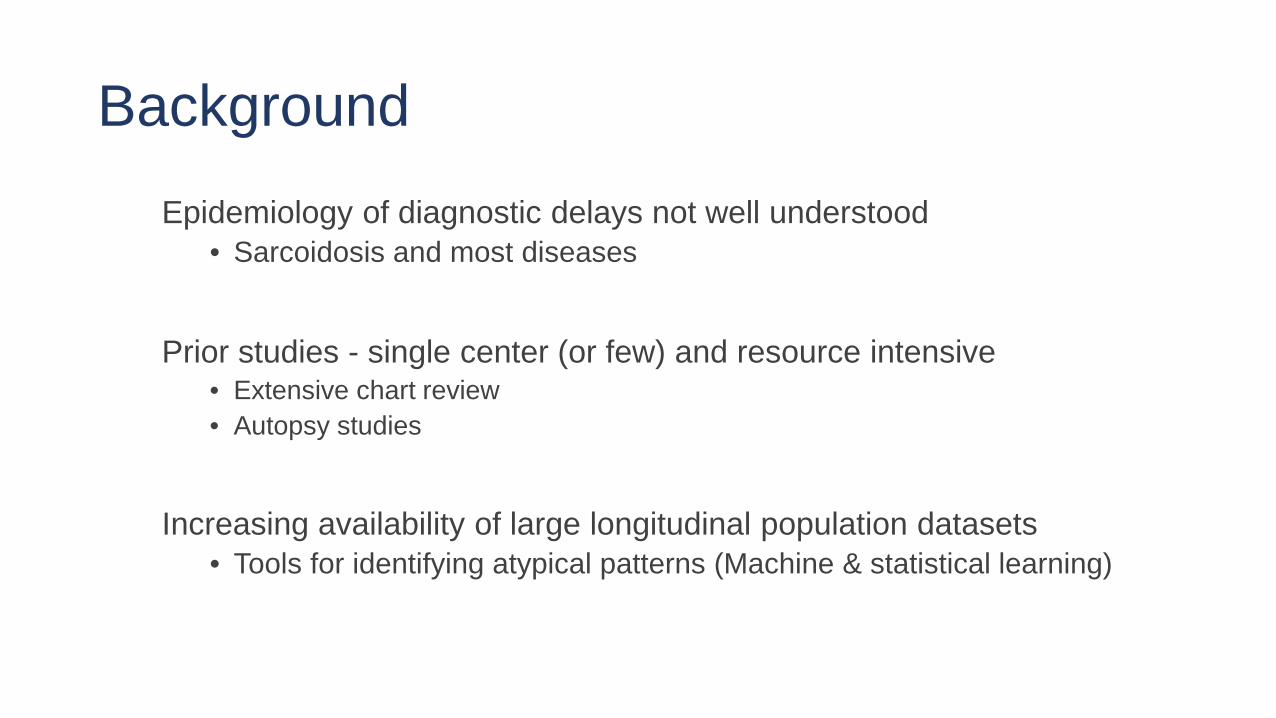
BackgroundEpidemiology of diagnostic delays not well understood
• Sarcoidosis and most diseases
Prior studies - single center (or few) and resource intensive• Extensive chart review• Autopsy studies
Increasing availability of large longitudinal population datasets• Tools for identifying atypical patterns (Machine & statistical learning)

ObjectiveDevelop a “semi-automated” population-based approach to…
Detect diagnostic opportunities (conditions/symptoms that indicate)
Describe…• Incidence/frequency of delays • Duration of delays• Individual risk and recurrence
Symptoms linked to delay
Risk factors for delay
Outcomes of delay

Prior WorkActive tuberculosis
Endocarditis and other IVDU-related infections
HSV-encephalitis
Pneumocystis pneumonia
AMI & Stroke

ApproachIncidence of delays – compare observed and expected rates of symptoms prior to diagnosis
Typical duration of delay – detect change-points prior to diagnosis• When do we see an uptick in symptoms prior to diagnosis?
Individual duration and recurrence – agent-based simulations based on observed patterns of visits
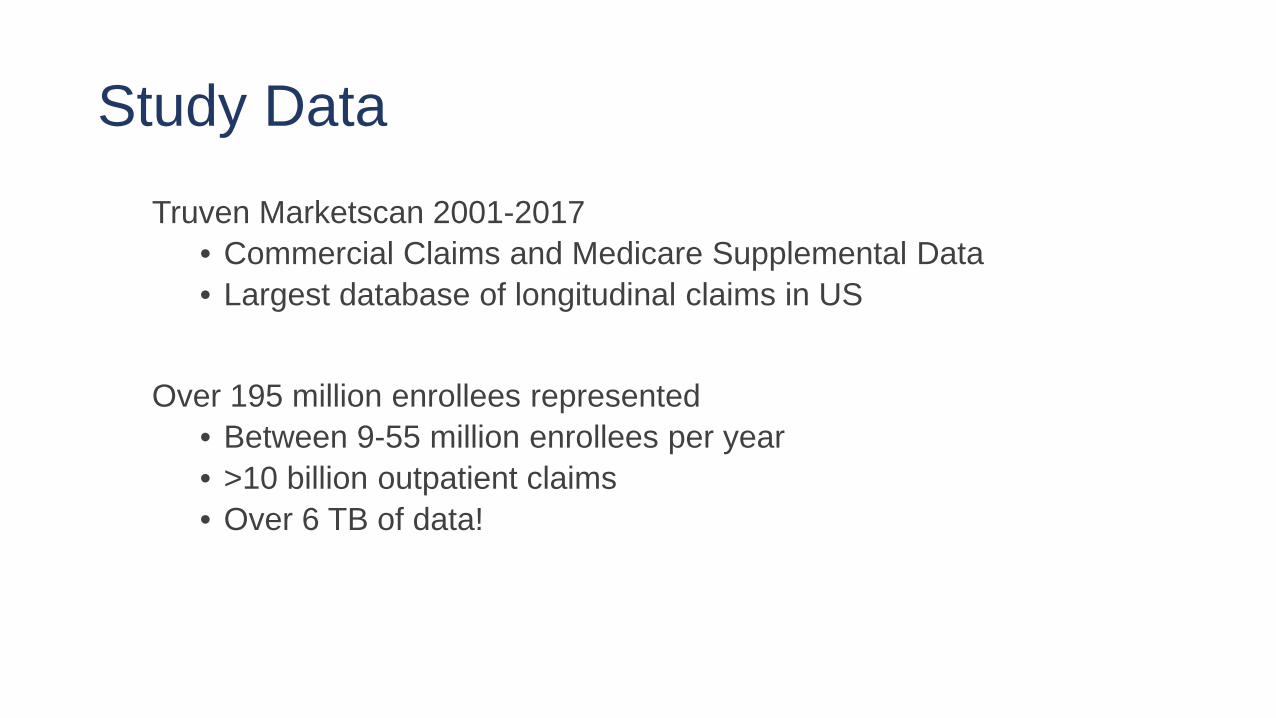
Study DataTruven Marketscan 2001-2017
• Commercial Claims and Medicare Supplemental Data• Largest database of longitudinal claims in US
Over 195 million enrollees represented• Between 9-55 million enrollees per year• >10 billion outpatient claims• Over 6 TB of data!
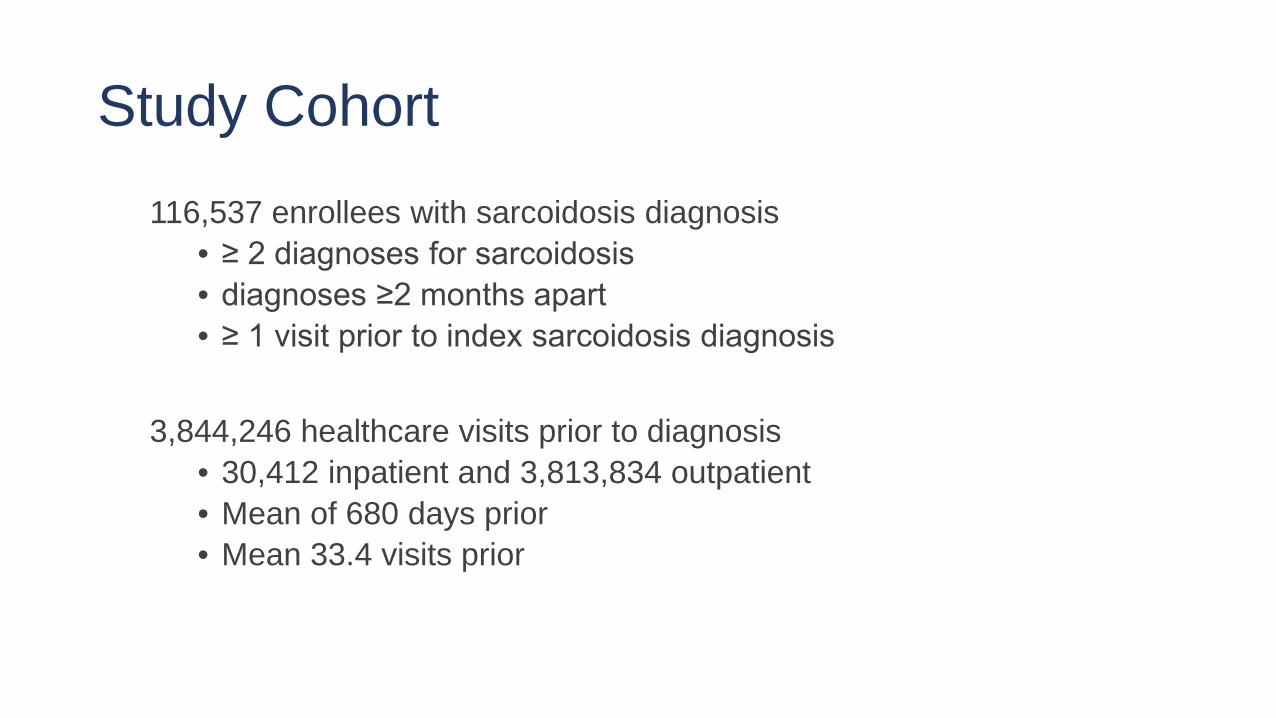
Study Cohort116,537 enrollees with sarcoidosis diagnosis
• ≥ 2 diagnoses for sarcoidosis• diagnoses ≥2 months apart• ≥ 1 visit prior to index sarcoidosis diagnosis
3,844,246 healthcare visits prior to diagnosis• 30,412 inpatient and 3,813,834 outpatient• Mean of 680 days prior • Mean 33.4 visits prior

DemographicsVariable N (%)Age (diagnosis)
≤ 18 374 (0.32)19 – 40 17,186 (14.8)41 – 60 72,907 (62.6)≥ 61 22,358 (19.2)
SexMale 43,902 (37.7)Female 72,515 (62.3)
LocationNortheast 26,868 (24.1)North Central 25,073 (22.5)South 47,175 (42.3)West 12,326 (11.1)

Diagnostic OpportunitiesIdentify symptoms prior to initial sarcoidosis diagnosis
• Fever, chest pain, other pulmonary, rash, joint pain
1. Find index diagnosis
2. Identify symptoms in prior visits (14 days - 2 years)
3. For each day prior to diagnosis, count symptomatic visits
Observe: Dramatic spike in symptomatic-visits in year prior to diagnosis
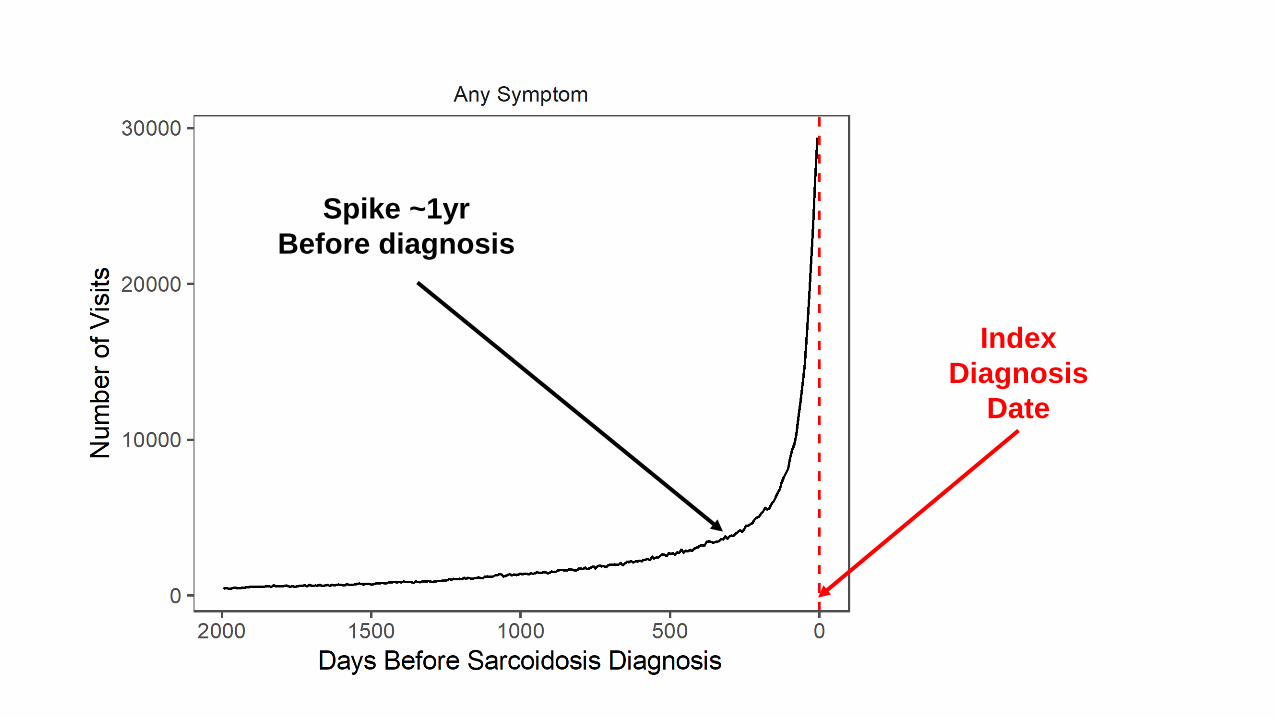
Index Diagnosis
Date
Spike ~1yrBefore diagnosis


Problem…everything spikes

Reasons for Common Uptick
1. Symptoms of sarcoidosis (diagnostic opportunity)
2. Censoring effects
3. Clustering of care (patient preferences)
4. Clustering of health
Observation Effects

Correcting for observation effects
Scale relative to total visits/diagnoses in a given window
Correct for enrollment periods
Note: Statistical approaches to translate to counts (incidence)


Expected Utilization
Observed Utilization
Diagnostic Opportunities
Typical (Mean)Duration

Change-point detectionLet 𝑡𝑡 = 𝐼𝐼 − 𝑤𝑤, … , 𝐼𝐼 be time from 𝑤𝑤 days before diagnosis to diagnosis time 𝐼𝐼, and 𝑓𝑓 𝑡𝑡 our estimate for the number of symptomatic visits at time 𝑡𝑡. We find 𝑔𝑔(𝑡𝑡), ℎ(𝑡𝑡), and change point 𝑑𝑑, such that:
Then the typical duration of diagnostic delays is 𝐼𝐼 − 𝑑𝑑.
Excess visits (diagnostic opportunities)
𝑓𝑓 𝑡𝑡 = � 𝑔𝑔(𝑡𝑡), 𝑡𝑡 < 𝑑𝑑ℎ(𝑡𝑡), 𝑡𝑡 ≥ 𝑑𝑑
= �𝑡𝑡=𝑑𝑑
𝐼𝐼
ℎ 𝑡𝑡 − 𝑔𝑔(𝑡𝑡)

Potential Delays
Symptom Visits with prior symptoms
Patients with prior visits(%)
Duration (Change Point)
Estimated Opportunities (Excess Visits)
Fever 9,541 4,771 (4.1) 168 Days 5,146Joint Pain 81,788 24,108 (20.7) N/A N/ARash 21,196 11,988 (10.3) 77 Days 5,191Chest Pain 54,688 22,034 (18.9) 140 Days 20,918Pulmonary 378,510 68,765 (60.0) 182 Days 170,327Any Symptom 520,665 79,499 (68.2) 175 Days 206,754
Raw Counts (14 days -2 years prior) Model Estimates

Limitation of this approach
1) Some prior symptomatic visits are coincidental
2) Cannot estimate individual-level results• # of patients delayed• # of recurrent opportunities• Length of delays• Risk
3) Statistical significance (e.g., CIs)
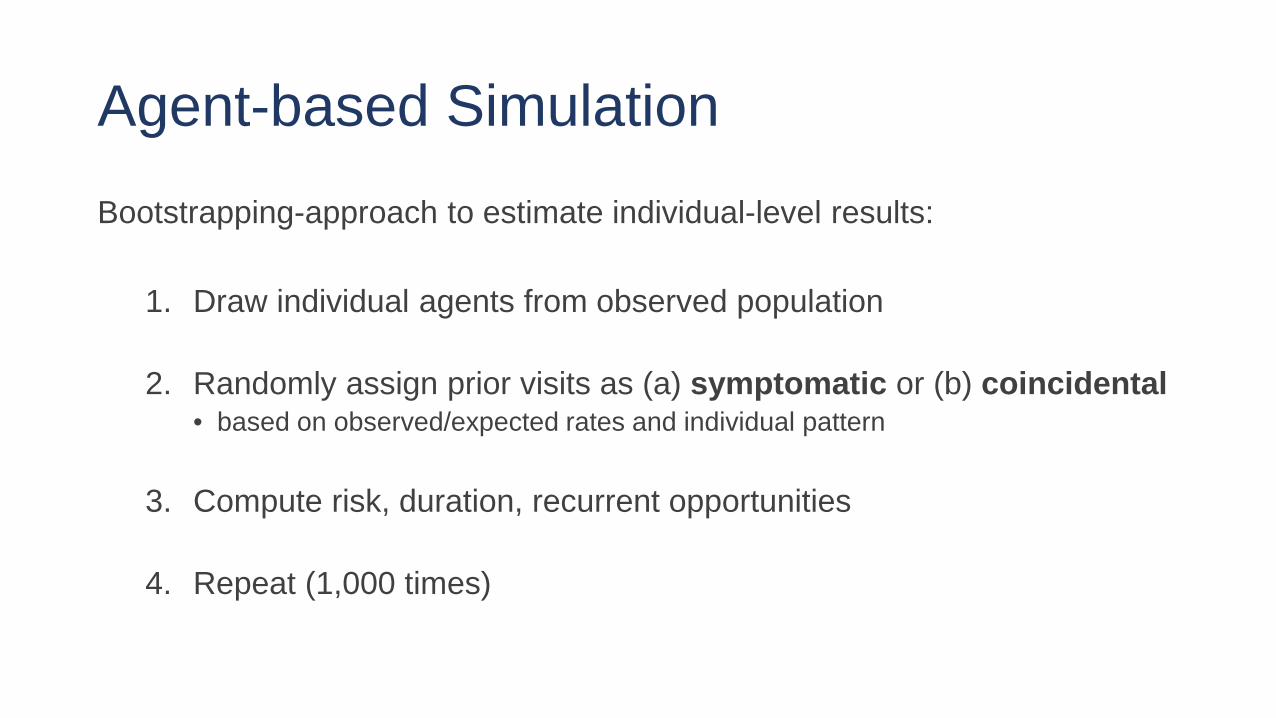
Agent-based SimulationBootstrapping-approach to estimate individual-level results:
1. Draw individual agents from observed population
2. Randomly assign prior visits as (a) symptomatic or (b) coincidental• based on observed/expected rates and individual pattern
3. Compute risk, duration, recurrent opportunities
4. Repeat (1,000 times)
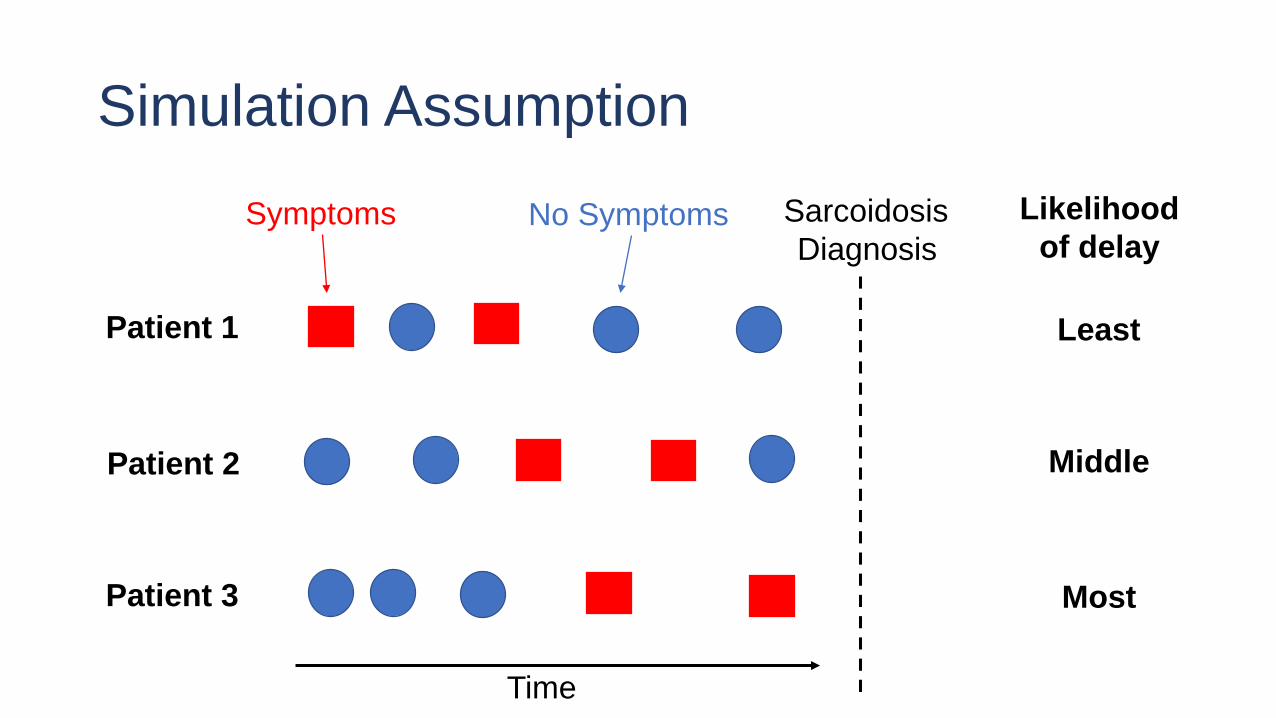
Simulation Assumption
Patient 1
Patient 2
Patient 3
Time
SarcoidosisDiagnosis
Least
Most
Middle
Symptoms No Symptoms Likelihoodof delay

Note:This approach tends to be conservative in labelling delays
Actual opportunities may not be labelled as such
Attempts to correct for reasonable/expected diagnostic pathway• Idea is to identify opportunities that are “uncommon” or “errors”

Simulation Results
Symptom Total Missed Opportunities
Patients with Opportunity (%)
Opportunities missed (per
patient)
Mean duration of delay
Fever 4,458 (4,447-4,470)
2.09 (2.08-2.11)
1.83(1.81-1.84)
53.04(52.9-53.17)
Rash 4,514 (4,491-4,536)
2.94(2.91-2.96)
1.32 (1.31-1.33)
30.28(30.18-30.39)
Chest Pain 17,748(17,697-17,803)
8.79 (8.74-8.83)
1.73 (1.73-1.74)
47.96(47.85-48.1)
Pulmonary 151,738(151,384-152,129)
43.02(42.92-43.1)
3.03(3.02-3.03)
56.75 (56.59-56.9)
Any Symptom 170,362(169,929-170,789)
47.35(47.24-47.45)
3.09(3.08-3.10)
55.32(55.17-55.45)
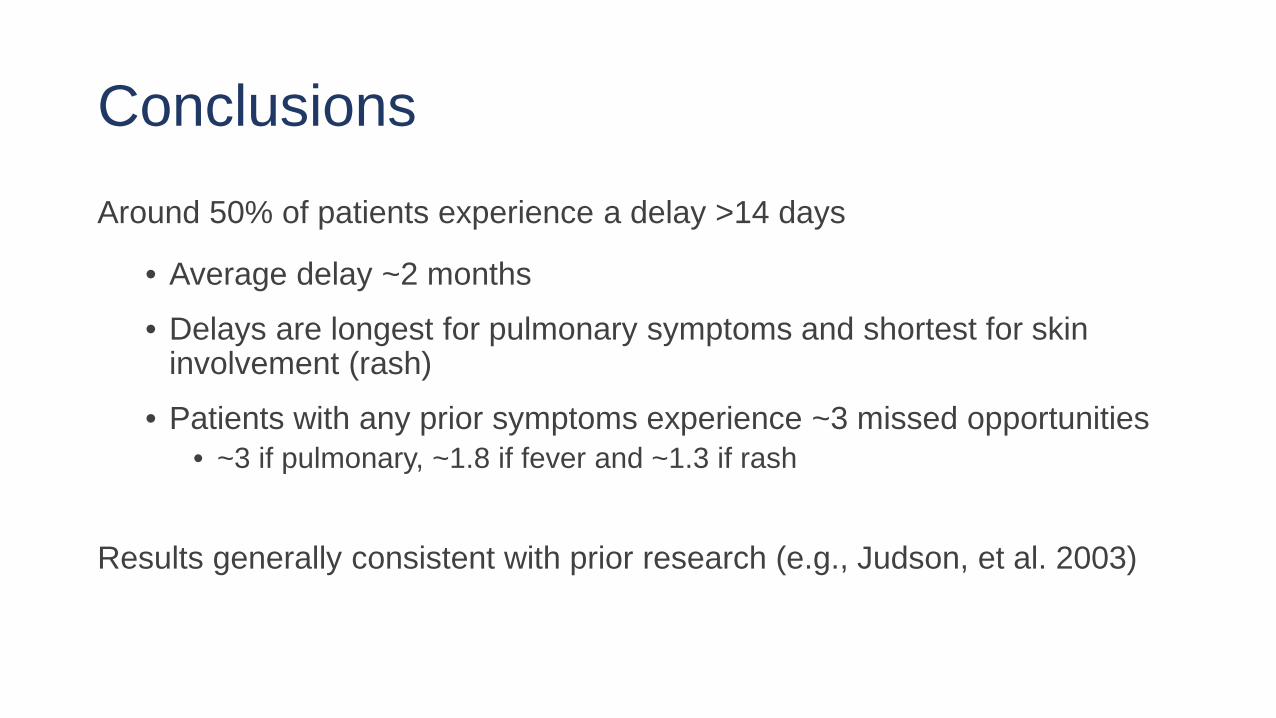
ConclusionsAround 50% of patients experience a delay >14 days
• Average delay ~2 months
• Delays are longest for pulmonary symptoms and shortest for skin involvement (rash)
• Patients with any prior symptoms experience ~3 missed opportunities• ~3 if pulmonary, ~1.8 if fever and ~1.3 if rash
Results generally consistent with prior research (e.g., Judson, et al. 2003)

Future WorkValidation of cases and index events – medications and procedures
Risk factors for delay• Expand to other databases – with race and other demographics
Detect symptoms/specific codes linked to delay
Estimate excess costs of delay
Down steam harms