Del Vecchio - Light Weight Materials for Deep Water Moorings - 1992
285
UNIVERSITY OF READING LIGHT WEIGHT MATERIALS FOR DEEP WATER MOORINGS A thesis submitted for the degree of Doctor of Philosophy by Cesar Josè Moraes Del Vecchio Department of Engineering June 1992
description
Founding PhD thesis for synthetic moorings
Transcript of Del Vecchio - Light Weight Materials for Deep Water Moorings - 1992

UNIVERSITY OF READING
LIGHT WEIGHT MATERIALS FOR DEEP WATER MOORINGS
A thesis submitted for the degree of Doctor of Philosophy
by
Cesar Josè Moraes Del Vecchio
Department of Engineering
June 1992

This work is dedicated to my wife Thais and my sons Andrê and Filipe.

ABSTRACT
The use of light weight materials for deep water moorings has been
investigated. Based on a survey of the literature, mechanical properties of a
number of candidate tethers were used in a "pilot study", reported elsewhere,
to select one material, polyester, and two low twist rope constructions, parallel
sub-rope and parallel strand, for further investigation.
For the tethers selected, a characterisation of the mechanical, rheological and
environmentally influenced properties was performed, under the relevant
loading conditions pertaining to deep water spread mooring systems.
It was found that low twist polyester fibre ropes have high strength efficiency,
good fatigue and creep properties, and low sensitivity to hydrolysis in sea
water, even in combination with high constant loads. It was also found that the
axial stiffness of these components is strongly dependent on the cyclic load
limits and frequency.
Using the properties measured, an analysis was performed of the behaviour
and cost of spread mooring systems incorporating polyester fibre ropes,
compared with wire rope-chain systems. Two extreme environmental
conditions, one relevant to the Campos Basin (offshore Brazil) and the other to
the West of Shetlands (offshore UK), and three water depths, 500, 1000 and
2000 m, were investigated.
It was concluded that low twist polyester fibre ropes provide practical cost
effective options for spread mooring systems for deep water vessels. Optimum
cost systems based on polyester ropes, having a lower chain component and
a drag embedment anchor, were found to reduce the first order wave
frequency tensions compared with steel wire rope-chain systems. Therefore to
meet the same tension safety factor requirements, substantially lower
minimum breaking loads were necessary. It was also observed that the time
and load dependent stiffness properties of these ropes should be considered
in the design process.
i

ACKNOWLEDGEMENTS
I would like to tank my supervisor Dr. C. Richard Chaplin for his restless help
in all aspects of this work, from illuminating discussions to every day
encouragement.
I would also like to acknowledge the support received from my friends Mr. Luiz
Cldudio de M. Meniconi and Miss Isabel M. L. Ridge and the interesting
discussions with Dr. George Jeronimidis.
I gratefully acknowledge the sponsorship of PETROBRAS PetrOleo Brasileiro
S.A.
AKZO Fibres B.V., Brascorda S.A., DSM High Performance Fibers and Marlow
Ropes have kindly supplied the fibres and ropes tested.
ii
CONTENTS
Section page
ABSTRACT (i)
ACKNOWLEDGEMENTS (ii)
1. INTRODUCTION 1
1.1 Background 1
1.2 Scope of the Thesis 6
2. MOORING CONCEPTS 11
2.1 Alternative Concepts for Deep Water Moorings 11
2.2 Environmental Loads 12
2.3 Tension Leg Platforms 13
2.3.1 General Characteristics 13
2.3.2 Light Weight TLP Tethers 14
2.4 Spread Mooring Systems 16
2.4.1 Introduction 16
2.4.2 Offsets 17
2.4.3 Environmental Forces 18
2.4.4 Basic Response 22
2.4.5 Quasi-Static Analysis 22
2.4.6 Dynamic Analysis 22
2.4.7 Codes of Practice 26
3. DESIGN OF CATENARY MOORING SYSTEMS INCORPORATING LWT 29
3.1 State of the Art 29
3.2 The "Pilot Study" 35
4. CHARACTERISTICS OF SYNTHETIC FIBRE ROPES 41
4.1 Introduction 41
4.2 Textile Units 42
4.3 Yarns 43
iii

4.3.1 General Considerations 43
4.3.2 Yarn Finishes 44
4.3.3 Yarn Properties 45
4.4 Polyester (Polyethylene Terephthalate) Fibres 51
4.5 Fibre Ropes 59
4.5.1 Rope Constructions 59
4.5.2 Terminations 62
4.5.3 Jacketing 66
4.6 Rope Properties 68
4.6.1 Introduction 68
4.6.2 Modelling the Mechanical Behaviour of Fibre Ropes 69
4.6.3 Static Strength 70
4.6.4 Stiffness 71
4.6.5 Weight 75
4.6.6 Cost 75
4.6.7 Creep 75
4.6.8 Tension-Tension Cycling ("Fatigue") 77
4.6.9 Hysteresis 81
4.6.10 Field Experience 83
5. IDENTIFICATION OF PARAMETERS & TESTING PLAN 87
5.1 Identification of Parameters 87
5.2 Material Testing Programme 91
5.2.1 Strength Testing 93
5.2.2 Stiffness Testing 93
5.2.3 Creep and Environmentally Assisted Degradation 94
5.2.4 "Fatigue" 95
6. MATERIAL PROPERTIES: TEST METHODS 96
6.1 Strength Testing 96
6.1.1 Yarn 96
6.1.2 Ropes 98
6.2 Stiffness and Hysteresis 102
6.2.1 Yarn 102
iv

6.2.2 Ropes 103
6.2.2.1 Stiffness 103
6.2.2.2 Hysteresis 105
6.3 Creep and Environmentally Assisted Degradation 106
6.3.1 Yarn 106
6.3.1.1 Creep 107
6.3.1.2 Environmentally Assisted Degradation 108
6.3.2 Ropes 109
6.4 "Fatigue" 112
7. MATERIAL PROPERTIES: RESULTS 114
7.1 Strength 114
7.1.1 Yarn 114
7.1.2 Ropes 116
7.1.2.1 Superline 116
7.1.2.2 Brascorda Parallel 118
7.2 Stiffness and Hysteresis 118
7.2.1 Yarn Stiffness 118
7.2.2 Rope Stiffness 120
7.2.2.1 Superline 120
7.1.2.2 Brascorda Parallel 122
7.2.3 Rope Hysteresis 123
7.3 Creep and Environmentally Assisted Degradation 124
7.3.1 Yarn 124
7.3.1.1 Creep 124
7.3.1.2 Environmentally Assisted Degradation 125
7.3.2 Ropes 126
7.3.2.1 Creep 126
7.3.2.2 Environmentally Assisted Degradation 128
7.4 "Fatigue" 128
8. MATERIAL PROPERTIES: DISCUSSION 130
8.1 Strength 130
8.1.1 Yarn 130
V

8.1.2 ropes 133
8.2 Stiffness and Hysteresis 136
8.2.1 Yarn Stiffness 136
8.2.2 rope Stiffness 138
8.2.2.1 Wave Frequency and Low Frequency 138
8.2.2.2 Quasi-Static 142
8.2.3 Hysteresis 143
8.3 Creep and Environmentally Assisted Degradation 146
8.3.1 Yarn 146
8.3.1.1 Creep 146
8.3.1.2 Environmentally Assisted Degradation 148
8.3.2 Ropes 152
8.3.2.1 Creep 152
8.3.2.2 Environmentally Assisted Degradation 155
8.4 "Fatigue" 157
9. CASE STUDIES 161
9.1 Background 161
9.2 Design Cases and Methods 163
9.3 Results 168
9.4 Discussion 170
9.4.1 Dynamic Analyses 171
9.4.2 Quasi-Static Analyses 177
10. CONCLUSIONS AND RECOMMENDATIONS 179
10.1 Conclusions 179
10.2 Further Work 184
11. REFERENCES 186
APPENDIX 1 198
APPENDIX 2 200
APPENDIX 3 202
vi

1. INTRODUCTION
1.1 - Background
In the search for liquid hydrocarbons men started drilling on the ocean floor as
early as 1897. A wooden pier was then used to support a conventional drilling
rig. As drilling effort moved deeper into the ocean wooden platforms became
islands, disconnected from shore. Since that time the advantages of having a
mobile platform were very much appreciated by prospectors.
To fulfil this need early concepts like the submersible drilling rig evolved.
These were floating structures that could be towed to location with all the
drilling equipment on board and ballasted to rest on the ocean floor. Although
these were used in quite shallow waters, their concept is still relevant to
modern gravity based offshore platforms.
Moving to deeper waters and harsher environments produced the first steel
jacket in 1934. To limit the size of the fixed structure used, the "tender" ship
was born. The latter carries all facilities for drilling, completion, energy
generation and accommodation, and is moored alongside the platform.
Linking the ship to the platform there is a foot bridge known as the "widow
maker.
As exploitation went on and better exploration prospects evolved at increasing
depths the concept of self-elevating (Jack-up) platforms was devised and the
first unit constructed in 1955. Like the submersible, it could be moved afloat to
location. Once there, legs lowered to the sea floor allow the hull to be jacked-
up out of water, thereby tremendously reducing wave and current loading on
the platform.
Almost simultaneously another concept, the drilling-ship, arose bringing with it
a whole collection of technical innovations and allowing for the first time,
drilling from a floating platform.
In 1961 a revolutionary floating unit, the semi-submersible platform, made its
debut. It consisted of a platform connected to flotation elements by columns. A
huge reduction in water plane area was obtained in comparison with ships.
1

Semi-submersible platforms are much less sensitive to environmental loading
and direction than ships.
Both drilling-ships and semi-submersible platforms were originally conceived
with catenary type spread mooring systems. These systems consist of a set of
mooring lines spread in radiating directions in order to resist the
environmental forces. Each mooring line typically consists of a length of chain
or wire rope and an anchor.
From 1961, however, some drilling-ship and later some semi-submersibles
had their mooring systems replaced by a dynamic positioning (DP) system
consisting of thrusters and a closed loop-control with linear and angular
feedback.
Parallel developments in deep water drilling technology, such as riser
systems, have maintained the trend in increasing maximum water depth
explored (Salama (1984)).
While in the North Sea fields maximum water depths reach about 500 metres,
drilling activity to the West of Shetlands is taking place in excess of 500 m. On
the other side of the Atlantic, both in the Gulf of Mexico, in North America and
in Campos Basin, in the Continental slope offshore Brazil, wells are being
drilled and large discoveries being made, in maximum water depths ranging
from 2,000 to 3,000 metres.
Apart from development wells being drilled from fixed structures or structures
designed for production, the current usage of drilling platforms as a function of
water depth is as follows:
(i) Jack-ups - frequently used up to 120 m. Current designs aiming to
reach 160 m.
(ii) Semi-submersible platforms and drill-ships with spread mooring
systems - frequently used between 80 and 500 m. Current
designs aiming to reach 1000 m with thruster assistance.
(iii) Drill-ships and semi-submersible platforms with DP systems -
frequently used in water depths in excess of 300 m.
Because of its much longer operational lifetime oil production, having started
2

offshore from the same piers and platforms where drilling was successful, has
concentrated mostly on bottom founded structures.
Both steel tubular jackets and reinforced concrete have been widely used
over the past decades to house: wellheads, work-over rig, production
equipment, pumping and compression facilities, living quarters, and auxiliary
equipment (such as power generation). A number of these platforms have
been also used for development drilling before and during production.
Although reinforced concrete platforms usually provide better oil storage
facilities, they have been greatly outnumbered by steel jackets due to their
higher capital cost and the scarcity of manufacturing yards.
The capital cost of fixed structures escalates in geometric progression with
water depth (Lewis (1982)). This is due to:
(i) the amount of material needed to carry the self weight of the
structure;
(ii) the increase in fabrication cost due to the use of heavier equipment;
(iii) the additional cost associated with loading and transportation
stresses imposed on the structure; and,
(iv) the cost penalty on deep waterinstallation operations.
For this reason, alternative solutions for deep water production have been
constantly developing over the past 20 years. Figure 1.1 shows some of the
concepts proposed for deep water application together with with a fixed steel
jacket.
As early as 1975 a semi-submersible platform was used for production in the
Argyll field in the North sea in 79 m water depth. That was not the only concept
devised to produce marginal fields, In 1977 a ship moored to an articulated
tower was used in the Mediterranean sea in 117 m.
By making use of existing semi-submersible platforms and converted tankers,
these systems made possible the exploitation of fields previously thought
unprofitable. The major difference between these systems and conventional
jackets was the use for the first time of subsea wellheads.
An even more successful concept has been adopted offshore Brazil: that of
3

Anticipated Production Systems. Under pressure to develop new finds as
quickly as possible to reduce oil imports, since 1977, Petrobrds (the Brazilian
state oil company) has been putting its newly found offshore fields in
production in record time by the use of underwater wet wellheads. These are
connected to spread moored semi-submersible platforms by flexible flowlines
and control bundles.
The technology is similar to some marginal field developments, but the
underlying concepts are: quick oil recovery and accurate evaluation of the
reservoir potential, before committing to a much bigger investment.
Such a strategy would have certainly prevented the huge loss made by Placid
in its Green Canyon development in the Gulf of Mexico. A Penrod 72 semi-
submersible was installed there in 1987 in 500 metres water depth. The
platform, which was heavily modified, was withdrawn in early 1990 due to low
production.
Several other concepts have been proposed for production of hydrocarbon
accumulations in water depths in excess of 300 m like the guyed tower and
the tension leg platform (TLP).
The guyed tower consists of a steel structure piled to the sea floor like a
conventional jacket with the addition of mooring lines to help in resisting the
horizontal components of the environmental loads.
The only structure of this kind installed to date is Exxon's Lena Guyed Tower,
operating in 305 metres of water in the Gulf of Mexico since 1983. Its mooring
lines consist of 137 mm and 127 mm steel wire ropes, of a spiral strand
construction, in combination with clump weights and piled anchors.
Tension leg platforms or tethered buoyant platforms are compliant structures
vertically moored to the sea bed by tethers that should be kept under tension
in all environmental conditions. Their shape is similar to that of semi-
submersibles in that a reduction of the water-plane area is obtained by the
use of columns.
Two of these platforms are presently installed: Conoco's Hutton, operating
since 1984, in the North Sea in 148 metres of water with an operational
4
displacement of 64,000 tonnes, and Conoco's Jolliet, since 1989, in the Gulf
of Mexico in 536 metres water depth and with a displacement of only 16,500
tonnes. The former is a full production platform, while the later is only a
wellhead platform.
The tethers used in these platforms are: 795 MPa yield strength (1.25% Cr,
3.5% Ni, 0.30% Mo, and 0.15%V) small bore steel tubes, with a diameter of
260 mm for Hutton (Salama & Tetlow (1983)); and, 450 MPa (65 ksi) yield
strength, 600 mm diameter by 20 mm thickness line pipe for Jolliet.
Saga Petroleum's Snorre TLP is scheduled to be installed in May 1992
offshore Norway in 310 m of water.
Auger TLP from Shell will greatly extend the water depth in which TLPs are
installed when, in 1993, it will be set in 872 metres. In addition to its vertical
tethers, a spread mooring system will also be used, both for facilitating
positioning for drilling but also for sharing the horizontal environmental loads
with the vertical tendons.
In the early 70's spread mooring systems with single component (wire or
chain) lines started to be challenged by systems with lines composed of a
combination of wire rope (top segment) and chain in the lower section
(Childers (1974)). This technology was already in use in barges and ships. At
that time only drilling was envisaged. Although combination systems have had
some use for deep water drilling, dynamically positioned vessels usually work
out to be cheaper. It was not since production was involved that the time on
location was sufficient to justify economically the use of combination systems.
As early as 1978 (Riewald et al. (1986)) it was perceived that spread mooring
systems, having in each line an upper component of light weight rope with
chain in the lower segment, could provide very effective solutions for semi-
submersible platforms and drill-ships in deep waters.
The key to improved performance is the horizontal component of line tension.
By operating at a lower angle to the horizontal, systems incorporating light
weight tethers achieve higher restoring forces than all steel systems for the
same tether tensions. Since changes in tension are also bigger for a given
5

excursion, the whole system becomes more efficient, with windward lines
picking-up load quicker and leeward lines being slackened faster. Figure 1.2
shows a two-dimensional representation of the features discussed.
A taut inclined system, using light weight ropes and piles on a spread mooring
arrangement, was proposed by Baxter (1988). This relied on rope stretch to
accommodate dynamic tensions. In all the other spread moored systems, this
compliance is mostly provided by the catenary geometry.
1.2 - Scope of the Thesis
The purpose of this work is to advance the knowledge of synthetic fibre ropes
in the context of mooring systems for deep water floating vessels. The
behaviour of a moored vessel with lines incorporating light weight tethers is a
problem of a complex nature. The stiffness of the mooring system, which is a
function of the geometry of the mooring lines, and of the mechanical
properties of the tether components, determines the response of the system to
the environmental loads, i.e. its station keeping characteristics. However light
weight tethers (LVVTs) have properties that are highly dependent on the load
levels in the tethers and on the time characteristics of the loading. Therefore
the properties of the tethers, which are relevant to the system analysis, will
themselves be a function of the system response.
At the start of this study very little had been done on the use of LVVTs for
offshore station keeping, therefore both system behaviour and material
properties were unknown. Having perceived the interactive nature of the
problem, it was realised that only an iterative approach was suitable to
address the subject. A "pilot study" (Reading Rope Research & Global
Maritime Ltd. (1988)) was devised to perform the first iteration. The study was
funded jointly by: Brasnor AS, British Petroleum Ltd., British Ropes Ltd. and
Conoco (UK) Limited.
Within the "pilot study" a review of tether properties thought to be relevant to
two classes of mooring systems, direct tension and spread mooring systems,
was performed. These "first approximation" properties were used to analyse
6

the behaviour of the systems incorporating LVVTs, to develop means of
comparing their performance with the performance of all steel mooring
systems, and to select the most attractive LWTs for further investigation.
A second phase was devised to provide a detailed assessment of the relevant
properties of the tethers selected, to refine the comparative analyses
performed in the "pilot study", and to enhance the analysis tools developed in
the "pilot study" to optimise and compare the performance of spread mooring
systems ((Chaplin (1989) and Global Maritime Ltd. (1989,3)).
This dissertation gives an overview of all the work performed in the "pilot
study", but concentrates on the investigation of material properties initiated in
the "pilot study" and carried on according to the proposal for the second phase
(Global Maritime Ltd. (1989,3)).
The study culminates with a feedback of the properties obtained for selected
fibre ropes into design cases, leading to recommendations concerning both
the relevant properties of LWTs to be used in spread mooring systems, and the
design of these systems.
To provide the industry with an early account of the work performed, a
preliminary publication of the outcome of this study was made by Chaplin &
Del Vecchio (1992). Since the major content of this paper is a summary of the
discussion presented in Chapters 8 and 9, no further reference to it will be
made.
Chapter 2 reviews the concepts used for deep water production systems.
Starting with a brief characterisation of the environmental loading, it reviews
the design of vertically moored vessels, i.e. tension leg platforms (TLP), and
the performance and opportunity for light weight tethers to be used with this
concept. The bulk of the chapter is dedicated to the concept that has been
selected as the most promising for the use of light weight tethers (LVVTs), i.e.
spread mooring systems. Design limitations, environmental loading and
response, analysis methods and relevant codes of practice are reviewed.
Chapter 3 narrows down the discussion to systems incorporating LVVTs. First
the very few papers published on the subject are reviewed, with main
7

emphasis on the analysis methods employed and system response observed.
The chapter then concentrates on a "Comparison of the performance of
lightweight and conventional catenary mooring systems" carried out by Global
Maritime Ltd. (1989,1) as part of the "pilot study" above mentioned.
The analysis methods developed and employed are discussed. -Particular
attention is given to the results obtained. Enough evidence was found to
insure the cost effectiveness of combined systems based on fibre ropes made
of Polyethylene Terephthalate (polyester) fibres assembled in stiff, low twist
constructions. The system response and corresponding tether loads for these
line configurations were carefully annotated.
Chapter 4 is a review of the characteristics of synthetic fibre ropes, with the
prospective application in view. Part of this chapter was conducted
simultaneously and interactively with the mooring design work discussed in
chapter 3 as part of the same "pilot study".
A brief overview of fibre ropes is followed by a general review of the properties
of industrial fibres currently available for rope making. Based on
environmental resistance and the strength and stiffness characteristics when
made into ropes, taking due account of the results of the comparison of design
performance, polyethylene terephthalate (polyester, PET) fibres were selected
for further study. A detailed review of the mechanical properties of this fibre is
presented, taking into consideration rheological and environmental effects
deemed relevant.
The bulk of chapter 4 discusses the fibre ropes themselves. First, attention is
given to the rope constructions and terminations, with particular attention to
strength conversion efficiency. Rope properties pertinent to the application are
reviewed. Modelling the mechanical behaviour is briefly touched upon, since
it has had restricted attention by previous workers. The key issues of strength,
stiffness, creep and hydrolysis are given particular attention. Limited testing of
the strength and stiffness characteristics of a small diameter PET fibre rope,
which was performed to focus better the experimental effort to come, is also
described.
Chapter 5 consolidates the outcome of chapters 3 and 4 and outlines the main
8

experimental testing programme. Spread mooring systems consisting of an
upper segment of wire rope or chain, an intermediate section of low twist PET
fibre ropes and a lower segment of steel chain have been selected for further
study. The installation and operational loads in such systems are spelt out. A
justified description of the materials testing programme follows including:
scale of the elements tested, strength, stiffness, creep, environmental assisted •
degradation and "fatigue" tests.
Chapter 6 describes: the materials tested, the apparatus used and the testing
procedures employed. A description is given of the actual yarns and ropes
tested. For each of the characteristics investigated, the equipment used, either
available at the University or purpose built for this study, is described. Of
particular interest are the rope creep testing machines developed. Testing
procedures, generally amalgamating the recommendations of standards with
the particular characteristics of the application envisaged, are detailed.
The results obtained from the materials investigation are given in Chapter 7. A
statistical analysis of the data is conducted, and major trends noted. A detailed
discussion of the data is left for Chapter 8. Yarn and rope strength are
compared with the literature available and the tests performed in the "pilot
study". Recommendations are given on minimum breaking strength to be used
for design purposes. The apparent Young's modulus of the yarns and ropes in
the relevant load cases are compared with the scarce previous work. A simple
structural model is presented to predict rope dynamic stiffness from yarn
figures. Recommendations for design are also given. Hysteresis results are
compared with wire rope results and damping model assumptions discussed.
Total rope creep is compared with the application requirements and creep
rates used to discuss operational procedures. The measured environmentally
assisted degradation is compared with previous work and a suggestion is
made for incorporating the effect into the design procedure. The damage
caused by cycling under severe, but not unrealistic, conditions is discussed in
relation to the single comparable set of published results. Failure mechanisms
and the influence of "fatigue" in design are discussed.
Chapter 9 presents a set of case studies where systems incorporating the fibre
ropes studied are compared with wire rope chain combination moorings and a
9

single case with a system based on an aramid fibre rope. Frequency domain
dynamic and quasi-static analysis techniques are used to verify the influence
of the measured material properties in the comparative performance of these
systems, and on the conclusions drawn in the "pilot study". Different analysis
techniques are briefly compared with findings reported elsewhere and
suggestions are given concerning methods to be used.
Chapter 10 presents conclusions relevant to the technical and economic
feasibility of using spread mooring systems incorporating light weight
materials for deep water station keeping. Recommendations are given on
design methods and further work necessary to implement these systems is
also identified.
Note - The following trade marks are acknowledged (no further
acknowledgement is made in the rest of the dissertation):
Brascorda Parallel - parallel strand rope from Brascorda S.A.;
Dacron - polyester fibre from E. I. du Pont de Nemours & Co.;
Diolen - polyester fibre from AKZO;
Dyneema - high molecular weight polyethylene fibre from DSM;
Hytrel - polyester elastomer from E. I. du Pont de Nemours & Co.;
Jetstran - wire rope type, fibre rope construction from Whitehill
Manufacturing Corporation;
Kevlar - aramid fibre from E. I. du Pont de Nemours & Co.;
Mylar - polyester film from E. I. du Pont de Nemours & Co.;
Parafil - parallel yarn fibre rope construction from Linear Composites
Ltd;
Spectra - high molecular weight polyethylene fibre from Allied-Signal
Corporation;
Superline - parallel sub-rope fibre rope construction from Marlow
Ropes;
Technora - aramid fibre from Teijin;
Vectran - liquid crystal polymer fibre from Hoechst Celanese
Corporation; and,
Zytel - nylon resin from E. I. du Pont de Nemours & Co.
10


../.....-"--
\ \\\\
\
\
\
\
\
\
7300
-E--
'Es
0
4615
.(75
C5mcra)_c
st5co
"CTS4E'a)co2a_
2
Itico'inca)E156
1--
cm
0)C-=ooE
71).a)
÷c/5=
as
8
cn4L-CDC0a_
Eo0
'FsIL-oN
'a=0-Ca.-
..CT)-C-I-.
-0C0
CnC0
.CCT)
CD4-•
o4--OCo0Pa)Pasoa)_c4-,
0
U)-0C00-co22L._o0co
-4=.(2m0)
74.=C
-o0
\

2. MOORING CONCEPTS
2.1. Alternative Concepts for Deep Water Production
According to Lewis (1982), for a Gulf of Mexico location, Tension Leg
Platforms and Guyed Towers become cheaper than fixed jackets after 300 m
of water depth. Bleakley (1984) suggests that in the North Sea the break even
point happens at larger depths, but points out that in 300 m floating production
systems based on spread moored semi-submersibles and weather vaning
tankers connected by a yoke to a monobuoy are half the cost of a fixed jacket
(without considering the extra cost of subsea wellheads). It is clear that, with
the current technology, fixed structures are not likely to be used in waters
deeper than 500 metres.
Guyed Towers have intermediate characteristics between fixed jackets and
floating structures and were not found to provide economically attractive
solutions. When an option is made to have the wellheads at the platform deck
level, the most attractive solution in deep water has been the TLP.
Floating production systems based in weather vaning ships have the
advantage of cargo capacity, but there are no facilities for drilling or workover
operations, they also require more extensive adaptation than semi-
submersible platforms, increasing lead time and cash flow requirements.
Therefore, when an underwater production system is chosen a floating
production system based on a semi-submersible platform is usually preferred.
For these reasons this study will concentrate its attention in TLPs and Semi-
submersible platforms. In this chapter each concept will be discussed
individually in order to identify the main characteristics of each design. The
mooring systems of both concepts, limit horizontal vessel motions to comply
with restrictions pertinent to:
(i) the kind of equipment connecting the platform to the sea floor, and
(ii) interference with other installations.
Before discussing the characteristics of the two systems, we will first briefly
examine the environment which acts on any offshore structure.
11

2.2 Environmental Loads
Offshore structures are subject to loading from winds, waves and currents, all
of which are complex functions of time and stochastic in nature. The following
description is limited to components in the frequency range between
approximately 3x10⁻³ and 0.3 Hz, thought to be relevant to floating platforms.
Wind speed has variable direction and intensity being a function of height
above the sea level. Wind has a turbulent component consisting of vortices
varying in length from a few centimetres to more than one thousand metres
(Global Maritime Ltd. (1989,1)). At typical wind speeds of 25 m/s vortices of
wave lengths between 750 m and 5000 m have frequencies in the range of
the natural frequencies of horizontal motions for both semi-submersible and
tension leg platforms. These lengths are well correlated over typical length
scales of these types of platforms, making it possible for them to excite
resonant motions (Global Maritime Ltd. (1989,1)). Several spectral forms have
been used to describe wind speed, the most common ones being: Harris,
Davenport, Kaimal and Ochi & Shin (1988).
Waves at a given location can be the summation of several systems which
have been generated in different areas. In this way a full description of the sea
state must include a distribution of wave direction as well as of wave height.
For mooring design purposes the wave spectrum is usually considered uni-
directional and spectral forms most commonly used are: ISSC, Pierson
Moskowitz, Wallops and Jonswap (Noble Denton (1986). Once a formulation
is chosen, a height parameter (for example the significant height) and a period
parameter (for example the peak period) are enough to fully describe the
spectrum.
Current generation is associated with tidal movements and winds. At a given
location current speed may vary with depth, but it is normally considered
steady in time over periods of up to 1 hour.
12

2.3 Tension Leg Platforms
2.3.1 General Characteristics
TLPs are systems compliant to horizontal components of platform motion and
stiff to vertical components. Surge and sway are resisted by the horizontal
component of tether tension that arises as the platform is displaced away from
the direct vertical of the rest position. Natural frequencies for horizontal
motions are lower than first order wave frequencies, in order to avoid the
resonances which limit fixed jackets (Salama (1984)).
Vertical components of platform motion are directly resisted by tether tension.
For current designs, natural periods of heave roll and pitch are kept below
wave periods by a very stiff tether system, to avoid problems with dynamic
amplification, i.e. loads significantly in excess of those corresponding to a
quasi-static process (Salama (1984). In doing so, all vertical motions,
including those due to pay load variation and tides are kept to such low levels
that rigid steel risers can be used and the wellheads installed in the platform.
The API RP 2T (1987) gives guidance on the design of TLPs. Figure 2.1 from
the API code illustrates the tension superpositions leading to maximum and
minimum tendon tensions. Tether pretension at Mean Water Level should be
enough to avoid tether slackening or excessive surge.
Maximum allowable stresses under extreme environmental conditions are
restricted to 60% of the yield or 50% of the ultimate strength for the net axial
stress and to 90% of yield or 70% of ultimate for local bending stresses,
whichever is less. Tubular tethers should also be designed to resist
hydrostatic collapse (Hanna et al. (1987) and API RP 2T (1987)).
Hanna et al. (1987) also point out that, for tubular tethers, the stresses due to
hydrostatic pressure should be combined with the stresses due to direct
loading of the tether to assess the actual safety factor against yield.
Using a tethering system that places the system natural frequency of vertical
motions above the peak frequency of wave spectrum makes the dynamic
amplification always higher than unity but if the difference between natural
13

and forcing frequencies is substantial or damping is high, dynamic
amplification tends to unity.
Usually the platform geometry is optimised (Horton et al. (1972)) by
proportioning of columns and pontoons to obtain heave force cancellation at
the most significant loading conditions. This is a function of wave length, wave
frequency, column and pontoon cross sectional areas and pontoon length.
2.3.2 Light Weight TLP Tethers
Early TLP tether systems were based on small bore steel tubular tethers. The
Hutton TLP for example, after considering: chain, wire rope, parallel strand
wire rope and threaded tubulars as candidates, settled for the heavy weight
steel tubes (Salama (1984)).
The tubes used have a diameter to thickness ratio (D/t) of 2.8 and so cannot
make effective use of buoyancy to reduce apparent weight. This kind of tether
would impose a severe weight penalty on deep water TLPs unless external
buoyancy was added. For this reason tethers based on light weight materials,
like aramid fibre ropes and carbon fibre composites have been considered for
deep water applications (Salama (1984) & (1986), Salama et al. (1985) and
Kim et al. (1988)).
The use of thin walled tubes, with a diameter to thickness ratio of 30, made
neutrally buoyant by closing their ends, has extended the water depth in
which tubular tethers can be used. However with increasing water depth
hydrostatic collapse becomes a problem. According to Hanna (1987) buoyant
steel tubes made of 345 N/mm2 yield strength material could be use for water
depths between 300 and 600 metres.
Lim (1988) assessed platform design and cost for a number of tether types:
small bore steel tubulars, thin walled buoyant steel tubes, steel spiral strands
and carbon fibre, glass fibre and aramid-fibre stranded composites. Water
depths of 300 and 600 metres were investigated. Buoyant steel tubulars were
considered to be the most cost effective tether option.
Global Maritime Ltd. (1989,2) found that 450 N/mm 2 yield strength buoyant
14

tubulars could be used down to 945 metres. By restricting the maximum
number of tethers per platform corner to six and maximum net tether weight to
10% of total platform displacement, water depth limits for steel tubulars of the
same grade of material were found to vary between 1350 and 1850 metres for
large and small displacement platforms respectively (Global Maritime Ltd.
(1989,2)).
Light weight tethers (LWT) considered to date for TLPs have encompassed:
ropes, tubulars and strands. Ropes made of aramid fibres and high molecular
weight polyethylene (HMPE) in stiff parallel lay or wire rope constructions
have been considered. Glass fibre, high modulus aramid and a number of
carbon fibre grades have been discussed for both tubular and stranded
tethers.
The major advantages of most light weight options proposed as compared to
their steel counterpart are: weight reduction, simpler installation, corrosion
resistance and fatigue performance (Walton & Yeung (1986) and Salama
(1984)).
The major disadvantages of LWTs are: low stiffness on an area basis (Walton
& Yeung (1986)), high cost and difficulty in the production of very large
capacity tethers (Lim (1988)). For example, Global Maritime Ltd. (1989,2)
calculated that the number of 250 mm diameter carbon fibre pultruded strands
tethers required per platform corner for a large displacement TLP (156000
tonnes) in 1350 m of water would be 18. This diameter is in the limit of the
current manufacturing technology available and still the number of tethers
needed is unrealistically large in terms of handling limitations.
Although light weight tethers were shown by Salama (1986) to be cost
competitive with steel tubulars similar to those used in Hutton, Lim (1988) and
Global Maritime Ltd. (1989,2) found LWTs substantially more expensive than
thin walled tubulars.
As pointed out by Global Maritime Ltd. (1989,2), LVVTs have to be sized for
stiffness in all but the shallowest water depths. For example a TLP, with high
modulus carbon fibre pultruded strand tethers, must have its tethers sized for
stiffness in waters deeper than 800 metres, this imposes a cost penalty since
15

the material cannot be stressed to its available limit.
For these reasons both Lim (1988) and Global Maritime Ltd. (1989,2)
considered LWTs useful only in very deep waters (possibly •deeper than 1500
metres) where steel tethers could not provide a technically feasible solution. A
typical maximum limit for tether tension as a percentage of platform
displacement would be 10% Global Maritime Ltd. (1989,2).
As discussed by Salama (1986), deep water TLPs need complicated and
expensive tensioning and motion compensation systems in their steel risers in
order to cope with the effects of: pressure, thermal expansion, current and
wave loading and platform movements. McCabe (1991) describes the
tensioners in the Auger platform (in 872 metres) as having a stroke of 1.83 m
(6 ft.). Salama (1984) has proposed the use of composite risers in deep water.
Composite risers can have a different stiffness in the axial and radial
directions.
An option that has not been explored so far, is the use of much lower stiffness
tethers in combination with low axial stiffness composite risers. By having
adequately low axial stiffness risers the riser compensators could be made
redundant. Using low stiffness tethers the natural periods of vertical motions
can be well above the wave periods. Tide amplitudes would be a key
parameter in the feasibility of this sort of tethering system.
For example, in Campos basin, where tides are quite low (100 year
recurrence total tide = 1.45 metres), maximum tether strain due to tidal
variation plus a 6% of water depth offset would not exceed 0.25% (2500 Ile)
for a TLP in 2000 m of water. Trimming the frequency response of the system,
fatigue loading on tethers and risers can be minimised.
2.4 Spread Mooring Systems
2.4.1 Introduction
Spread moorings are generally compliant systems, i. e. have low stiffness, in
relation to all vessel motions. Significant vessel offsets are needed to develop
16

enough restoring forces to balance the mean environmental loads. This
comes to their advantage in "filtering" the dynamic components of the
environmental forces.
The main function of the mooring system is to restrict the vessel offset to
acceptable limits. For the system to operate adequately and safely, however,
other conditions also have to be fulfilled. Typically, limits are imposed on the
maximum load in the individual components of the mooring system as a
percentage of their minimum guaranteed breaking load. If cyclic loads are
significant, components must also have adequate endurance to survive the
foreseen lifetime. Other requirements, such as avoiding non-horizontal loads
on drag-embedment anchors, will be dictated by individual system
characteristics.
The following sections briefly review the most relevant design parameters, the
interaction of the system with the environment, the commonly used design
procedures and the main requirements of the relevant codes of practice.
2.4.2 Offsets
Offset requirements for drilling vessels are a function of drilling riser in use
and detailed guidance concerning a particular installation can be sought from
API RP 20 (1984). General information can be obtained from API RP 2P
(1987), which states that usually an offset between 3% and 6% of the water
depth (WD) is acceptable while drilling and a 3% to 10% of WD offset can be
tolerated with drilling suspended but with the riser still connected to the
seafloor.
Production units will normally have their offset limits dictated by wellhead
risers and pipelines. API RP 17A (1987) and API RP 17B (1988) give
guidance on design of such systems.
General guidance can be obtained from API RP 2FP1 (1991), which states
that typical offset limits are: (i) 8% to 12% of WD for units with rigid risers, (ii)
10% to 15% of WD if flexible risers are used in deep water and (iii) 15% to
25% of WD for similar systems in shallow water.
17

2.4.3 Environmental Forces
Current, wind and waves have mean components that act on floating units to
produce a steady state force for any given sea state and direction. Wind and
waves also have oscillatory components that excite the vessel dynamically.
Current forces are usually considered as steady for the purpose of mooring
analysis. They act on the vessel, on the risers and on the mooring lines.
Current forces should preferably be obtained by model testing (API RP 2P
(1987)). If test results are not available current forces, Fc, can be calculated by
simplified formulas (API RP 2P (1987), API RP 2FP1 (1991)) of the form:
Fc = C . V2
where: Vc = current speed, and
C = function of the drag coefficient and the vertically projected area of
immersed members.
For productions units, forces on the riser system will be a significant proportion
of total current loading.
Although current forces can be considered steady over short periods of time
Larsen & Fylling (1982) point out that current action on mooring lines induces
vortex shedding which excites transverse vibrations. Such motions can
increase the drag coefficient of the lines by a factor between 1.5 and 2.5 and
will be seen to alter the dynamic response of the mooring lines significantly.
The action of wind on floating offshore units for the purpose of mooring
analysis can be taken into account in two different ways: (i) by considering it
steady and averaged over a short period of time (one minute in API RP 2P
(1987) and API RP 2FP1 (1991), and 10 minutes in DnV POSMOOR (1989))
or (ii) by treating it as a steady force based on average speed over a longer
period, say one hour, plus a time varying component based on an empirical
wind spectrum ( API RP 2FP1 (1991)).
The steady force component Fw is either obtained by model testing or
calculated by equations of the form:
18

Fw = Cw . Vw2
where: Vw = design wind speed; and,
Cw = function of the area, shape and height of an installation or
structural component.
A detailed description of the procedures for carrying out such a calculation
can be found on API RP 2FP1 (1991). Not much guidance is given on any of
the rules for calculating the forces due to the spectral component of wind
speed.
For the purpose of analysis, the effect of the waves on a floating unit can be
conveniently split in three components: (i) a steady loading (mean wave drift),
(ii) a loading spectrum associated with the first order peak or peaks of the
wave spectrum (high frequency, wave frequency or first order response) and
(iii) a loading spectrum associated with the second order energy present in
the wave spectrum and the gusty nature of wind, encompassing the natural
frequencies of the moored vessel (low frequency, slow-drift or second order
response).
According to API RP 2P (1987), the steady component can be determined by
model testing or evaluated from graphs contained in this code. API RP 2FP1
(1991) recommends the use of model tests or motion analysis computer
programmes. Simplified formulations, based on a mean wave drift coefficient
and the significant wave height, have also been used.
First order wave forces can be evaluated by: (i) model testing (API RP 2P
(1987), API RP 2FP1 (1991) and DnV POSMOOR (1989), (ii) computer
analysis (API RP 2 FP1 (1991)) or (iii) simplified equations as a function of
significant wave height and a coefficient, which for semi-submersible
platforms is predominantly a function of mean wave period.
Due to the huge masses and relatively high frequencies involved, first order
forces, although associated with relatively small platform displacements, are
very big and cause motions in the six degrees of freedom of the vessel (Morch
& Moan (1985)). It is usual in some design procedures to account directly for
wave frequency vessel motions by means of a response amplitude operator
19
(RAO), translating wave heights into vessel motions, for each degree of
freedom, over the wave frequency range (usually from model tests or
computer simulations of vessel motions). In this way first order wave forces on
the vessel do not need to be spelt out.
According to API RP 2P (1987) and API RP 2FP1 (1991) low frequency wave
forces can be obtained by model testing or by analytical methods. The former
also provides graphs for maximum forces and motions obtained by computer
simulations for a range of vessels. API RP 2FP1 (1991), however, warns that
these graphs should not be used for large floating production units owing to
their different displacement.
2.4.4 Basic Response
Spread mooring systems resist the steady component of environmental forces
(current, wind and waves) by offsetting from the equilibrium position and
generating a net increase on the summation of the horizontal component of
the tension acting on all mooring lines (windward lines will experience a
tension increase and leeward lines will be slackened). Figure 1.2 shows a
two-dimensional representation of this behaviour.
Excluding current effects on the mooring lines, the static behaviour of each
individual mooring line is governed by the catenary equation (see for example
Timoshenko & Young (1965). Figure 2.2 (API RP 2P (1987)) shows a typical
load x offset plot for a single component line and the total system restoring
force as a function of offset. The non linearity of both graphs should be noted.
For the purpose of mooring analysis, dynamic response of floating systems
can be conveniently divided in two time scales: high frequency and low
frequency, in a similar way as was done for the environmental forces.
High frequency response is the system behaviour when excited by forces with
frequencies ranging from about 0.04 to 0.25 Hz. These predominantly wave
induced forces are very large indeed. Net forces involved, for a range of
semi—submersible platforms, range from 50000 kN to 150000 kN and a typical
displacement amplitude would be 5 metres (Global Maritime Ltd. (1989,1)).
Considering the low stiffness of the mooring system, say between 50 kNim
20

and 300 kN/m, no more than 3% of the net force can be absorbed by the
moorings. Therefore first order forces are usually considered as acting on the
unrestrained vessel, i.e. being opposed only by inertia and drag.
As water depth increases, the contribution of the first order motions to total
platform offset becomes less important. Nonetheless these motions can still
excite significant dynamic tensions in the mooring lines. This will be discussed
in more detail below (Section 2.4.5).
Low frequency response is the behaviour in the frequency range
corresponding to the natural modes of the horizontal motions(yaw, sway and
surge) of the moored unit. Second order waves and wind forces provide the
excitation for the low frequency response.
Typical periods for these motions are from 30 to 200 seconds. Since periods
are long, the lines behave essentially in a quasi-static manner, each line
following its statically determined load excursion curve and the system having
the same (quasi-static) restoring force-offset characteristics.
Second order wave forces are too small to excite motions in the vertical plane,
due to the high hydrostatic restoring forces. However they act at frequencies
close to resonance for the horizontal motions. Since the periods are long, the
relative speed between the vessel and the water is small and so is the
damping. Also, because the effective stiffness of the mooring system is usually
small, large motions can result, and a good estimate of damping is a key factor
in the reliability of the analysis of motions due to these forces.
Maximum system offset is a summation of the steady component with a
combination of low frequency and wave frequency motions. As discussed
below, different codes of practice advocate different ways of accounting for the
statistical nature of the dynamic components when doing this sum.
Considering that mooring lines do not provide any effective restriction to first
order wave frequency movements, maximum line tensions can be assessed
by considering the fairlead motions at wave frequency as imposed
displacements in each line from their equilibrium position for the system under
the steady plus the low frequency force. Once again the way in which the
21

statistics of the dynamic tensions are considered varies according to the code
adopted.
The analysis of the response of the system can be based onlyon the static
catenary equations, or can take into account the dynamic effects mainly from
drag and inertia.
2.4.5 Quasi-Static Analysis
The quasi-static method analyses the system as if no dynamic amplification
exists, i.e., by considering that each mooring line responds with a static
catenary behaviour. The procedure consists of:
(i) calculating the equilibrium position of the vessel and of the mooring
lines as well as their tensions due to the action of the steady
components of current, wind and waves;
(ii) taking the low frequency response into consideration by either using
a wind speed averaged over a small period, say one minute, as a
steady component, or by calculating the low frequency vessel
motions based in the stiffness at the displaced position found in (i)
and adding these motions as a static offset; and,
(iii) calculating the tension on individual lines by superimposing the
wave frequency motions translated to the fairlead on the mean plus
low frequency equilibrium position.
2.4.6 Dynamic analysis
The dynamic response of mooring lines to wave frequency excitation departs
from the catenary equation more and more as the water gets deeper. The
main reason for this behaviour lies in the dynamic changes in the axial
stiffness of the mooring components and the dynamic interaction between the
cable and the environment.
The axial stiffness behaviour is strongly influenced by phenomena occurring
at the touch down point and in the grounded region (Larsen & Fylling (1982).
The mooring components themselves show non linear stress-strain
22
characteristics. Chaplin & Potts (1991) discuss results obtained by a series of
other workers and conclude that for six strand wire ropes axial stiffness can
vary up to 15% when loading conditions vary from full-slip between the wires
to no-slip, however they conclude that this variation is unlikely to be of major
concern.
Synthetic mooring lines can have a marked time dependent behaviour due to:
(i) viscoelastic material behaviour; and,
(ii) significant constructional contractions present in all but parallel laid
ropes.
This issue will be discussed in more detail later.
Two major effects are associated with the cable water interaction:
(i) current effect on drag coefficient; and,
(ii) drag associated with platform induced line movements.
Currents are known to excite (vortex induced) vibrations on cables. The
influence of these vibrations on drag force can be dramatic. Larsen & Fylling
(1982) point out that drag coefficients in the range of 1.5 to 2.5 should be used
rather than 1.0 to 1.2 as for rigid cylinders. In recent measurements on a
vertical tow cable Yoerger et al. (1991) found drag coefficients varying
between 2.2 and 2.5.
As the mooring line is dragged in an accelerated movement through the water
it is opposed by a force normal to each cable element that can be calculated
by the dominant drag component of Morrison's equation:
Fd = 1/2 . p . Cd . v2 . D ,
where: Ed = drag force,
p .-.-- density of water,
Cd = drag coefficient,
v = relative velocity normal to the line, and
D = cable diameter.
The dynamic behaviour of spread moored vessels and mooring lines can be
analysed in the frequency domain or in the time domain. In both methods it is
23

usual to assume that the low frequency and the high frequency responses of
the vessel are decoupled.
On a frequency domain analysis, RMS (root mean square) low frequency
motions are usually calculated using a one degree of freedom model, with the
stiffness of the mooring system at the static equilibrium position. Second order
motions are then considered as an additional offset and a new equilibrium
position for the platform calculated based in the quasi-static system response.
First order RMS vessel motions are calculated in the unmoored condition. An
appropriate combination of these motions with the mean offset dictates the
maximum platform offset.
A typical procedure for calculating first order line tensions via a frequency
domain analysis consists of:
(i) obtaining a response amplitude operator (RAO), translating wave
heights into vessel motions for each degree of freedom over the
wave frequency range (usually from model tests or computer
simulations of vessel motions);
(ii) calculating a response spectrum by integrating the RAO with the
wave spectrum; and,
(iii) integrating the response spectrum and taking its square root to
obtain the RMS response.
Significant and maximum values can then be estimated by assuming a
statistical distribution. Assuming a narrow band Gaussian process with
Rayleigh distribution of peaks leads to the following estimates:
(i) significant value = 2. RMS value; and,
(ii) maximum value = (1(2. In(T/Ta))) . RMS value
where:
T = specified duration for the sea state; and,
Ta = the average zero up crossing period.
DnV POSMOOR (1989) recommends a minimum duration T of 2 hours.
Time domain analysis procedures typically consist of a low frequency and a
24

wave frequency calculation. The low frequency module transforms the
second order combined spectrum of environmental forces in a time series
which is then applied iteratively in a quasi-static model to obtain a time series
of line tensions. The wave frequency module uses the first 'order spectrum of
line motions at the fairlead to *generate a motion time history, which is then
applied iteratively to the line. A time series of line tensions is obtained at
selected line points. The tension time series obtained in both modules can
them be combined and the maximum total tension for the simulation period
obtained.
Dynamic mooring line behaviour is nowadays analysed with the use of
computers. Discretization methods commonly used are the lumped mass
(Larsen & Fylling (1982), van den Boom (1985), and Global Maritime Ltd.
(1989,1)), and more complex finite element methods. The former concentrates
all the mass at nodes connected by massless springs. The later uses
interpolation functions to describe the values of the variables at intermediate
positions on each element as a function of nodal values.
The solution for the system of equations obtained can be developed in the
time domain or in the frequency domain. According to Noble Denton (1986)
the time domain solution can take up to 2 orders of magnitude more
computing time than the frequency domain solution. The solution in the
frequency domain uses the principle of superposition, and so all non-
linearities have to be linearised. A time domain solution can take full account
of all non-linearities present since for each time step individual mass,
damping, stiffness and loading terms are recalculated. Because of the huge
computer effort involved it is unusual to use the time domain method except
for the analysis of the extreme loading condition on the most tensioned
mooring line.
Larsen & Fylling (1982) calculated the dynamic response of wire rope
mooring lines and chain moorings in water depths between 70 and 300 m.
The input motion was an harmonic horizontal oscillation. For wire rope lines a
pseudo axial elastic, also called "frozen catenary", behaviour was found to
prevail for most of the relevant range of frequencies and pretensions.
Figure 2.3 shows the results obtained in 150 m of water.
25

A similar trend was found by Global Maritime Ltd. (1989,1) for wire rope, and
wire rope chain combinations in water depths from 500 to 2000 m.
Results reported by GVA (1990) for a floating production platform in Campos
Basin in 1000 m water depth, using combined chain/wire rope/chain mooring
lines, showed a different trend. The results of a frequency domain analysis
accounting for both horizontal and vertical fairlead movements showed that:
(i) Considering the full length of all components as working axially in
the calculation of the axial elastic stiffness, the effective dynamic
line tension turns out to be 52% of the tension calculated assuming
a pseudo axial elastic, i.e. frozen, behaviour.
(ii) If we consider that only 600 m of the lower chain component
contribute to the axial stiffness of the line (which should be the
approximately the amount of chain lifted off the sea floor), the actual
dynamic line tensions become 42% of the tension in a "frozen
catenary".
2.4.7 Codes of Practice
Depending on the country where the vessel is going to operate, it has to
comply with rules set by national authorities, certification societies and or
standards organisations. These codes basically address:
(i) the kind of vessel and application envisaged (scope);
(ii) the mooring materials and equipments;
(iii) the loads;
(iv) the design criteria; and,
(v) the acceptable analysis methods.
Code procedures and requirements referring to the first three items have
already been discussed. Design criteria and acceptable methods are
discussed below for the 3 codes that are likely to be applied in the areas
where deep water activity is currently more intense. These are: DnV
POSMOOR (1989), API RP 2P (1987) and API RP 2FP1 (1991).
26

API RP 2P (1987) is a code for drilling vessels and so sets excursion limits
based on the drilling riser used. Three design conditions are identified:
maximum operating, maximum connected and maximum design.
Maximum offset is defined as the mean offset plus:
(i) significant wave frequency motion plus maximum low frequency
motion; or,
(ii) maximum wave frequency motion plus significant low frequency
motion,
whichever is greater.
Maximum line tension is defined in a similar way as maximum offset. It should
not exceed 50% of the nominal strength of the line for the maximum design
condition and 33% for the operating condition.
The quasi-static analysis procedure, taking into account the low frequency
motions, is recommended.
DnV POSMOOR (1989) applies to mobile offshore units in general and is a
concise standard. It defines 2 operating conditions:
(i) "Condition ri corresponds to situations where a single line failure is
not critical (for example, a drilling vessel with riser disconnected and
far from other structures); and,
(ii) "Condition II" should be applied where any failure in the positioning
system leads to a critical situation for the overall unit (for example, a
production unit using rigid risers where loss of position is critical for
the overall safety of the unit and those aboard).
The rules require that the tension safety factors shown in Table 2.1 be met.
More general restrictions are imposed on offset limits. The rules do not give
guidance on how high frequency and low frequency tensions are combined to
obtain maximum tension. When a quasi-static analysis is performed, low
frequency (XLF) and wave frequency (XFF) offsets are combined as:
Xior = "V XFF2 + XLF2
The quasi-static analysis method is accepted for vessels in waters shallower
than 450 metres. When a dynamic analysis is used, a time domain procedure
27

is preferred.
API RP 2FP1 (1991) is a draft code which applies specifically for floating
production units.
Maximum offset is defined in the same way as API RP 2P (1987) and the user
is referred to specific riser rules for guidance on admissible offsets values.
Maximum line tensions are obtained from the mean, low frequency and high
frequency tensions by a combination similar to that described in API RP 2P
(1987).
Maximum allowable tensions for the intact system and for one line broken are
respectively 60% and 75% of the nominal strength of the line.
In addition to the offset and maximum tension requirements the mooring lines
have to be assessed for endurance. A safety factor of three on life is
recommended for the Miners summation. For both the extreme response and
the fatigue analysis a dynamic analysis is recommended. Time domain or
frequency domain procedures are accepted.
With regard to the use of synthetic fibre ropes API 2FP1 (1991) states:
"Because of a lack of long term service experience and concern regarding
handling problems, synthetic materials are generally not used in permanent
mooring systems, although research is ongoing to develop synthetic materials
that may prove acceptable". DnV POSMOOR (1989) only mentions that: "NV -
certification will be required for synthetic fibre rope and fibre rope end
attachments". Apart from these brief mentions the codes do not provide for the
use of fibre ropes.
28

Operationcondition.
Quas'staticana ysis
Dynamicanalysis
POSMOOR POSMOOR V I) POSMOOR POSMOOR V I)
Intactsystem 1,80 2,00 1,50 1,65
TransientI motion 1.10 1.10 1,00 1,00
Temporary mooringafter singleline failure 1,25 1,40 1,10 1,25
Intactsystem 2,70 3,00 2,30 2,50
TransientH motion 1,40 1.40 1,20 1,20
Temporary mooringafter singleline failure 1,80 2,00 1,50 1,65
1) Applies for anchor lines which are located within a critical sector, normally in a 180 degrees sector facing away from the installation, seefigures 1 and 2.
— For d5L, the anchor lines outside the critical sector may be designed according to operation condition I. POSMOOR V.— For d>L, the anchor lines outside the critical sector may be designed according to operation condition I. POSMOOR.
Upon special consideration a narrower sector may be accepted.
Table 2.1 - Permissible tension safety factors according to DnV POSMOOR
(1989).

FOUNDATION MISPOSITIONING MINIMUM TENDON TENSIONDOWN WAVE LEG
WAVE
WINDOFFSET
TIDE/SURGEPRETENSION
WIND
FOUNDATIONMISPOSMON
WAVE
OFFSET—
PRETENSION
TIDE/SURGE
MAXIMUM TENDON TENSIONUP WAVE LEG
Figure 2.1 - Tension components leading to maximum and minimum tendon
tensions ( from API RP 2T (1987) ).
restoring force
2000 -
2_v
020 1000 -U.
......ow..
ago.......
mow.
maw. n••••
.--...-....-
..... most loaded line tension
I0 10 20 30
Offset (m)
Figure 2.2 - Restoring force and tension in the most loaded line based in the
static catenary equation. Adapted from API RP 2P (1987).

1.2 -
ao•._(I)
04-,
0•...Ealc>.
G)cr,• ....
caE
oz
all
01
_ ____.4.
C.
V.
V.
1.0
0.8 -
-
0.6
0.4-
0.2 --
/
_
Static tension level
70 tonnes
---140 tonnes
- --- 220 tonnes
'0.0 1 . I
0.0 1.0 2.0
Frequency (rad/s)
Figure 2.3 - Dynamic tensions in the upper end of a steel wire rope mooring
line in 150 m water depth, presented as a fraction of the tension
obtained assuming a slow (quasi-static) axial elastic deformation
of the line without change in catenary shape (from Larsen &
Fylling (1982)).

3. DESIGN OF CATENARY MOORINGS INCORPORATING LWT
3.1 State of the Art
As early as the mid seventies the potential advantages of using synthetic fibre
ropes in deep water moorings started to attract research attention. Already in
1976, Niedzwecki & Casarella (1976), working on design curves for combined
wire rope and chain mooring lines, reported the intention of producing design
curves for synthetic rope-chain combination moorings.
Niedzwecki (1978), used a quasi-static model to compare the behaviour of:
chain, wire rope, chain-wire rope and chain-synthetic rope moorings in 100
metres and 1000 metres water depth. No consideration was given to dynamic
loads. The model took into account the non-linear nature of the axial stiffness
of fibre ropes by considering a semi-empirical constitutive equation of the
form:
Ta / b = cosh (c.e) - 1,
where: Ta = applied tension;
b = rope breaking strength;
e = percentage elastic elongation; and,
c = an characteristic experimental constant.
In 100 metres water depth no advantage was found in using synthetic ropes.
In 1000 metres, systems having the same minimum breaking load (MBL)
were designed to reach the same tension (1/3 of the MBL) at an offset of 5%.
A polyester rope with a characteristic constant (c) equal to 18, in a length
equal to the water depth, was used in combination with chain. The rope
construction was not specified, but from the graphs presented in the paper it is
possible to infer that it was a low twist construction, possibly a parallel strand
rope. The necessary pretension was 20% lower and the restoring force was
1.5 times bigger than on the chain only mooring. When compared with a wire
rope-chain combination mooring, the pretension was 4% lower and the
restoring force was 14% bigger at the 5% excursion.
Niedzwecki (1978) concluded that, as depth increases, nonmetallic ropes
become viable alternatives for all steel moorings provided their elongation is
29

not excessive.
Riewald (1979) reported confidential work done by Nachlinger in 1978
comparing the performance of a combination Kevlar (aramid) fibre rope-chain
with a steel wire rope-chain system. The analysis has shown that the optimum
Kevlar-chain system provided a bigger restoring force and need much lower
pretensions than the optimum wire rope-chain system.
E. I. du Pont de Nemours & Co. (undated) discusses Nachlinger's work in
more detail. They state that the mooring analysis programme used performed
a "static analysis with the addition of dynamic terms", taking into account:
surge, sway and yaw. The following materials were used: 3" diameter ORQ
chain, 3-1/2" diameter steel wire rope and 3-1/2" diameter Kevlar rope. The
procedures used and results disclosed are discussed in the paragraphs
below.
First, systems were compared using a two-point mooring model. Water depth
(224, 488, 732 and 1067 m) and chain length (426, 610 and 793 m) were
considered independent variables. Rope length was calculated so that anchor
uplift would start at the maximum anchor holding power. Pretension was
selected to have a maximum tension of 40% of BL at an offset of 6% of the
water depth.
Under these conditions, Kevlar rope-chain systems produced a 17% to 75%
bigger restoring force than wire rope-chain. Line pretension was 11% to 87%
lower than the wire rope-chain values. On the other hand Kevlar lines had to
be 3% to 45% longer than steel wire ropes for the same length of chain.
Since the performance achieved by the synthetic system was so much better
than the wire rope combination system, a second comparison was done
adjusting the Kevlar rope length to obtain the same performance, i.e. same
restoring force at an excursion of 6% of the water depth. The result was that
Kevlar lines could be made 14% to 40% shorter than steel wire ropes, the
bigger difference corresponding to the deepest condition.
Finally, a drillship using an eight point mooring in 1070 metres water depth
was also briefly discussed. The report states that the Kevlar rope-chain system
30

was able to maintain the vessel in location under the worst environmental
conditions, while the steel wire rope-chain system could only obtain the same
result by using very high pretensions and slackening the leeward lines.
The first known design incorporating fibre ropes in an actual application was
intended to moor a production barge in 700 metres water depth offshore
Spain (Pollack & Hwang (1982)). Figure 3.1 shows the system with the turret
and its swivel as an integral part of the production barge.
Each of the six mooring legs had an aramid fibre rope upper component
700 metres long with 800 m of chain leading to an anchor. The aramid rope
was selected for:
(i) its light weight, so that it would be taken to the surface by a small
buoy in the event of an emergency disconnection;
(ii) the strict offset design requirements; and,
(iii) the lower pretension needed and lower static and dynamic peak
loads in comparison with a wire rope-chain combination system.
Model testing, at a 160:1 scale, was performed for static wind and current
forces in combination with regular waves and a wave spectrum. The tether
components were geometrically similar to the prototype but their stiffness in
the model was too high.
Low frequency damping in the model was found to be high enough to damp
out the free system response in 2 cycles. No whipping or formation of ripples
was observed in the chain.
The coupled barge and the mooring system were simultaneously analysed by
means of a time domain three-dimensional computer model. Mooring legs
were modelled by 2 node straight truss elements with zero bending and
compressive stiffness, with the mass concentrated in the nodes.
The programme could not handle a wave spectrum, so analysis considered
steady current and wind plus regular waves. The length of time used in the
simulation was said to be enough for "all the results to converge to a stable
cyclical solution".
Static and dynamic tensions were found to be substantially smaller than on a
31

wire rope-chain combination system. It was also observed that mooring leg
tensions increased nonlinearly with the stiffness of the aramid rope as shown
in Figure 3.2. In this way, dynamic loads could be reduced by increasing the
flexibility of the lightweight rope.
Although the technical concept has been developed to a very advanced state,
the oil reserves were found to be small and the field was never brought to
production.
A completely different use for fibre ropes was made in the temporary mooring
of the Hutton TLP at the deck mating site (Smith et al. (1985)). The design
environmental conditions were quite severe and the water depth was only 55
metres. The restriction on maximum load and loading angle in the padeyes of
the TLP precluded the use of a simple catenary tether in steel. Instead, an
intermediate barge had to be installed on each of the 8 mooring lines, having:
a chain on the side leading to the anchor and a nylon rope connecting it to the
platform via chaffing chains.
Maximum allowable line tensions were taken as 70% and 30% of the
breaking load respectively for the chain and the fibre rope in the intact
condition and 95% and 40% respectively for chain and rope with a single line
failed.
Static catenary equations were used throughout the calculations. First, the
equilibrium position due to mean loads was found. Then, low frequency
motions and forces due to waves were calculated based on the stiffness at the
position under mean load. First order platform movements were considered to
be decoupled from the steady and second order components. Forces due to
these motions were added to the previously calculated tensions to get the
maximum tension between the barges and the TLP. The maximum tension on
the section between the barge and the anchor, on the windward side, was
then obtained by adding the environmental load on that barge.
The use of a low stiffness fibre rope segment between each barge and the
TLP, efficiently kept the maximum tension within acceptable limits. The system
performed satisfactorily during almost two months that the TLP remained in
the mating site.
32

Taylor et al. (1987) reported on the design and installation of a triangular
shape semi-submersible platform, in 887 m water depth, offshore California,
USA. The platform displaced 96.4 tonnef and was moored by three lines.
Each leg had: a 152 m long upper component of 1" chain, a 1.5" diameter
1067 m long Superline polyester rope (see Section 4.5.1 for a description of
this construction), and a lower component of 122 m of 2" chain, leading to an
anchor. The platform had no line tensioning equipment.
The design process was fairly sophisticated. First, platform response (motions
and tensions) to all environmental load cases was computed based on the
static catenary equations for multi-component mooring legs. At this stage,
hydrodynamic and inertial effects on the mooring lines were not considered.
The dynamic response of the lines to the given motions imposed by the
platform was then computed at the average equilibrium position. This was
done using SEADYN, a finite element programme for time domain simulation
of cable response.
Finally the coupled response of the platform and the mooring system was
analysed in the time domain. In this analysis, the mooring lines were modelled
by non-linear truss elements. Chain lift-off and ground interaction were
included. According to Taylor et al. (1987) the full set of loading , material and
geometrical non-linearities were taken into account.
The maximum line tension under survival condition was 84.5 kN (19000 lbf)
and the maximum tension range obtained in the simulation was 45.5 kN.
These values correspond to 24% and 13% respectively of the minimum
breaking load (MBL) of the rope, as quoted by the manufacturer (H & T Marlow
(1985).
The system was reported to have been installed without problems. No
information has been found on the subsequent operational performance of
this system.
An appraisal of the use of parallel laid polyester and aramid ropes in
moorings for semi-submersible platforms was reported by Baxter (1988). A
platform displacing 60000 tonnes was evaluated in: 300, 500 and 900 m
33
water depth, subjected to a 100 year recurrence North sea environment. A 16
line symmetric mooring pattern was employed, having an upper component of
fibre rope and a chain leading to a drag embedment anchor. Some systems
were designed with clump weights between the chain and the rope,
increasing system stiffness and reducing the length of chain required.
The information available concerning the analysis procedures used is limited.
It was possible to find out that a quasi-static procedure was used and it seems
that only the steady component of: wind, waves and current was taken into
account. There was no optimisation of the mooring system. Results obtained
are summarised in Table 3.1.
The influence of the addition of clump weights on offset is striking, with
maximum excursion being reduced from between 3% and 4.3% to between
0.3% and 1.1%, depending on whether an aramid or a polyester rope was
used. Since no dynamic effects have been considered, the addition of clump
weights did not cause any increase in maximum tension. For systems using
aramid ropes a reduction in maximum tension was reported. This was
probably associated with a reduction in pretension, although there is no
mention of such a change.
The difference between the results obtained using aramid and polyester ropes
is not great. While systems with aramid ropes showed somewhat lower offsets,
systems with polyester ropes generally had lower maximum tensions (except
for the systems with clump weights).
Baxter (1988) also presents some results for a taut inclined system based on
the the synthetic ropes mentioned above, using piles instead of anchors, in
450 m of water depth. In this case, system compliance is mainly due to the
axial stiffness of the rope as opposed to the geometric compliance afforded by
catenary systems. Results for two chain systems one in the same depth and
another in 79 m are presented for comparison purposes. Rope breaking load
and length are not mentioned.
Table 3.2, after Baxter (1988), shows the results obtained. The systems with
fibre ropes in 450 m depth showed very small static offsets, comparable to that
obtained for the chain mooring in 79 m. The aramid rope system had an
34

excursion of 0.5% of the water depth and a reasonable maximum tension, but
a natural period of 23.5 seconds, prone to be excited by long waves. This
characteristic would discourage its implementation. The system based on the
polyester rope, with a natural period of 44 s, was found to be comfortably
removed from the first order wave spectrum. It should be noted that, as far as
excursions are concerned, the behaviour of the taut systems was quite similar
to the systems with clump weights.
3.2 - The "Pilot Study"
Within the framework of a joint industry study jointly performed by the
University of Reading and Global Maritime Ltd. in 1989, a fresh look was taken
into the potential of light weight materials for deep water moorings. The study
considered spread (catenary) and direct tension (TLP) mooring systems. The
results obtained for TLPs have already been discussed in Chapter 2 and will
not be discussed further.
At the outset of this study very little was known concerning both the dynamic
behaviour of light weight tethers and the response of spread mooring systems
incorporating LWTs with different dynamic characteristics. As discussed in
Chapter 2 the quasi-static compliance of an all steel mooring line is basically
derived from its catenary shape, with a small contribution of tether axial
compliance. At increasing frequencies the mooring lines show dynamic
tensions in excess of what would be predicted by the static catenary
equations, partly due to their accelerated movement in the water, and
therefore, a function of their: axial stiffness, linear weight, area and shape. The
incorporation of a component with markedly different stiffness and weight
characteristics, and which also shows rheological behaviour over the
timescales involved, was expected to produce a substantial change in the
behaviour of the complete system. This in turn would be expected to result in a
different loading pattern of the mooring lines.
From the early start it was concluded that light weight tethers should not be
compared with steel wire rope or chain as a substitute material, solely on the
basis of their mechanical properties and cost. Technically feasible solutions
35

could only be compared on the basis of complete mooring systems designed
to meet similar tension and offset requirements.
Two main areas of activity were clearly present:
(i) the development of analysis methods and procedures to enable a
meaningful comparison between all steel mooring systems and
systems incorporating LWTs; and,
(ii) to obtain the relevant material characteristics to be used in the
analysis.
Given the restricted amount of previous work in both fields, and the highly
interactive nature of the two areas of activity, in the systems studied, it was
necessary to conduct both activities simultaneously and iteratively.
The review of the properties of available light weight tethers (Del Vecchio
(1989)) performed in the "pilot study" included synthetic fibre ropes and
composite strands. The relevant information obtained in this review has been
incorporated in Chapter 4. Values for: weight, strength, dynamic stiffness and
cost, obtained in the "pilot study" are shown in Table 3.3 and formed the basis
for the analytical studies carried out by Global Maritime Ltd. (1989,1) which
are discussed below.
The study based its comparison in two types of semi-submersible platforms:
(i) a drilling unit; and,
(ii) a floating production system.
Three combinations of water depth and location were selected:
(i) 500 m in the West of Shetlands;
(ii) 1000 m in Campos Basin; and,
(iii) 2000 m in the Gulf of Mexico.
Eight leg, symmetric pattern, two component mooring systems were selected,
with an upper length of fibre or wire rope connected to a chain, leading to a
drag embedment anchor. A steel wire rope (in 500 m) and a steel wire rope-
chain system (in 1000 and 2000 m) were used as a reference for comparison.
In order to obtain a meaningful comparison between different tether options,
optimum systems had to be found for each of them. In this study, systems were
36

optimised to achieve the same tension safety factor at minimum cost.
The analysis procedure made the following simplifying assumptions:
(i) the systems were operated actively (the leeward lines slackened
and the tension on the windward lines equalised);
(ii) the low frequency response was simulated by using one minute
wind speed in the static analyses; and,
(iii) the first order effect on the mooring lines was represented by an
harmonic horizontal movement of the line top corresponding to the
horizontal fairlead motion of the unmoored platform.
A substantial part of the work consisted in investigating the dynamic tensions
arising on individual legs due to the harmonic horizontal movement of the
uppermost point of the line (corresponding to the fairlead), in the plane of the
line. A computer programme (TRANSDYN), based on a proven lumped mass
discretization of the line and a frequency domain solution, was used for these
analyses. Chain, wire rope, wire rope-chain and fibre rope-chain combination
lines were investigated.
The trend found was similar to what has been reported by Larsen & Fylling
(1982), i.e., dynamic stiffness similar to the total axial elastic stiffness, at
periods between 10 and 15 seconds, in all but the chain only lines. Dynamic
stiffness was defined as the actual dynamic tension divided by the amplitude
of motion. Total axial elastic stiffness was calculated as the equivalent spring
constant (EA/I) of all line components associated in series as springs without
mass.
Based in these results a further assumption was made: that the dynamic
tensions on the lines can be calculated by multiplying the top oscillation by the
equivalent spring constant.
This assumption was used to develop an optimisation programme
(LWDESGN) to find the cheapest configuration (diameter and length) of two
component mooring lines for a number of upper components with grounding
chain, satisfying anchor uplift and tension safety factor criteria. Figure 3.3, after
Global Maritime Ltd. (1989,1), shows the flowchart of LWDESGN. For discrete
variations of the length of the upper component, minimum cost systems are
37

calculated and printed.
The programme included a buoyancy cost penalty, associated with the vertical
component of tether tension, This was estimated by assuming that each 10
tonnes of additional buoyancy requires 2 tonnes of structural steel work at a
fabricated cost of US$6,400/tonne (Lim (1988)). It should be noted from the
flowchart that the platform offset was not a design parameter.
Preliminary runs of LWDESGN with systems incorporating polyester fibre
ropes showed a weak but clear cost minimum as a function of the length of the
upper component. For example, results in 1000 m water depth, for a mean
horizontal force and an imposed surge compatible with the Campos Basin
location, showed a cost minimum for a 2000 m long PET rope. However, for
lengths of the PET rope between 1500 and 3000 m maximum cost penalty
was 5.5%.
To test the accuracy of the designs obtained with the above programme the
optimum configurations derived by LWDESGN for six load cases were
analysed by TRANSDYN.
In the West of Shetlands location in 500 m water depth, a wire rope only
system (3750 m of 110 mm 6 strand rope) and a fibre rope-chain combination
(2000 m of 140 mm polyester Superline and 500 m of 90 mm ORQ chain)
were analysed. Tension safety factors obtained by TRANSDYN were 2.08 and
2.22 respectively. A quasi-static analysis for the same configurations showed
safety factors of 3.09 and 2.10 respectively.
In 1000 m water depth, for the Campos Basin environmental conditions, a wire
rope-chain (127 mm diameter 6 strand rope and 129 mm ORQ chain) and a
fibre rope-chain combination (174 mm polyester Superline and 110 mm ORQ
chain) were verified by TRANSDYN. Tension safety factors obtained were
2.17 and 2.03 respectively. Safety factors obtained from a quasi-static analysis
were 2.59 and 2.05 respectively.
For the Gulf of Mexico environment, a verification was performed in 2000 m
water depth. The wire rope-chain combination was sized by LWDESGN as
5000 m of 120 mm diameter 6 strand rope and 550 m of 120 mm ORQ chain.
38
The fibre rope-chain system selected consisted of 5000 m of 154 mm diameter
polyester Superline rope and 850 m of 97 mm ORQ chain. Safety factors
calculated by TRANSDYN were 2.5 and 2.05, and by a quasi-static analysis
were 2.59 and 2.05 respectively.
In general the results obtained demonstrated the adequacy of the simplified
optimisation procedure (LWDESGN). Of the six cases analysed, only in
2000 m for the wire rope-chain mooring is the safety factor substantially
greater (25%) than 2.0 and also 22% greater than obtained by the fibre rope
system. In this case the approximate procedure is penalising the wire rope by
being over conservative.
The maximum dynamic tension range observed for the systems incorporating
PET ropes was found to be 19.5% of the MBL. As expected this happened in
500 m in the West of Shetlands, since that is the shallower location and also
the one that causes the highest platform surge.
The results of the quasi-static analysis showed the importance of taking into
account first order line dynamics, especially for the wire rope system. As water
gets deeper it was found that there is a tendency for the wave frequency
tensions to represent a smaller proportion of the total tension. In this way the
safety factor derived from the quasi-static analysis gets closer to that obtained
from the dynamic analysis.
The generally good agreement between the quasi-static and dynamic results
for the system containing the fibre rope is probably due to a good match
between the axial stiffness of this fibre rope and the geometric catenary
stiffness. However, no explanation could be found for the bigger safety factor
obtained for the dynamic analysis in comparison with the quasi-static analysis
in the West of Shetlands case study.
Having proved that the performance of the optimisation programme was
satisfactory, the software was used to:
(i) compare the costs of optimised solutions incorporating LWTs with
optimum all steel systems; and,
(ii) sort the candidate light weight materials on a cost basis.
39

Table 3.4 shows results obtained with LWDESGN for different tether options
sorted by cost (Global Maritime Ltd. (1989,1)). Results are pertinent to a
drilling platform in the Gulf of Mexico in 1000 m water depth (horizontal line
load of 2000 kN and surge of 7.5 m).
Ropes based on polyester fibres showed a clear advantage over the other
options. The system based on the Parafil rope came out 22% cheaper than
the standard wire rope-chain combination, closely followed by the Superline
and the parallel laid rope at 16% and 12% respectively. Although changing
the way in which the buoyancy penalty was calculated could alter their
attractiveness in relation to the optimum steel system, it should not influence
their relative order.
The Minimum breaking load required by all the systems based on PET ropes
was about 75% of the MBL of the optimum six strand steel wire rope-chain
mooring.
The system based on standard modulus aramid wire rope come out 43%
more expensive than the reference steel system, with an MBL that was 90% of
that of the optimum all steel system.
The high modulus aramid pultruded strand-chain system was too stiff for the
application, as can be seen from its MBL which is 8% higher than the MBL of
the reference system. The cost of this option was 2.6 times the cost of the
reference system. Although a system using a glass fibre pultrusion would
certainly perform better than the high modulus aramid one, it is apparent from
its cost and stiffness characteristics that it would not be able to challenge the
reference steel system. On these grounds composite pultrusions will not be
further addressed in this study.
40

water depth
m
rope material
-
rope BL
tonnes
rope length
m
chain BL
tonnes
chain length
m
clump weight
tonnes
static offset
m
max tension
kN
300 polyester 800 600 1245 700 - 11.7 3804
500 polyester 800 850 1245 800 -
,
21.7 3240
500 aramid 800 850 1245 800 - 17.9 3609
500 polyester 800 850 1245 300 150 3.9 3345
500 aramid 800 750 1245 300 150 1.7 2884
900 polyester 800 1500 1245 900 - 30.9 3150
900 aramid 800 1500 1245 900 - 26 3348
900 polyester 800 1400 1245 300 130 9.7 3128
900 aramid 800 1300 1245 300 130 7.3 2818
Table 3.1 - Configuration and performance characteristics of combined light
weight rope and chain moorings (from Baxter (1988)).
water depthm
rope material_
static offsetm
max. tensionkN
79 ORO chain 3.6 2030
450 ORO chain 57 2080
450 polyester Parafil 5.9 1875
450 aramid Parafil 2.4 2020
Table 3.2 - Tensions and offsets for taut inclined light weight mooring systems
compared with all chain moorings (from Baxter (1988)).

Material-
StrengthGPa
StiffnessGPa
Linear Mass Drykg/mmA2 . 100m
CostUS$/kg
polyester double braid 0.22 2.8 0.097 8.4polyester Superline 0.30 5.0 0.096 7.5
polyester parallel strand 0.47 9.0 0.096 10.5polyester Parafil 0.38 9.7 0.096 6.5
Kevlar29 wire rope const. 0.66 26.5 0.096 27.0Kevlar29 Parafil 1.10 48.3 0.101 48.8
Kevlar49 wire rope const. 0.66 41.6 0.096 27.0Kevlar49 Parafil 1.10 76.7 0.101 58.6
Spectra900 double braid 0.47 18.0 0.067 37.4Kevlar49 pultruded strand 0.86 57.7 0.124 50.0
6x36 wire rope 0.84 67.7 0.532 2.6spiral strand wire rope 1.02 108.9 0.633 3.4
Table 3.3 - Selected light weight and steel tether properties used in the "pilot
study" (adapted from Del Vecchio (1989)).
Upper Leg Material-
Lengthm
Total Cost/LegUS$1000
Relative Cost-
Breaking LoadkN
'Relative BL
polyester Parafil 3500 458 0.78 4689 0.76polyester Superline 3000 496 0.84 4593 0.75
polyester parallel strand 3000 519 0.88 4669 0.766x36 wire rope 5000 588 1.00 6153 1.00
polyester double braid 2000 673 1.14 4813 0.78Kevlar29 Parafil 3000 684 1.16 5313 0.86Kevlar49 Parafil 3500 782 1.33 5760 0.94
spiral strand wire rope 5000 829 1.41 6896 1.12Kevlar29 wire rope const. 2500 842 1.43 5546 0.90Kevlar49 wire rope const. 3000 967 1.64 5936 0.96Spectra900 double braid 2000 1018 1.73 5968 0.97
Kevlar49 pultruded strand 2500 1543 2.62 6635 1.08
Table 3.4 - Results calculated with the the mooring line optimisation
programme for a typical drilling semi-submersible platform in
1000 m in the Gulf of Mexico ( from Global Maritime Ltd. (1989,1)).

4” ALGA TOWER
600'
PRODUCTIONBARGE
164R
FLEXIBLEPRODUCT &CONTROLLINES
ALGA//TOWER
MAXIMUMEXCURSION OFMOORINGSYSTEM
PLAN VIEW2300'
ARAMID FIBER ROPEPORTION OF MOORING LEG2300 ft LONG
3 . CHAIN PORTION OFMOORING LEG 2625 ft LONG
ANCHOR POINT
Figure 3.1 - Elevation and layout of turret moored production barge (from
Pollack & Hwang (1982)).
3000 -
1000 -
00 500 1000 1500 2000
60°
DERRICK11(=,...„......„,,PRODUCTION BARGE MOORING LEGS
(6 TOTAL)
WELLHEADS
-4*
2000 -
Modulus x Area, AE (kN)
Figure 3.2 - Peak tension in aramid fibre rope as a function of EA (from
Pollack & Hwang (1982)).

IINPUT
Water depthMean Horizontal Force HFirst Order Max SurgeTarget Safety FactorMinimum Uplift TensionLower Comp. Wear Margin
L2 loop
Yes
END
Print out resultsfor this value ofupper componentlength
L2
1Set Length of Upper
Component Set Initial Valuefor Design MinimumBreaking Load (MBL)
Solve catenary eqns.using diameter set byMBL and select lowercomponent length tosatisfy safety factorsand uplift criteria
( BEGIN ) Correct MBL undercontrol ofoptimizationalgorithm
MBL loop
Yes
Figure 3.3 - Flowchart of combined catenary line optimisation programme
(redrawn from Global Maritime Ltd. (1989,1)).

4. CHARACTERISTICS OF SYNTHETIC FIBRE ROPES
4.1 Introduction
Fibre ropes are light flexible structures used as tensile members in
applications as diverse as ship moorings and bow strings. Known by man for
at least five thousand years (Borwick (1971)), it was in the past 50 years that,
due to the availability of synthetic polymeric fibres, the rope industry has
experienced a rapid technical development.
The research effort by Carothers and Staudinger since the early 1920s up to
the 2nd World War was responsible for the development of synthetic fibres as
we know them today (Roberts (1984)). After World War II, nylon 6.6, product of
the direct work of Carothers at Du Pont in North America in the 1930s, became
the first commercially available man-made fibre. Nylon 6 , developed by I. G.
Farbenindustrie, was first available in the late 1930s and is still more common
in Europe. Polyester (Polyethylene Terephthalate) fibres were developed into
commercial products in the late 40s and early 50s by Winfield and Dickson
(1946) in the United Kingdom.
For rope making, polymeric fibres can be in the form of:
(i) coarse filaments (monofilament);
(ii) fine filaments (multifilament);
(iii) fibrillated tape; or,
(iv) discontinuous coarse filaments, also called staple fibres (to simulate
the surface handling characteristics of natural fibres).
Multifilaments typically have a diameter between 10 and 100 micron and
come in lightly twisted or discontinually entangled (by a jet of hot air) bundles
of 100 to 2000 filaments. Each bundle is called a single yarn or simply a yarn.
The tensile strength obtained from multifilament yarns is usually higher than
from the other forms of yarn.
In most rope constructions, a number of single yarns are twisted together into
plied yarns, these being further combined into rope yarns and strands, by
sequential twisting operations. Strands can be used to produce either
41

3—strand ropes, by further twisting, or braided into 8-strand, 12-strand or
double braided (core and cover) rope constructions. Over 90% of all fibre
ropes are made in one of these constructions. Figure 4.1 shows schematically
these constructions, as well as other constructions of interest for offshore
moorings which will be discussed below.
4.2 Textile Units
Mechanical properties of synthetic fibres are generally quoted in textile units.
Due to the size of the filaments involved, and to the variations in apparent
cross sectional area with packing it is more convenient to think in terms of
strength on a mass basis than on an area basis. Fibre strength and stress are
usually normalised in terms of the yarn mass as opposed to its cross sectional
area, i.e., breaking load is divided by linear density. In the textile industry this
measure of fibre strength is known as tenacity and the corresponding stress
as specific stress.
Linear density is normally measured in grams per kilometre, or tex. The tex
corresponds to 10 -6 kg/m and is obviously far more convenient for fibres and
yarns than kg/m. Tenacity and specific stress are then expressed in units of
N/tex which is exactly the same as MN/(kg/m).
It can easily be seen that multiplying the specific stress in N/tex (MN/(kg/m)) by
the material density (in kg/m3) one gets stress in MPa referred to the actual
cross sectional area of all the fibres in a yarn. It should be noted that it is very
difficult to arrive at precise figures for the circumscribed or apparent area of
the yarn or at any stress calculated as a function of this sort of area.
For the same reasons discussed above, it is more convenient to normalise
modulus in a mass basis. Specific modulus (in N/tex) is defined as the
relation between specific stress and strain. Again, a conventional engineering
modulus can be obtained by multiplying the specific modulus by the material
density.
42
4.3 Yarns
4.3.1 General Considerations
The world production of synthetic fibres in 1987 reached a total of 14.8 million
tons. Polyesters, Polyamides and Acrylics accounted for approximately 95% of
the total production. Table 4.1, after Davies (1989), presents production
figures for the main synthetic fibres from 1970 to 1987. It can be seen that
polyester has become by far the largest production fibre group, with about
50% of the market. As pointed out by Ford (1988) this is mainly due to to its
favourable price in comparison with less durable fibres such as cotton and
viscose.
Yarn used for rope making, tire cords, conveyor belt, reinforcing seat belts and
similar applications is known as industrial yarn as opposed to the textile
filament used in clothing. Ford (1988), referring to 1984 statistics points out
that the production of polyamide (nylon) industrial yarn was still twice the
production of the equivalent polyester yarn, although polyester was increasing
its market share. Over the past years yarn cost per kg for nylon industrial yarn
has been around 1.2 to 1.4 times the cost of industrial polyester yarn (Kirk &
Othmer (1984) and Ford (1988)). The production of aramid fibres is typically
two order of magnitude lower than the production of polyester fibres, most of it
used in a chopped form as an asbestos substitute for brake linings. Other high
modulus fibres, like high modulus polyethylene, have an even lower
production.
Polymeric fibres used in rope making are mostly made from petrochemical
feed stock. Fibres are formed by processes such as polymerisation and
polycondensation of basic components or monomers. The filaments are
formed by extrusion through a spinneret in one of three different spinning
methods shown schematically in Figure 4.2.
After spinning most fibres have poor strength (tenacity) and stiffness, since the
molecules of the polymer are not preferentially oriented in the direction of the
filaments. Orientation is obtained by drawing. For polyamide and polyester
fibres typical drawing ratios vary between 3:1 and 5:1 (Davis & Talbot (1985)).
43

In general terms tenacity increases with: the average molecular weight of the
material, its degree of cristalinity, the degree of axial orientation and the lack of
imperfections in the fibre structure. An adequate molecular weight is obtained
in the polymerisation process. Cristalinity and orientation are normally a
function of spinning speed, drawing ratio and heat treatment.
Man-made fibres currently used in marine ropes are: polypropylene (PP),
polyamide 6 (PA6, nylon 6), polyamide 6.6 (PA6.6, nylon 6.6), polyethylene
terephthalate (PETP, PET, polyester), and, on a much smaller scale, Aromatic
polyamide (aramid) and high molecular weight polyethylene (HMPE). New
fibres and improved versions are regularly introduced in the market. Liquid
crystal polymers, like Vectran (Beers & Ramirez (1990)) are examples of the
former case and Technora aramid (Stidd (1990)) is an example of the later.
4.3.2 Yarn Finishes
Spinning (standard) finishes are substances applied to the surface of yarns
during the manufacturing process. They prevent static charging, hold the
filaments together and lubricate them to reduce abrasion damage during rope
making. A standard finish is usually water soluble.
After finish is an additional lubricant applied to the yarn for different purposes.
Yarns with non water soluble (marine) finishes are used in several rope
constructions and play an important role in reducing friction and internal
abrasion in service.
Since yarn manufacturers usually do not release technical information on the
finishes they use (Flory (1988)) and the application envisaged does not cause
severe cyclic loading (see Section 3.2), no further attempt was made to
develop this subject except for an experimental verification. This took the form
of the "fatigue" tests performed in model fibre ropes, discussed in Chapter 6,
where one of the ropes used a yarn with marine finish and another rope was
manufactured from yarn without after finish.
44
4.3.3 Yarn Properties
Table 4.2 shows a compilation of mechanical and physical properties of yarns
selected as viable options for mooring rope manufacture (Enka (1985,1),
Kirschbaum (undated), E. I. du Pont du Nemours & Co. (1987) and Flory et al.
(1988)). Data presented for polyester and both nylons correspond to high
strength (tenacity) yarns. Polypropylene results are for good quality
multifilament yarns.
Conventional industrial yarns (polypropylene, nylon and polyester) all have
strengths that are approximately half the tensile strength of steel rope wire, on
an area basis, or 3.5 times in terms of weight. Aramids and HMPEs have all
strengths about 50% higher than wire, but the difference being an order of
magnitude on a weight basis. Initial modulus is spread over a huge range,
from 6 to 200 GPa, leaving room for the user to build a tether with a tailored
system response. It should be noted however that, because of the visco-
elastic nature of their behaviour, the initial modulus of synthetic fibres does not
represent the behaviour in an application involving load cycling.
Tensile testing of yarns should normally be done according to standards
produced by national standards organisations (BSI 1932: Part 1 (1989) or
other types of associations (ASTM 0855-85 (1985) and ASTM 02256-88
(1988)). Typical gauge length for these tests vary from 250 to 500 mm. A
testing speed of 10% of the gauge length per minute is normally used for high
modulus yarns such as aramid and HMPE. A testing speed of 100% of the
gauge length per minute is normally used for conventional materials such as
polyesters and nylons. Yarns of conventional materials can be tested with or
without twist but yarns of high modulus materials need twist to avoid excessive
numbers of failures in the grips. Tensile strength results presented in Table 4.2
refer to yarns in standard conditions of humidity, typically 55c/oRH, tested
according to ASTM D855-85 (1985) or any similar standard.
Published data on the long term strength of fibres and yarns in fresh and sea
water is limited to a few materials and conditions. Morton and Hearle (1975)
and Flory (1988) reported a decrease of about 15% in the tensile strength of
nylon in water. Although absorbing 7% of water, Kevlar 49 aramid showed
45

only 1.5% strength loss after 1 year immersion in salt water as reported by E.I.
du Pont du Nemours & Co. (1987). ENKA (1985,2) indicates a loss of 3 to 5%
for its aramid yarn, Twaron, fully saturated in sea water. Polypropylene and
polyethylene do not absorb water and are not thought to suffer any strength
reduction due to immersion in water. Results published by Enka (1985,1), for
external yarns of 24 mm diameter polyester ropes, kept 50 m below the sea
surface for 3 years, show retained strength of 93%. The same test was
performed in ropes made of nylon yarns, with and without additives to improve
ultra violet and heat resistance. Retained strengths were 91% and 71%
respectively. More detailed investigations performed for polyester fibres are
going to be discussed in Section 4.4. For the time being it is sufficient to say
that the rate of strength degradation reported for polyester fibres in water at
ambient temperature is very small (McMahon et al. (1959) and ICI (undated)).
Initial modulus, as shown in Table 4.2 is calculated from the slope of the
tangent to the load elongation curve in its first reasonably straight region.
Figure 4.3, after ASTM D855-85 (1985), shows load-elongation graphs for two
types of materials and their respective tangent lines used in computing
modulus.
Early results for individual filaments under very small (unquantified) elastic
deformations (Hadley et al. (1969)) showed an initial modulus between
14 GPa and 18 GPa for polyester yarns (draw ratios 5-8) and circa 4.7 GPa for
nylon at a draw ratio of 6:1. Hadley et al. (1969) also reported a very
significant decrease in modulus by nylon fibres with increasing relative
humidity as shown in Figure 4.4.
Van der Meer (1970) reported on the dynamic properties of polyester and
nylon yarns. Average dynamic modulus values quoted were respectively
20 GPa and 7.5 GPa for a cycling frequency of 10 Hz. Results were also
presented for hysteresis, in the form of tan 8 (also called loss coefficient or
loss factor, the ratio between the loss modulus and the storage modulus).
Appendix 1 defines the terminology used to describe hysteresis. Dry polyester
and nylon textile yarns showed loss coefficient values of 0.013 and 0.019
respectively, while in the wet condition results were 0.013 and 0.050.
46

Kenney (1983) measured the hysteretic energy absorption in nylon and
polyester yarns, manufactured by Du Pont, cycled dry between 1% and 20%
of their breaking load, for frequencies between 0.00028 and 6.2 Hz. The
results were reported in absolute energy units (J) absorbed per cycle. Total
energy absorbed per cycle for nylon was approximately 10 times bigger than
absorbed by the PET yarn. From a knowledge of the yarn tested and making
the assumption that the yarn dynamic modulus at 0.1 Hz is equal to 13.8 GPa
(average measured by Van der Meer (1970)) it is possible to infer the loss
factor at this frequency. The value so obtained is 0.017.
Failure strain is a dominant parameter in determining the ability of the tethers
to equalise small imbalances in construction and the care necessary when
handling the fibres, i.e. the higher the strain to failure the easier to handle the
fibre and to make a well balanced rope.
The density of the fibres reviewed ranges from 0.91 to 1.45 g/cm 3. In sea water
both polypropylene and high molecular weight polyethylene float, while the
other fibres show a small but positive apparent weight. The density of these
materials is such that tethers based on them assume catenaries with very
small sag (or hog). The tethers can usually be considered neutrally buoyant
when compared to steel tethers.
Kinking susceptibility relates to the compression behaviour of some high
strength fibres. Shear bands are produced under alternate tension-
compression (Riewald (1986) and Greenwood & Rose (1974)). The kinked
fibres lose strength and are more susceptible to: chemical attack, hydrolysis
and oxidation (E.I. du Pont du Nemours & Co. (1987)). Figure 4.5 shows kinks
in an aramid filament.
Figure 4.6 after E.I. du Pont du Nemours & Co. (1987) shows creep results for:
nylon, polyester, two grades of aramid (Kevlar) yarns and steel wire for ropes,
at ambient temperature, loaded at 50% of their respective breaking load.
Creep strain, here defined as total strain minus strain after 1 minute, is plotted
as percentage of initial yarn length. In the same graph results now obtained at
Reading for a HMPE yarn (Dyneema SK 60), at 30% of its nominal breaking
load and 20±2°C, have been plotted.
47

Figure 4.7 shows mean stress rupture, or creep rupture, data for: nylon 6.6,
polyester and aramid yarns. As well as being directly related to the capacity of
the fibres to sustain constant load, which may be relevant, to the application
envisaged, creep rupture is also one of the mechanisms of fibre failure under
cyclic load as described below.
"Fatigue" (cyclic loading) behaviour of nylon 6.6, polyester and Kevlar 49
yarns and fibres has been shown to derive from a simple process of
accumulating creep strain (Kenney et al. (1985), Mandell (1987)) and is
therefore totally different from any concept of fatigue in metals. This behaviour
has been observed under the following conditions: wet and dry testing,
minimum to maximum load ratios (R) between 0 and 1, frequencies from 0.1 to
20 Hz, and at maximum stresses above: 30% to 40%, 60% to 70%, and 70%
to 80% of the initial strength, respectively for nylon, polyester and Kevlar 49.
The presence of water produced a 10% to 20% strength reduction in nylon 6.6
while the polyester yarn was almost unaffected (Kenney et al. (1985), Mandell
(1987)).
Figure 4.8 shows data for the maximum load versus time to failure, presented
by Mandell, plotted on a logarithmic time scale.
For the wet polyester and nylon 6.6 yarns, the following equations respectively
fitted to the test data:
P/Po = 1.02 - 0.0570 log (t); (1)
P/Po = 0.98 - 0.1008 log (t). (2)
where: P = the maximum cyclic load ;
Po = the initial strength; and,
t = the cumulative time to failure in seconds.
The number of cycles to failure was found to be independent of frequency and
obtained simply by multiplying t by the frequency in Hz.
It should be noted that the difference in behaviour between nylon and
polyester is considerable. For example, a time to failure of 1 month could be
obtained by loading a polyester yarn to 65% of its breaking load while to get
failure of a nylon yarn in the same time requires cycling to a maximum load of
only 33% of its breaking load!
48
Results presented by Bunsell & Hearle (1974) for nylon 6.6 and by Oudet &
Bunsell (1987) for polyester yarns disagree with the results presented by
Mandell (1987) in that a different and faster mechanism of failure, identified as
"actual" fatigue, was found to be responsible for fibre failures if R <0.25,
approximately.
However the same trend of much better "fatigue" performance of polyester
than nylon 6.6 was verified by Bunsell & Hearle (1974). For example, nylon
fibres cycled between zero and 55% of their breaking load typically survived
50,000 cycles, while polyester fibres cycled between zero and 65% of their
breaking strength survived an average of 200,000 cycles.
The residual strength of polyester yarns at various fractions of their average
failure time in fatigue was investigated by Steckel (1984). No degradation was
found for yarns cycled at 80%, 85% and 90% of their breaking load after up to
80% of their life.
No results have been found in the literature concerning the residual strength
of yarns under: moderate loads (constant or cyclic), temperatures from 0°C to
25°C and immersion on sea water, for long periods of time. These conditions
are the most relevant for yarns used in the manufacture of tethers for use in
spread mooring systems.
Photo-oxidation of polymers involves complex chemical and physical
interactions. Since light has to be absorbed before any photochemical
reaction may occur, a significant parameter in photo-oxidation is the optical
density of the polymer over the solar energy spectrum incident upon it.
Because polymers like polypropylene are quite sensitive to photochemical
degradation, being transparent to sunlight, reactions must involve impurities
and be affected by molecular mobility. Another important effect concerning
strength reduction is the polymer structure, i.e. crystalline and semi-crystalline
polymers tend to be more sensitive to degradation than those with amorphous
structure (Wiles (1976)).
To simulate this sort of degradation, special equipment capable of generating
ultra violet radiation is used in accelerated laboratory tests (Global UV tester
(Tabor & Wagenmakers (1991))). Although results obtained in this test can be
49

correlated to outdoors weathering for individual polymeric fibres, comparative
tests on different fibres using the Global UV tester do not agree with
environmental exposure results (Tabor & Wagenmakers (1991)).
Three years exposure results in Wuppertal, Germany, have shown that the
loss in strength is two times greater for a stabilised nylon yarn than for a high
tenacity polyester yarn without additives (Tabor & Wagenmakers (1991)).
Enka (1985,2) states that photo degradation results for aramid yarns exposed
for 5 years are similar to nylon yarns.
For large diameter mooring ropes photo-oxidation is not thought to be a
problem. The self screening effect and/or the use of thick plastic jackets
effectively block the access of radiation to the load bearing material.
Yarn on yarn abrasion plays an important role in the fatigue behaviour of
ropes incorporating high levels of twist and/or braiding, cycled with medium to
low loads (Parsey (1982)). Yarn on yarn abrasion behaviour is strongly
dependent on fibre finish but also influenced by: environment, load and yarn
twist. It should be assessed if the expected rope failure mode is internal
abrasion (Flory (1988)). A standardised test method was proposed by Goksoy
(1986). Figure 4.9, after E. I. du Pont du Nemours & Co. (1987), shows results
for one particular experimental set-up that illustrate the influence of some of
the variables mentioned. The detrimental effect of water on nylon is
remarkable.
Friction coefficients between yarns and different materials can also be
obtained from yarn manufacturers. They are relevant in yarn care during rope
making and for ropes failing by abrasion at terminations. Particularly in barrel
and spike terminations and eye splices fibres are known to fail by friction
against metallic components. There are no published equations relating
friction coefficients and abrasion resistance, so specific values are not
mentioned here.
As discussed above, nylon 6 and nylon 6.6 yarns have several characteristics
that limit their suitability for ropes for platform moorings:
(i) excessive creep;
(ii) poor stress rupture characteristics;
50

(iii) poor fatigue performance in the wet condition; and,
(iv) low modulus especially when wet.
The cost of nylon and polyester is approximately the same on a volume basis
and, as seen in Table 4.2, their dry tensile strength is very . similar. However
taking into account all the drawbacks discussed for nylon fibres and the bonus
modulus offered by polyester, it is considered that there is no justification for
using a nylon yarn for the sort of application envisaged unless a low modulus
fibre is needed. Nylon yarns will not be considered any further in this analysis.
Polypropylene, despite its low cost and good wet behaviour, will only be
considered as a possible jacketing material. Its poor creep properties (a
function of its low glass transition temperature) can cause premature failure
due to stress-rupture and its low strength on an area basis penalise the
required tether diameter.
4.4 Polyester (Polyethylene Terephthalate) Fibres
Polyester fibres are obtained from long chain synthetic polymers containing at
least 85% in weight of an ester of a dihydric alcohol and terephthalic acid
(Davis & Hill (1984)). The polyester most widely used in fibres (the one
investigated in this study) is polyethylene terephthalate (PET), the structural
formula of which is shown below:
0 13
II r_
H—OCHaCH2OC C H_ -n
A number average molecular weight (M n) of 15000 is considered as a
minimum to obtain adequate textile properties (Davis & Hill (1984). The yarn
tested in this study has a M n of 17000 (Tabor & Wagenmakers (1991)).
There are two manufacturing processes for PET fibres in current use, based
in: dimethyl terephthalate (DMT) and ethylene glycol (GE) or terephthalic acid
51

(TA) and GE. The processes involve first an ester interchange (DMT) or
esterification (TA) and then a polycondensation with the elimination of glycol.
The second process is presently preferred, because it is continuous, allowing
for a higher degree of polymerisation without thermal degradation.
Fibre formation is obtained by melt spinning. The speed at which the spun
yam is pulled is called take-up speed and controls the structure of the material
produced. After spinning the fibres undergo a several fold drawing operation
followed by a relaxation. This treatment confers the fibre with a highly oriented
semi-crystalline structure.
The arrangement of the molecules in crystalline PET was determined by X-ray
diffraction, such a configuration is pictured in Figure 4.10. after Ward (1990).
To represent oriented semi-crystalline polymers, several different structural
models have been proposed (Hearle (1967) & (1991)). All models incorporate
highly ordered crystalline regions and zones of oriented amorphous material.
The indirect evidence to support these models comes from: X-ray diffraction,
birefringence, sonic velocity and electron microscopy (Hearle (1991)).
A schematic representation of such a model for PET is shown in Figure 4.11
(Prevorsek & Kwon (1976)). Its major component is the microfibril with
alternating crystalline zones (crystallites) and amorphous domains. Between
the microfibrils lie extended non-crystalline molecules, some of which
penetrate the crystallites. The crystallites contain some folded molecules and
are considered to be perfectly oriented in the direction of the fibre. The axial
orientation of both crystalline and amorphous zones is used to explain the
excellent axial properties of drawn polymers.
Hearle (1991) suggests that the extent of crystallite misorientation in the actual
fibre can explain the better fatigue performance of polyester over nylon. The
orientation of the crystallites in polyester, being more perfect, would explain
why fatigue cracks run almost parallel to the fibre axis, as opposed to a
propagation at approximately 10 0 to the fibre axis found in nylon (Bunsell &
Hearle (1974)).
Recent work by Rim & Nelson (1991) shows that the structural model
described above is able to explain the main properties of three high modulus
52

high tenacity PET industrial yarns. Tenacity increased linearly with the
orientation of the amorphous region. A similar but less strong trend was found
for a measure of fibre stiffness, the load at 5% elongation (LASE-5, ASTM
D855-85 (1985)), in a typical loading regime for tire yarns. Initial static
modulus and dynamic modulus under conditions of: low pretension, low
amplitude and ambient temperature, also increased with amorphous
orientation. However, a decrease in hysteresis with amorphous orientation
under the same conditions, measured as tan 5, could not be explained.
Dortmans (1988) has used a similar model to explain the observed relations
between spinning speed and yarn properties, when investigating PET fibres
obtained by high-speed spinning (HSS). Defining the overall orientation (fm)
by applying the rule of mixtures to the orientation of amorphous and crystalline
regions, gave quite a good correlation between modulus (measured by the
LASE-5) and f ov, as shown in Figure 4.12. Since at higher spinning speeds
the cristalinity increased and the orientation of both regions did not change,
the modulus increased with spinning speed. Because of the higher modulus,
HSS fibres showed an improved creep performance. However tenacity was
reduced by the increase in spinning speed. This was explained by an
increase in the number of folded chains in the crystallites and a more
scattered distribution of length of the molecules in the amorphous region.
Fatigue performance was improved in HSS fibres. This was associated with
the decrease in the number of crystals and consequent increase in mobility in
the amorphous zone.
Tensile strength of high tenacity industrial yarn used in rope making quoted by
the manufacturers is between 1.1 GPa (0.80 N/tex) and 1.2 GPa (0.87 N/tex)
(AKZO (undated), E. I. du Pont du Nemours & Co. (1987) and Rim & Nelson
(1991)). AKZO (1991) production data for the yarn tested indicates a
coefficient of variation of 2.4%, over the year of 1990, for the yarn breaking
load. For this particular yarn, batches are rejected if the sample means fall
below 5% of the average specified value.
Fibre modulus is of paramount importance when the application concerns
imposed cyclic strains. Figure 4.13, after ENKA (1985,3), shows a typical
53

stress-strain plot for the yarn tested. Yarn tangent modulus is shown in the
same graph. These results highlight the non-linearity of the extensional
behaviour presented by polyester fibres.
Another way of measuring modulus is by the tangent to the isochronous stress
versus creep strain relation (isochronal modulus). Results obtained by Croll
(1973) for highly oriented PET sheet, parallel to the sheet axis, showed the
same overall non-linear behaviour, but displayed a region of linear
viscoelastic behaviour between 0.06 and 0.19 GPa, where the relaxed
modulus (t was ca. 4.7 GPa.
It should be kept in mind that there is no direct correlation between any of the
above mentioned measurements of modulus, be it initial modulus (ASTM
D855-85 (1985)), tangent modulus or secant modulus between any stress
values, and the dynamic modulus displayed by the fibre when cycled between
specific load limits at a specific frequency. As explained in Section 3.2, this
later stiffness measurement is the value pertinent to the response of mooring
ropes.
Dynamic modulus measurements of an experimental PET yarn have been
made by Van Der Meer (1970) at a frequency of ca. 10 Hz, using a damped
free vibration method. Results obtained at 20°C as a function of yarn mean
stress are shown in Figure 4.14. A strong influence of mean tension can be
observed. Rim & Nelson (1991) reported a average dynamic modulus of
approximately 12.3 GPa for three PET high tenacity tire yarns at room
temperature. Samples had a pre-stress of 0.03 GPa and were cycled with a
strain amplitude of 0.17% at a frequency of 10 Hz. This value is a bit low
compared with Van Der Meer (1970) results. Apart from these references, all
early dynamic modulus results have been obtained at very low mean stresses
and stress ranges.
In the same tests mentioned above for dynamic modulus, Van Der Meer
(1970) measured the loss coefficient (tan 8) and found out that hysteresis
decreased with increasing mean tension. The results ranged from ca. 0.02 to
ca. 0.035. In another PET yarn a loss factor of ca. 0.013 was obtained (see
Appendix 1 for definitions). Rim & Nelson (1991) in the experiments above
54

mentioned found loss coefficients between 0.02 and 0.03 for the three yarns
tested, in the same range as the Van Der Meer data. Results for yarn
hysteresis at frequencies relevant to the application in focus could not be
found in the literature.
Various authors have stated that PET is unusually resistant to hydrolysis when
immersed in cold or warm water, but warned that this behaviour changes for
boiling water or steam (Ludewig (1971). ICI (undated), Parsey et al. (1989)
and Flory et al. (1990) mention hydrolysis as having a long-term degrading
effect on polyester ropes. Studies of the degradation of PET fibres by
hydrolysis (of the ester bond) have been mainly directed to conditions relevant
to process that happen with clothes such as dyeing and heat setting, or in the
manufacture of tires.
Moisture was found to be preferentially absorbed by the amorphous regions of
the polymer (Hasegawa et al. (1989)). When chain scissions occur, some
crystallisation may happen, mainly above the glass transition temperature,
reducing the volume fraction of amorphous material. Since the density of the
crystalline PET is higher than the density of amorphous PET, a density
increase has been reported by many authors in association with hydrolysis
processes (McMahon et al. (1959), Ellison et al. (1982) and Ballara & Verdu
(1989)).
Hydrolysis has been studied in:
(i) boiling water (Ludewig (1971), D'Alo & Ciaperoni (1977), ICI
(undated) and Ballara & Verdu (1989);
(ii) dye baths (Ingamells et al. (1981));
(iii) aqueous solutions of NaOH (Ellison et al. (1982); and,
(iv) hot water and high temperature,controlled humidity environments
(McMahon et al. (1959) and ICI (undated).
Although none of the works mentioned above relates directly to the
environment and temperatures found in moorings ropes, some useful
information could be found.
Ellison et al. (1982), found a 5% average reduction in breaking strength
(significant at a 97.5% level) in yarns that were kept in water at 60°C for 2
55

hours, while Ludewig (1971) reports an average reduction in strength of 3.3%
for a yarn boiled for 5 hours. Ludewig (1971) also found that yarns boiled
under tension did not degrade any quicker than those boiled under no
tension.
The most interesting work on this subject was conducted by McMahon et al.
(1959), who tested a polyester fibre (Dacron) and two thickness of PET film
(Mylar) in water and at relative humidities of 20%, 50%, 75% and 95%, in
temperatures of 50, 60, 71, 82, 90 and 99°C, for up to 309 days.
The extent of hydrolytic degradation (EHD) was represented by:
EHD = Log (A / ( A - x )) (1)
where:
A = initial molar concentration of ester links; and,
x = number of moles of water that have reacted with 1 mole of polymer.
EHD was found to be a linear function of exposure time (t) for every
combination of material, temperature and environment tested. Results for the
PET fibre are shown for two relative humidities at 71°C in Figure 4.15.
Since no instantaneous hydrolysis can occur, at
t = 0,
EHD = 0,
and we can write
EHD k(T, RH) . t, (2)
where:
t = time in days; and,
k(T, RH) = constant, for temperature T and relative humidity RH.
It was also observed that, for the polyester fibre, the retained tensile strength
fell linearly with EHD up to 50% of the original strength, as shown in
Figure 4.16. The regression equation obtained for the strength loss (SL) as a
percentage of the initial strength was:
SL= 141.2. EHD . 100. (3)
Considering that the lower level of temperature in this tests, i.e. 71°C, is below
56
the glass transition temperature, McMahon et al. (1959) point out that there is
no reason to believe that equation (3) is not valid at lower temperatures.
From equations (2) and (3) it would seem that, for any particular combination
of temperature and environment, strength loss will be a linear function of time.
To estimate the influence of temperature on degradation, the gradient of EHD
with time, i.e. k(T, RH), obtained by McMahon et al. (1959), for the three
materials tested, at 100% R.H., was plotted versus temperature in Figure 4.17.
As suggested by ICI (undated) and Parsey et al. (1989), an exponential curve
fit was performed for each material. The fit was very good. The equation
obtained for the PET fibre was:
k (T, 100%) = 8.53E-22. 10 A (4.49E-2 . T) , (4)
where: T = temperature in °K.
The square of the coefficient of correlation obtained was 0.962 (the proportion
of the variation of the dependent variable that can be attributed to the linear
relationship with the independent variable is given by the square of the
coefficient of correlation (Miller et al. (1990)).
Substituting (4) in (2) and (2) in (3) we get:
SL = 1.20E-17 . t. 10 A (4.49E-2 . T) . (5)-
Assuming, for the time being, that a polyester mooring rope in service remains
at a temperature close to the sea water, equation (5) predicts a retained
strength in excess of 98% after 20 years immersion at 20°C.
McMahon et al. (1959) also exposed stretched samples of the 0.0127 mm
thickness film to hydrolysis at 90°C and 95% RH for 35 days. Retained
strength of the stretched portions of the samples was approximately twice the
strength of the unstretched regions. McMahon et al. (1959) concluded that
polymer orientation reduces the sensitivity of the material to hydrolytic
degradation.
ICI (undated), in its Industrial Fibres Manual, gives guidance on the amount of
hydrolytic degradation of PET fibres for a wide range of environmental
conditions. The actual data in which the recommendations are based is not
57

presented. Therefore a number of uncertainties remain on the applicability of
the results presented. It is not possible, for example, to assess either the
actual coverage of the tests undertaken (and, in consequence, the
extrapolations made) or the scatter of the results obtained.
In agreement with McMahon et al. (1959), strength loss was reported to be
proportional to time. Strength loss was found to increase exponentially with
temperature, but at a higher rate than reported by McMahon et al. (1959), as
shown in Figure 4.18.
The equation recommended by ICI to calculate the strength loss as a
percentage of breaking strength is:
SL= 2.88. t. (1.082 A (T - 373.15)) (6).
According to this equation exposure for 20 years at 20°C would cause a
strength reduction of 37.6%.
Creep strain measurements presented by E. I. du Pont du Nemours & Co.
(1987) for a polyester yarn, Dacron T-67, loaded at 50% of the breaking
strength, at 22°C, show an approximately constant creep rate of 0.135% per
decade, between 1.8*10 3 and 7.2*1 0 6 seconds (30 minutes to 83 days)
(Figure 4.6).
Tests reported by ENKA (1985,3) on Diolen 855T as tested in the present
study, at 20% of the breaking strength at 20°C, up to 3. 10 5 seconds show a
different trend. The creep rate has been found to decrease with time. For
example, between 10 2 and 103 s the increase in strain was 0.26% while
between 103 and 104 it was 0.16%. The same paper presents results for yams
loaded at a higher percentage of the breaking strength. The data shows that,
after the first 1000 seconds, the creep rate decreases for increasing loads up
to 40% of the breaking load. For example, at 30% of the breaking load, the
creep rate between 10 3 and 104 s was 0.13% per decade.
Tabor & Wagenmakers (1991), testing two PET yarns processed to obtain a
higher dimensional stability (Diolen 770 and Diolen 2500), for up to 107
seconds, found the same trend of decreasing creep rate with time. Between
106 and 107 s rates for Diolen 770 were as low as AKZO's standard modulus
58

aramid yarn, around 0.035% per decade. Creep rate was also found to
decrease with increasing load up to ca. 50% of YBL. For Diolen 770 immersed
in water at 60°C an increase in initial elongation but no change in creep rate
as compared with the yarn tested at 20°C and 65% RH was also observed.
Oudet & Bunsell (1987) tested two PET industrial yarns used for rubber
reinforcement, manufactured by Viscousuisse, at very high loads. Only the
yarns tested at the lowest loading level, 50% of YBL, showed creep rates
decreasing with time.
Apart from results already mentioned for creep-rupture (E. I. du Pont du
Nemours & Co. (1987)), which lack information on the conditions under which
the results were obtained, only very short duration tests could be found for
PET yarns. Mandell et al. (1987) gave results for Du Pont's Dacron 608 for
rupture in up to ca. 4.5 days. The load level needed to produce failure in that
time was found to be 70% of YBL. These results are also shown in Figure 4.7.
Oudet & Bunsell (1987), reported two failures in samples loaded at 80% and
82% of YBL. Lives were ca. 3 *10 4 and 105 seconds respectively, well within
the scatter band of data from similar tests on aramid yarns in Figure 4.7.
No reliable data could be found on the long term creep-rupture properties of
PET yarns tested dry or immersed in either fresh or sea water.
Fatigue behaviour of polyester yarns has been shown to be very good at high
stress ranges and high testing frequencies, as discussed in the previous
section. The failure mechanisms found (creep-rupture and fatigue) were not
investigated at the low mean, low range regimes, typical of a spread mooring
system, due to the long testing times necessary.
4.5 Fibre Ropes
4.5.1 Rope Constructions
The geometrical way in which the yarns are assembled into a rope is called its
construction. Since the end of the Second World War there has been a rapid
development of rope constructions as alternatives to the traditional three-
59

strand type.
Today, apart from a number of hybrid constructions, one can conveniently
classify constructions in six groups (Parsey et al. (1989)): three-strand, plaited,
double-braid, wire rope type, parallel sub-rope and parallel yarn. In this
terminology low twist parallel strand ropes are grouped together with parallel
yarn ropes. Figure 4.1 illustrates these rope types.
The following description of rope type characteristics is based on: Van
Leeuwen (1981), Parsey (1982), Lewis (1982), Ractliffe & Parsey (1985),
Parsey et al. (1985), Flory et al. (1988) and Flory et al. (1990).
Three-strand ropes incorporate several levels of twist in their manufacture and
therefore have a highly compliant structure. Their main characteristics are:
(i) high elongation;
(ii) low bending stiffness;
(iii) good energy absorption;
(iv) low strength efficiency;
(v) poor torque balance;
(vi) irregular outer surface; and,
(vi) low cost.
Eight-strand plaited ropes, using similar strands as 3-strand ropes, have
strands plaited or braided in pairs, four running clockwise and four anti-
clockwise. These ropes have:
(i) medium to high elongation;
(ii) low bending stiffness;
(iii) good energy absorption;
(iv) low strength efficiency;
(v) good torque balance characteristics;
(vi) irregular outer surface; and,
(vi) low cost (although higher than 3-strand ropes).
Braid-on-braid or double-braid ropes incorporate strands in two concentric
circular braids one over the other. They have:
(i) medium elongation;
(ii) low bending stiffness;
60

(iii) medium energy absorption capacity;
(iv) reasonably good strength efficiency;
(v) very good torque balance;
(vi) smooth outer surface; and,
(vi) generally a medium cost (higher than 8-strand ropes).
The need for high strength low stretch (high modulus) ropes has led to the
development of low-twist constructions. All these ropes have generally:
(i) low elongation;
(ii) low energy absorption capacity;
(iii) high strength efficiency;
(iv) smooth outer surface; and,
(vi) medium to high cost.
Wire rope type constructions are either similar to six-strand or spiral-strand
wire ropes, with a long helical pitch. Depending on rope size, strands may be
formed by direct combination of industrial yarns or from plied yarns as in a
three-strand rope. Some constructions have braided covers over each strand.
The torque balance properties of these ropes vary with the details of the
construction but they can be made with good torque balance characteristics.
The use of eye splices as a termination is still possible.
Parallel strand ropes are made by encapsulating within the same cover sub-
ropes which are either individually torque balanced or are paired with
opposite torque characteristics. Parallel strand constructions are torque-free,
but are less easy to splice efficiently.
Parallel yarn and parallel strand ropes have either slightly twisted or parallel
yarns laid parallel to the rope axis, encapsulated within a jacket to hold them
together. These ropes have the highest possible modulus and are non-
rotating. However they are hard to bend, perform badly over sheaves, may
subject fibres to kinking induced by bending and have to be terminated with
resin potted or wedge and cone type fittings, that can be expensive and
limited efficiency.
Generally speaking we can say that:
(i) braiding operations are more expensive than twisting but cheaper
61

than handling lower levels of twisted bundles;
(ii) the higher the twist and the number of construction levels of the
structure the lower the strength translation and stiffness obtained;
and,
(iii) high twist levels generate ropes that are flexible and easy to
handle.
In the mooring application which is the subject of this investigation, typical
pretensions are about 20% of the rope minimum breaking load, and maximum
quasi-static levels can be as high as 50% of MBL. It has been shown by
McKenna (1990) that 3-strand polyester ropes of a size compatible with
offshore moorings elongate elastically ca. 6% when tensioned between 20%
and 50% of BL. Considering that such loading can be due to a weather
condition lasting for something like one week, in addition to this 6% there
would be a creep elongation of at least another 3% (according to
measurements taken by Crawford & McTernan (1983) on stiffer rope
constructions). In a system using combined mooring lines, the lower end of the
synthetic rope will also display a movement due to change in the catenary
shape of the lower component. For a passively operated system, it is clear that
a 3-strand polyester rope sized for its strength, will not be able to keep the
vessel within a typical offset of 10% of the water depth. This means that, to
meet offset requirements, the ropes would have to be oversized, leading to
high capital and installation costs. Therefore this construction will not be
considered any further.
4.5.2 Terminations
The type of end fitting used to connect the rope is called the termination. As
the rope itself is very uniform, there is a tendency for the terminations to be the
"weakest link". Ropes incorporating high levels of twist or braid are inherently
inefficient in tension. By careful design, i. e. gradually reducing the twist
angles and or the braid pitch, it is possible to terminate such ropes with 100%
termination efficiency in quasi-static situations (a termination efficiency of
100% is indicated where failure is remote from the termination i.e. the full
62

strength of the rope is achieved).
Constructions which have high tensile efficiencies are difficult to terminate,
since the fibres are mainly oriented in the axial rope direction. In such ropes,
failure on quasi-static testing tends to be shifted from the free length to the
transition between the rope and the termination where the rope construction is
disturbed and radial tensions in the filaments are increased.
Terminations perform differently according to the rope with which they are
used. A direct assessment of termination efficiency is not possible if, for a
particular rope, no other termination providing clear breaks can be found. In
this situation, it is only possible to obtain a comparative evaluation of different
end fittings. This is done by calculating the strength conversion or strength
realisation of the terminated rope, as obtained with the different end fittings.
Strength conversion is defined as the average terminated rope breaking
strength divided by the aggregate breaking strength of all the yarns in the
rope. This kind of comparison is only significant for one particular rope, i.e.
yarn, construction and diameter.
A slightly different and more appropriate way of comparing the cost efficiency
of a terminated rope is by comparing the rope tenacity (say in Nitex) with the
tenacity of the yarn used to make the rope (tenacity conversion). This is more
appropriate since it relates to the quantity of yarn per unit length of rope.
Although there are a number of ways of terminating fibre ropes, for the
demanding application of a permanent offshore mooring only three types of
terminations can provide the efficiencies needed to justify consideration.
These are: splices, resin potted, and cone and plug (also known as barrel and
spike) terminations.
Splicing
Splicing is the standard termination for three-strand, plaited and double-
braided ropes. It can also be used with wire rope type and parallel sub-rope
constructions.
Splicing details vary mainly with rope construction but also with yarn material
and finish. In general terms splicing is done by forming an eye on the end of
63

the rope by tucking individual rope strands back into the rope construction.
While splicing simple constructions is straightforward, large double braided
ropes can be so complicated that a rope makers catalogue can spend 8
pages to describe it (Cordoaria São Leopoldo (undated)).
Eye splices are often protected by thimbles and, if long term heavy duty
cycling is foreseen, additional linings such as: polyester cloth sheeting
(Crawford & McTernan (1983) and urethane moulding of the eye (McKenna
(1980), Werth (1980)) are employed between the eye and the thimble.
Polyester cloth sheeting was reported by (Crawford & McTernan (1983) to
increase the "fatigue" life of spliced double braided polyester ropes by a factor
of five.
The efficiency of properly made splices is effectively 100% for most fibres and
constructions that allow splicing (Lewis (1982)), including small Kevlar wire
rope construction ropes (Horn et al. (1977), polyester double-braided
construction (National Coal Board (1979)) and polyester wire rope
construction ( McKenna (1991)). In ropes made of high strength fibres in low
twist constructions, very sophisticated splicing techniques have been used in
an attempt, not always successful, to avoid termination failures (Riewald et al.
(1986)).
As with other types of terminations, cyclic loading tends to generate splice
failures (Horn et al. (1977) and (Crawford & McTernan (1983). As will be
discussed later tensile tests are not sufficient to prove termination efficiency
and reliability under significant "fatigue" loading.
Resin Potting
Resin potting consists of distributing the yarns in a conical socket which is
then filled with a cold curing resin. Figure 4.19 illustrates the operation of
pouring the resin into the prepared socket. Care must be taken in fibre
cleaning, distribution, alignment and tension balancing. This method is used
mainly for ropes with high strength fibres. Commercial resins used are epoxy
and polyester.
Resin cast sockets develop their holding power by generating high pressure
64

in the bulk of the resin as the conical plug is pulled into the socket by the rope.
Chaplin & Sharman (1984), working with wire ropes, showed that this
pressure applies a normal force on the rope constituents so that the latter are
effectively held in position by friction and not by adhesion. Adhesion is only
responsible for holding the fibres inside the socket in the initial stages of
loading. This work also verified that in uniform taper conical sockets the
pressure generated close to neck is much higher than in the rest of the socket.
It is concluded that an improved design, with a more even pressure
distribution, could avoid having the highest shear stresses in the wires (or
fibres) where the tensile stresses are already maximum, and also reduce
socket stresses.
The behaviour of resin socket terminations for fibre ropes made with high
strength low stretch fibres such as aramids and HMPE, is very similar to that
for wire ropes, the frictional grip on the fibres being even greater because of
their larger overall surface area as compared with a wire rope. The situation
with fibres like PET is complicated by its relatively low modulus and high initial
creep compared with the properties of the socketing resins commonly used.
Resin cast terminations of polyester fibre ropes could possibly profit more than
wire ropes by a design with a more even pressure distribution.
High efficiencies are reported for small diameter (up to 25 mm) wire rope type
and parallel yarn Kevlar (aramid) ropes with resin socket connections (Lewis
(1982) and Horn et al. (1977)). There is no data available for large diameter
ropes. Heat generation during resin curing seems to be a possible limitation
for large diameter ropes.
Cone and Plug Socketing
Cone and plug socketing consists of a conical socket with a co-axial conical
plug. The fibres are evenly distributed filling the gap between the two cones.
When tension is applied, the internal cone is pulled in and acts as a wedge
that presses the fibres against the outer cone, holding them inside the socket.
Figure 4.20 shows a section of a barrel and spike termination.
Used mainly with parallel yarn ropes, this is the standard type of end fitting for
Linear Composites' polyester and Kevlar Parafil ropes (Kingston (1988)).
65
Cone and plug socketing is also used for small diameter wire rope type Kevlar
ropes (Lewis (1982)). It is not possible to assess efficiency of this kind of
termination directly because, for the constructions that use them, no clear
breaks have been consistently obtained with any kind of termination.
An idea of the static termination performance can be obtained from the result
of a breaking load test reported on a 124 mm core diameter Kevlar 29 Parafil
rope (Linear Composites Ltd. (undated)). Based on a 72.5% fibre filling factor,
the strength conversion of the terminated rope was 61.7%. From data
presented by Crawford & McTernan (1988) for a 17 mm core diameter
polyester Parafil, a strength conversion of 69% can be inferred.
Fatigue tests for this kind of termination are only published for Parafil ropes to
a maximum core diameter of 38 mm (Crawford & McTernan (1988)). All the
failures were due to fretting at the terminations.
Since termination failure is the expected failure mode for the more efficient
constructions under both static and dynamic loading, there still seems to be
some room for improvement, mainly in resin socketed, and cone and plug
terminations. Quality control is also a crucial issue for both these systems with
present designs.
For each particular application full size static and dynamic (where needed)
termination tests are recommended to assess both strength and reliability.
4.5.3 Jacketing
Parallel yarn and parallel strand ropes rely on jacketing to maintain their
shape. All constructions benefit from jacketing which provides: wear
resistance (particularly useful during deployment), fish bite protection
(Berteaux et al. (1990)), and acts as a barrier to ultra-violet radiation.
Polyurethane Jackets are recommended where severe abrasion is foreseen
(Linear Composites Ltd. (1983) and McKenna (1980)). Ethylene vinyl acetate
copolymer and Hytrel polyester elastomer have also been used offshore. The
last two are applied by extrusion over the rope and seem to be the more
66
convenient option for long lengths of tether.
Braided jackets have been used in small ropes and also in large ropes.
According to McKenna (1987), nylon and polyester braided jackets are
normally less rugged but leave the rope more flexible and are cheaper than
extruded jackets. Berteaux et al. (1990) reported that Kevlar and Spectra
braids were more effective than a Zytel (nylon resin) extruded plastic jacket in
protecting synthetic fibre ropes against fish bites.
Mayo (1972) reports on the good performance of 48 mm and 72 mm diameter
nylon ropes with polyurethane coating used to fire and pre-load explosive
embedment anchors. Polyurethane jackets have also been used over braided
jackets (Karnoski & Liu (1988)) for extra protection. Koralek & Barden (1987)
reported good performance from a Hytrel jacket on a Kevlar wire rope
construction mooring line used for 5 months on a drilling semi-submersible
platform. The same rope was deployed for 6 months in one of the mooring
lines of a floating production platform offshore Brazil. Although no damage
was caused by the sea exposure, the jacket was cut by a shackle pin when it
was coiled on the anchor handling boat's winch (Del Vecchio (1988)),
showing that special handling precautions are needed when installing ropes
with this type of jacket.
For most ropes an extruded jacket of approximately 5 mm thickness seems to
be sufficient, as long as the rope does not touch the sea bed and does not
bear against sharp corners during handling. Parallel yarn ropes need a
heavier (say 10 mm) jacket. A polyester braided jacket seems to be able to
provide the same level of protection as an extruded jacket, except against
penetration by sharp objects.
The subject of jacket adhesion to the rope itself is one that is still a matter of
some dispute and needs further investigation. For the very low stretch
fibre/construction combinations this does not seem to be a problem, but, for
moderate stretch ropes, a partially loose jacket can lead to rope—jacket
abrasion (Banfield (1989)). So, in applications with significant cyclic loads, a
jacket with a high degree of adherence should be used, particularly for
polyester—based ropes.
67

4.6 Rope Properties
4.6.1 Introduction
In order to evaluate the likely performance of light weight mooring materials, a
critical review of the literature on this subject was undertaken. This review had
two main purposes:
(i) to obtain approximate values for properties to allow a preliminary
selection of the most attractive candidate tethers on the basis of a
mooring design optimisation exercise (Global Maritime Ltd.
(1989,1));
(ii) to identify the areas where data to be used for mooring design were
missing, incomplete or unreliable; and,
(iii) to establish the additional areas of investigation, not accounted for
in the analysis of all steel mooring systems, which needed to be
addressed to support a full design using the light weight tethers
selected.
Table 4.3 shows the properties used in the analysis of the "pilot study" but
presented here in a different format. As in Table 3.3, the following
characteristics have been tabulated: tensile strength, axial modulus, dry
weight, and cost. As the most influential properties are strength and stiffness,
additional columns were produced to represent the strength (Str. Value) and
stiffness (Stiff. Value) which can be obtained for an unit cost (1 US$) in a 100
metres length of tether. These values were also tabulated normalised in terms
of the steel wire rope figures (Rel. Str. Val. and Rel. Stiff. Val.), representing
how much strength or stiffness can be purchased for a given expenditure
compared with a wire rope typically used for catenary mooring systems.
An inspection of the last two columns of Table 4.3 provides a quick way of
ranking the performance of substitute light weight tethers. As shown by
Chaplin (1989) and as further discussed in Chapter 5, this is a crude
approximation since, when used in the same system, compliant tethers need a
substantially lower breaking strength than stiffer steel elements.
68

The following paragraphs discuss the way the figures in this table were
obtained and their reliability. Consideration is also given to relevant data
published after the conclusion of the "pilot study". Additional tether
characteristics that are not considered directly in a streamlined mooring
analysis but which are essential to the implementation of a design
incorporating LVVTs are also discussed.
4.6.2 Modelling the Mechanical Behaviour of Fibre Ropes
With the advent of ever cheaper computing power a number of researchers
have recently explored the numerical modelling of fibre ropes. Numerical
formulations for both the helical geometry of twisted fibre bundles (Phoenix
(1979) and the sinusoidal helix of braids (Wu (1990)) have been proposed.
Phoenix (1979) working with stranded constructions has considered random
distribution of: fibre strength (and failure strain), fibre slack and fibre migration
in twisted yarns. Using his model, the strength conversion obtained for a rope
with 3 layer Kevlar 29 wire rope construction with low helix angles (< 15°) was
typically 85%. No experimental results are presented to validate this model
but the efficiency obtained is greater than the average of 70% quoted by
Lewis (1982) for very small 2 layer Kevlar 29 stranded ropes. It seems as
though his model is quite optimistic.
As far as simulating the quasi-static load-extension behaviour of small to
medium size 3 strand ropes, Chen (1988) has obtained quite good results for
25.4 mm diameter nylon and polyester cables. Failure loads though were
typically 30% higher in the model than in the ropes tested.
Recent work by Wu (1990), modelling the strength of 6.35 mm diameter nylon
and PET ropes in double braided constructions, has found that, including the
failure probability of the fibres in the numerical model, the experimental
strength falls between the numerical results obtained considering no friction
(+6%) and infinite friction (-3%) between the yarns.
Burgoyne & Flory (1990) have modelled the load strain behaviour of small
parallel yarn Kevlar 49 ropes, taking into account yarn strength and slack
69

variability. The biggest rope modelled had a breaking load of approximately
180 kN, and the strength conversion indicated by the model was 84%. No
comparison with experimental data was presented.
All the models discussed above have been applied to the behaviour of fibre
ropes under quasi-static loading conditions, corresponding to either a single
loading cycle to failure on a new rope, or a similar cycle on a rope that has
been worked to bed in the construction and rested. This sort of information is
only relevant to an assessment of the amount of rope take-up during
installation.
Considering the results published so far, we are forced to conclude that
modelling has not covered the ropes and rope properties relevant to a
mooring analysis.
4.6.3 Static Strength
Tensile strength data is readily available for more traditional constructions
such as plaited and double braided ropes from manufacturers' catalogues
and form a number of technical papers. The later have been preferred
whenever available.
Since different rope manufacturers use jackets of different materials and
thicknesses and jacket thickness is not geometrically similar for different
diameters, the strength (in kNimm2 ) presented in Table 4.3 was calculated
based on the full enclosed area without any protective jacket.
Strength values are given for steel wire rope and strand for comparison
purposes. These are catalogue figures (Minimum Breaking Load) and as such
are less than the mean, which would typically be 10% higher.
Strength quoted for the fibre ropes corresponds to mean test data minus 9%,
so as to be compatible with the wire rope values. This somewhat arbitrary
value is considered justified since, although at the present time, typical spread
in experimental data is greater for the light weight products, the development
and improved production controls that must precede any mooring rope
application may be expected to reduce the spread and improve the means for
70

these light weight constructions to obtain a level of consistency equivalent to
that of steel. Appendix 2 gives details of the references and further
assumptions upon which the figures were based.
It is important to point out that, particularly for more efficient constructions, the
scatter in strength found in the literature was very large. For example, tests
carried out at NEL (Crawford & McTernan (1988)) on nominally 10 tonne PET
Parafil and 60 tonne Kevlar 49 Parafil showed average tensile strengths
corresponding to respectively +16% and -10.5% of the manufacturers average
values.
Even bigger discrepancy was found for a 52 mm diameter PET Superline
parallel strand construction. The guaranteed minimum breaking strength
quoted by H&T Marlow Ltd. (1985) is 0.30 kN/mm 2. According to Banfield
(1989) the average breaking strength should be 10% higher than the
catalogue value, i.e. 0.33 kN/mm 2. A 53 mm diameter Superline, tested by
Karnoski & Liu (1988) showed a strength of 0.52 kNimm 2, which is 58% higher
than expected!
4.6.4 Stiffness
Several papers ( for example: Crawford & McTernan (1983), Ractliffe & Parsey
(1985) and Taylor et al. (1987)) discuss the subject of rope stiffness, but none
presents an adequate formulation encompassing the frequency range
relevant to catenary moored platforms. McKenna (1979) gives a good
description of the quasi-static tensile behaviour of fibre ropes. Referring to
Figure 4.21, the different components of rope elongation are described as:
ALr = residual elongation (mainly due to constructional setting);
ALh = elongation recovered by the rope after cycling at working
loads and rested for 30 minutes;
ALn = non-elastic elongation;
ALw = working elongation (non-linear elastic); and,
ALt = total elongation relative to unused rope.
Data supplied by manufacturers usually corresponds to the first cycle of
71

Figure 4.21. This is relevant only for assessing final length after line
deployment and anchor setting. Some rope makers provide data for ropes
that have been worked and rested (say for 24 hours).
Wave frequency stiffness is shown in Table 4.3 in kN/mm2 (GPa). The area
referred to is the area of the circle circumscribing the core section. Since very
few papers quote results from direct dynamic stiffness measurements, giving
detailed rope dimensions, the figures given in Table 4.3 were derived making
several different assumptions, as a function of the available data for each
material and construction combination. Appendix 2 gives details of the
references and further assumptions upon which the values were based. Four
papers are particularly relevant for the ropes studied and are discussed
below, giving an idea of the process used to obtain the data contained in
Table 4.3.
Bitting (1980) reported on the dynamic stiffness behaviour of small diameter
(12.7 to 31.75 mm) braided ropes. A mild stiffness dependence on frequency,
a strong dependence on mean load and a moderate dependence on load
range were found. A factor of three to four times was reported between quasi-
static and dynamic (wave frequency) stiffness for nylon ropes.
For 12.7 mm diameter double braided polyester rope the new dynamic
stiffness and the dynamic stiffness after 4 years in the sea were found to be
respectively 60% and 90% greater than quasi-static stiffness. The actual
dynamic stiffness, Kap (in 10 4 lbf), measured for this polyester rope when new,
followed the equation:
Kap = 9.457 - 0.578 f2 - 0.196* Fm2 - 0.284* AF2 + 0.271 *f +
+ 1.973*Fm - 0.319*AF- 0.067*f*Fm+0.100*f*AF+
+ 0.464 * Fm * AF,
where: f = (frequency (in Hz) - 0.3)1 0.2;
Fm = (mean load as percentage of BL - 21) / 9; and,
AF = (load range as percentage of BL - 17) / 7.
Using this equation for a loading of 21% ± 8.5% of the BL at a frequency of
0.3 Hz, a modulus of 3.3 GPa is obtained, based on the area of the circle
enclosing the rope section.
72

Recent work by Toomey et al. (1990) on 12.7 mm diameter double braided
polyester ropes cycled between fixed strain limits, reports much higher values
for dynamic modulus. Most of the testing concentrated on frequencies and
load ranges much bigger than those found in spread moorings of large
floating structures, and caused the ropes to overheat. However a few tests
were performed under milder conditions and the samples were kept cool. For
a mean tension of 20% of the nominal BL and a strain range corresponding to
a load range of ±7.5% of the BL, at 0.2 Hz, a modulus of 5 GPa was
measured.
Karnoski & Liu (1988), from the US Naval Civil Engineering Laboratory, tested
a polyester Superline (parallel sub-rope construction) with an additional
extruded polyurethane jacket. The rope had a diameter of 53.34 mm without
the extruded jacket. A typical core diameter would be 47.34 mm (not
mentioned in the paper). The rope extension limits are given for a cycling load
corresponding to 8% to 50% of MBL at 0.1 Hz. Based on this figures, the
dynamic modulus including the braided jacket would be ca. 8.4 GPa and the
core only would have a modulus of approximately 9.6 GPa (considering that
without the cover the strength of the rope is reduced by 10%).
The data contained in Karnoski & Liu (1988) had not been analysed in the
"pilot study", because Taylor et al. (1987), also with the US Naval Civil
Engineering Laboratory, gave direct results for the dynamic stiffness of a
38.1 mm Superline (3.6 GPa). The latter figures, reduced by an estimated
10% to account for scale effects to a breaking load of about 5000 kN, are
shown in Table 4.3.
Ractliffe & Parsey (1985) studied the dynamic behaviour of 8 strand and
Superline (parallel sub-rope) nylon and polyester ropes. It is worth
remembering that the Superline has a braided cover and a core containing
the main load carrying 3 strand sub-ropes. The model presented does not
account for any influence of mean stress on modulus. The discussion
presented in the paper only allows the calculation of maximum and minimum
modulus, corresponding to the high frequency and the quasi-static conditions.
For the polyester 8 strand rope these values were respectively 0.57 GPa and
1.61 GPa. The maximum dynamic modulus obtained using the equations
73

presented by Ractliffe & Parsey for a PET Superline for a load range of 20% of
UBL, was 2.51 GPa. Even for a result incorporating the braided jacket this is
very low. Considering this result is substantially lower than .reported by Bitting
(1980) and by Toomey et al. (1990) for nominally much more compliant ropes,
and less than 1/3 the modulus measured by Kamoski & Liu (1988) for a rope
of similar construction, the only possible conclusion about this result is that it
should be treated with caution as should the model used.
Considering the large discrepancies found in the results in the literature a
limited amount of testing was done at this stage on a small diameter parallel
strand polyester rope (Brascorda Parallel). The rope consisted of 24 strands
laid in parallel, enclosed on a polypropylene braided cover. The approximate
diameter of the core was 9.5 mm and the average breaking load of the rope
with the cover removed was ca. 40 kN.
Testing was done in a Dartec servo-hydraulic tension testing machine. Load
was measured with the built in load cell. Strain was measured with an
extensometer directly attached to the rope free length (Figure 4.22). The
extensometer used was designed specifically for this project. It is a full bridge
90 mm gauge length extensometer, for ±10 mm deflection. Its sensitivity
(indicated strain / actual strain) is 0.02115 at a gauge factor of 2, and its
stiffness is 0.0063 N/mm. A Measurements Group model P-3500 digital strain
indicator was used as conditioner, the results being plotted on a Gould Series
60000 XY plotter.
From these exploratory tests the main trends reported by Bitting (1980),
concerning modulus dependency on the loading parameters were verified.
The results obtained for the dynamic modulus were quite high. Typical
modulus at a loading of 20% ± 10% of the BL was about 15.5 GPa, based on
the estimated area of the circle enclosing the rope core. No effect of frequency
was measured in the dry condition. An increase of 4% in stiffness was found
on the wet tests, between 0.01 and 0.2 Hz. Stiffness variation with load range
was 12%, for ranges from 10% to 20% of the BL (stiffness decreasing with
increasing load range). Stiffness variation was found to be 26% for mean
loads varying between 10% and 30% of the BL.
74

4.6.5 Weight
The dry weight data shown in Table 4.3 came mainly from manufacturers'
catalogues and is presented as weight (kgf) per unit area (enclosing circle,
mm2) for 100 m of rope. Submerged weights were based on yarn densities
assuming the ropes to be completely flooded. This will normally be the case
since: (i) it is very difficult to guarantee that there are no leaks in the jacket or
in the termination, (ii) only fibres with little sensitivity to sea water are likely to
be used, (iii) a flooded rope will exchange any heat (generated by hysteresis)
better than a dry rope, and flooding is necessary to eliminate hydrostatic
pressure.
4.6.6 Cost
Every effort was made to obtain consistent and relevant cost data. Most data
shown on Table 4.3 came from rope makers, who were asked to consider a
price based on a requirement for:
- eight mooring lines;
- 1000 metres long; and,
- 500 metric tonnes breaking strength.
Jacket and termination costs were excluded for normalisation wherever
possible since exact needs would depend on the full lengths required and
handling procedures.
Costs shown in Table 4.3 refer only to the capital cost of the tether. It is
appreciated that apart from the interaction between the tether properties and
the mooring system behaviour, which is discussed in Chapters 3 and 9, a full
comparison of the cost implications of different tether systems would take into
account:
(i) the vertical load imposed on the rig by the lines;
(ii) the cost of installation;
(iii) jacketing cost;
(iv) the cost of termination; and,
75

(v) the life cycle costs (inspection, replacement and removal).
4.6.7 Creep
Very little has been published concerning the long term elongation behaviour
of fibre ropes under constant load. Although more elaborate constructions
present a residual or permanent elongation after a few cycles at any
significant load level , for more parallel rope constructions this effect is
reduced to very small levels. McKenna (1979) quoted a residual elongation of
4.5% for a double braided polyester rope cycled between 10% and 20% of the
BL. No precise figures were found for any other construction.
Total elongation with time including initial elongation could not be found for
any fibre rope. Two references present partial elongation results for small
diameter ropes.
Lewis (1982) presented measurements of "creep strain", possibly meaning the
additional elongation measured subsequent to an "initial" elongation, for
several small diameter Kevlar 29 and Kevlar 49 ropes. The actual
measurements are not presented but the curves pictured start approximately
10 minutes after loading and the results are shown as linear on a logarithmic
time scale. Table 4.4 shows the creep rates quoted, in % per time decade. It
was not possible to identify whether the loading was based on the nominal or
in the average breaking load of the ropes tested.
Linear Composites Ltd. (1983) tested small diameter Kevlar 29 and polyester
parallel lay ropes (Parafil) up to 7 years under constant loads corresponding
to fixed percentages of the nominal (catalogue) breaking load. Presentation of
results is similar to Lewis (1982) in that the initial elongation of the rope is not
given, but the actual test data is tabulated. Although Linear Composites Ltd.
(1983) did not attempt to fit a linear logarithmic time law to the data, a
reasonable fit was obtained, and the rates obtained are also shown in Table
4.4. Since the data is quite sparse and has some scatter other curve fits give
similar coefficients of correlation. LCL, for example, fitted a straight line on a
linear time scale for the data points after 230 days.
76

Results obtained by Lewis (1982) and Linear Composites Ltd. (1983) show
consistent creep rates of around 0.045% per time decade for parallel laid
Kevlar 29 ropes over the useful range of loads in .catenary mooring
applications, well in agreement with Kevlar 29 yarn data (0.050% per time
decade) at 50% of the breaking load.
The result for the PET Parafil, 0.089% per time decade, is lower than values
for PET yarn given by ENKA (1985,3), 0.12% per time decade between 103
and 104 s, under a load of 40% of the yarn actual breaking load. Differences in
yarn characteristics, are not a plausible explanation for such a difference in
favour of the rope. A more sensible explanation is that the rope shows the
same trend as the yarn (Tabor & Wagenmakers (1991) and ENKA (1985,3))
with decreasing creep rate as time passes. The scatter in the data presented
by LCL does not permit a verification of this hypothesis.
The wire rope construction tested by Lewis had a creep rate almost three
times the parallel lay ropes. This clearly shows how, even on a small rope, the
effect of twist can predominate over the yarn behaviour.
4.6.8 Tension-Tension Cycling ("Fatigue")
The subject of "fatigue" resistance has been investigated mainly for ropes
used in hawsers which connect shuttle tankers to buoys in single point
moorings (Parsey (1982) and (1983), Parsey et al. (1987), Heade & Parsey
(1983), Van Leeuwen (1981) and Werth (1980)) and as part of a wave energy
recovery system programme (Crawford & McTernan (1983), (1985) and
(1988)). Plaited and double braided ropes mostly of nylon and PET yarns
were tested generally under severe loading conditions, i.e. load ranges above
30% of MBL and very low minimum loads (below 5% of UBL), in various
frequencies and environmental conditions (wet, dry, partially wet and drying).
Parsey (1982) and Hearle & Parsey (1983) have postulated the following
mechanisms of "fatigue": creep, hysteresis, filament fatigue, structural fatigue
and abrasion.
Similarly to what has been discussed in Section 4.3.3 with respect to yarns, a
77
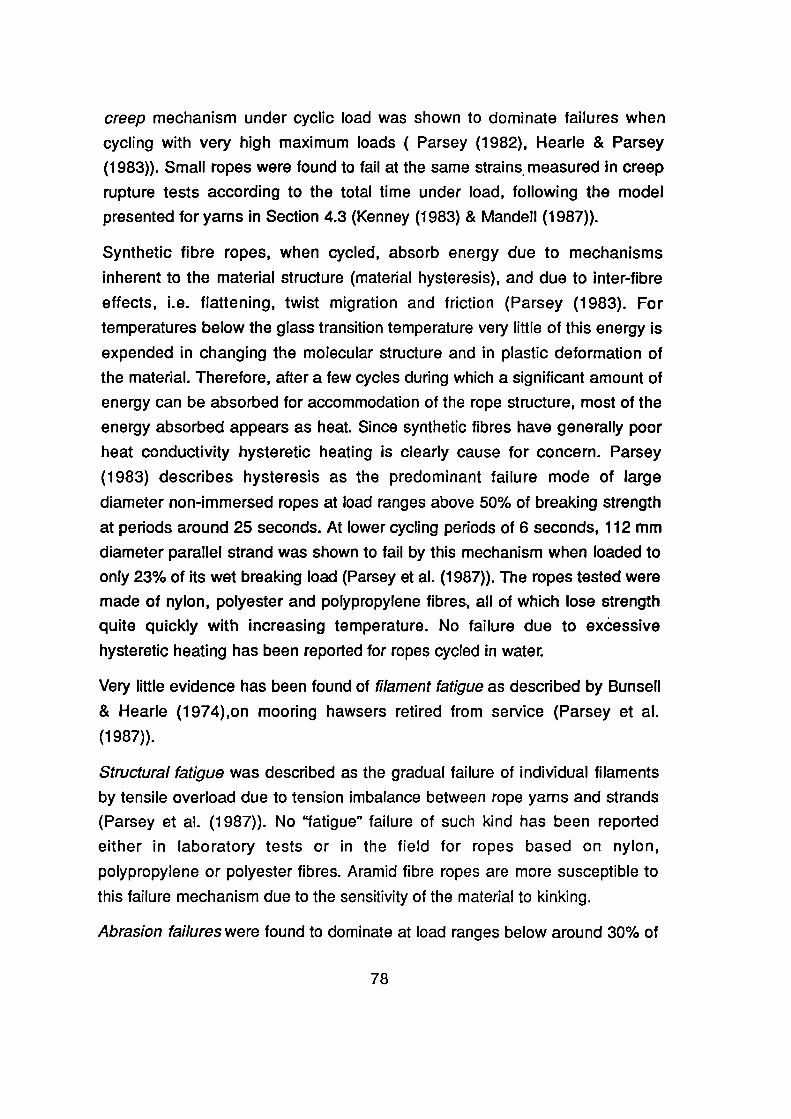
creep mechanism under cyclic load was shown to dominate failures when
cycling with very high maximum loads ( Parsey (1982), Hearle & Parsey
(1983)). Small ropes were found to fail at the same strains , measured in creep
rupture tests according to the total time under load, following the model
presented for yams in Section 4.3 (Kenney (1983) & Mandell (1987)).
Synthetic fibre ropes, when cycled, absorb energy due to mechanisms
inherent to the material structure (material hysteresis), and due to inter-fibre
effects, i.e. flattening, twist migration and friction (Parsey (1983). For
temperatures below the glass transition temperature very little of this energy is
expended in changing the molecular structure and in plastic deformation of
the material. Therefore, after a few cycles during which a significant amount of
energy can be absorbed for accommodation of the rope structure, most of the
energy absorbed appears as heat. Since synthetic fibres have generally poor
heat conductivity hysteretic heating is clearly cause for concern. Parsey
(1983) describes hysteresis as the predominant failure mode of large
diameter non-immersed ropes at load ranges above 50% of breaking strength
at periods around 25 seconds. At lower cycling periods of 6 seconds, 112 mm
diameter parallel strand was shown to fail by this mechanism when loaded to
only 23% of its wet breaking load (Parsey et al. (1987)). The ropes tested were
made of nylon, polyester and polypropylene fibres, all of which lose strength
quite quickly with increasing temperature. No failure due to excessive
hysteretic heating has been reported for ropes cycled in water.
Very little evidence has been found of filament fatigue as described by Bunsell
& Hearle (1974),on mooring hawsers retired from service (Parsey et al.
(1987)).
Structural fatigue was described as the gradual failure of individual filaments
by tensile overload due to tension imbalance between rope yarns and strands
(Parsey et al. (1987)). No "fatigue" failure of such kind has been reported
either in laboratory tests or in the field for ropes based on nylon,
polypropylene or polyester fibres. Aramid fibre ropes are more susceptible to
this failure mechanism due to the sensitivity of the material to kinking.
Abrasion failures were found to dominate at load ranges below around 30% of
78

breaking strength and usually happened in splices by yarn on yarn abrasion
and/or abrasion on the thimble. Lives under this kind of loading have been
improved by appropriate yarn finish selection, splice design and protection. In
ropes subject to abrasion, no endurance limit has been found as yet (Parsey
(1982) and Mandell (1987).
For the endurance of wet braided polyester ropes, Mandell (1987) has
proposed a bi-modal heuristic model which incorporates a creep-rupture
behaviour up to 3,000 cycles and an abrasion failure mechanism over 3,000
cycles. The creep model follows the equations given in Section 4.3.1. The
following equation was fitted to the data in the abrasion regime:
N . (1 - S / So) . (Ao / k) . (So / 5)111
where: N . number of cycles to failure,
So = new rope wet strength,
S = maximum force,
Ao = initial rope cross-sectional area,
k . rate of material removal due to abrasion, and
m = sensitivity to load level.
With m assumed to be 3, a value of 10 35 for Ao/k was found to give a good fit
to available data for tests on polyester ropes without protection to the inside of
the eye of the spliced termination(failing due to external abrasion). A value of
1043 gave a good fit for PET ropes with eye protection (failing due to internal
abrasion in the splice).
Figure 4.23 shows data gathered by Mandell from: Van Leeuwen (1981),
Crawford & McTernan (1983) and (1985) and others (proprietary work). The
load range is presented as a percentage of the measured ultimate breaking
load for the ropes (UBL). The strait line corresponds to the creep rupture
model and the S-shaped curves to the abrasion model.
Crawford & McTernan (1988) tested a 28 mm diameter 8 strand polyester
rope. A sample cycled between 1.5% and 15% of the actual BL broke after
3.33 million cycles. A run-out at 6 million cycles from 1.5% to 10% was also
reported. These results are also plotted in Figure 4.23 and can be seen to
agree well with Mandell's prediction.
79

Parsey et al. (1987) gives results for a PET rope tested wet (also included in
Figure 4.23) but no information is given about rope construction, size or other
testing conditions, except the load range. The data presented corroborates
Mandell's model in the higher loading regimes, but at load ranges of 30% and
25% of the BL two samples were considered run-outs with 1 million and ca.
2.5 million cycles respectively. Both performed better than predicted by
Mandell's abrasion model even at the lower abrasion rate (Ao/k = 104-3).
Also plotted in Figure 4.23 is a mean life SN curve proposed by Chaplin &
Potts (1991) for six strand steel wire rope with independent wire rope core
based on carefully selected published work (rope samples showing:
termination failures, too short samples, overheated samples and other
anomalies have not been considered).
It should be noted that for load ranges lower than 40% of the UBL all results
for the wet polyester ropes fall to the right, i.e. on the safe side, of the curve
proposed by Chaplin & Potts, except for 4 run-outs. These results correspond
to lives between 10 5 and ca. 5 * 10 6 cycles. On the other hand under more
severe regimes wire ropes seems to perform better. However, since some of
the tests on the fibre ropes have not been performed under immersion and the
internal temperature in the fibre ropes has not been monitored, it is possible
that excessive heating has been the cause of some of the failures observed
well below the creep rupture line. In the very high cycle regime, Chaplin &
Potts predict a fatigue limit for wire ropes. No such limit has been forecasted
for the braided constructions of fibre ropes due to abrasion.
Other materials and more efficient constructions have been investigated,
mainly in small diameters with the exception of:
(i) some early NEL data on parallel yarn "PARAFIL" rope (Crawford &
McTernan (1988);
(ii) a small number of tests done by Karnoski & Liu (1988) on
approximately 100 tonne breaking load Kevlar 29 parallel lay and
polyester parallel sub-rope construction ropes; and,
(iii) three test results on a 450 tonne Kevlar 29 wire rope construction
(E. I. du Pont du Nemours & Co. (undated).
80

Figure 4.24 shows these results together with the curve proposed by Chaplin
& Potts. The load range is presented as a percentage of UBL. In order to
avoid reducing even more an already quite small database, tests conducted:
dry, wet, drying and at different frequencies have all been included in this
graph.
The tendency shown is similar to that of the braided ropes, but the results at
low load ranges are superior. This is not unexpected since these constructions
have much lower relative motions between adjacent fibres than braided
ropes.
Figure 4.25 is an extract from Figure 4.24 containing only the polyester ropes.
Two results are on the unsafe side of Chaplin & Potts' curve and are
discussed below:
(i) A Superline parallel sub-rope sample with a braided cover and an
additional polyurethane jacket was soaked in water prior to testing
but had no cooling during testing and was cycled at a load range of
62% at 0.1 Hz. There is a strong possibility of overheating in this
test at such a high load range.
(ii) A 10 tonne parallel yam rope sample was fitted with an early model
of a socket and plug termination. Three other tests were conducted
with improved terminations under the same loading conditions and
performed markedly better than the proposed wire rope curve.
The run-out at 2 million cycles retained 93% of the original strength. The
number of test results available here is very small to draw any conclusions but
the trend is still for fatigue lives superior to those of steel wire ropes at cycling
ranges below 50% of ultimate.
4.6.9 Hysteresis
The net energy absorbed inside a rope during cycling, called rope hysteresis,
is composed of: material damping and energy spent by the relative movement
under pressure between fibres in the rope. In generic terms, stiffer yarns and
low twist constructions lead to lower hysteretic energy dissipation. Appendix 1
81

gives the relevant definitions for damping and hysteresis..
Hysteresis energy is of great concern and has been discussed in several
papers on single point mooring hawsers and towing cables. These ropes are
frequently cycled dry or wet, but not immersed. Depending on the rope
diameter and the cycling regime, quite high equilibrium temperatures in the
centre of the rope can be achieved. For example, core temperatures as high
as 130°C have been reported by Toomey et al. (1990), for a 12.5 mm diameter
double braided polyester rope, cycled at 1 Hz with a fixed strain amplitude of
22000
Parsey (1983) cycled previously wet 48 mm diameter 8-strand polyester rope
samples between: 10% and 28%, 10% and 50% and 10% and 70% of UBL at
6 second period. He defined normalised hysteresis as the area within the
loop, on a load elongation plot, divided by the area bounded by the loading
curve, a vertical tangent at the right of the loop and the lower horizontal
tangent to the loop. This definition is loosely associated by Parsey with the
logarithm decrement (Parsey (1983) and with the loss factor, in a later paper
(Parsey et al. (1985)).
Considering the very flat shape of the loading curve found in cycling
hysteresis loops of braided ropes, as shown in Figure 4.26 after National Coal
board (1979), the definition adopted by Parsey is approximately equal to the
relative damping, Drel, as defined in Appendix 1 (i.e. half the logarithm
decrement and n./2 times the loss coefficient or loss factor).
The values quoted by Parsey for his normalised hysteresis quickly collapsed
to about 0.25 after ca. 50 cycles at the lower cycling regime. In the more
severe loadings maximum value measured was 0.29. These values
correspond to a loss coefficient of 0.16 or a logarithm decrement of 0.5 and
are approximately ten times higher than results presented by Van Der Meer
(1970) and by Kenney (1983) for polyester yarn (see Section 4.3.3).
Parsey (1983) also measured the thermal conductivity of dry compacted
polyester strands, and found 0.17 W/m.°C.
Toomey et al. (1990) tested 12.7 mm diameter braided PET rope dry and wet
82

at constant strain ranges for frequencies between 0.0667 and 1 Hz. His results
do not allow a direct evaluation of the energy dissipated in the wet tests
because only the temperature rise in the rope is given. Nevertheless it is
interesting to note that even when cycled at 1 Hz at a strain rate of 0.44 s 4 the
rise in temperature in the centre of the rope was limited to 5°C.
Li et al. (1990) used Toomey et al. (1990) data to adjust a thermal model to
simulate the heating of braided fibre ropes subject to cycling. The estimated
rope conductivity dry was found to be 0.12 W/m.°C. The heat transfer
coefficient in the wet tests varied between 1000 and 3000 W/m 2.°C which was
considered could be taken as infinity with negligible error, i.e. the external
temperature of the rope wall was effectively equal to the water temperature.
Hobbs & Raoof (1985) reported on hysteresis in large steel spiral strands.
Results were presented as damping capacity which corresponds to twice the
logarithmic decrement (Appendix 1). Peak values were found to be about
0.30 corresponding to a logarithmic decrement of 0.15 and a loss coefficient of
0.048. This result is an order of magnitude bigger than results compiled by
Lazan (1968) for a variety of carbon steels. No influence of frequency has
been measured in wire ropes.
To assess the hysteretic behaviour of a more parallel construction a 10 mm
diameter parallel strand rope (Brascorda Parallel) was cycled wet, at 0.2 Hz,
between 10% and 30% of UBL. After 100 cycles the loss coefficient was down
to approximately 0.02, which is quite close to the yarn results (Section 4.4).
The difference between this result and the 0.16 reported by Parsey (1983) is
striking, although expected, since the construction of rope tested by Parsey
incorporates several levels of twist and a braiding operation as well.
4.6.10 Field Experience
Large diameter stranded and braided polyester ropes have a good reported
performance as single point mooring hawsers, however tension load histories
are quite different in catenary mooring systems. Hawsers operate
discontinuously, being generally left floating unloaded when there is no ship
83

moored to the buoy. When the rope is being used, its mean load is normally
lower than in the legs of a spread mooring system, but tensions due to low
frequency movements from the tanker in relation to the buoy can be very high.
The number of handling operations is also much higher than in a catenary
system leg. The detrimental effect of sun light and the formation of salt crystals
inside the rope structure are additional factors that make the application of
synthetic fibre rope in hawsers generally more severe than in spread mooring
systems.
Concerning the long term strength degradation of ropes made from polyester
fibres continuously immersed in seawater, data is limited to two conflicting
references described below.
Bitting (1980) tested 12.7 mm diameter double braided and plaited ropes after
immersion for up to 5 years as part of several buoy moorings. Some samples
of the double braided rope were partly in contact with the sea bed. The
nominal tensile load in the samples was very small. The samples of the
braided rope removed from different mooring locations showed retained
strengths linearly decreasing with time, and after 5 years the retained strength
was 50% of the original measured breaking load, five samples of the 8 strand
rope were removed after being installed for 5 years in moorings without
touching the sea floor. The average retained strength was 76%. It should be
noted that none of the samples had protective jackets and the upper end was
ca. 1.5 m below the water surface. Although photochemical degradation
caused by the sun light was not mentioned by Bitting it is more than likely that
it had some effect on the samples.
Linear Composites Ltd. (1983) reports that polyester parallel yarn (Parafil)
ropes recovered from seawater moorings after 10 years showed no strength
degradation of the rope or of yarns removed from the rope. No details of the
installation are given.
Two types of ropes have been used in actual catenary mooring installations: a
polyester parallel sub-rope construction (Superline) and an aramid wire rope
construction (Jetstran, made by Whitehill in USA).
Three 38.1 mm (1.5 inch) diameter 1067 m long Superline ropes in
84

combination with chain and anchors were installed by the US Navy in a
triangular shaped semi submersible in 887 m of water off the coast of
California. More details of the installation are given in , Section 3.1. The
installation was considered successful (Taylor et al. (1987)) but no report was
found on the log term performance of this mooring.
The only rope with recorded experience as part of mooring lines of the size
compatible with the application now studied is the aramid, Kevlar 29, wire
rope construction made by Whitehill.
A 63.5 mm (2.5 inch) diameter, 1.87 MN (420,000 lbf) breaking strength, 18-
strand Jetstran rope was used for the Ocean Builder I moorings in 1983
(Riewald (1986) with very poor performance, resulting of several line failures
at very low loads. This was found to be due to unpredicted alternate
compression loading in the rope fibres, causing kinking, and subsequent
tension fatigue damage, during system pre-deployment (Riewald et al.
(1986)).
A 36-strand construction, nominally 4.45 MN (1 million lbf) breaking strength,
101.6 mm (4 inch) diameter (including jacket), 305 m (1000 ft) length of rope,
of the same material and manufacturer was installed as part of the catenary
mooring system of a semi-submersible drilling in 468 m of water in the Gulf of
Mexico in 1985 (Koralek & Barden (1987). The average dry breaking strength
of the rope was 4.40 MN and a single sample tested after 2 weeks immersion
in tap water broke with 4.00 MN.
The rope was retrieved after five months. The only signs of damage were on
the cover inside one of the eyes. Subsequent breaking tests on two
specimens taken from the rope gave an average strength of 4.09 MN and all
broke at the new splice. As the specimens bled water during testing, it was
considered a wet test. The load obtained corresponds to a loss of 7% on the
average obtained for the new dry rope and to a 2% gain over the only wet test
performed on a new specimen.
Two 50 meter lengths of this used rope were re-spliced and sent to Brazil. The
first was installed in 1987 in a semi-submersible production platform operating
in 240 metres water depth in Campos Basin in combination with 76 mm (3
85

inch) ORQ chain, in a lightly loaded mooring leg. During the installation the
rope was coiled in the drum of the anchor handling boat over a shackle and
the jacket was locally cut by the shackle pin. No damage was apparent in the
rope strands, so the rope was deployed. The rope was removed after five
months. The eyes showed no damage. The wet breaking strength recorded
was 3827 kN and the rope broke in the region were the jacket had been
damaged, showing that somehow the rope had been damaged.
The other rope sample was installed in the same rig and location, but in
another mooring line (facing the strongest weather), in June 1988. The
specimen performed well for 18 months. Upon recovery the sample was found
to be mechanically damaged. A deep cut was found in the rope cover away
from the terminations. It was not possible to visually assess the presence of
damage in the rope strands. Tested to failure the rope showed a residual
breaking load of 3182 kN. Failure happened in two locations, 4 strands broke
at the mechanically damaged section, and several others broke at the splice
situated closer to the damage.
The experience with wire rope construction aramid mooring lines has shown
that the susceptibility of the material to kinking and handling damage has to
be taken into account. Up to now there are no reliable models to predict the
stresses in all fibres of a complex braided or twisted rope construction under
various cyclic loading conditions. This puts a question mark in the use of these
ropes in a non redundant structure with fixed risers.
86

1970 1975 1980 1985 1987
('000 tons) (%) ('000 tons) (%) ('000 tons) (%) ('000 tons) (%) ('000 tons) (%)PolyamideWestern Europe 606 32 603 24 637 20 639 19 629 17USA 606 32 854 34 1,083 34 1,042 31 1,147 34Japan 303 16 276 11 319 10 303 9 333 7Other regions 379 20 779 31 1,147 36 1,379 41 1,555 42World 1,895 100 2,512 100 3,185 100 3,364 100 3,702 100
PolyesterWestern Europe 458 28 638 19 707 14 889 14 848 11USA 654 40 1,377 14 1,819 36 1,524 24 1,619 21Japan 311 19 437 13 606 12 634 10 617 8Other regions 213 13 907 27 1,920 38 3,301 52 4,627 60World 1,635 100 3,359 100 5,053 100 6,349 100 7,712 100
AcrylicsWestern Europe 402 40 526 38 688 34 842 35 821 32USA 221 22 235 17 344 17 289 12 282 11Japan 262 26 235 17 344 17 385 16 411 16Other regions 121 12 388 28 648 32 890 37 1,052 41World
tellulosics
1,006 100 1,385 100 2,024 100 2,405 100 2,567 100
Western Europe 1,092 30 769 24 872 25 702 21 688 21
USA 717 20 470 15 550 15 253 8 228 7
Japan 498 14 391 12 432 12 388 12 372 11
Other regions 1,293 36 1,571 49 1,703 48 1,940 59 2,001 60
World 3,600 100 3,201 100 3,557 100 3,283 100 3,289 108
Table 4.1 - Production figures for man-made fibres from 1970 to 1987
(from Davies (1989)).
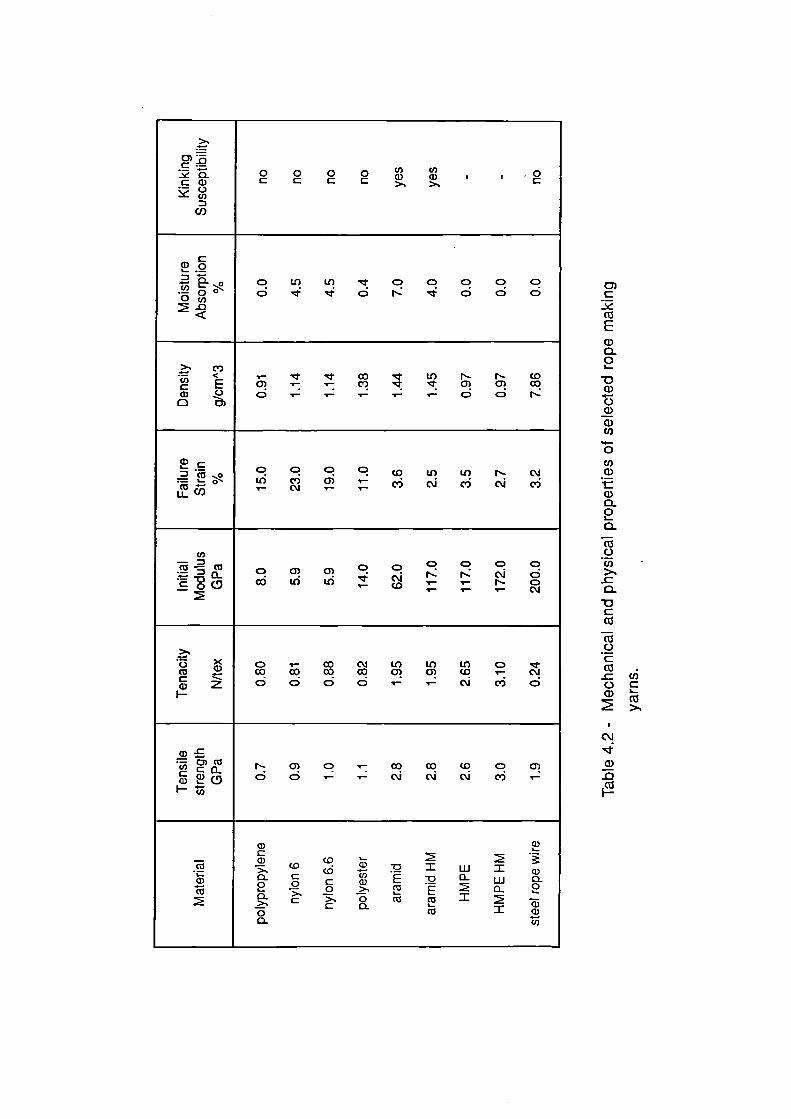
.....c--2 7:1c a)2 f.-3
=co
0c 0c oc oc c''a) u)a) ' , , o
c42 .0
..=co ---,— o 0o co2 .c)
<
o6
co-4:
co4
Nt.6
oN:
c)..zi
c)6
c)6
o6
.>. 0)co <c Ea) c-)0 o)
v—ci)c;
.1.
.g-
..-
-.4..1
.,-
c0r?.,-
nol--..u...-
toNzr:..--
Na)6
Na)6
CDcoN.:
2 c
a 7,;LL s•-•
a6.V.
aC)CV
a
"--
q
.--
to6
Lo6
Laei
N6
CMC')
Cl)=as — as= a-
C 0 (-9—M
oai
a)6
a)1.6
o,..
oco
c)..-.-
c) N:..-
I-
o6N.1.-
oaCDCg
.>,
Z5 XMI CDC "2a)I-
0CO6
T.-COci
COCO00
0400
LA01a-
IDa),
IDCD6
*0I-ri
CV46
C (1) "a) ‘._ ai-- to-
NCi
a)6
CD,--
..--a--
CO6
CO(j
CD6
CD6
(3),--
Ts._iii
a)ca)eL2
10->„T-.)0.
c°-5C'
co
g----L-.
n-2>,
—0c).
:Eca
a)
2170ffCU
as
inCL
.....-,-
2Iw
0—2I
2.3-a)0 _2
—0(I)to-

(1)=Tu>
•....:-.4:-.-u)
W.)cc
N..CD
ci.
..1-1-
ci.
a).-C.
cmCO
c;.,-CM
ciaC\I
c;coCO
ciN-CM
ci.In.-ci
0)T-
ci.CD0
CO0
a)=Tts>
...... •—U)
TucC
4ci
Cs6
rt -. 2.c;
I: ,tc.
.-:
t. 46
1: F3ci
c4 I.ci
z 71ci
(73ci
(94:6
.
,c3) coN-ci.
a) e:).= u)as D> ----0 ECi) CDa) ac— .
c. 7 ...) ..
..4-C6
ar..:
a)06
L°6
"C)
COoi frpCD CD
C')CMh:
COcyj
qco-a
CDc;tr)
cl) te2 u)aS D> ----= EmgC .„a) •" Z55 ..,a
ri\--j c;
41
c614
6.ai
4:6g 4)
c::;cC1
ciI Lem)
ci0 )
cia)c:i
.crci.
CDci.
r...zi:ci
0)7,0 64
(..) u)D
,I.a5
Lor":
u).-c3
,r)6
aNI':
co.4-°6
0
C \ IN:
(D
Inc°
..1-
cnh:
0.
co°
to
C‘i
v.
Cr).
Ea ci
cn ,c)U) .co,m - -s- <Ealo E.-1 13)
1"---a6
CDaci
CD
c)ci
CD
a6
ocucucna)c)maCD
aci
I-
.---ci
CD
aci
.-
..-ci
N.CD
cicacq
et
1-ci
c.,cotilci
cocoCDci.
fU)0 asc 0-_
65
co
6
c)
6
c)
61.„6
1.0(R,
co4
co;7
r-•(g.
a("6
r-.:Loh-
c.-..:(DN.
6
CDC°.-
-00) CZC CL2..)065
CVCM
ciCDCOci
h.-'szrci
COCOci.
CDCOci.
CD1-.-:
CDCO
c;CD.-i-:
rn-•crci
COcoci
..4-a)ci.
(NJc,..
rc.=0 •Tcs.
I)Es._
JDa)
.-c7)70
IDon-77.30>.
TD0.
a)c='-a)a=
U);a517;a)>,
o•0 a,
CEa..—cn
Tu—*FsZ 6
,0tii
-�.-0C)-
=,.-Ct$‘-(1'CL'a- 5
64>.0cp.
Cr)Co0a)aoL._
112
0),(11co-5a)Y
=E
(150_
C S)
ca>a)Y
C/)Coc.)a)c.0L_
a)
a)-a.as7cuY
=
C'30_
a)
as'5a)Y
7C)C-s-6
-0 a)
-0=0-0
c)47),,—1-.5a)CI
(/)
CE.0 ./Tn.-0a)-0m.._..
a0)Tr_cz—>a,Y
a)00'-'0
• t=
toc,-)(>8
a)CX2a)•-.-
IDcEto
—Es.-0.u)

Material Construction Diameter
mm
Load
% of BL
Strain Rate
% / decade
Reference
Kevlar 49 parallel lay 11 20 0.027 Lewis (1982)
Kevlar 29 parallel lay 9.5 50 0.051 Lewis (1982)
Kevlar 29 braided 6.35 50 0.088 . Lewis (1982)
Kevlar 29 wire rope 6.35 40 0.124 Lewis (1982)
Kevlar 29 parallel lay 5.4 20 0.041 LCL (1983)
Kevlar 29 parallel lay 5.4 40 0.038 LCL (1983)
Polyester parallel lay 10 40 0.089 LCL (1983)
Table 4.4 - Creep rates reported in the literature for small fibre ropes.

double - braided
eight - strand
parallel sub - rope
three - strand
wire rope parallel yarn
Figure 4.1 - Conventional and low twist rope constructions.

.0
C 13.)
g-4 0 r.., t-I
CD ...4 a) 0 C) -CE 41-, C CD JD CD
>. 7 C. C 4-E ..-c
4-1 4-4 E ..-1 ca co C
CO 7 0- a) -C ..-t
a CO C. Lo = C.) C.,_
4.J-•-n •—n E-C a) 7
(-)
t

Aload load
•elongation
/t
/ tangent
High Modulus
elongation
Normal Modulus
Figure4.3 - Load - elongation curves for normal and high modulus fibres
(from ASTM - D855-85 (1985))
40 60 „ 80 100RELATIVE HUMIDITY (%)
Figure 4.4 - Effect of relative humidity on the initial modulus of nylon
(from HadIley et al. (1969).

RIEWALJ3
flIflul7 u
i0-2 aiu 111 035
Figure 4.5- Kinks in aramid fibres (from E.I. du Pont du Nemours & Co. (1987)).

Twist 1.1T.M.72°F, 55% R.H.50% OF ULTIMATE STRENGTH
Dynema SK60
0 30% of YBL
^
POLYESTER
"=" 100 yr
— 1 yr
114
0.1 1.0 10
100
1000
lime, Hours
Figure 4.6 - Creep results for selected man-made fibres and steel wire
(adapted from E.I. du Pont du Nemours & Co. (1987)).
20
16
C)
12
0i-tif 8F-
4
0.2 0.4 0.6 0.6
10
FRACTION OF NOMINAL (1 SEC.) BREAKING LOAD
Figure 4.7 - Stress-rupture of selected man-made fibres
(adapted from E.I. du Pont du Nemours & Co. (1987)).
0
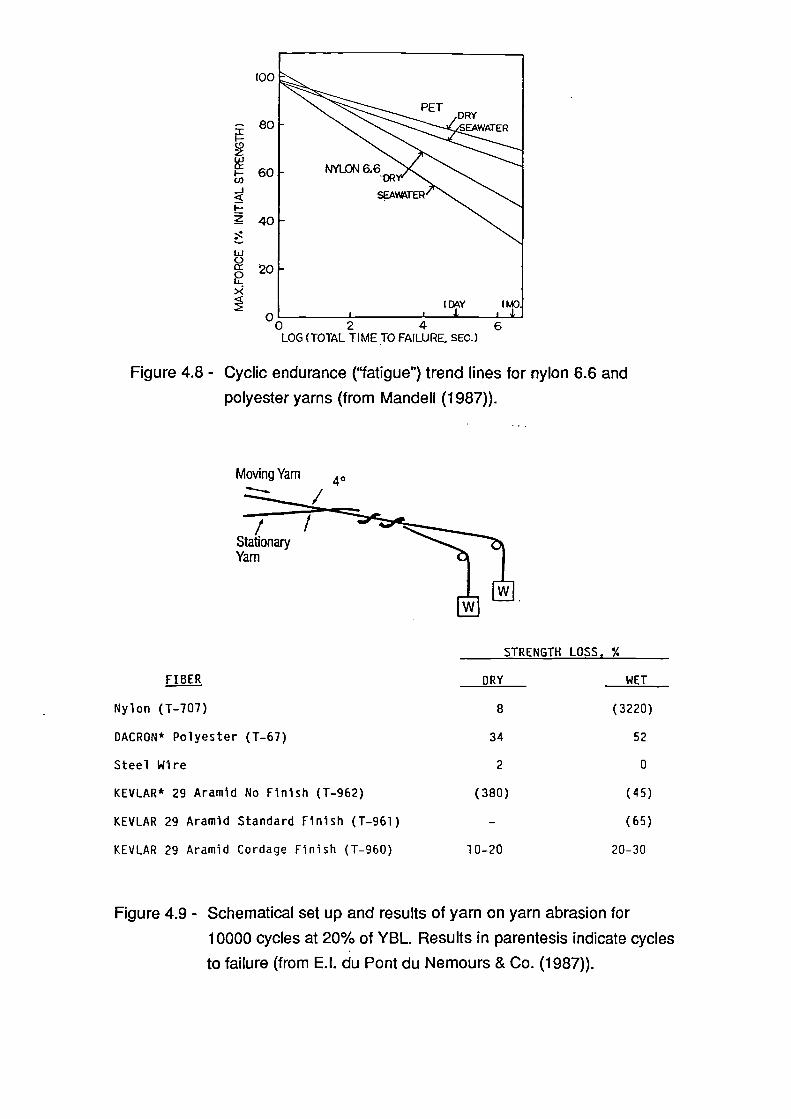
100
80
60
40
20
0o2 4 6LOG (TOTAL TIME TO FAILURE. SEC.)
Figure 4.8 - Cyclic endurance ("fatigue") trend lines for nylon 6.6 and
polyester yarns (from Mandell (1987)).
Moving Yam 0
FIBER
STRENGTH LOSS. %
DRY WET
Nylon (T-707) 8 (3220)
DACRON* Polyester (T-67) 34 52
Steel Wire 2 0
KEVLAR* 29 Aramid No Finish (1-962) (380) (45)
KEVLAR 29 Aramid Standard Finish (1-961) - (65)
KEVLAR 29 Aramid Cordage Finish (1-960) 10-20 20-30
Figure 4.9 - Schematical set up and results of yarn on yarn abrasion for
10000 cycles at 20% of YBL. Results in parentesis indicate cycles
to failure (from E.I. du Pont du Nemours & Co. (1987)).

Figure 4.10 - Arrangement of atoms in the molecule and molecules in the
crystalline structure of polyethylene terephthalate (from Ward
(1990)).

MICRO FIBRILS/
( b )
EXTENDEDNON-CRYSTALLINE
MOLECULES
CRYSTALLITES
DISORDEREDDOMAINS
Figure 4.11 - Structural model of polyester fibres (fibre axis vertical) (from
Prevorsek & Kwon (1976)).
50
Z40z...,--..U1
30Lov)a-J
20
10
0
0.70 0.75 0.80 0.85 0.90
fcv = Vc . fc + ( 1 - Vc ) . fc
Figure 4.12 - Polyester fibre modulus (LASE-5) as a function of overall
structural orientation (from Dortmans (1988)).
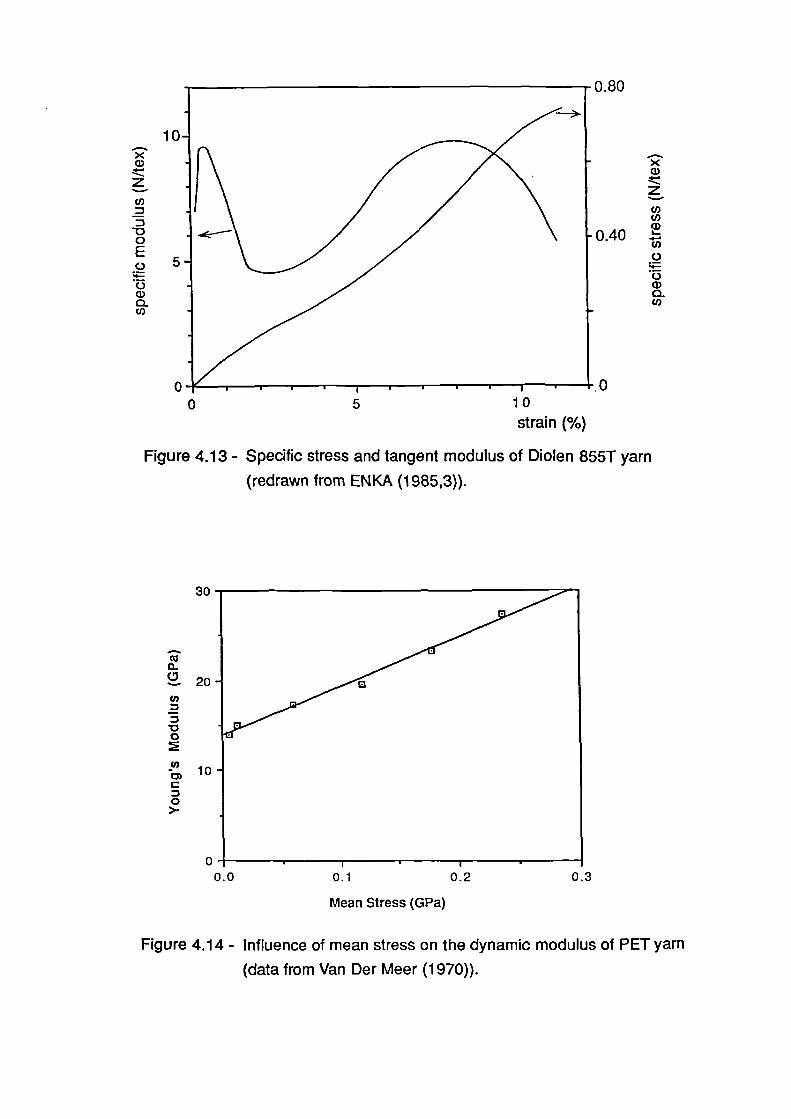
0.80
-0.40
• 05
10strain ('%)
Figure 4.13 Specific stress and tangent modulus of Diolen 855T yarn
(redrawn from ENKA (1985,3)).
30
00
0.1
0.2
0.3
Mean Stress (GPa)
Figure 4.14- Influence of mean stress on the dynamic modulus of PET yarn
(data from Van Der Meer (1970)).

140
120
60
400.001 0.002
extent of deg rationLog (A/(A-x))
0.0040.003
13 95% R.H.
• 75°/0R.H.
Figure 4.15 - Influence of time on the hydrolytic degradation of PET yarn
(data from McMahon et al. (1959)).
o
100
200
300
time (days)
.ctoc
Figure 4.16 - Retained strength of PET yarn at different levels of hydrolytic
degradation (redrawn from McMahon et al. (1959)).

7.5e-5
5.0e-5 -
El PET fibre
• 10-ra PETsheet
D 0.5-rni PETfilm
320
340
360
380temperature (°K)
2.5e-5 -
Figure 4.17 - Influence of temperature on the hydrolysis of polyester fibre and
film (data from McMahon et al. (1959)).
ICI (undated) SL 4.7617e-13 10'(3.4248e-2T) (a)
McMahon (1959) SL 1.2038e-17* 10'(4.4889e-21) (b)
02 5 0 300
350
temperature ( °K )
Figure 4.18 - Degradation of PET yarn in immersion as a function of
• temperature according to ICI (undated) and data from
McMahon et al. (1959).
400

115
Figure 4.19- Resin socket termination.
Figure 4.20 - Cone and plug (barrel and
spike) termination.
packing

ELONGATION
I 10 50
L r L
1-4
ALn
t
Figure 4.21 - Quasi-static load elongation behaviour during initial rope.
cycling (from McKenna (1979)).
Figure 4.22 - Photograph of extensometer mounted on rope sample.

• • \ • NX Xo X XIX
• • • Mandell•••n..
•IC • X A
0
••••
Chaplin & Potts
1 0 1 0 3 1 0 4
Log cycles to failure
1 0 710 10
100
90
:3 80
70
60
50
Es 40
D30
20
10
.10
Figure 4.23 Fatigue data for several constructions of PET fibre ropes tested
wet (data from several authors), and model proposed by
Mandell (1987) to predict rope life. Steel wire rope mean life
curve (Chaplin and Potts (1991)) also shown.

70
60 —
10 —
"o. • ---r9 . ......, . •. .."1 . • .1T1-1-11 • • • •TrT71 •
1 0 2 1 0 3 1 0 4 1 0 5 1 0 6 1 0 7 1 0 8
Cycles to failure
Figure 4.24 - Fatigue data for low twist rope constructions (various test
conditions).
70
60 —
aco 50 —ne
40-0C)Cco• 30-
0o...s 20—
0
CI 101f Parafi Term.1
• 101f Parafil Term2
O 10 tf Parafi Term3
118 tf Superfine0
III 118 11 Superfine run out
— 6 strand wire we
o
10—
0 -• w TT CITY' • • • • • a I .1 v • • "1.9 11 0 2 1 0 3 1 0 4 1 0 5
Cycles to failure
i I 1-1 . -9 •
1 o6
I. II I W.I., 1 II . 11.111111
1 0 7 1 0 8
Figure 4.25 - Fatigue data for low twist PET fibre ropes (various test
conditions).
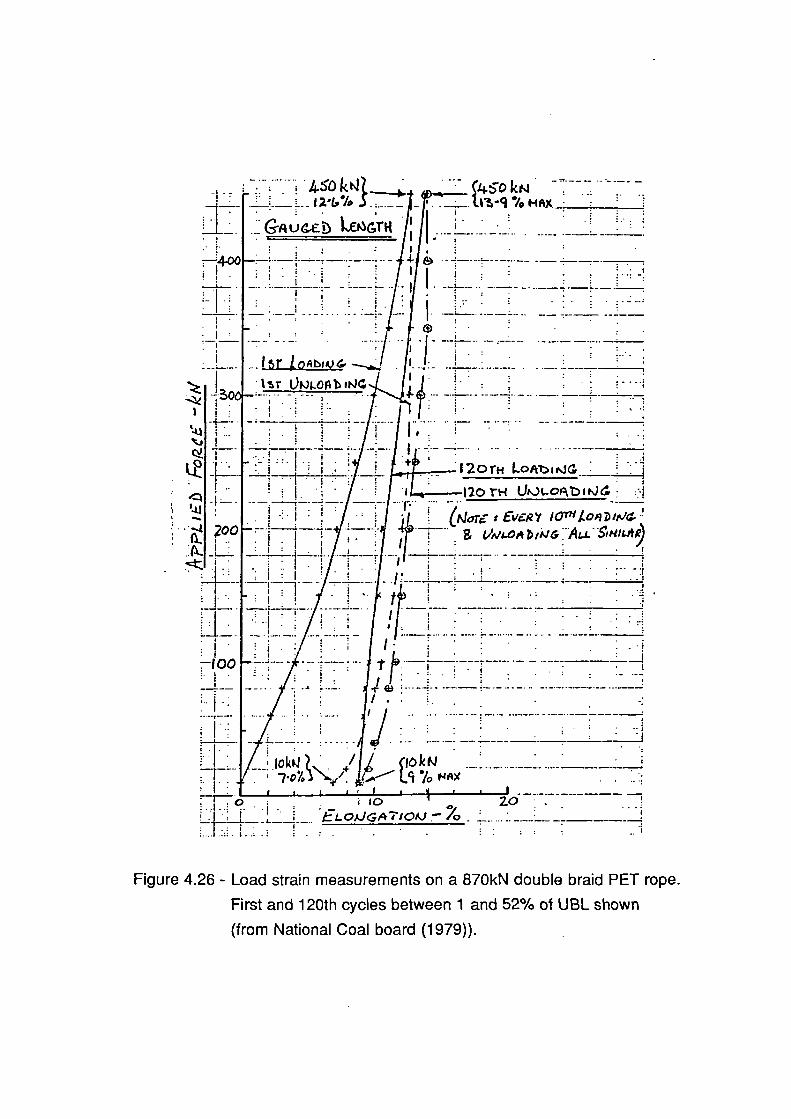
ITH,4-00
i.
• :
•
. i
•
14.50_ 12'1s% 3 1-3•1 HAX
:
OGZ.b kEtJGTH
I ;:
I ;
• : I • ! •
_ .16r I. oADIO
tr ONLOAD
; •-
• i ' i
: I
• ! , . ! . i
I • 1 . l'nfirre : EVERY 10771 404D tpla. 2
n .: 1 : 1
1
— 7- - i—i —1 - : 11 VA 14.0 A b ii 1/416 ...A.1.-.50411.419
' 1 :1 1
-.L I • .1______ . • - 5
. i ... I i
. .. n : . • 1
. , .
• "
, •
I. 11)
I .
i
• i
le :
I . :
+11 (IOW
':;.—
(IOW
TO% Ny .10 FIRXI ID 20 .
;&:—.-.. OXIG47'104.1 70 • •
• 1 • .
. . .
;•
"• •
Figure 4.26 - Load strain measurements on a 870kN double braid PET rope.
First and 120th cycles between 1 and 52% of UBL shown
(from National Coal board (1979)).
Lowt,iNia__ •
120 rt-i Un_n_optbit,jd

5. IDENTIFICATION OF PARAMETERS & TESTING PLAN
5.1 Identification of Parameters
This section summarises the outcome of the background work done
highlighting:
(i) the choice of the most attractive light weight tether systems for
catenary moorings;
(ii) the behaviour of the moored vessel using these systems;
(iii) the typical loadings expected to be seen by the LINTs during the
installation and the operational phases of the system;
(iv) the unknown tether properties when subject to these typical
loadings; and,
(v) the missing or unreliable information concerning the long term
behaviour of the LWTs selected.
Since most of the work mentioned in this section has already been extensively
discussed in previous chapters, only the conflicting references are spelt out.
The background work can be summarised as follows:
Spread mooring systems with lines composed of:
(i) an upper component of steel wire rope or steel chain;
(ii) an intermediate component of fibre rope; and,
(iii) a lower component of steel chain leading to an anchor;
are viable alternatives to wire rope only, or wire rope (upper component) and
chain, for deep water moorings.
Systems based on ropes made of high strength polyester fibres in parallel
yarn, parallel strand or parallel sub-rope constructions can be cheaper than
the all steel alternatives. Not only that, these systems attract much lower loads
at wave frequency and consequently are able to meet the same tensile safety
factor using components of substantially lower breaking strength than the
equivalent wire rope-chain combination mooring.
Systems based in fibres with lower modulus, like nylon and polypropylene, are
not able to meet typical offset requirements (10% of water depth) when sized
87

based on obtaining a safety factor on strength. They would need to be made of
a larger diameter in order to obtain the stiffness necessary and in this way
become economically unattractive and inconvenient to handle.
Systems based on stiffer fibres, such as aramids and HMPE, would be
substantially more expensive than all steel components. They also attract
much higher loads at the wave frequency than the systems based on polyester
fibre. For typical loadings and offset requirements the latter systems are
preferred, however systems requiring extremely tight offset control can
possibly benefit from a stiffer LWT.
The wave frequency line tensions were found to increase as a function of line
stiffness. There is an apparent disagreement, in the literature, on the
quantitative nature of this tension increase. According to Global Maritime
(1989), at typical storm conditions, maximum wave frequency line tensions
tend to be similar to the tensions that would be developed in a straight tether
due to its axial stiffness, the so called "frozen catenary behaviour". Global
Maritime Ltd. (1989,1) warned that "in fact modes of oscillation are not
generally as simple as this suggests". These results were based on
harmonically oscillating the line top in an horizontal movement. Results
obtained by Larsen & Fylling support these observations. Results obtained by
Pollack and Hwang (1982) for harmonically oscillating the line top
simultaneously in horizontal and vertical directions in the plane of the line
showed the same trend to increasing tensions for increasing tether stiffness
but did not mimic the "frozen catenary behaviour". These results are supported
by work performed by GVA (1990).
As a consequence of the increase in line tensions with dynamic stiffness, as
water gets deeper, wave frequency tensions decrease and represent a lower
proportion of maximum line tension. In consequence the error in calculating
the maximum line tension via a quasi-static analysis decreases with water
depth. Polyester rope-chain combination systems, because of their lower wave
frequency tensions than all steel systems, show a lower discrepancy from
tensions calculated by a quasi-static analysis. In 1000 m in North Sea
conditions, differences as low as 1% between the two analysis methods have
been calculated.
88

Material damping, i.e. energy absorbed internally to the mooring line, is
considered low enough in comparison with hydrodynamic damping caused by
drag, to be discarded from most dynamic analyses of all steel systems. If light
weight tethers have substantially higher damping, this approximation may not
hold. Very little information was found on the damping factor of fibre ropes.
Results for polyester ropes were only found for 8 strand plaited ropes at 6 s
period. Although these were not clearly presented it is estimated that these
ropes have a damping factor ca. 3.5 times greater than the peak values for
steel wire ropes. Limited testing on a 10 mm diameter parallel strand polyester
rope indicated damping factors lower than peak wire rope values and almost
one order of magnitude lower than obtained for plaited PET ropes. Reliable
values for the damping factor of PET ropes in low twist construction, are not
available for the range of loading conditions relevant to spread mooring
systems. Also the hysteretic heating of large diameter ropes immersed in sea
water, including its effect on material hydrolysis, have not been addressed.
Very few tensile strength tests have been reported for parallel sub-rope,
parallel strand and parallel yarn ropes. There is disagreement between values
of rope tensile strength reported by manufacturers and independent test
results, concerning these rope constructions. Differences as great as 58%
have been reported! For these constructions information concerning the
diameter of the circle enclosing the rope core and/or the real weight per unit
length of the rope core is very scarce, making it difficult to obtain reliable
tensile strength and specific strength data.
The time dependent load-elongation behaviour of low stretch polyester fibre
ropes in a series of loading conditions pertinent to spread mooring system has
not been characterised. The most important conditions identified were:
(i )
Installation loading - typically represented by a single slow
tensioning to about 50% of MBL followed by 15 to 30 minutes at
this load level to bed the anchor and check that no anchor
movement is taking place. After that the load is lowered to a
working level of say 20% of BL. It is necessary to insure that under
these circumstances the connection with the upper steel
component does not reach the fairlead.
89

(ii) Quasi-static loading variation - typically represented by a slow
change in tension, for example ± 10% of UBL, about the pretension
level (say 20% of UBL). Changes between these limits may occur
with periods of between a few hours and say one week. The
apparent stiffness of the LVVT component in this loading condition
should be used to assess the mean offset.
(iii) Low frequency loading - represented by relatively slow tension
variations, associated with the system natural frequencies of surge,
sway and yaw. In deep water the natural periods will typically vary
between 50 and 200 seconds. The mean tension associated with
these loads can be anything from 10 to 50% of UBL. The limited
investigation performed in the "pilot study" suggests that the
amplitude of these motions is not likely to exceed 10% of UBL.
(iv) Wave frequency loading - typically consisting of small amplitude
tension variations, with periods between 5 and 17 seconds.
Maximum amplitudes should not exceed 15% of UBL for depths of
water larger than 500 m. The mean load for this condition can vary
over the operating range of the mooring lines, i. e. between about
5% and 50% of UBL.
(v) Long term mean environmental loading - represented by a slowly
changing sequence of constant loads, responsible for a creep
behaviour of the LVVT. For a typical pretension of 20% of MBL,
maximum mean line tension in the lines that face the prevailing
environmental direction should not exceed 30% of MBL, otherwise
a change in pretension level or line size would be adopted. This
loading condition can then be simulated by a constant loading, for
example, at 30% of MBL. As in the installation loading, it is
necessary to insure that the connection of the LVVT with the upper
steel component will not foul the fairlead. It is also important to
define the retensioning routine for the mooring lines.
For the ropes selected the limited amount of data available on the number of
cycles to failure in wet "fatigue" tests suggests that for load ranges between 20
and 50% of MBL, the endurance of these ropes is better than the endurance of
six strand steel wire rope. The effect of cycling with a small load range, on the
90

retained rope strength is not known.
Existing data on the long term degradation of polyester ropes or yarns under
the combined effect of moderate constant load and a sea water environment is
very restricted and conflicting (Linear Composites Ltd. (1983) and Bitting
(1980)). Available data on the long term effect of fresh water on polyester
yarns is unreliable for the time scales envisaged (20 years) and also
inconsistent. For example, a 20 years exposure at 20°C according to
McMahon et al (1959) would cause a 2% strength reduction while under the
same conditions ICI (undated) forecasts a strength loss of 37.6%.
The following section outlines the experimental programme set out to
investigate the lacuna highlighted.
5.2 Material Testing Programme
Three rope constructions were found from the preliminary investigations to
lead to mooring systems cheaper than all steel systems:
(i) a Parafil parallel yarn rope;
(ii) a Superline parallel sub-rope construction, made up of pairs of
three strand sub-ropes enclosed in a braided jacket; and,
(iii) a Brascorda Parallel, parallel strand construction, with twisted
strands running in parallel inside a braided cover.
Of these, the two latter were selected for testing. It was considered that the
parallel yarn rope, having no twist or braiding in its construction, could have
most of its properties assessed from tests on yarn and the filling factor reported
by the manufacturer.
Testing was carried out on two scales: industrial yarn and small diameter rope.
In choosing rope size the main constraints were:
(i) to have a strength low enough to make long term constant load
tests feasible; and,
(ii) to have a construction that would display most of the characteristics
of a full size rope.
Ropes with approximately 60 kN breaking load were selected. This size of
91

rope has ca. 250 yarns and 180,000 continuous filaments, and is therefore
able to represent the scatter in tensile properties to be found in a full size
mooring rope.
Unlike steel wire ropes, scaling up fibre ropes can not be done by increasing
fibre diameter. Since packing a large number of filaments in a single twisted
yarn has obvious handling problems, additional twisting operations may be
introduced in the rope structure in the process of scaling up. To account for
that, the ropes tested were not normal production items but model ropes.
Full size mooring ropes of the Superline construction typically have four
twisting operations, one more than the model rope. To compensate for that,
twist (turns per unit length) in the structure of the model rope was increased
accordingly (Street (1989)).
The Brascorda rope has only one twist operation in any scale. Packing a
larger number of yarns per strand increases its diameter and in consequence
decreases the modulus if the same twist is used (Hearle et al. (1969). To
compensate for the larger number of yarns per strand on the full size rope, the
strand twist in the model rope was made slightly greater than in a large
diameter rope.
Scaling down the cover of a rope is quite difficult. On the Superline model
rope, for example, the core represents 38% of the total rope weight and about
17% of its strength, while on a 5000 kN Superline, a braided cover would only
account for something like 13% of the rope weight and 6% of its strength. For
the Brascorda Parallel the difference in strength is even bigger because the
core is proportionately stiffer than the cover. To overcame this inconvenience, it
was decided to test both ropes without their covers.
For the purpose of description, the tests performed were grouped according to
the predominant loading mode or degradation agent under the following
headings:
(i) tensile testing;
(ii) stiffness testing;
(iii) creep and environmental assisted degradation; and,
(iv) cyclic endurance ("fatigue").
92

This headings are carried forward to the next three chapters, were the testing
performed is fully described, the results presented and discussed.
5.2.1 Strength Testing
Since the background work indicated that dynamic loads were not likely to
cause significant degradation of the ropes selected for this application, but
long term creep and environmental assisted degradation were cause for some
concern, relatively simple tension tests, used to determine retained strength,
performed a key function in the testing programme.
After proper gripping methods were developed, yarns as the basic component
of all ropes, had their strength characterised. Residual strength after different
treatments was compared with this data base. The yarn load elongation
behaviour was checked against manufacturers and literature data and gave
the first insight on the material. Models are presently being developed to
predict the tensile properties of parallel yarn ropes based on yarn data
(Burgoyne & Flory (1990)).
Tensile tests were applied to terminated ropes to characterise their initial
tensile strength, specific strength and later to assess their retained strength. To
account for the application in view, a testing sequence was developed to
simulate rope installation and initial loading as in a mooring system (the
procedure is detailed in Section 6.1.2). Elongation during the installation
simulation incorporates bedding in of the rope construction and material
creep. The installation stiffness was defined as the secant modulus measured
at the maximum overall elongation obtained during this process.
5.2.2 Stiffness Testing
Tether axial stiffness was found to dominate wave frequency tensions.
However mean offset is controlled by load elongation properties over a much
longer time scale. Owing to the reported non-linear viscoelastic behaviour of
PET fibres and to the complex structural mechanics of fibre assemblies a
thorough investigation of the behaviour of the elongation behaviour of yarn
93

and model ropes was performed.
Yarn was cycled over the range of wave and low frequencies in all tensile
loading regimes considered possible in this application, to obtain data
pertinent to parallel lay ropes and to allow future modelling of other
constructions.
Model ropes were similarly cycled at wave and low frequencies and also in a
simulated quasi-static cycle. The influence of long term cycling between fixed
load limits, and long term constant loads, on wave frequency stiffness was also
measured.
A limited number of tests were performed to evaluate the hysteretic energy
absorbed by the more compliant model rope, the Superline, at wave
frequency. The hysteresis of a small diameter steel wire rope was also
measured for comparison purposes.
5.2.3 Creep and Environmentally Assisted Degradation
Elongation under constant load was measured for model ropes and yarns at
load levels slightly higher than typical average tensions in a spread mooring
systems.
Yarn elongation results are important as a lower bound to the behaviour to be
found in ropes, but also directly relevant to parallel yarn ropes, as long as fibre
slack is not significant compared to total elongations measured (see Chapter
8).
Strength degradation was measured in yarns that had been under constant
load in laboratory conditions (no temperature or humidity control).
The effect of a range of temperatures (4 to 40°C), load durations (1 to 12
months) and load levels (20 to 40% of UBL) on the retained strength of yarn in
deionised and synthetic sea water was investigated in an attempt to sort out
discrepancies in the literature, and to provide design in support of the long
term use of PET fibre ropes.
Samples of the model ropes were also subjected to the simultaneous effects of
94

constant tension and a sea water environment for up to one year. The retained
strength of these samples was measured to investigate degradation of both
rope material and termination. Elongations measured relate directly to what is
expected in the real application. These results can be used to establish
operational retensioning procedures and, in combination with the elongation
measured in the installation procedure, to set the lower limit for the length of
the upper component.
5.2.4 "Fatigue"
The literature reviewed clearly demonstrates that the predominant failure
mode changes with loading condition. Currently available data is concentrated
at high to medium load ranges, while the outcome of the pilot study shows that
very small load ranges of any significant number of cycles can be expected.
Therefore it is clear that there is no point in performing tests at higher loading
regimes.
Testing was therefore targeted at gaining an insight into any possible failure
modes operating under the mild conditions foreseen in the application, and
obtaining an assurance that the cyclic endurance of these ropes was
satisfactory.
The procedure adopted to run wet "fatigue" tests on the model ropes to 1
million cycles with a load range slightly greater than calculated by Global
Maritime Ltd. (1989,1) as the maximum wave frequency tension range in the
worst design condition (100 years storm in the West of Shetlands in 500 m
water depth). After cycling, the ropes were inspected and their retained
strength measured.
95

6. MATERIAL PROPERTIES: TEST METHODS
6.1 Strength Testing
6.1.1 Yarn
The yarn tested was a high tenacity multi-filament polyester yarn with the
following nominal characteristics (AKZO (undated)):
Manufacturer - AKZO (Holland);
Type - Diolen 855TN;
Average molecular weight - 17000 (Tabor & Wagenmakers (1991));
Number of filaments - 210;
Twist - 0 , yam tangled discontinuously by hot air jet;
Linear weight - 1100 dtex (g/1000 m);
Breaking force - 92 N;
Tenacity (specific stress) - 84 mN/dtex;
Elongation at break - 12.5%;
Finish - marine rope finish;
The yarn is not normally supplied as an individual industrial yarn, but twisted
according to the rope maker's specification. The yarn tested was removed
from a twisted yarn supplied to Marlow Ropes from which the Superline model
rope described in Section 6.1.2 was made. All 20 individual yarns from this
twisted yarn were tensile tested and the one with the highest average
breaking load was selected.
The tests performed to select the yarn for further testing (from the twisted yarn
with 20 single yarns) were conducted dry in a laboratory without thermostatic
or humidity control. Sample length was 250 mm, with a loading rate of
400 mm/minute. Air operated, flat jaws, with rubber linings were used. The
yarns were tested without twist, and results from samples showing filament
breaks inside the jaws were not taken into account.
At the start of the testing programme a number of tensile tests were performed
on yarn Diolen 855T, without marine finish, also used in rope making. The
yarn was supplied by Marlow Ropes from their normal stock. Because it did
96

not have to be separated from other yarn, it was more convenient for testing
than the yarn with the marine finish. These tests were used to investigate the
influence of: gauge length, testing speed and gripping methods. A small
number of tests was run to compare the tensile strength of Diolen 855T with
the strength of Diolen 855TN. Since environmental assisted degradation was
one of the items being investigated the bulk of the testing programme
concentrated on yarn with marine finish.
A limited number of tests was performed on yarn disassembled from the other
model rope tested, a Brascorda Parallel rope (this rope is described in
Section 6.1.2.). This yarn is manufactured in Brazil by COBAFI S.A. and its
characteristics (COBAFI (undated)) are identical to those of the AKZO yarn
except for:
Breaking force - 90 N;
Elongation at break - 13%; and,
Finish - spinning finish only.
To facilitate long term experiments to evaluate the combined effect of constant
loads and a sea water environment, a termination system was devised to
allow direct transfer of samples from the long term loading facilities, into the
testing machine used to evaluate their retained breaking strength, without
need for re-termination.
Figure 6.1 shows a photograph of the termination used. Samples consisted of
pieces of yarn approximately 200 mm long in which each extreme was glued
between two thin tabs of acrylic sheet, leaving a free length of 100 mm. A
room temperature curing epoxy resin was used for this purpose. In order to
distribute stresses more evenly over the filaments as they go into the
termination, the region between the tabs closest to the gauge length
(approximately 10 mm), was filled with a nitrile rubber compound instead of
the epoxy glue.
Samples were prepared 8 at a time using a purpose built jig. Figure 6.2 shows
a photograph of this jig after manufacturing a batch of samples, with one
sample still to be removed from the jig. A template, used to position the acrylic
tabs precisely, is also shown by the side of the jig. The procedure for making
97

the samples was as follows:
position lower acrylic pieces on the jig base, using the template;
position upper acrylic pieces on closing strips, using the same
template;
lay a length of yam straight and centred over the gauge length and
the lower acrylic pieces, fixing the yarn ends to the base with
adhesive tape;
apply epoxy glue and nitrile rubber compound on lower tabs;
close the jig by positioning the strips over the lower tabs;
apply weight to squeeze excess glue; and,
cure for approximately 8 hours at 50°C.
Testing of this samples was performed in an lnstron model 1026 screw type
bench top universal testing machine, with a 500 N load cell. Speed was set at
100 mm/minute and air operated rubber lined flat grips, set 120 mm apart,
were used. Samples were tested wet after immersion in deionised water for
15 minutes.
This termination method gave very consistent performance. Typically,
filaments would break in the free portion of yarn with less than 5% of them
breaking within the rubber filled region. The results for the few samples
showing filament breaks in the region glued with epoxy resin or at the rubber-
epoxy interface have not been included in the analysis.
6.1.2 Ropes
Two model ropes were tested, both manufactured from high tenacity multi-
filament polyester yarns, as described below.
ROPE 1.
Manufacturer - Marlow Ropes, UK;
type - polyester Superline;
construction - fourteen 3-strand ropes enclosed in a braided jacket;
sub-rope construction - 50 turns per metre, 7 z-laid and 7 s-laid;
strand construction - 20 x 1100 dtex Diolen 855TN, 40 turns per
98

metre, s-laid in z-laid sub-ropes and z-laid in
s-laid sub-ropes;
cover - 16 plait polyester cover;
diameter with jacket -14.75 mm (average measured);
diameter without jacket -11.5 mm (average measured);
linear mass - 0.160 kg/m = 160000 tex (average measured);
linear mass of core - 0.0995 kg/m = 99500 tex (average measured).
ROPE 2.
Manufacturer - Brascorda S.A., Brazil;
type - Brascorda parallel;
construction - 34 strands (half z laid and half s laid) in parallel
enclosed in a braided jacket;
strand construction -27 x 1100 dtex PET 855T (from COBAFI), 25 turns
per metre;
cover - 16 plait multi-filament polypropylene cover;
diameter with jacket -18.1 mm (average measured);
diameter without jacket -11.5 mm (average measured);
linear mass - 0.198 kg/m = 198000 tex (average measured);
linear mass of core - 0.107 kg/m = 107000 tex (average measured).
As already discussed in Section 5.2, the cover of these ropes does not have
the same geometrical proportions or the carry the same proportion of the load
as large diameter ropes of the same constructions. Therefore the model ropes
were tested without their covers.
The constructions tested are quite stiff and the working length available in the
tensile testing machine was limited to 1260 mm between the load cell and the
piston attachment plate. Therefore, obtaining an equal distribution of load
between sub-ropes and strands in the terminated samples, was very important
to realise the rope potential strength. The limitation in length also ruled out the
use of splices, which would reduce the free rope length too much.
It was decided to make use of resin cast socket terminations. Trials were run
with different cone angles, cone lengths and resin composition ( formulation,
amount of filler and catalyst ).
99

Best results were obtained for the socket which cross section is shown in
Figure 6.3. This has a 145 mm long, 4.5° semi angle conical region and a
55 mm long 22.5 mm diameter cylindrical region.
The resin selected was an unsaturated polyester resin in styrene monomer
with 27% of filler based on calcium carbonate and 1.13 cm 3 of catalyst (methyl
ethyl ketone peroxide at 50% in phlegmatizer) per 100 g of resin.
Casting procedures normally used for fibre ropes mimic those used for wire
rope (BS 7035 (1989) and Philadelphia Resins Co. (1982)). The main
concern in using a wire rope procedure for a fibre rope is ensuring a uniform
distribution of the fibres inside the socket. Wire ropes are served and then
have the wires splayed to form a broom. When the broom is pulled back into
the socket and during resin pouring, there is no significant change in the
broom shape. That is not the case with fibre ropes, where the filaments do not
have enough stiffness to stay in position. If the socket is being cast in the
vertical position, as is usual, fibres will be washed down and accumulate in
the socket neck and against the wall. It is not a surprise that such terminations
do not provide good efficiency, and so are not normally selected for polyester
ropes.
To overcome this problem the positioning and tensioning frame shown in
Figure 6.4 was designed to be used with the selected socket. Rope
terminations were cast in the vertical position following the procedure
described below:
(i) cut a 2.5 m long piece of rope;
(ii) serve with yarn over the jacket at approximately 600 mm from one
end;
(iii) remove jacket from the serving to the nearer end;
(iv) pass the rope through the socket, taking the serving 80 mm into
the socket;
(v) install centraliser and seal the bottom of the socket with plasticine;
(vi) distribute the individual strands evenly using the top frame and
apply a uniform tension to them by means of dead weights;
(vii) pour the resin from the top and leave to cure;
(viii) remove frame and cut excess fibre flush with resin top.
100

The other socket is cast using the same procedure leaving a free sample
length of 700 ± 20 mm. After that the jacket is cut and removed from the free
rope length except for 50 mm adjacent to each termination.
Basically the same termination procedure and dimensions were used for the
stiffness, creep and fatigue tests.
A two column Dartec servo-hydraulic testing machine was used for the
strength measurements. A 250 kN strain gauge based load cell was used for
load measurement. Actuator stroke was measured by a linear variable
displacement transformer (LVDT) mounted concentrically to the actuator
piston. The extensometer described in Section 4.6.4 was used to measure
rope strain.
The test procedure for strength determination was designed with two
purposes in mind:
(i) to find out how much the rope sample would stretch under a
loading typical of an installation procedure at sea; and,
(ii) to determine the strength of a rope some hours after being installed
on a mooring leg.
Testing procedure was as follows:
(i) install rope in the test frame with the piston fully extended;
(ii) apply pre-load of 180N (ISO (1972);
(iii) measure distance between sockets and mark a gauge length on
the rope;
(iv) installation cycle - load sample to 50% of the expected breaking
load at a rate of 0.1 kN/s, hold for 30 minutes, reduce load to 10%
of the breaking load at the same rate and hold for another 30
minutes.
(v) working procedure - apply 100 cycles between 5 and 30% of the
expected breaking load at 0.1 Hz;
(vi) without touching the sample, reduce load to zero, change feedback
mode to stroke and load to failure at a stroke rate of 0.7 mm/s.
101

6.2 Stiffness and Hysteresis
6.2.1 Yarn
The same yarn,AKZO's Diolen 855 TN, described in Section 6.1.1 was tested
to determine its stiffness and hysteresis.
The termination consisted of gluing each side of a piece of yarn between two
pieces of acrylic sheet. A room temperature curing epoxy resin was used for
this purpose.
The procedure for making the samples was similar to that used on the
samples intended for strength testing but without the use of the nitrile rubber
compound. Free sample length between tabs was 370 mm.
The samples were tested in an Instron model 4302, microprocessor
controlled, screw type, bench top, universal testing machine. Simple clamp
type grips were made as shown in Figure 6.5 to minimise the influence of
machine stiffness.
Extension was measured in two ways:
(i) by means of the built-in encoder on the test machine; and,
(ii) by an extensometer (see Section 4.6.4) attached to the yarn.
The readout from the machine was only used for mean loads of 5% and 10%
of the yarn reference breaking load (YBL, see Section 7.1.1), since, at such
low loads, the weight of the extensometer attached to the yarn would have
influenced the measurements. For higher mean loads the extensometer was
used.
In order to be able to compare results with the rope data the test procedure it
was necessary to mimic the procedure adopted for the rope samples. First the
yarn was submitted to an equivalent 'installation' cycle ( taken to 50% of YBL
kept for 30 minutes, unloaded to 5% of YBL, left for 30 minutes).
The machine was then operated between load limits and cycled at constant
crosshead speed. The following mean loads and load ranges, shown as
percentages of YBL, were assessed in sequence:
102

5 ± 2.5;
10 ± 2.5, 10 ± 5;
15± 2.5, 15± 5;
20±2.5, 20±5, 20±10;
30 ± 2.5, 30±5, 30 ± 10;
40 ± 2.5, 40±5, 40±10;
50 ± 2.5, 50 ± 5, 50 ± 10; and,
a repeat at 20 ± 2.5 and 20± 10.
For each loading, periods of 7.5, 15, 100 and 200 seconds were tested in
sequence. The number of cycles in each condition varied with the period and
was equal to 100, 50, 10 and 5 cycles, respectively, for the above mentioned
periods. For each condition, measurements were taken at the last cycles.
6.2.2 Ropes
6.2.2.1 Stiffness
The stiffness of both ropes described above was evaluated under four
conditions:
(i) after a simulated installation and recovery at low load;
(ii) in a simulated quasi-static loading;
(iii) after "fatigue" testing; and,
(iv) after creep testing.
Samples similar to those use for strength measurements were used. For the
same reasons described in the previous section both ropes were tested
without their covers.
The same terminations were also used.
The same servo-hydraulic testing machine, 250 kN load cell and LVDT were
used. Extension was measured by an extensometer attached to the rope
sample through its knife edged arms pulled against the rope by rubber bands
(Figure 4.22).
Stiffness measurements relating to samples in the simulated quasi-static cycle
103
and after "fatigue" in water, were made using the stroke signal from the built-in
LVDT. These had to be corrected to take into account rope movement inside
the socket. This was achieved by cross plotting stroke versus strain for the
same loading in the dry condition.
The test procedure for the measurements taken in the as installed condition
samples was preceded by an "installation cycle" (taken to 50% of UBL kept
for 30 minutes, unloaded to 5% of UBL, maintained for 30 minutes).
The machine was then operated in load control following a sine wave. The
following mean loads and load ranges, shown as percentages of UBL, were
assessed in sequence:
5± 2.5;
10 ± 2.5, 10± 5;
15
20
30
± 2.5,
± 2.5,
± 2.5,
15
20
30
± 5;
± 5,
± 5,
20
30
± 10,
± 10, 30 ± 15;
40
50
± 2.5,
± 2.5,
40
50
± 5,
± 5,
40± 10,
50 ± 10,
40
50
± 15;
± 15; and,
a repeat at 20 ± 10.
For each loading, periods of 7.5, 15, 100 and 200 seconds were tested in
sequence and the number of cycles at each of these periods was 100, 50, 10
and 5, respectively. The measurements were taken at the last cycles for each
condition.
Before the simulated quasi-static loading an "installation cycle" as described
above and a bedding in loading between 10% and 30% of BL for 1000 cycles
were undertaken. The simulated quasi-static loading started at a load level of
20% of UBL and consisted of:
(i) a 3 hours ramp up to 30% of UBL;
(ii) a 72 hours period at constant load;
(iii) a 6 hours ramp down to 10% of UBL;
(iv) another 72 hours at constant load; and,
(v) a 3 hours ramp up to 20% of UBL.
104

For the samples assessed after "fatigue" testing, stiffness was measured
immediately after fatigue cycling, with the ropes immersed in water. Mean and
load ranges, as percentages of UBL, were: 20 ± 10, 20 ± 5, 20 ± 2.5, 10 ± 5
and 10 ± 2.5, for both rope types. The Brascorda Parallel rope was
additionally evaluated at 5 ± 2.5, 30 ± 12.5, 30 ± 10 and 30 ± 5% of UBL At
20 ±10% of UBL samples were tested at 0.2 and 0.067 Hz (periods of 5 and
15 seconds). At the other loading regimes measurements were all made at
0.2 Hz. The number of cycles at each condition was 100 for the tests at 0.2 Hz
and 50 for those performed at 0.067 Hz.
Samples evaluated after creep, were transferred from the creep rigs (as
described below) to the servo-hydraulic testing machine, loaded to 30% of
UBL, for approximately 30 minutes and cycled at 20 ± 10% of UBL for 100
cycles at a frequency of 0.2 Hz. Measurements were then taken between
these same load limits (20 ± 10%), at 0.2 Hz and 0.067 Hz (5 and 15 seconds
periods).
6.2.2.2 Hysteresis
Measurements were performed on:
(i) a sample of the parallel sub-rope Superline similar to that used in
the stiffness testing; and,
(ii) a 700 mm long sample of a 13 mm diameter 6x19(12/6+6F/1) +
IWRC 7x7(6/1) right hand ordinary lay steel wire rope.
Testing was executed on the 250 kN Dartec servo-hydraulic testing machine.
In the fibre rope test simultaneous readings were taken of: load range,
obtained from the 250 kN load cell, cyclic stroke, measured with the built-in
LVDT of the testing machine, and elongation range, measured over a gauge
length of 90 mm with the extensometer already described.
The steel wire rope sample was assembled in the test frame via a very
compliant arrangement and so stroke measurements were meaningless for
hysteresis purposes. In this case only load and strain measurements were
taken simultaneously.
105

Data corresponding to a single cycle was gathered by the computer that
controls the testing machine, using software developed by the manufacturer.
In each cycle a minimum of 1300 data points (load, stroke, and strain, or load
and strain only) was used.
The area (AU) within the load (y) versus elongation (x) and the load (y) versus
stroke (x) loop was calculated by a separate specially written programme that
scans the data points once in sequence and calculates:
AU = Ei ((x44 . y) - (xi . y io)) /2.
The reference input energy (U) was calculated as:
U = ( (xt-rac xnt) • (Yaw Yrril)) / 8;
where (X rroc , ym3x) and (xni, , yriiI ) are the extremes of the loop.
The fibre rope was conditioned for approximately 1 hour at 20% of the UBL
and then cycled between 10% and 30% of the UBL at 0.1333 Hz. Hysteresis
was measured after: 100, 300 and 1000 cycles.
For the wire rope sample, the data was collected at the beginning of a
bending-tension fatigue test (Ridge (1992)). The rope was kept at 34% of its
UBL for ca. 5 minutes and then cycled at 20 ±14% of its UBL at 0.25 Hz.
Measurements were taken after approximately 100 cycles.
6.3 Creep and Environmentally Assisted Degradation
6.3.1 Yarn
As already explained, the yarn tested was a single yarn removed from a
twisted AKZO yarn, Diolen 855TN. Yarns were terminated using the procedure
described on the section 6.1.1. In this case an additional 5 mm hole was
drilled through each termination, on its longitudinal axis, 10 mm away from the
edge opposite to the gauge length. The samples were hung and loaded
through these holes.
106

6.3.1.1 Creep
Since the only available creep data for the yarn tested was limited to periods
of 2 * 105 seconds(ENKA (1985,3), it was decided to run 'a small number of
tests to evaluate its behaviour up to 7.776 * 10 8 seconds (3 months). For this
purpose two types of tests were run: (i) one week, and (ii) 3 months long.
One week tests were run on the same testing machine used for yarn stiffness
testing, with the same grips and on samples of the same length (370 mm).
The testing procedure was as follows:
(i) install sample in the testing machine;
(ii) apply a pre-load of 0.5 N (ASTM (1985, ref. 58) and measure the
distance between tabs;
(iii) increase load up to 30% of YBL at a constant crosshead speed of
100% of the gauge length per minute ( typical loading time is 2
seconds ); and,
(iv) cycle between loads limits of 30% of YBL ± 0.023% ( ± 0.02 N),
with a variable crosshead speed (starting at 50 mm/minute but
quickly collapsing to 0.05 mm/minute).
Elongation was measured in two ways: by direct stroke reading on the
machine panel (encoder connected to the screw drive) and by a comparator
dial gauge installed between the crosshead and the columns. The resolution
on the panel reading was 0.01 mm and on the clock reading was
0.00254 mm.
A single three months test was done on a 1050 mm long sample. Terminations
were again acrylic tabs glued with epoxy resin. The sample was loaded with a
dead weight of 30% of YBL. A 897.5 mm gauge length was marked on the
sample with a fine black thread. The initial gauge length was measured at a
load of 0.5 N. The elongation was measured with a stainless steel rule with a
resolution of 0.5 mm.
In addition to these tests an insight on the creep rates up to one year was
obtained by measuring the distance between tabs in the yarn samples hung in
air for environmental degradation assessment. This was done with a vernier
107
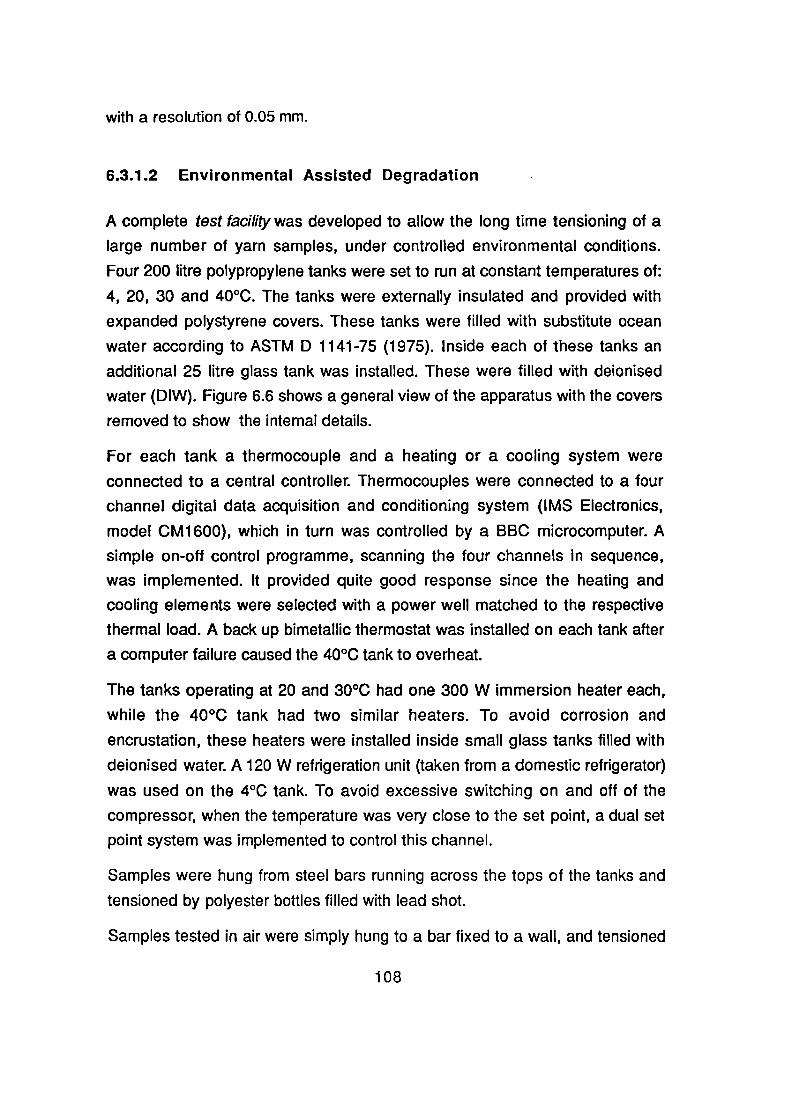
with a resolution of 0.05 mm.
6.3.1.2 Environmental Assisted Degradation
A complete test facility was developed to allow the long time tensioning of a
large number of yarn samples, under controlled environmental conditions.
Four 200 litre polypropylene tanks were set to run at constant temperatures of:
4, 20, 30 and 40°C. The tanks were externally insulated and provided with
expanded polystyrene covers. These tanks were filled with substitute ocean
water according to ASTM D 1141-75 (1975). Inside each of these tanks an
additional 25 litre glass tank was installed. These were filled with deionised
water (DIW). Figure 6.6 shows a general view of the apparatus with the covers
removed to show the internal details.
For each tank a thermocouple and a heating or a cooling system were
connected to a central controller. Thermocouples were connected to a four
channel digital data acquisition and conditioning system (IMS Electronics,
model CM1600), which in turn was controlled by a BBC microcomputer. A
simple on-off control programme, scanning the four channels in sequence,
was implemented. It provided quite good response since the heating and
cooling elements were selected with a power well matched to the respective
thermal load. A back up bimetallic thermostat was installed on each tank after
a computer failure caused the 40°C tank to overheat.
The tanks operating at 20 and 30°C had one 300 W immersion heater each,
while the 40°C tank had two similar heaters. To avoid corrosion and
encrustation, these heaters were installed inside small glass tanks filled with
deionised water. A 120 W refrigeration unit (taken from a domestic refrigerator)
was used on the 4°C tank. To avoid excessive switching on and off of the
compressor, when the temperature was very close to the set point, a dual set
point system was implemented to control this channel.
Samples were hung from steel bars running across the tops of the tanks and
tensioned by polyester bottles filled with lead shot.
Samples tested in air were simply hung to a bar fixed to a wall, and tensioned
108

by similar weights. Temperature in the basement room where these samples
were tested varied between extremes of 16°C and 24°C over the full 12 month
duration of the tests.
At the end of the exposure, samples were unloaded, soaked in deionised
water for at least 15 minutes and tensile tested to assess their retained
strength. This was done in the same Instron test machine and with the same
procedure as described in Section 6.1.1. Results from samples showing
filament breaks in the region glued with epoxy resin or at the rubber-epoxy
interface have not been included in the analysis.
It was found that some of the yarns samples that had been in artificial sea
water at 20°C and 30°C had developed quite hard fine scale deposits. These
samples had to be left in a 0.1N solution of hydrochloric acid for 2 hours to
dissolve the deposits. This procedure was considered necessary to minimise
the mechanical interaction between the deposits and the yarn filaments. A
batch of tests verified that the immersion for 2 hours in the washing solution
was harmless to the yarn.
6.3.2 Ropes
Both Superline an Brascorda model ropes, described in Section 6.1.2, were
evaluated for their long term elongation and retained strength in substitute sea
water (ASTM D 1141-75 (1975)). Elongation and environmentally assisted
degradation were investigated using the same samples. In order to make this
evaluation in sea water, priority was given to the assessment of
environmentally assisted degradation over precise elongation measurements.
Rope terminations were painted with a marine epoxy paint and were provided
with zinc anodes. A polyethylene bag was installed between the terminations
and filled with substitute sea water.
The minimum number of tests, the loads and the time scales involved,
precluded the use of dead weights or a sophisticated tensile testing machine.
A design was therefore developed to build 4 low cost constant tensioning
machines with a capacity of 18 kN.
109

Two machines were used for testing one sample of each rope for one year.
The two remaining machines were used in sequence for tests running for: 1, 3
and 6 months.
The machine developed is shown in Figure 6.7. The rope sample is attached
between the lower frame and the upper arm by means of articulated holders.
A constant force pneumatic actuator (Firestone model 1T15M-6), fitted
between the frame and the arm, provides the loading. Each actuator was fed
from the building compressed air supply by a two stage precision regulator
(SMC Pneumatics model IR200-02). Between the actuator pedestal and the
upper arm four long screws can be used to either cope with unexpected
sample elongations or to install a load cell to check the actuator force.
Two methods were used to adjust the set point of the pressure regulators:
(i) a compression load cell, giving an indirect reading of rope tension
via actuator force; and,
(ii) a tension load cell mounted in place of the rope sample.
The compression load cell had to be short in order not to increase the size
and affect the design of the the machine, and it also had to provide bending
stiffness to avoid instability of the actuator. Since a commercial cell could not
be found a slotted hollow cylindrical load cell, based on beam shear was
design and used interchangeably on all machines. Figure 6.8 shows a
schematic drawing of the compression load cell.
Due to the imprecision resulting from these indirect measurements, a tension
load cell (Maywood Instruments Ltd. model 8402) was installed in the place of
the rope sample, for a finer adjustment of the pressure regulators before the 6
months tests.
The main advantages of the testing machines used are:
(i) possibility to transfer the sample directly to the servo-hydraulic test
machine, without need to re-terminate;
(ii) compactness;
(iii) low cost ( approximately £600.00 on material ); and,
(iv) simplicity and robustness.
110

The main drawbacks are:
(i) when operated with a plastic water jacket it is difficult to get
elongation measurements over a gauge length free from the
terminations;
(ii) over a range of sample lengths of 550 to 850 mm, at constant
pressure, a load variation of 86 N ( 0.5% ) was measured;
(iii) the machine relies on a very small but constant supply of
compressed air;
Extension was measured in two ways:
(i) with a steel rule (0.5 mm resolution) on a gauge length of typically
600 mm length, marked with a pen on the sample; and,
(ii) by measuring the distance between the socket holders with the
same steel rule.
Measurements on the gauge length were only possible at the start and at the
end of each test. These measurements were used to calculate an equivalent
gauge length to be used with the elongation readings taken on the socket
holders.
After the constant loading period, samples were taken to the servo-hydraulic
test machine to determine their retained strength.
Testing procedure was as follows:
(i) install sample on creep testing machine;
(ii) mark gauge length with pen;
(iii) measure distance between socket holders (D1);
(iv) measure initial position of resin cones (CI);
(v) with the regulator already adjusted, load sample by opening air
supply to the actuator (approximate loading time = 2 minutes);
(vi) measure simultaneously free gauge length, distance between
socket holders (D 2), and position of resin cones (C2);
(vii) calculate corrected distance between holders (Do) as:
D0 = D 1 + ( C2- C1);
(viii) calculate effective gauge length (EGL) to be used with distance
between holders as:
111

EGL= ( D2 - Do ) / e
where e is the strain measured on the free gauge length;
(ix) fill plastic bag with substitute sea water;
(x) measure elongation regularly (at approximately equal log time
intervals) until the end of constant load period;
(xi) drain water and remove plastic jacket;
(xii) simultaneously measure free gauge length and distance between
socket holders (D3);
(xiii) recalculate effective Gauge length as:
EGL= ( D3 - Do ) /e;
(xiv) unload sample and transfer it to the servo-hydraulic testing
machine;
(xv) make stiffness measurements as described in Section 6.2.2.1;
and,
(xvi) load to failure at a speed of 0.7 mm/s.
6.4 "Fatigue"
Long term cyclic behaviour of the model ropes was evaluated by loading three
samples of each model rope between 20 ± 10% of UBL in flowing tap water
for 1 million cycles.
After cycling, stiffness was evaluated under the loading conditions described
in section 6.2.2.1.
Residual strength measurements were performed for two samples of each
rope construction. Instead of subjecting to strength testing the remaining
samples were examined in detail, some yarns and filaments being removed
for microscopic examination.
Test samples were of the same length and with identical terminations as in the
other rope tests (see Section 6.1.2).
All testing was undertaken on the Dartec servo-hydraulic testing machine
already described. Elongation was measured from the stroke reading from the
112

actuator mounted LVDT.
The lower termination was fitted with an external grooved ring. An
environmental chamber, sealing on the grove by means of an 0-ring and open
at the top was used for the testing with the sample immersed. Tap water was
fed to the chamber just above the 0-ring and run off from above the upper end
of the rope free length. A fairly small water flow was used, just enough to keep
the outlet water cold.
Figure 6.9 shows a photograph of a sample on the test frame with the
environmental chamber. The hose connections are not shown.
Since the "fatigue" tests were to be performed with the samples immersed, it
would not be possible (with the instruments available) to measure strain
during the test. Therefore, to be able to obtain measurements of stiffness
during the fatigue tests, it was decided to use a correlation between stroke
and strain. Before the actual "fatigue" tests were performed, one sample from
each rope type was used to plot a stroke x strain graph (measured with the
extensometer previously described) at 20±10% of UBL and a frequency of 1.3
±0.1 Hz. A linear relation was obtained between actuator stroke and strain.
The test procedure for the actual cyclic tests was as follows:
(i) install chamber over the sample;
(ii) install sample on the test frame;
(iii) apply an "installation cycle" to 50% of UBL for 30 minutes and then
unload to 10% of UBL;
(iv) cycle between 10 and 30% of UBL for 1 million cycles at a
frequency of 1.3 ±0.1 Hz;
(v) measure stiffness as described in section 6.2.2.1;
(vi) unload sample and change mode to stroke control; and,
(vii) load sample to failure at a rate of 0.7 mm/s.
113


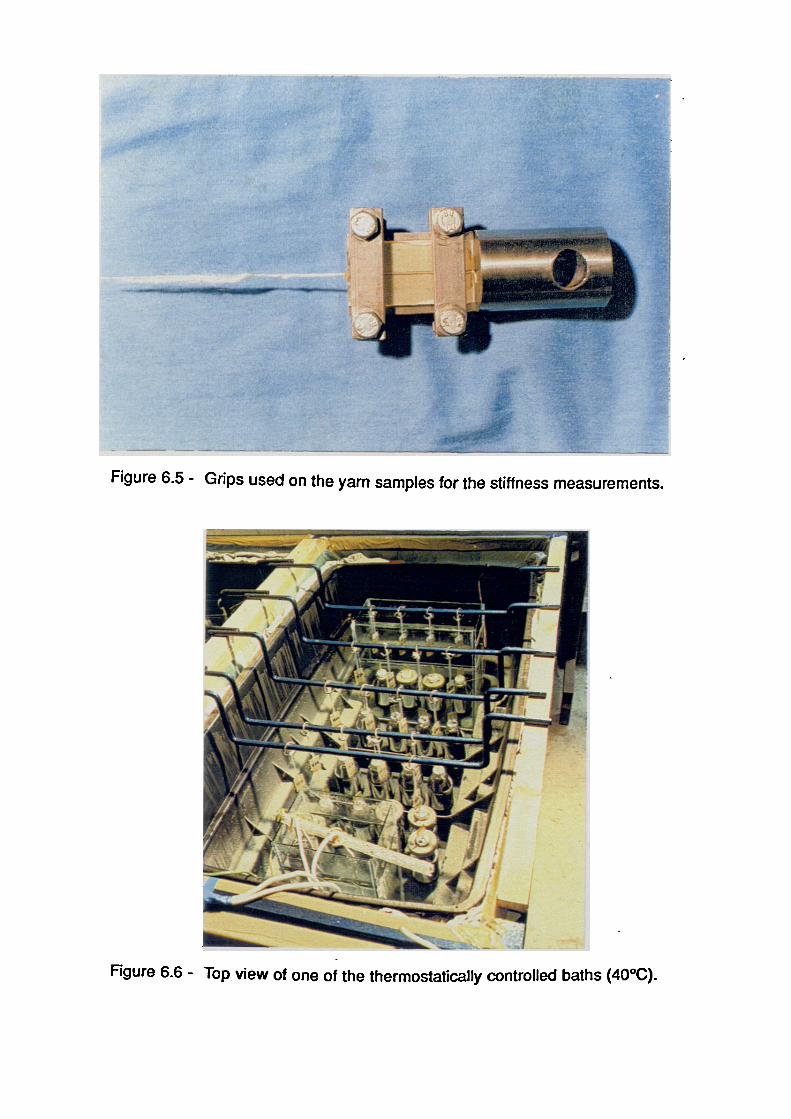


11I1
!
1
( )i
1i1i
r.. ) ii
i
i
1III
i!
Figure 6.8 - 2.5 kN compresion load cell.
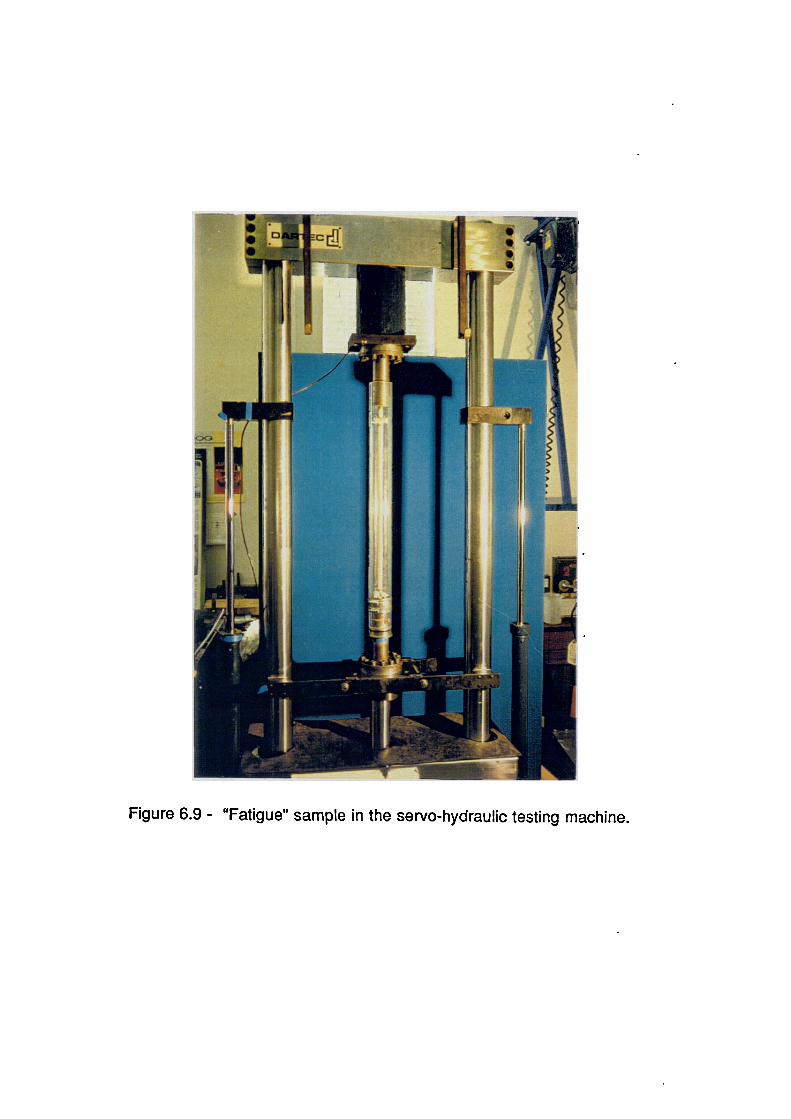

7. MATERIAL PROPERTIES: RESULTS
7.1 Strength
7.1.1 Yarn
Table 7.1 summarises the relevant results obtained in testing yarn strength.
Results are presented in terms of the yarn breaking loads measured, as well
as tensile strength (in GPa) and specific strength (in N/tex). Due to the
statistical variation of yarn strength, direct comparison tests were used as
much as possible. A single parameter was varied at a time and trials were run
picking one sample from each group alternately.
The first series of tests show the influence of adding twist to the yarn,when
testing with rubber lined flat jaws. The difference in favour of tests on twisted
yarn is significant at a level of 0.5°/0 for a one taiied lest ail comparisons are
for "one tailed tests" unless noted).
Series two shows the difference between yarn with and without marine finish,
when tested with rubber lined flat jaws. Results for the yarns without finish
were better at a level of significance of 1%.
Series three is a repeat of series 2 with all samples without marine finish
tested first, and the samples with marine finish tested last. In this case the
significance of the results is better than 0.5%.
The difference between results from series 2 and 3 comes from the fact that,
on series 2, residual lubricant from the samples with marine finish is left on the
rubber lining, lowering the results of the samples without marine finish. It also
suggests that it could be possible to obtain higher results for the yarn with
finish by improving the gripping method.
Series four shows the results for yarns without marine finish, terminated
between acrylic tabs, with epoxy glue and nitrile rubber compound. No twist
was added for testing. A comparison with series one shows that the yarn
terminated with acrylic tabs without twist had intermediate results between the
yarn tested with twist and without twist in rubber lined flat jaws. However the
114

differences are relatively small and of low significance.
Series five shows results for yarns with marine finish, terminated with acrylic
tabs with the same procedure described for series four. Again no twist was
added. The mean value obtained was higher than the means obtained in
series two and three for the same yarn, with twist, tested with the rubber lined
flat jaws. The significance of this comparison is very poor though.
Results of series 4 and 5 were considered good enough to support the
selection of the terminating procedure between acrylic tabs, with epoxy glue
and nitrile rubber compound as the standard for all subsequent tensile and
environmental degradation tests.
Based in the results obtained from the Diolen 855TN yarn in series 2, 3 and 5
a breaking load of 87.0 N was taken as the reference value (YBL) for the
definition of loads for the environmental assisted degradation tests.
After the completion of these degradation tests, an additional series of
strength measurements was undertaken (series 8). Twenty samples were
terminated with the standard procedure and distributed at random in four
groups. Ten samples were tested the day after they have been manufactured:
half dry and the others after immersion in deionised water for approximately
30 minutes. The remaining ten samples were kept for 3 months under a
minimal tensile load (between 0.01 and 0.05N): 5 in air and 5 in deionised
water. The samples were kept in a room without humidity control and where
the temperature was 18± 2 0C. The samples that were kept dry were immersed
in deionised water for 15 minutes before breaking.
These tests were intended to provide a confirmation of the reference breaking
load value of 87.0 N for samples taken from the yarn bobbin at a completely
different position from the previous series. The tests were also devised to
investigate apparent anomalies in the results obtained for the long term air
samples that will be discussed in section 7.3.
Test results are shown as series 8 in Table 7.1. The 5 breaking tests
conducted on dry yarn gave a somewhat low average breaking load but the
mean of all 20 tests was 86.8 N and the mean of all wet tests in yarns that had
115

been kept dry for 1 day and 3 months was 87.8 N. The average of the samples
that stayed in air for 3 months and then tested wet was a bit high at 89.2 N. It is
also worth noting the high scatter in the yarns that were kept for 3 months in
DIW, but it was observed that a lot of algae had grown in these samples. In
general terms the results confirmed the use of 87.0 N as the reference
breaking load (YBL).
In order to evaluate rope conversion efficiency, as defined below, 18 samples
were selected at random from a disassembled Superline rope, and another
12 samples from a disassembled Brascorda Parallel rope. These were tested,
with added twist, using the rubber lined flat grips. Results of these tests are
summarised as series 6 and 7 respectively in Table 7.1.
7.1.2 Ropes
7.1.2.1 Superline
Five samples from the length of rope supplied were tested by the
manufacturer before shipping. Free sample length was 2000 mm and testing
speed was approximately 400 mm/minute. Wedge type jaws, lined with lead
foil were used. A single test was performed with the cover intact, and broke
free of the jaws. Four test were carried out with the cover cut at the centre of
the gauge length. Only one of those broke away from the grips.
The results of these tests are shown in Table 7.2, together with a guaranteed
minimum breaking load (59.7 kN), based on the manufacturer's catalogue.
The latter was calculated by reducing the catalogue breaking load (68.7 kN)
of a slightly bigger (16 mm external diameter, 184000 tex) rope in proportion
to the linear mass of the rope tested (160000 tex). Since the rope maker
calculates the guaranteed minimum breaking load as 90% of the average
breaking load (Banfield (1989)), the average breaking load for the rope tested
in this study, with jacket would be 66.3 kN (i.e. (68.7.160000) / (184000.0.9)).
It is interesting to note that, although the braided jacket accounts for 38% of
the rope weight and certainly contributes to improve load sharing between
sub-ropes, its removal has reduced rope breaking load by an average of
116

17.5%.
Several tensile tests were performed during termination development with
results always above 49.4 kN. After completion of termination development 3
tests were carried out. Results of these tests are shown in Table 7.2. Failure
mode was by successive rupture of individual sub-ropes inside the resin at the
transition between the cylindrical and the conical regions. Tests were stopped
after a few breaks and a visual inspection of the unbroken sub-ropes has
always revealed a substantial number of broken fibres distributed throughout
the sample length.
Results are also presented in terms of specific strength and ultimate tensile
stress. Specific strength is the more precise and effective way of comparing
rope strength since it relates to the actual amount of material in the rope and
hence rope cost. Since the measurement of the diameter is very imprecise
and the filling factor varies from one construction to another, the ultimate
tensile stress does not give a good indication of rope efficiency and should not
be used for comparison purposes. It is presented here because that is the way
strength has been considered for the mooring design calculations.
Taking into account: the short length of the sample, the pattern of damage on
the unbroken sub-ropes, the average breaking load of 57.2 kN (equal to 86%
of the average value calculated based in the manufacturer's catalogue, with
cover) and the reasonably low scatter obtained, the terminations were
considered satisfactory.
A value of 57.0 kN was used as reference for the definition of the loads
(abbreviated as RBL) for both the fatigue and the environmental assisted
degradation tests.
Referring to an average yarn breaking strength in the rope of 85.67 N (series 6
of yarn testing) the average strength conversion of the terminated rope was
found to be 79.5% and the tenacity conversion was 73.6%.
Figure 7.1 shows the load-elongation plot obtained during the installation
cycle performed on a model Superline. The average secant installation
modulus measured for these ropes was 2.89 GPa from the origin to the
117

rightmost point at maximum load. The corresponding elongation was 9.5%.
7.1.2.2 Brascorda Parallel
The amount of Brascorda Parallel rope available for testing was limited to 25
metres and so fewer samples were used for termination development and to
define the reference strength. Termination development was not very much
prejudiced by this limitation since rope material, diameter and number of
strands were very similar to the Superline.
Table 7.3 shows the results obtained once the terminations had been
considered satisfactory. In the first sample 9 out of the 34 strands were slack
and the maximum load obtained was 52.5 kN. Sample no. 2 broke clear of the
terminations at 58.7 kN. The average strength of the last two samples was
58.55 kN. Taking into account: the short length of the sample, the fact that a
clear failure was obtained and the availability of rope samples, the termination
method was considered acceptable.
A reference value, rounded to the nearest kN, of 59.0 kN (RBL), was selected
for the definition of the loading on both the fatigue and the environmental
degradation tests. This value represents a strength conversion of 75.6% in
relation to the yam results from series 7 and a tenacity conversion of 71.4%.
The specific strength corresponding to the reference breaking load is
0.551 N/tex and the tensile strength, based on the enclosed area for a
diameter of 11.5 mm, is 0.568 GPa.
A load-elongation graph for an "installation" cycle is shown in Figure 7.2. The
average secant modulus at maximum elongation was 3.56 GPa,
corresponding to an elongation of 8.0%.
7.2. Stiffness and Hysteresis
7.2.1 Yarn Stiffness
Results obtained following the sequence of increasing mean tension,
118

increasing tension range and increasing cycling period (see Section 6.2.1)
are presented in Table 7.4. For reasons already discussed (Section 4.2) the
specific modulus (in Nitex or N/(g/km)) has been used. Although not directly
useful, the Young's modulus (in GPa) based on the actual cross-section of the
filaments in the yarn can be obtained by multiplying the specific modulus by
the density of the material (in 9/cm3). To obtain EA (the product of the apparent
Young's modulus by the cross sectional area), in N, specific modulus should
be multiplied by the linear mass of the yarn (in tex).
Due to the non-linear viscoelastic behaviour of the material tested, the
stiffness is a function of the loading history. Therefore, results obtained are not
exactly the ones that are applicable to the material in service. For example,
the stiffness at 10 ± 5% of YBL after a preceding loading at an average of 30%
of YBL is higher than after a preceding average of 5% of YBL.
Since measurements were taken at increasing mean loads over an extended
period of time (typically 2 days), and in the real application, mean load would
go up and down at quite a low frequency, a method was devised to to even out
the effect of the measurement procedure. Using the results obtained for
specific modulus as dependent variable and taking mean load, load range
and the logarithm of the cycling period as independent variables a linear
regression was performed.
The equation obtained was:
SM = 13.411 + 0.178. Lm - 0.176. La -0.384 . Log T, (1)
where: SM = specific modulus (in N/tex);
Lm= mean load (in % of the yarn reference breaking load);
La = load amplitude (in % of YBL); and,
T = period (in seconds).
The significance of the regression analysis was verified by calculating the F
statistic from the data (Miller et al. (1990, ref. book). The F statistic value of this
analysis was 275.4. The critical value of F for this regression is 7.82 at a 0.1%
level of significance, corresponding to a numerator degree of freedom of 2, i.e.
119

the number of independent variables minus one, and a denominator degree
of freedom of 59, because 60 measurements were performed. Since the value
obtained from the data is larger than the critical value the regression is
significant at a level of better than 0.1%.
Table 7.4 also shows the the fitted values for each case, as calculated by the
regression equation. It should be noted that by using the logarithm of the
period the fit obtained is remarkably good. As confirmation of the quality of the
regression and of the assumption of normal distribution associated with the F
statistic test, Figure 7.3 shows the residues (as percentage of predicted value)
plotted against the predicted values as a narrow horizontal band distribution.
7.2.2 Rope Stiffness
7.2.2.1 Superline
Results of the stiffness measurements after an "installation" cycle,
representing the as installed condition, are presented in Table 7.5 both in the
form of specific modulus and as an apparent Young's modulus based in the
circumscribed area of the rope core. For the latter a diameter of 11.5 mm was
assumed.
The measurements were taken with increasing mean loads, load ranges and
periods. In service conditions these parameters would vary slowly over the
range investigated. Under these circumstances the stiffness observed will not
be quite the same as the values measured for two reasons:
(i) the viscoelastic behaviour of the material; and,
(ii) the constructional set of the rope structure.
In order to obtain values that more closely approximate reality, the same
procedure used on the yarn measurements was employed with the rope data.
The regression equation obtained for the specific modulus (SM) was:
SM = 10.409 + 0.152. Lm - 0.194. La - 0.427. Log T.
The F statistic value for this regression is 2113.9 and the critical value of F for
120

a 0.1% level of significance is 7.57, verifying the significance of the
regression. The fitted values obtained using the equation above are also
shown in Table 7.5. Figure 7.4 is a plot of the residuals of the regression
versus the fitted values and shows an horizontal band without apparent
spurious effects.
The apparent Young's modulus (in Pa) can be obtained by multiplying the
specific modulus (in N/tex) by the linear mass of the rope core (in tex) and
dividing the result by the circumscribed area of the rope core (in m2).
A load elongation plot for a sample undergoing a simulated quasi-static
reversal of loading over a period of one week is shown in Figure 7.5. The
initial mean load was 11.4 kN (20% of RBL), from which over a 3 hours ramp
load increased to 17.1 kN (30% of RBL) which was kept constant for 72 hours.
Load was then lowered to 5.7 kN (10% of RBL) at a constant rate in 6 hours
and kept at this level for a further 72 hours. Finally the load was ramped up to
11.4 kN in 3 hours.
The extreme elongations were divided by the effective gauge length to obtain
the strain limits. The apparent Young's modulus, referred to a core diameter of
11.5 mm, was calculated as 7.32 kN/mm 2. The corresponding specific
modulus is 7.64 N/(g.km), or N/tex, for a linear mass of the rope core equal to
99.5 g/m (99500 tex).
Results for stiffness measurements after "fatigue" of 1 million cycles at
20 ± 10% of the rope average breaking load in running tap water and at an
average frequency of 1.17 Hz, are shown in Table 7.6. The results are
tabulated in the order in which they were obtained. Again specific stiffness
was used for its convenience when scaling up.
Table 7.6 also shows the values of specific stiffness obtained from the fitted
curve for the as installed condition, as well as the ratio to the after "fatigue"
values.
This ratio is slightly greater than one for the same conditions in which the rope
was cycled. As soon as a different cycling condition is imposed the stiffness
falls to a level marginally below the value indicated by the regression
121

equation for the as installed condition.
Stiffness measurements after creep are shown in Table 7.7 together with the
as installed condition fitted data for the same loading condition, as well as the
ratio between the two. All results are somewhat lower than the fitted data for
the as installedcondition.
7.2.2.2 Brascorda Parallel
Results for the stiffness measurements in the as installed condition (Section
6.2.2.1) are presented in Table 7.8 as specific modulus as well as apparent
Young's modulus based in the circumscribed area of the rope core.
Based on the same argument as developed for the Superline, a regression
equation was fitted to the data obtained for specific modulus (SM) as a
function of mean load (Lm ), load amplitude (L.) and the logarithm of the
cycling period (T). The equation obtained was:
SM = 12.058 + 0.152 Lm - 0.201 La- 0.473 . Log T.
The F statistic value for this regression is 486.6 and the critical value of F for a
0.1% level of significance is 7.57. The fitted values obtained using the
equation above are also shown in Table 7.8. Figure 7.6 is a plot of the
residuals of the regression versus the fitted values, and shows an horizontal
band without apparent spurious effects.
Figure 7.7 shows a load elongation plot for a sample undergoing a simulated
quasi-static reversal of loading over a period of one week. The initial mean
load was 11.8 kN (20% of RBL), the upper load level was 17.7 kN and lower
level was 5.9 kN. The cycling followed a similar pattern to that used for the
Superline model rope.
The extreme elongations were divided by the effective gauge length to obtain
the strain limits. The apparent Young's modulus, referred to a core diameter of
11.5 mm, was calculated as 9.66 kN/mm 2. The specific modulus was
9.38 N/(g.km), or N/tex, for a linear mass of the rope core equal to 107.0 g/m
(107000 tex).
122

Stiffness after latigue n for 1 million cycles at 20 ± 10% of BL is shown in Table
7.9. Results are plotted as specific stiffness and results are tabulated in the
actual order used to take the measurements.
Regression values for the specific stiffness as installed is also shown with the
ratio between values after fatigue and as installed. After fatigue values are 4%
higher at the same loading used on the fatigue test, but for other conditions
the difference varies from 1% lower to 4% higher than the as installed figures.
Stiffness measurements after creep are shown in Table 7.7 (together with the
data for the Superline model rope). The results are about 5% lower than the
fitted data for the as installed condition.
7.2.3 Rope Hysteresis
Table 7.10 shows the results obtained for the model Superline PET rope and
for the small steel wire rope. The loss coefficient was used for presentation of
results to simplify comparison with data in the literature. For the fibre rope both
stroke and strain were measured allowing the calculation of hysteresis in the
rope alone or in the rope plus termination. This was not possible for the wire
rope (see Section 6.2.2.2).
Typical results for the fibre rope and the steel wire rope (excluding
terminations) were 0.03 and 0.06 respectively.
Although the measurements were taken under slightly different conditions, it is
clear that the energy absorbed by the fibre rope at wave frequency is not
greater than that absorbed by the wire rope. It is also interesting to note that,
when the energy absorbed in the terminations is accounted for, an increase of
up to 30% was observed.
123

7.3 Creep and Environmental Assisted Degradation
7.3.1 Yarn
7.3.1.1 Creep
The results of the short term test (1 week) are shown in Table 7.11. The
effective yarn length was taken as the distance between tabs at a loading of
0.5 N. The table shows the yarn strains based on the crosshead movement
measured by:
(i) the encoder in the testing machine; and,
(ii) an external dial gauge between the column and the crosshead.
The difference between the measurement methods is insignificant.
The strains measured in the dead weight tests are shown in Table 7.12.
Figure 7.8 shows the strains measured in both tests plotted on a logarithmic
time scale. The curves obtained are parallel and the strain measured for the
short term test is typically 5% higher than that of the test under dead weight.
This variation is compatible with the way the measurements were taken, i.e.:
(i) elongation measurements in the short term test incorporate a small
but unquantified amount of elongation in the tabs;
(ii) the yarn creep behaviour has a statistical variation; and,
(iii) none of the tests were done under temperature or humidity control.
It is interesting to note that even when plotted against Log (time) (BS 4618:
Section 1.1 (1970)) the strain rate is decreasing. A curve of the form y.a.xb
gives a very good fit to the data of each dataset. A regression of the short term
data produced the equation:
strain = 5.010. (Log time)0.0744,
which fitted the data with a (coefficient of correlation) 2 of 0.999.
In the same way a regression of the long term test data generated theequation:
124
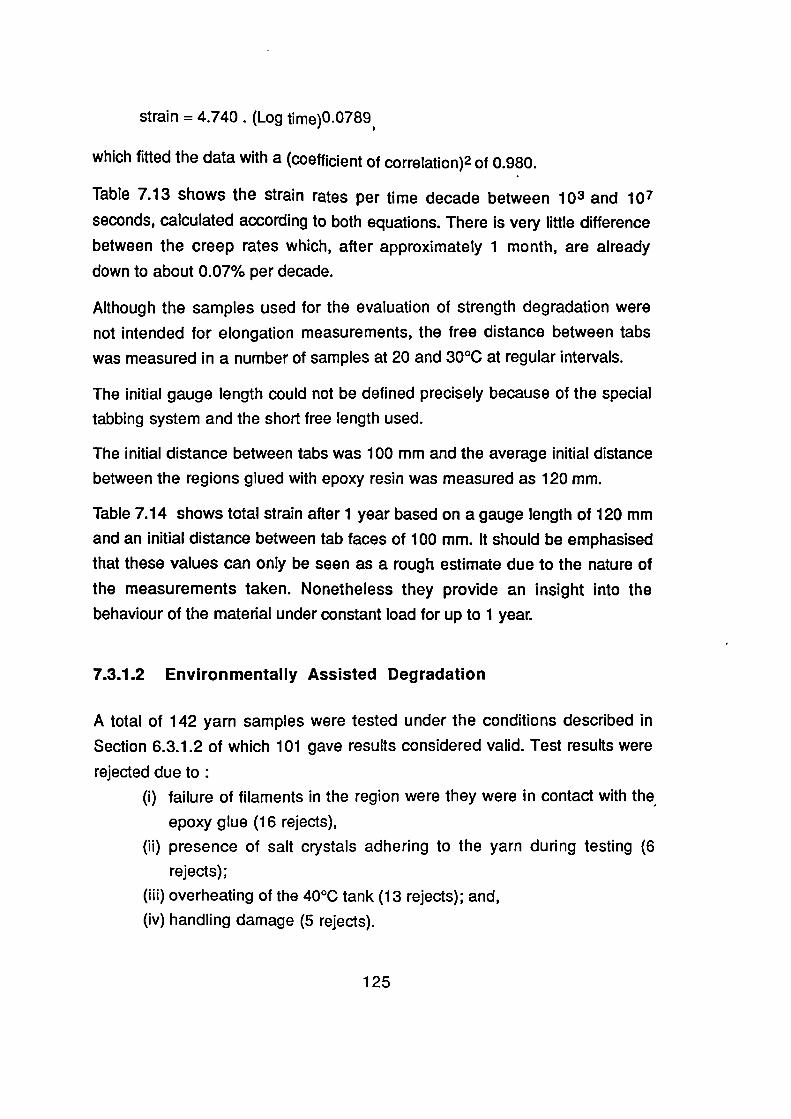
strain = 4.740 . (Log time)0.0789,
which fitted the data with a (coefficient of correlation) 2 of 0.980.
Table 7.13 shows the strain rates per time decade between 10 3 and 107
seconds, calculated according to both equations. There is very little difference
between the creep rates which, after approximately 1 month, are already
down to about 0.07% per decade.
Although the samples used for the evaluation of strength degradation were
not intended for elongation measurements, the free distance between tabs
was measured in a number of samples at 20 and 30°C at regular intervals.
The initial gauge length could not be defined precisely because of the special
tabbing system and the short free length used.
The initial distance between tabs was 100 mm and the average initial distance
between the regions glued with epoxy resin was measured as 120 mm.
Table 7.14 shows total strain after 1 year based on a gauge length of 120 mm
and an initial distance between tab faces of 100 mm. It should be emphasised
that these values can only be seen as a rough estimate due to the nature of
the measurements taken. Nonetheless they provide an insight into the
behaviour of the material under constant load for up to 1 year.
7.3.1.2 Environmentally Assisted Degradation
A total of 142 yarn samples were tested under the conditions described in
Section 6.3.1.2 of which 101 gave results considered valid. Test results were
rejected due to :
(i) failure of filaments in the region were they were in contact with the
epoxy glue (16 rejects),
(ii) presence of salt crystals adhering to the yarn during testing (6
rejects);
(iii) overheating of the 40°C tank (13 rejects); and,
(iv) handling damage (5 rejects).
125

The results of the valid tests are shown in Tables 7.15, 7.16, 7.17, and 7.18, for
the temperatures of 4, 20, 30 and 40°C respectively.
Table 7.18 (40°C) also includes the results for the yarns that were in the tank
for which the control system failed, allowing the samples to overheat. These
are separately identified.
Considering that most of these samples were plastically deformed to the point
that the dead weights touched the bottom of the tank, it is thought that the
maximum temperature reached must have been close to, if not higher than,
the glass transition temperature, i.e. more than 70°C.
Tables 7.15, 7.16, 7.17, and 7.18 also show mean values and standard
deviation for all combinations of: environment, duration and loading.
The most consistent results were obtained for the samples staying in the 4°C
tank and for the samples tested in deionised water (DIW) at all temperatures.
Samples in sea water at 20, 30 and some at 40°C were found to have
developed a layer of crystals on the outside of the yarn. Although for most of
these samples the crystals were dissolved prior to the tensile test for
evaluation of residual strength, it is thought that these samples could have
been damaged by the crystals in the process of removing the constant load. It
should be noted that samples were washed in hydrochloric acid after removal
of the dead weights, and when unloading from 20% of YBL, the yarn
experiences a rapid recovery of at least 4% (40000 jig).
7.3.2 Ropes
7.3.2.1 Creep
Figure 7.9 shows the total strain measured in each of the four Superfine
samples plotted against a logarithmic time scale. Strains have been
measured in terms of the separation of the sockets using on effective gauge
length as defined in Section 6.3.2.
The curves obtained are basically parallel to each other. Within the
126

overlapping time period the 1 month (SUP1) and the 6 months (SUP4)
samples showed very similar strains. Results for the 12 months sample
(SUP2) were marginally lower than those of the 1 and 6 months tests. The
3 months sample (SUP3) showed strains typically 0.004% greater than the 1
and 6 months samples.
It should be noted that for samples SUP1, SUP2 and SUP3, the set point of
the pressure regulators was adjusted by measuring the compressive force
between the actuator and the rocking arm, while for SUP4 the adjustment was
based on a direct measurement of tension in a load cell installed in place of
the rope sample. After the tests of SUP3 and SUP2 were finished a direct
measurement of the tension load to which they had been subjected indicated
tensions of 17.9 kN (31.4% of RBL) and 17.4 kN (30.5% of RBL) respectively.
Considering the higher load indicated at the end of the test on the 3 month
sample (SUP3), the results of only the 1 month, the 6 month and the 12 month
tests have been replotted in Figure 7.10 on a Log (time) scale. The tendency
for decreasing creep rate with the logarithm of time is less clear than the
tendency found for the PET yarn, but it is still present. A linear regression of
strain versus Log (time) showed a poorer correlation than an equation of the
form y = a xb . The regression equation obtained was:
strain = 4.718. (Log time) 0 -205(1),
with a correlation coefficient squared of 0.915.
Figure 7.11 shows the strains measured in the four Brascorda Parallel
samples, using a logarithmic time scale. The results for all samples lie on a
very narrow band with a clear tendency for flattening with increasing time on a
logarithmic time scale.
It should be mentioned that for this rope a subsequent check of the creep
loads that had been applied to the 3 months and the 12 months samples,
showed that these were between 29.5 and 30.5% of the reference breaking
load (RBL).
Also shown in Figure 7.11 is a regression of the data for the four Brascorda
127

samples to a curve of the form y -- : : a. xb. The equation found was:
strain = 3.226. (Log time)0.303
(2),
and the coefficient of correlation squared was 0.976.
It may be noted that the results seem to conform better to a dual slope linear
relation with the slope transition around 500000 seconds, but the single
equation regression is conservative and more convenient.
7.3.2.2 Environmentally Assisted Degradation
The retained strength obtained from the Superline rope samples subjected to
long term constant loading is shown in Table 7.19.
All the results are a little below the average of the 3 reference results on
unloaded ropes (57.20 kN). However the average retained strength, 54.45 kN,
was not significantly lower at the 5% level. The lowest result was obtained
after 1 month under constant load. The retained strength measured after one
year was 97.6% of the average initial value.
Table 7.20 shows the retained strength of the 4 samples of BrascordaParallel rope. The average of the 4 results was marginally higher than the
average strength of the two new samples tested. As with the Superline
samples, the lowest result was obtained after 1 month exposure, down 5%
from the average new value. The strength measured for the one year sample
was 0.6% higher than the average new value.
7.4 "Fatigue"
Results for the retained strength of two samples of each model rope, after 1
million cycles at 20±10% of RBL, are shown in Table 7.21. Breaking load (in
kN), maximum specific stress (in N/tex) and ultimate tensile stress (in GPa)
are given. The average values of all these measurements of residual strength,
for each rope type, are also tabulated.
128

When tested to failure all samples showed the same pattern of behaviour, i.e.
sequential failure of independent sub-components (sub-ropes in the
Superline and strands in the Brascorda Parallel). All failures were associated
with the terminations. Most failures happened inside the resin at the transition
between the cylindrical and the conical sections of the socket. Some
components failed at the interface of the resin with the free rope length.
The examination of one sample of each rope after the cyclic loading indicated
that:
(i) the free length of the samples had a very small number of broken
fibres, estimated to be insignificant statistically;
(ii) in the Brascorda Parallel rope these few breaks were concentrated
on the external strands of the rope structure;
(iii) the fracture surfaces of the few damaged fibres found on the free
length of both samples showed that these fibres had been either
cut or mangled (Hearle et al. (1989), indicating that the damage
had happened before cycling;
(iv) no filament fatigue was observed (Hearle et al. (1989);
(v) both samples showed limited signs of degradation (broken fibres),
at the interface between the free rope length and the resin cone;
(vi) although the number of fibres broken at the termination interface
was not counted (because of the restricted access to this region), it
is estimated that something like 100 fibres were broken on each
termination of the Brascorda Parallel rope sample, and about 500
fibres were broken at the interface of each resin cone of the
Superline rope;
(vii) all broken fibres removed from the free length adjacent to the
termination in the Superline sample had fibrillated breaks.
Figures 7.12 and 7.13 illustrate the type of failures found at the termination
interface. The photographs were taken with the scanning electron microscope
at magnifications of 400 and 700 times respectively. Figure 7.12 shows the
fibrillar nature of the fracture. The view captured in Figure 7.13 highlights the
morphology of the fracture process and the shear stresses present in the wear
mechanism (Hearle et al. (1989)).
129

C iJo0
CI1 CI)rl) Tr)0 0
ci) a)
la' triE Ea) a)..- ..-.a; as
00CC
01 CT) •-•c c 0,
a) a) 7-D. -c, -e.>.. 5... - 0
-Dai -4:9 "FE Ea) a) o coEEEas a)ca co cl
_ccy,C2.C .....
€'3 CO (I)2 0 _.,,c.)a)a.
C')
..cr -a-(NJ .4-03 co.6 cs
10 f)CN.
•-•COa) N..6 6
0 LOCD •CrLO c0cc) N-ci 6
.:1*NCOa6
..-CJ0)N.ci
COcots1....c;
0C11N..N..ci
)11 LO 0) LO'TT' 11- 0 Lt)co co .- a)N. N.. co N.d c; c:i ci
5a)(Z) Z-605
NC)01 (13_,..- .....,
Ts-. COa ooc; c\i
CO TO0).d '"
N.c`!,-
COc‘i
wt..-c‘i ui
CD LO U) COCD 1',: CV cm6 .- ..- tri
-oasoc --Ial 0)0 C ZM 26:1
2co
to u-)01 Le)CS C1.1al CT)
CD COCli ei03 OD
LO COcri ui0) 03
CDir).Z13
CO.--N.CO
1,-CDtr.;CO
N0)4CO
.- CO N U14 cs5 a; 1.--:OD CO 03 CO
coa)o_Eco
(1)
c:iZ
a aT T
a a'T T
a aT T c0 c0 03
TCNJT In U, u) to
a)Ec2'5Cw
Z's L''-0 'CI '0 -0
a"-0 -0 -C)
•-0
a"-0
Z""O
•13
a' • ro L, Ili13 '0
in§I-
o cnc a)>,
‘n cn CI1 43 ClIa) a) a) co a)>. >. >. > >.
oc ocCI)a)5,
Cf1a)>.
0000c c cc
0)CaCL
I.—.0
-to -toa) a)C C
8 8sa _0.0 _022
-o -o0 0C C= =8 Zr)-0 -0-0 _022
-a '00 0C c
.t 'ai.0 _0.0 _022
(I)JDco
. 0a.'0as
y-0as
.0a'C.)as
"0a)a--
8-0-02
10a)c
8-0-02
C I ) V 1 C I ) 4)-0 .0 .0 .0as TO 03 0
.0.0.0.0
a'' a-' aN L-s0 0 0 0to al as as
C
›-
H HCOIL)to LOCO c0Z ZLLJ UJ._J _J00c:i 0
1Zin I-tr, u)co ti)
c0Z Zw
1-1-10 5/a _0
HZLnin Inco Ino,Z z-Jai U-I
0-10;_-, _- a
HLotr)a)
ZLL1-J0o
ZI-EnLOCO
ZLU—I0a
ZI-COLOCOZ
t.-J0a
ti--
I—10U")coIW0-
ZzZZH I- H l-LO LO LI) 11")10 Lf) L0 1.003 OD co a3
ZZ ZZLLJ UJ W LLJ-J _J --I --I00000 0 a a
a)cnCDu)
co Ns- a co I-- CO

Sample Jacket Breaking Load
kN
Break Specific Strength
N/tex (N/(q/km))
Tensile Strength
GPa
Catalogue intact 59.7 - 0.3732 0.3415
1 intact 68.95 clear 0.4309 0.4035
2 cut 53.41 jaw 0.5368 0.51423 cut 55.60 clear 0.5588 0.53534 cut 59.78 jaw 0.6008 0.57555 cut 58.79 jaw 0.5909 0.5660
Average 2 to 5 56.90 0.5718 0.5478Std. Dev. 2.93
6 removed 58.90 termination 0.5920 0.56717 removed 57.20 termination 0.5749 0.55078 removed 55.50 termination 0.5578 0.5343
Average 6 to 8 57.20 0.5749 0.5507Std. Dev.
removed
1.70
Reference removed 57 0.5729 0.5488
Table 7.2 - Tensile test results of the Superline model rope "as new".
Sample Jacket Breaking Load
kN
Break Specific Strength
N/tex (Nl(g/km))
Tensile strength
GPa
1* cut 52.50 termination 0.4907 0.50542 cut 58.70 clear 0.5486 0.56513 cut 58.40 termination 0.5458 0.5622
Average 2-3 58.55 0.5472 0.5637Std. Dev. 0.21
Reference cut 59.00 0.5514 0.5680
' some strands longer than the others
Table 7.3 - Tensile test results of the Brascorda Parallel model rope "as new".

Mean Load% of YBL
Load Amplitude'% of YBL
Periods
Specific ModulusN/tex
Fitted ValueN/tex
ResidualN/tex
5 2.5 7.5 13.57 13.52 0.045 2.5 15 13.48 13.41 0.07
• .5 2.5 100 13.34 13.09 0.25
5 2.5 200 13.24 12.98 0.27
15 2.5 7.5 15.63 15.30 0.33
15 2.5 15 15.72 15.19 0.53
15 2.5 100 15.52 14.87 0.65
15 2.5 200 14.95 14.76 0.20
15 5 7.5 15.16 14.86 0.29
15 5 15 14.78 14.75 0.04
15 5 100 15.06 14.43 0.62
15 5 200 14.92 14.32 0.60
20 2.5 7.5 15.80 16.19 -0.39
20 2.5 15 15.26 16.08 -0.81
20 2.5 100 15.48 15.76 -0.28
20 2.5 200 15.4-8 15.64 -0.16
20 5 7.5 15.78 15.75 0.02
20 5 15 15.40 15.64 -0.24
20 5 100 15.02 15.32 -0.30
20 5 200 14.88 15.21 -0.32
20 10 7.5 13.70 14.87 -1.18
20 10 15 13.91 14.76 -0.85
20 10 100 13.62 14.44 -0.82
20 10 200 13.40 14.33 -0.93
30 2.5 7.5 17.47 17.97 -0.50
30 2.5 15 17.49 17.85 -0.37
30 2.5 100 17.09 17.54 -0.44
30 2.5 200 17.09 17.42 -0.33
30 5 7.5 17.35 17.53 -0.18
30 5 15 17.40 17.41 -0.01
30 5 100 17.09 17.10 0.00
30 5 200 17.09 16.98 0.11
30 10 7.5 16.05 16.65 -0.60
30 10 15 16.34 16.54 -0.19
30 10 100 15.93 16.22 -0.29
30,
10 200 15.78 16.11 -0.33
40 2.5 7.5 20.40 19.75 0.65
40 2.5 15 20.21 19.63 0.58
40 2.5 100 20.01 19.32 0.70
40 2.5 200 19.54 19.20 0.34
40 5 7.5 20.51 19.31 1.2040 5 15 20.57 19.19 1.3740 5 100 19.77 18.88 0.89
40 5 200 19.54 18.76 0.7740 10 7.5 19.83 18.43 1.4040 10 15 19.63 18.31 1.3240 10 100 18.86 18.00 0.86
40 10 200 18.65 17.88 0.7650 2.5 7.5 20.31 21.52 -1.2150 2.5 15 20.70 21.41 -0.7150 2.5 100 20.01 21.09 -1.0850 2.5 200 20.01 20.98 -0.9750 5 7.5 20.91 21.09 -0.1850 5 15 20.70 20.97 -0.2750 5 100 20.51 20.65 -0.1450 5 200 20.26 20.54 -0.2850 10 7.5 20.07 20.21 -0.1450 10 15 20.10 20.09 0.0150 10 100 19.54 19.78 -0.2450 10 200 19.54 19.66 -0.12
Table 7.4 - Dynamic yarn stiffness for increasing: mean tension, tension
range and frequency. Results obtained from regression also
shown.

Mean Load% B. L.
Load Amplitude% B.L
Periods
Young's ModulusGPa
Specific ModulusWiex
Fitted Spec. Mod.WIez
ResidualNam
5 2.5 7.5 9.48 9.89 10.31 -0.425 2.5 15 9.45 9.89 10.18 -0295 2.5 100 9.26 9.67 9.83 -0.165 2.5 200 9.23 9.64 9.70 -0.06
10 2.5 7.5 10.77 1127 11.07 0.2010 2.5 15 10.54 11.03 10.94 0.0910 2.5 100 10.39 10.87 10.59 0.2910 2.5 200 10.24 10.71 10.46 0.2510 5 7.5 10.02 10.48 10.59 -0.1010 5 15 9.99 10.46 10.46 0.0110 5 100 9.67 10.12 10.10 0.0210 5 200 9.51 9.95 9.98 -0.0215 2.5 7.5 11.15 11.66 11.83 -0.1715 2.5 15 10.86 11.35 11.70 -0.3515 2.5 100 10.82 11.31 11.35 -0.0315 2.5 200 10.60 11.35 11.22 0.1415 5 7.5 10.95 11.44 11.34 0.1015 5 15 10.84 11.33 11.22 0.1215 5 100 10.56 11.04 10.86 0.1815 5 200 10.46 10.94 10.73 0.2120 2.5 7.5 11.93 12.47 12.59 -0.1220 2.5 15 11.82 12.34 12.46 -0.1220 2.5 100 11.56 12.09 12.11 -0.0220 2.5 200 11.56 11.68 11.98 -0.3020 5 7.5 11.78 12.32 12.10 0.2220 5 15 11.62 12.15 11.97 0.1820 5 100 11.27 11.78 11.62 0.1620 5 200 11.16 11.67 11.49 0.1720 10 7.5 10.27 10.74 11.14 -0.3920 10 15 10.18 10.64 11.01 -0.3720 10 100 9.86 10.31 10.65 -0.3520 10 200 9.72 10.16 10.53 -0.3630 2.5 7.5 13.50 14.09 14.11 -0.0230 2.5 15 13.31 13.90 ' 13.98 -0.0830 2.5 100 13.00 13.58 13.62 -0.0530 2.5 200 13.00 13.58 13.50 0.0830 5 7.5 13.20 13.78 13.62 0.1630 s 15 13.04 13.62 13.49 0.1230 5 100 12.95 13.52 13.14 0.3830 5 200 12.80 13.37 13.01 0.3530 10 7.5 12.53 13.08 12.65 0.4330 10 15 12.34 12.88 12.52 0.3630 10 100 11.83 12.35 12.17 0.1830 10 200 11.58 12.09 12.04 0.0430 15 7.5 10.99 11.63 11.69 -0.0630 15 15 10.70 11.47 11.56 -0.0930 15 100 10.60 11.07 11.20 -0.1430 15 200 10.50 10.96 11.08 -0.1240 2.5 7.5 14.87 15.52 15.62 -0.1040 2.5 15 14.67 15.31 15.49 -0.1940 2.5 100 14.24 14.87 15.14 -0.2840 2.5 200 14.24 14.87 15.01 -0.1540 5 7.5 14.67 15.31 15.14 0.1740 5 15 14.61 15.26 15.01 0.2540 5 100 14.32 14.95 14.66 0.3040 5 200 14.15 14.50 14.53 -0.03ao 10 7.5 13.87 14.48 14.17 0.3140 10 15 13.79 14.39 14.04 • 0.3540 10 100 13.32 13.91 13.69 0.2240 10 200 13.24 13.82 13.56 0.2640 15 7.5 12.80 1326 13.20 0.0540 15 15 12.61 13.17 13.07 0.0940 15 100 12.26 12.80 12.72 0.0840 15 200 12.08 12.61 12.59 0.0250 2.5 7.5 16.24 16.95 17.14 -0.1950 2.5 15 16.08 16.78 17.01 -0.2450 2.5 100 15.60 16.30 16.66 -0.3650 2.5 200 15.60 16.30 16.53 -0.2350 5 7.5 15.97 16.67 16.66 0.0250 5 15 15.74 16.43 16.53 -0.1050 5 100 15.43 16.10 16.18 -0.0750 5 200 15.43 16.10 16.05 0.0650 10 7.5 15.29 15.96 15.69 0.2750 10 15 15.14 15.80 15.56 0.2450 10 100 14.85 15.51 15.21 0.3050 10 200 14.44 15.08 15.08 0.0050 15 7.5 13.81 14.60 14.72 -0.1250 15 15 13.63 14.23 14.59 -0.3650 15 100 13.24 13.82 14.24 -0.4250 15 200 13.14 13.71 14.11 -0.40
Table 7.5 - Dynamic stiffness of the Superline mode( ropes for increasing:
mean tension, tension range and frequency. Results obtained
from regression also shown.

Mean Load Load Amplitude Frequency Spec. Modulus Regression ValueNitex
Measured/Regession'Ye B.L. % B.L. Hz N/tex
20 10 0.067 11.65 11.01 1.05820 10 0.2 11.84 11.22 1.05620 5 0.2 12.46 12.18 1.02320 2.5 0.2 12.52 12.67 0.98810 5 0.2 10.13 10.67 0.94910 2.5 0.2 10.50 11.15 0.941
Table 7.6 - Influence of long term "fatigue" cycling in the dynamic stiffness of
the Superline model ropes.
Rope Mean Load% B.L.
Load Amplitude% B.L.
FrequencyHz
Spec. ModulusN/tex
Fitted ValueN/tex
Measured/Fitted
Superline 20 10 0.2 10.39 11.22 0.926Superline 20 10 0.067 10.34 11.01 0.939
Brasc. Parallel 20 10 0.2 12.04 12.76 0.944Brasc. Parallel 20 10 0.067 11.94 12.54 0.952Brasc. Parallel 20 10 0.01 11.37 12.15 0.935
Table 7.7 - Dynamic stiffness of the Superline and Brascorda Parallel model
ropes after long term exposure to a constant load of 30% of UBL.
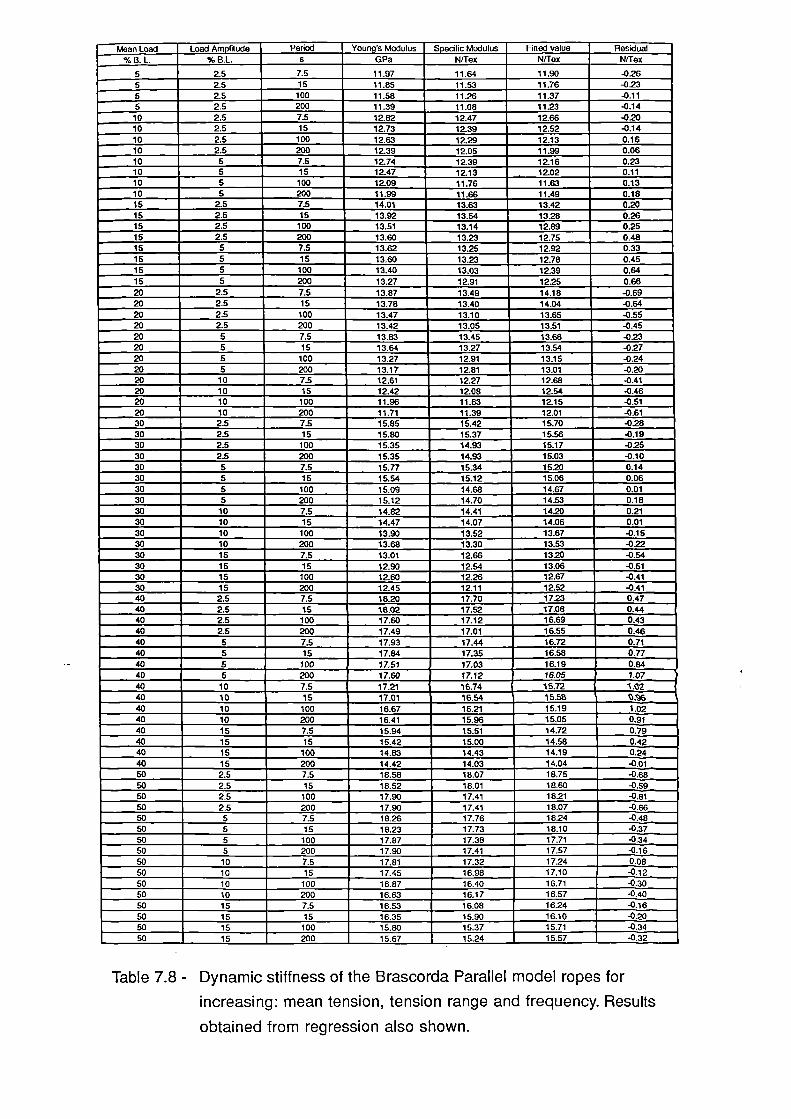
Mean Load Load Amplitude Period Young's Modulus Specific Modulus Fined value Residual
% B. L. % B.L. s GPa N/Tex N/Tex N/Tex
5 2.5 7.5 11.97 11.64 11.90 -0.265 2.5 15 11.85 11.53 11.76 -0.23
5 2.5 100 11.58 11.26 11.37 -0.11
5 2.5 200 11.39 11.08 11.23 -0.1410 2.5 7.5 12.02 12.47 12.66 -0.2010 2.5 15 12.73 12.39 12.52 -0.1410 2.5 100 12.63 12.29 12.13 0.1610 2.5 200 12.39 12.05 11.99 0.0610 5 7.5 12.74 12.39 12.16 0.2310 5 15 12.47 12.13 , 12.02 0.1110 5 100 12.09 11.76 11.63 0.1310 5 200 11.99 11.66 11.49 0.1815 2.5 7.5 14.01 13.63 13.42 0.2015 2.5 15 13.92 13.54 13.28 0.2615 2.5 100 13.51 13.14 12.89 0.2515 2.5 200 13.60 13.23 12.75 0.4815 5 7.5 13.62 13.25 12.92 0.3315 5 15 13.60 13.23 12.78 0.4515 5 100 13.40 13.03 12.39 0.6415 5 200 13.27 12.91 1225 0.6620 2.5 7.5 13.87 13.49 14.18 -0.6920 2.5 15 13.78 13.40 14.04 -0.6420 2.5 100 13.47 13.10 13.65 -0.5520 2.5 200 13.42 13.05 13.51 -0.4520 s 7.5 13.83 13.45 13.68 -0.2320 s 15 13.64 13.27 13.54 -0.2720 5 100 13.27 12.91 13.15 -0.2420 5 200 13.17 12.81 13.01 -0.2020 10 7.5 12.61 12.27 12.68 -0.4120 10 15 12.42 12.08 12.54 0.4620 10 100 11.96 11.63 12.15 -0.5120 10 200 11.71 11.39 12.01 -0.6130 2.5 7.5 15.85 15.42 15.70 -0.2830 2.5 15 15.80 15.37 15.56 0.1930 2.5 100 15.35 14.93 15.17 -0.2530 2.5 200 15.35 14.93 15.03 -0.1030 5 7.5 15.77 15.34 15.20 0.1430 5 15 15.54 15.12 15.06 0.0630 5 100 15.09 14.68 14.67 0.0130 5 200 15.12 14.70 14.53 0.1830 10 7.5 14.82 14.41 14.20 0.21ao 10 15 14.47 14.07 14.06 0.0130 10 100 13.90 13.52 13.67 -0.1530 10 200 13.68 13.30 13.53 -0.2230 15 7.5 13.01 12.66 13.20 -0.5430 15 15 12.90 12.54 13.06 -0.5130 15 100 12.60 12.26 12.67 -0.4130 15 200 12.45 12.11 12.52 -0.41ao 2.5 7.5 18.20 17.70 17.23 0.47ao 2.5 15 18.02 17.52 17.08 0.4440 2.5 100 17.60 17.12 16.69 0.4340 2.5 200 17.49 17.01 16.55 0.4640 5 7.5 17.93 17.44 16.72 0.7140 5 15 17.84 17.35 16.58 0.7740 5 100 17.51 17.03 16.19 0.8440 5 200 17.60 17.12 16.05 1.07
40 10 7.5 17.21 16.74 15.72 1.0240 10 15 17.01 16.54 15.58 0.96ao 10 100 16.67 16.21 15.19 1.0240 10 200 16.41 15.96 15.05 0.9140 15 7.5 15.94 15.51 14.72 0.7940 15 15 15.42 15.00 14.58 0.4240 15 100 14.83 14.43 14.19 0.2440 15 200 14.42 14.03 14.04 -0.0150 2.5 7.5 18.58 18.07 18.75 -0.6850 2.5 15 18.52 18.01 18.60 -0.5950 2.5 100 17.90 17.41 1821 -0.8150 2.5 200 17.90 17.41 18.07 -0.66so 5 7.5 18.26 17.76 18.24 -0.4850 5 15 18.23 17.73 18.10 -0.3750 5 100 17.87 17.38 17.71 -0.3450 5 200 17.90 17.41 17.57 -0.1650 10 7.5 17.81 17.32 17.24 0.0850 10 15 17.45 16.98 17.10 -0.1250 10 100 16.87 16.40 16.71 -0.3050 10 200 16.63 16.17 16.57 -0.40so 15 7.5 16.53 16.08 16.24 -0.1650 15 15 16.35 15.90 16.10 -0.20
50 15 100 15.80 15.37 15.71 -0.34
50 15 200 15.67 15.24 15.57 -0.32
Table 7.8 - Dynamic stiffness of the Brascorda Parallel model ropes for
increasing: mean tension, tension range and frequency. Results
obtained from regression also shown.

Mean Load% B.L.
Load Amplitude'2/0 B.L.
FrequencyHz
Spec. ModulusN/tex
Fitted ValueNitex
Measured/Fitted
20 10 0.067 13.08 12.54 1.04320 10 0.2 13.29 12.76 1.04120 5 0.2 13.89 13.76 1.01020 2.5 0.2 13.92 14.26 0.97610 5 0.2 12.06 12.24 0.98510 2.5 0.2 12.61 12.74 0.9905 2.5 0.2 11.48 11.98 0.959
30 12.5 0.2 13.50 13.78 0.97930 10 0.2 14.05 14.28 0.98430 5 0.2 15.44 15.28 1.010
Table 7.9 - Influence of long term "fatigue" cycling in the dynamic stiffness of
the Brascorda Parallel model ropes.
Rope Loading% of UBL
No. of Cycles Loss CoefficientAU/2nU (stroke)
Loss CoefficientAU/2nU (elongation)
0.0376PET Superline 20%±10% 100 0.0383PET Superline 20%±10% 300 0.0380 0.0283PET Superline 20%±10% 1000 0.0339 0.0265
steel wire rope 20%±14% 100 - 0.0616
Table 7.10 - Hysteretic damping results for the Superline model rope and a
13 mm diameter six strand steel wire rope (with steel core).

Time Strain (Instron) Strain (clock)s
0 0.00 0.003.6 4.76 -5.6 4.89 -11.6 5.03 -38.6 5.18 -121 5.29 -284 5.35 -592 5.41 -1182 5.45 5.452382 5.49 5.494782 5.53 5.5310782 5.56 5.5721282 5.59 5.6050982 5.62 5.6385182 5.65 5.65151182 5.67 5.68258882 5.69 5.70318282 5.68 5.69403782 5.69 5.70490182 5.69 5.70512682 5.69 5.70574782 5.70 5.71
Table 7.11 - Creep strain results for a one week test on Diolen 855TN yam in
the lnstron universal testing machine at 30% of YBL.
TIME STRAINS 0/0
0 0.00220 5.07775 5.131495 5.183415 5.246295 5.2415295 5.3523095 5.3530295 5.3581295 5.35167095 5.40254695 5.40627295 5.40
3975295 5.527859695 5.57
Table 7.12 - Creep strain results for a three month dead weight test on Diolen
855TN yarn at 30% of YBL.

Strain Rate (%/decade)Dead WeightDecade Instron
10"3 to 1044 0.118 0.11910 1.'4 to 10 1'5 0.093 0.09410"5 to 10"6 0.077 0.07810 1'6 to 10"7 0.066 0.067
Table 7.13- Strain rate (in percent per time decade) observed in the two
types of creep tests performed.
Temperature°C
Load°/0 YBL
Strainok
Std. Dev. of Strain°h.
2020 3.92 0.1830 5.47 0.1840 6.58 0.36
3020 4.40 0.1930 6.11 0.1540 7.38 0.13
Table 7.14 - Estimated strains after one year in the yarn samples used in the
combined creep-environmentally assisted degradation tests.

IDENTIFICATION AMBIENT DURATION LOAD (%BL)20.00
BREAKING LOAD84.50_
11 DIW 12.0012 DIW 1.00 20.00 90.00
1111 DIW 12.00 40.00 84.501112 DIW 1.00 40.00 86.50IV1 SW 12.00 20.00 82.501V2 SW 12.00 20.00 86.501V3 SW 12.00 20.00 . 84.50IV4 SW 3.00 20.00 90.50IV5 SW 1.00 20.00 84.50V1 SW 12.00 30.00 86.50V2 SW 12.00 30.00 89.00V3 SW 12.00 30.00 86.00V4 SW 1.00 30.00 83.00V5 SW 3.00 30.00 83.50VI 1 SW 12.00 40.00 83.50V12 SW 12.00 40.00 87.00VI4 SW 3.00 40.00 82.00VI5 SW 1.00 40.00 85.50
19 DIW 1.00 20.00 84.001119 DIW 1.00 40.00 83.00
1V21 SW 1.00 20.00 85.50V21 SW 1.00 30.00 87.00V120 SW 1.00 40.00 83.50113 DIW 3.00 20.00 87.00
11113 DIW 3.00 40.00 86.501V25 SW 3.00 20.00 88.00V25 SW 3.00 30.00 88.00V124 SW 3.00 40.00 89.50
20% DIW 86.38 20% 86.142.75 2.54
30% 86.142.21
40% 85.140% DIW 85.13 2.3
1.71 MTH 85.26
2.173 MTH 86.88
20% SW 86 2.882.63 1 YEAR 85.45
1.91
DIW 85.7530% SW 86.58 2.22
2.06 SW 85.82.43
40% SW 85.17 ALL SAMPLES 85.792.75 2.33
Table 7.15- Results of the combined creep-environmentally assisted
degradation tests on yarn samples at 4°C.
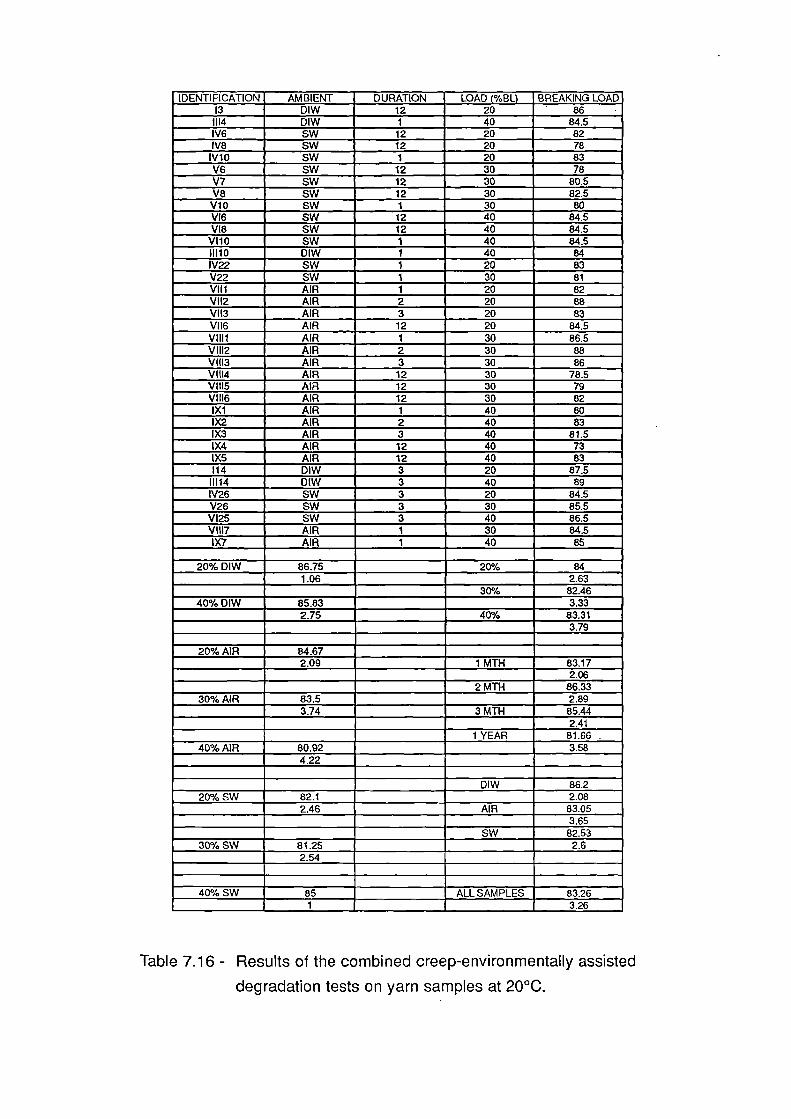
IDENTIFICATION AMBIENT DURATION LOAD (%BL) BREAKING LOAD13 DIW 12 20 • as
1114 DIW 1 40 84.51V6 SW 12 20 82IV8 SW 12 20 78
IV10 SW 1 20 83V6 SW 12 30 78V7 SW 12 30 80.5V8 SW 12 30 82.5V10 SW 1 30 80V16 SW 12 40 84.5VI8 SW 12 40 84.5
V110 SW 1 40 84.511110 DIW 1 40 84IV22 SW 1 20 83V22 SW 1 30 81VII1 AIR 1 20 82V112 AIR 2 20 88V113 AIR 3 20 83VII6 AIR 12 20 84.5VllIl AIR 1 30 86.5VIII2 AIR 2 30 88VIII3 AIR 3 30 86VIII4 AIR 12 30 78.5VIII5 AIR 12 30 79VIII6 AIR 12 30 821X1 AIR 1 40 801X2 AIR 2 40 83IX3 AIR 3 40 81.5IX4 AIR 12 40 73IX5 AIR 12 40 83114 01W 3 20 87.5
11114 DIW 3 40 89IV26 SW 3 20 84.5V26 SW 3 30 85.5VI25 SW 3 40 86.5V1117 AIR 1 30 84.5IX7 AIR 1 40 85
L20% DIW 86.75 20% 84
1.06 2.6330% 82.46
40% DIW 85.83 3.332.75 40% 83.31
3.79
20% AIR 84.672.09 1 MTH 83.17
2.062 MTH 86.33
30% AIR 83.5 2.893.74 3 MTH 85.44
2.411 YEAR 81.66 .
40% AIR 80.92 3.584.22
DIW 86.220% SW 82.1 2.08
2.46 AIR 83.053.65
SW 82.5330% SW 81.25 2.6
2.54
40% SW 85 ALL SAMPLES 83.261 3.26
Table 7.16 - Results of the combined creep-environmentally assisted
degradation tests on yarn samples at 20°C.

IDENTIFICATION AMBIENT DURATION LOAD (%BL) BREAKING LOAD15 DIW 12 20.00 77.0016 01W 1 20.00 83.00
1115 D1W 12 40.00 , 82.00IV12 SW 12 20.00 82.00IV13 SW 12 20.00 83.00IV15 SW 1 20.00 79.50V11 SW 12 30.00 84.50V12 SW 12 30.00 84.50V15 SW 1 30.00 80.50VI11 SW 12 40.00 83.50VI12 SW 12 40.00 84.50VI13 SW 12 40.00 86.00VI15 SW 1 40.00 84.50
111 DIW 1 20.00 83.5011111 01W 1 40.00 79.00
, IV23 SW 1 20.00 85.00V23 SW 1 30.00 82.00VI22 SW 1 40.00 84.50115 DIW 3 20.00 86.50
11115 DIW 3 40.00 87.50V27 SW 3 30.00 89.00VI26 SW 3 40.00 87.00
20% DIW 82.5 20% 83.443.98 3.01
30% 84.13.23
40% 84.2840% DIW 82.83 2.61
4.311 MTH 82.38
2.263 MTH 87.5
20% SW 82.38 1.082.29 1 YEAR 83
2.6
DIW 82.6430% SW 84.1 3.76
3.23 SW 842.42
40% SW 85 ALL SAMPLES 83.571.26 2.89
Table 7.17 - Results of the combined creep-environmentally assisted
degradation tests on yarn samples at 30°C.

IDENTIFICATION AMBIENT DURATION LOAD (%BL) BREAKING LOAD18 DIW 1 20 87
1117 * 01W 3.6 40 851118 DIW 1 40 85
IV16 * SW 3.6 20 81IV17 * SW 3.6 20
_
83.5IV20 SW 3 20 86
r V16* SW 3.6 30 83.5vii* SW 3.6 30 84.5V18* SW 3.6 30 84V19 SW 1 30 86.5V20 SW 3 30 89.5
V116 ' SW 3.6 40 83V117* SW 3.6 40 85VI18 SW 3 40 85VI19 SW 1 40 84112 DIW 1 20 87
11112 DIW 1 40 83IV24 SW 1 20 88.5V24 SW 1 30 87.5VI23 SW 1 40 84116* DIW 1.4 20 83
11116 * DIW 1.4 40 83IV28 * SW 1.4 20 84.5V28* SW 1.4
_30 81
V127* SW 1.4 40 79
20% DIW 87 S 20% 87.130 1.03
, 30% 87.831.53
40% 84.240% DIW 84 0.84
1.41
1 MTH 85.831.89
20% SW 87.25 3 MTH 86.831.77 2.36
DIW 85.530% SW 87.83 1.91
1.53 SW 86.382.03
40% SW 84.33 ALL SAMPLES 86.080.58 1.95
*yarn sample accidentally overheated
Table 7.18 - Results of the combined creep-environmentally assisted
degradation tests on yarn samples at 40°C.

SAMPLE JACKET BREAKING LOADkN
BREAK
AVERAGE B. L. NEW removed 57.20 (1.70) "
REFERENCE NEW removed 57.00
1 MONTH CREEP removed 50.76 termination3 MONTH CREEP removed 56.75 termination
6 MONTHS CREEP removed 54.50 termination12 MONTHS CREEP removed 55.80 termination
AVERAGE CREEP removed 54.45 (2.63)
( ) = standard deviation
Table 7.19 - Results of the combined creep-environmentally assisted
degradation tests on the Superline model rope samples.
SAMPLE JACKET BREAKING LOADkN
BREAK
AVERAGE B. L. NEW removed 58.55 (0.21),
REFERENCE NEW removed 59.00
1 MONTH CREEP removed 56.10 termination
3 MONTH CREEP removed 60.00 termination
6 MONTHS CREEP removed 60.00 termination
12 MONTHS CREEP removed 58.90 termination
AVERAGE CREEP 58.75 (1.84)
Q == standard deviation
Table 7.20 - Results of the combined creep-environmentally assisted
degradation tests on the Brascorda Parallel model rope samples.

II-0zwCC naiI- u-(1)0
UsZuJi-
S-0a)1- CO COLO En Inci d .6
LO 03 NCD CD 01En LO LOci ci d
II-- ---
Zw crCC ..._*-'I- z(n. xc) MUJ"---a. Z(I)
CD CD 03•zr co coto in incS 6 C.;
.c; ri'; .c7i'4' ID LO
ci ci ci
Y<UJCCGO
CC CCw1.11I- I--
CC CC .w11.1I- I-
0<0--I. : zx -c<ELECCE:0
o o o ulI's 01 CD CVci (0 (0 ,...;En En En -
o o 1/1 0
111 CD Ps uocq cri 11)..;En En En -
F-w0<--4
0 CDLU al>>002E 2EUJ UJCC CC
0 0UJ UJ>>002E 2EWWCC CC
LU..-Ja_2aCO
111 j0 w<0— cv ccw d> 1-< CD
LLI j0 w< 0— c., ccw ci> I-< En
w0_0CC
u.I Luz z74 ziCC ccUJ uJCI_ 0_D D(0 0)
ce cEa a0- 0_
ci dU) en< <cc CCCO CO
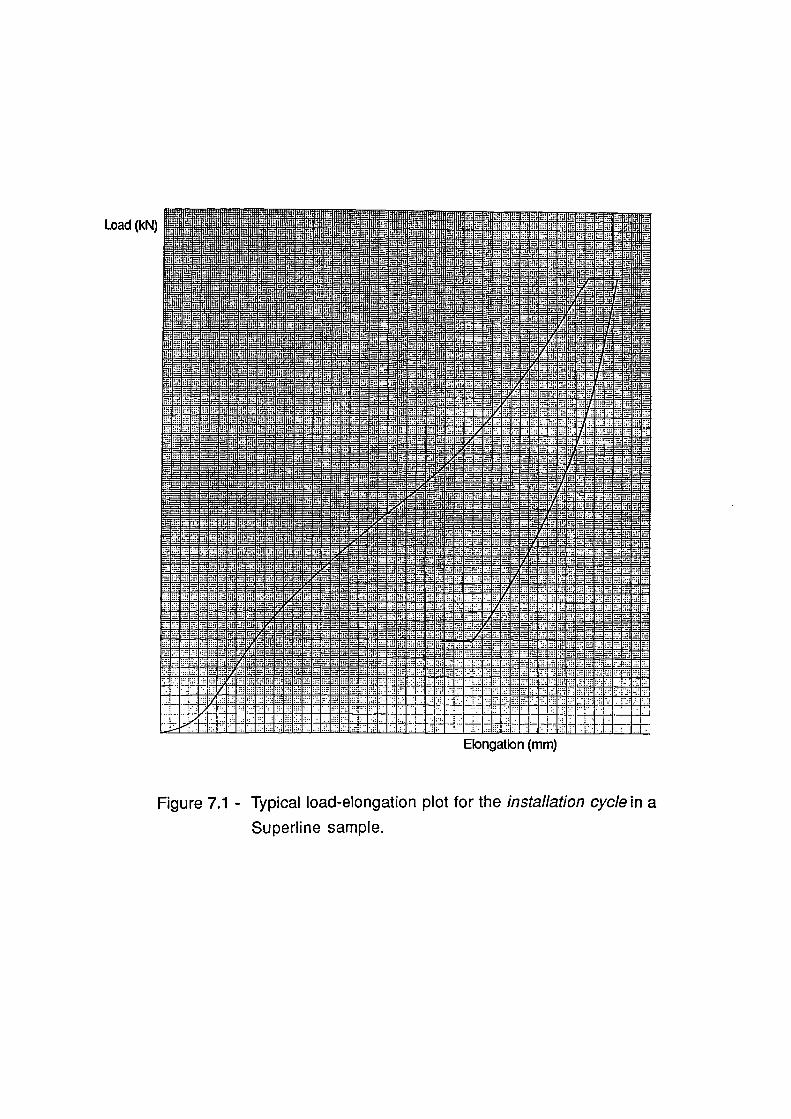
Load (kN) fflL walli1111111111411111111111111111111111111- 1 -mlimammammmaugisimimmmemmomm mm amemmommmm-nyazim,:Ammmgommmmommmmmmommommmommummmm= .., z-....EHEEINBEER —EEEEEEEEMEEEMEEEEEEEEMEEEMEEMEE WEEEEEINEEE ENREEEEEEEMEEEEEEEEEEEEEEEEINEEr irP.P1' -mmmmommo mmoimmmommmmommommmamEgmmmNEER ,..--EWEEEE,Ig 'AEEEEEEMEEEEEEEPBAEEMEEEA - Ham EEKEEEEEE JOEMEEEMMEEEEMEEEEEWENENOMEP -EEMEEENEEEER - E EnEREEiT EE—NEE .-'1 EPm m --7-ommt Pw ammmammmelommmmmommummmmAmEgmmtkkimiommmm qEEENEgERAEEPEEERMERERNERREMEENR4RPREE -r _ ava EMEEEEEEEEEEEEEEMEEEMEEEECUEEEMENEREMEENftg=4E2' 7:-... ENNEMEEEEEMEEMEEEERREEEEMMEEEEffnEEEEEMEEEEEEEPE'''' INMEEEEENEMEMEEENEEEEEEEEEMEinEEENEENEEEffiEREEEEW REEREWEEEEENEWEEEEEEEEMEEROENEEEMMERHEMEEkEEEE__ EEREft-REWNEEN igMEM=Eg-7.EffEEEEEEE EEREEMENEMEEEMEMBE-EMEMEEEEEEENEENEEEEEEREEEEEEEEEMEEMEEMEEEREEEEENEEEagEEEEEMEEPEUMMEEEEEEEEENEEMEEEMWEEEEMEMEEEEEEEgNEEMEEEEEEREEEmEEEEENEEEEEEEMEEENEEEMEEEREEMMUMEMEMEEMEEMEEMEEMEEMEMEMMEMENMEMEMOMEME9EINEEMMEE=MOM MEMEMMEM YeMEMMEMEEMEEMMEMMEMMENEMEEMM MMAMMMEMENMOMMMEMMEMEMEMMMEMMEMEMEMWE h MEIMMOMMEMMONMENN NOMMENsEEMEMEMEEMEEMEMEME MEEM g MEEMENNEIMMENMENOMMV MEMNONMMEMEEPTEAMEMEMEEMEEMEEMEMEEMEEMEMMEMEEMOMEN MENNENMMENNEENE&EMEMEMEEMEmEEMEMEMEEMEMMMEMMEMOMME ECEEMEEEEEREEEEEEEYEtgREEMEERE'7EEMEEE . -..._=-==-,=....;9ifia..: . -.---mmmOmilmmammmmammmmEmmmmmmommma-mmmmmE..----- r =EmmmmmgmmPlommmmmgmmmmmgmmma=mmmft..--.4--Am---- _..._ E_ . =EMEILE=VaMFTRINEgEERAMENa2MENFAMMEEMOIPia—=EEEk --TEEMEMEnMMEEMMEEMEMEMEUEMMEMEEffift...--m-
z:Em---Ei. ==REEPENERREETEEEEEENEVAEMEEMEEEME_.:2mEggL-gitigEgmgggEgmuggiggggm.-----egE,-..--..--,.._ —mEmPlgE.MPOP.t.50EMEMEE.--WRii-gWENmEftE,M
-EgmmommaNdmimmmummiammmmmummmmgmmmmbrdmommommmommmmammmommmmmmom
-NMEPEEEMMEMEMMEMEEMEMEMEMEEMENNEMMENEENEEME _ENEWIEMEEMMEMENMEEMEEFAMEMEEMEMEENEEMMEENEffgEEmEEMEEEMMEEMEMENEMENNEWEEMENOMEMEWEMEEMMEMENNEENEFEELEkEEEEEMEEMMENEMINIMENFAMMONNOMEEMEEMEMEMENEENEMENiNEKBEEEMMENEEMMMENNFROMINFANENNEMMENEMENNMONMENEEN MMEREEMEMEMMENMENNEMMENMEMAMMOMMEMMOMONNEIMMMEMENMENEEMEEMMENEMEMEEMENENEMMENNOMMEAMNOMMONMEMENMMEMEEMEEMEWEEEEMEMEMEEMEMEMEENEMMMENEMEMOMMEMEEngEEEMEMENEEMEMEEmmEmmmmEmEEMEMENEEMEMENEEMMEMEMEMEMEEMEMMMEENEMEEMEEMEMMEEMEMEMEMEENNMEMEMMEMENEEMMEMEEMMENNEMEMEMErAMMEMEMEMEEMEEMMMOngMEMEMEMNEEMMENMEMOMEMMMEENEUEMEgEMEEMEMEEMEMENEMEMMEMEMMENEMMEEMMEMMEMNOMMOMMEEMMEMEMMEMMEMEEMEMMEMMEMNEMMEMEMOMMOMMENEMEMWENNMEMEMEEMEEMMEEMMEMEMMEMMEMEMOMMEMEMMOMMOMMEMEMENMONMEMWAMOMMEMENEMMEMMMOMENNINMEMENUMNOMMMEMMEMMNOMMNENNENOMININNEE MOMMENIMEMENNIMINMENNINKEINMONIONMENIONINNIEN
MilliiiiiPlidlird '11111116Elongation (mm)
Figure 7.1 - Typical load-elongation plot for the installation cycle in a
Superline sample.

mu,mmismommgommgmmemmmummummumma 10,44MEMPOMMUMMEMOr-MNOMMEMMEMEEMEMEEMMERENNEMEMEMMEMIMPOMEMPONEWOOMMOMMEMMEMMEARTAMENMEgRiMPEREMMERMENE@MEEMERMUMUMMUMMEMMENEMMEMMUMBNEggEEMEMOMMEMEMMOREEOgffiEEMEEMMEN/Al EammommomommommgmmemEommalsammammgmEmmMEM/EMMEN NMEOMMERIBEINEREMEMMEMEMENEMEEMEgREMEREMBEEMEMMEEMEMEMMIAMEMONEWEEEMEMEMIMMEWEEMEgMMEMENAMMEOM_ . Eff-TFIARFIE710 MCLINEWEEEMEEENmmgaligsggpmEggg&.. ''''PAPERNMITAMMONNEMENWANIPtgffEMMiffiggemEggggggigg m MEMEREMMEMPAMEMMEMMgMENgaWBRE
ffiffORINMENOW“ E MEEffiffgNEM4AMMYWAT--HEMEEPAggi-MW g_FEEWATAW6NRIMINEWEm'174'_MMEEMEMEMilgtNAggElriuM
. _ =11.4 =-"ELTZEIL:2..Alum=.0EBffilIMEOMadMEggEEENE 14 .ig OAMSEWMEN410BEMET1ggigaggg@gggEggmomEEEEEEEMEEMEEEWEEEEEENEmEEEMEREEEMEEEEEEEEMMEEEEENNEEEEEMENEEEEEEEERIEW4EFrEEEPEEEEMEEEEEENEEEEEEEMEEEENNEEEKEEMEEEEEEENWOMEEEEMEMEEEEEEMEEEEENENEENEEMEEEE&EREEEEEEENAMENEEEENERENEE ME EEEEEMEEEEEEEMEEMEMEEBEEEMEEEMEMEENEEEMEEEEEEEEEEENWtEEmEEEPMEEEEKNEEMEEEE0EAMEUEmmg-EMPFEEEEE,ed . !-tzati- RNEEBO MMEMEMMEMEN@WfiggEEMENENMEMMEgEdEMWgNM= 7.11.AMPONtmMiEgEtEhMEMENgEM
-MEMNONMEEmailabw-...g.E..m
==....."..--.„..
____„.....„....''-'7:77n,=====...._
gggagmap-=m-m.esEob--•Z:.=,. ==aTiar=
2gEmMEffEEM
NEEMERTAWA RAP =_=-.MEgam [email protected]..= -F-*''MWEEL1WENgEg.410-E-P-0-LiEMMEEEME
ggsT''Mg -77-: mffiggggiMgEm 'gggg&W-AggEM@BMgm-M-MMOERVOMMOW-MffiNgIVMEEIT5g0EMERNMO_E'INgaiffiffiNffiEMMIMEMMEMOMENUEEWENNETAMENEEMEMEROMFAMENNE@EggiNiEgaMEMEMEMEMEMBEgEEEgEMEMEEMEMEMMENENMEMEMEEMBEEOMMEMBEEMOMMEEMMIEREENNEMEN MMEHMSMEMMEMEMMEMEREMBEEMENAMEMENIEMEEEMMENNEEMEENAMMMILOWNEMEMEMMEIMMEMEMBUENgEMBEWEEEMIUMEMMEOMMEMMEMINAMMERAM@BEWMEMEMMEEMMEMEMEN MENEM' MEMEMEMMOMMEOMMEMMEMENNEMMEMEMME 'WEELTEMEMEMEEMMEEEMEAMOMENOMMEMEMEMEMBEEMEENNEMEMgaTEEffiNgEgMEEMEMENEEEMMEMMENIMMEMNEMMEMMENNAMEMMEMMEMEMEMEMEMENNEEMMEMMENNEEMENNEEMMEESEENEMMEMMEMERNMEMEMOMEMEMMMENMEMMOMMEEMMEMERMEMEMEMMUMBEMEMEMMEMMEMEMMEMMEEMOMMOMMEMEMEMEMEEMEUENEEEEEEEMEEEMEEEEEEEEEEEEEEEENEMENEEEEEEEEEBEV EHEEENEEEEEEBEMEEEEMEEEEEEEEEENNEENEERNEEEEIE....1- : -11HENSIMENEMEIMINEEERNINIZEMMEINENSIMMENEIREEZIEZIEN
- --.EWIEMINNEMENIENESIMMINESIERIMERMINERMENEMBINIOUSEIEN.' : - -:111MENINIMERRIMEMMEIEBEEINELEINIMINIMEEMBIMMINIZERCIMEN
&mmTEaRMENMENtagEINI .„ -EiMEWEEMEEME- 'TANNENN_ 7-WRREtiffigiguggEgligt uMg@EME9NEU ,.,.==E....4....,--- :oEET..:=,,. ij,maw-A__ -alggmm_EEEEEREN 5-5..:..:t -4474TEP-9.''EVAAT ='IgitgAgEgP-gMFEMENEg r.f.; E.:gan o.A. PWAEg".-'[email protected] IPET
-MEMWPq:WJEMEEERgi.
-.....gga.,,,EgEigMEgEMMgEMPAggff
Load (kN)
Elongation (mm)
Figure 7.2 - Typical load-elongation plot for the installation cycle in a
Brascorda Parallel sample.

lesiduals
0eP
0' %00 •
% 0 0• di
.7- ',° % 00
0 44-6-0
00 .00 % 6
a
r13--- c-T2T-4'.:
0
00 0
000
o 0AP a, 0
Cb
oo
0
0
o
o v
10 12 14 16 1
0.6
0.4
0.2
-0.2
-0.4
-0.6
10RESIDUES (%)
••••• ••1
0•5 a 0 0 T.
0
000 00 0000?
5 oo0
0
-1012 14 16 18 20 22
FITTED VALUES
Figure 7.3 - Distribution of residues of the yarn stiffness regression.
SPECIFIC MODULUS
Figure 7.4 - Distribution of residues of the Superfine stiffness regression.

/
Et esiduals
. •04
os
ib, is• i
p• • i, - •----t-------IP--°• c:0 •d'q, i s t.el f a ce ie03
•
•0I-- 0
0
12 14 16 18
1.5
1
0.5
o
-0.5
17.1
,Load (kN)
zz/
Z
5.7
LElongation (mm) 682
Figure 7.5 - Load elongation plot for a Superfine undergoing a simulatedquasi-static loading cycle.
55.4
SPECIFIC MODULUS
Figure 7.6 - D'stribution of residues of the Brascorda Parallel stiffness
regression.
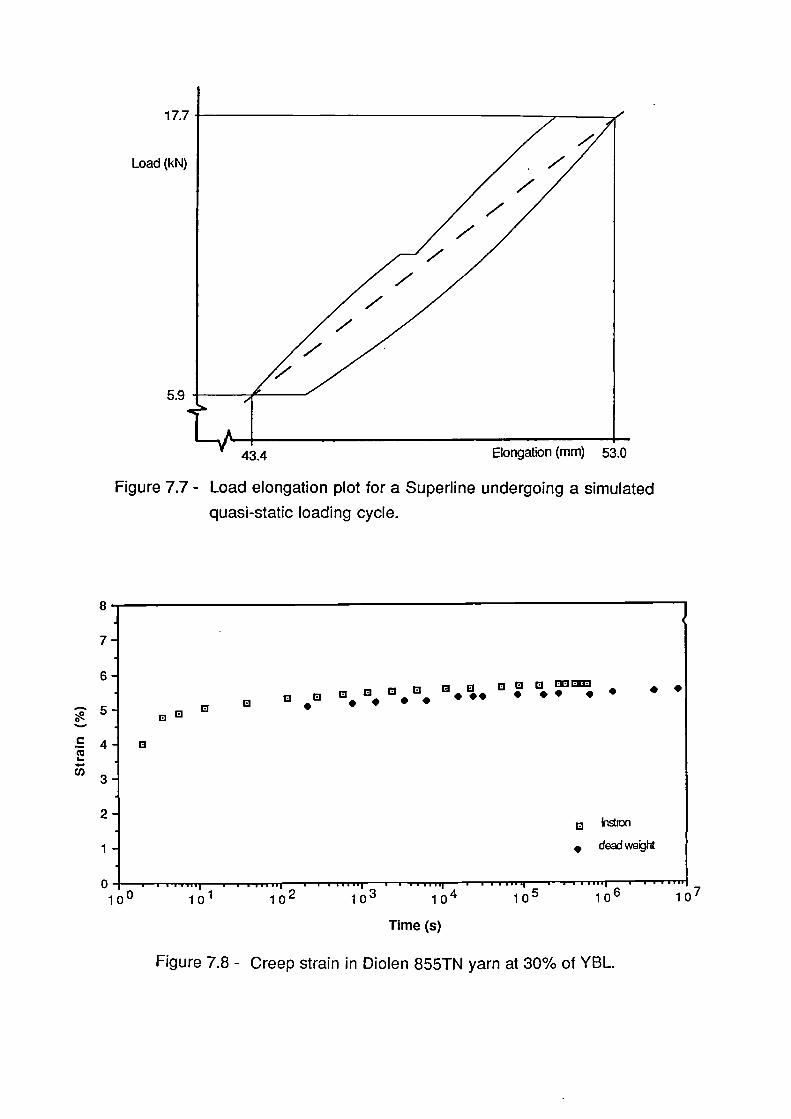
17.7
Load (kN)
5.9
)
V 1 11 15.4111 • • 1-1,71 • • • •-••• 9• • • —.--1-1—ra 1
1 0 4 1 0 5• , • • .6171
1 0 6
43.4
Elongation (mm) 53.0
Figure 7.7 - Load elongation plot for a Superline undergoing a simulated
quasi-static loading cycle.
8 -
7 -
6 -
--. 5 _e.... .c 4 -
IT! .CI)3 -
0
a aCI
13 13 13 01:1 (ICI CI 011333
CI •• •
0 •0 0• ••• • •• • • • •
2 -ti lnstion
• deadweight
0 • . ..•...,10 0 101
• V V •••••
1 0 7
Time (s)
Figure 7.8 - Creep strain in Diolen 855TN yarn at 30% of YBL.

o 1 Month
• 3 Mordhs
+ 6 Months
• 12 Months
0 1 11 0 1 1 0 2 1 0 3 1 0 4 1 0 5 1 0 6 1 0 7 1 0 8
Time (s)
1 1
3 6• I •
7I • I
4 5
Log time (s)
Figure 7.9 - Creep strain in the four samples of Superfine nominally at 30% of
UBL.
Strain
(%)
8 —-
7 --
6 -
5 -
4 _
3 -
2 -
1 -
e0 00 0
y = 4.7183 *
00
x^0.20544
°
R A2 = 0.915
+
o 1 Maith
+ 6 Months
• 12 Months
o2 8
Figure 7.10 - Creep strain in the three samples of Superline actually at 30%
of UBL.
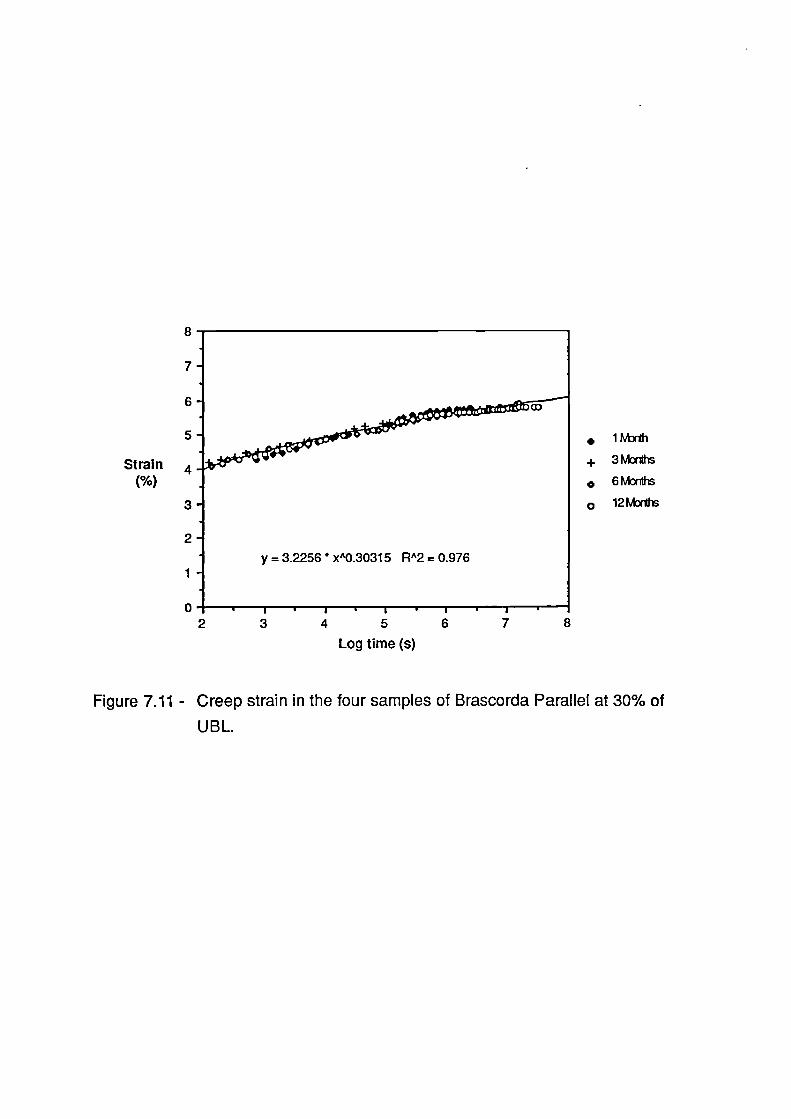
0 t • I • I 1 12 3 4 5
Log time (s)
876
• 1 Morth
+ 3 Months
• 6 Months
o 12 Months
Figure 7.11 - Creep strain in the four samples of Brascorda Parallel at 30% of
UBL.
8 MATERIAL PROPERTIES : DISCUSSION
8.1 Strength
8.1.1 Yarn
The tensile strength measured during this test programme for the single yarn
Diolen 855T as supplied by the manufacturer varied between 1.15 and
1.17 GPa depending on the termination method, with standard deviation
generally below 0.013 GPA for the yarn tested with twist. This strength is
situated in the upper half of the range mentioned by the major manufacturers,
showing that a yarn strength of 1.15 GPa is a realistic value for good quality
"high tenacity" polyester yam.
From the two model ropes tested in this programme, the rope with more
manufacturing operations (Superline) was made of yarn of the same make
and grade of yarn, supplied by AKZO already twisted in bundles of 20 yarns
with additional finish (Diolen 855TN). Most testing concerning yarn
degradation was performed on yarn originally purchased by the rope
manufacturer, with this finish on, from the same batch used to make the model
rope. To reduce scatter one yarn from the 20 yarn assembly was selected for
the bulk of the testing programme. The average breaking strength of this
particular yarn was found to be 1.093 GPa and the standard deviation
0.029 GPa.
The yarn removed from the rope, assembled in 3 sequential twisting
operations, showed an average breaking load of 1.075 GPa, i.e. 92% of the
maximum strength measured, with a standard deviation of 0.025 GPa.
Considering that:
(i) most of this strength reduction was already evident in the yarn
tested after the first twist operation (94%); and,
(ii) full size mooring ropes will typically have one additional twisting
operation;
it can be considered that polyester yarns in a properly made full size mooring
rope of the same construction should retain strengths of at least 1.05 GPa,
130

corresponding to 90% of the original yarn strength.
Ropes made of PET yarns in two other constructions, parallel yarn and
parallel strand, were also found to be attractive options for substitution of all
steel mooring lines. These constructions are simpler than the parallel sub-
rope and as such are not expected to suffer degree of yarn damage during the
manufacturing process as that observed in the Superline. Measurements in
the parallel strand rope made by Brascorda support this conclusion, i.e. yarn
removed from the rope averaged 94.4% of the strength quoted by the yarn
manufacturer.
Full size steel wire mooring ropes (70 mm to 127 mm diameter) are usually
made of wires with nominal tensile strengths in the range of 1.57 to 1.77 GPa.
The average strength of wires from each of these grades can be expected to
be about 10% higher than the nominal figure. Assuming that no damage is
impaired to the wires in making a steel wire rope, the yarns in a good quality
low twist construction PET rope will have a tensile strength typically between
54% and 61% of the strength of wires in a steel wire rope.
The tensile strength of the material used to make mooring chain used for
mooring offshore platforms is either 0.69 GPa or 0.86 GPa minimum tensile
strength (Andreassen (1991)), somewhat below the polyester yarn.
The large advantage to be gained by changing to tethers based on polyester
fibres starts to became apparent when strength is considered on a weight
basis. High tenacity PET yarn in a rope has a specific strength of at least
0.76 N/tex, i.e. 0.76 MN/(kg/m), while the wire in a steel wire rope will not
exceed 0.23 MN/(kg/m) and the steel in a mooring chain will not be higher
than 0.11 MN/(kg/m). These differences correspond to weight reductions by a
factor of 3.3 and 6.9 respectively, for the same strength.
For mooring applications strength is best analysed in terms of the immersed
weight (apparent weight) of the mooring component. In this case, the strength
of the PET yarn in the rope will be ca. 0.28 MN/(N/m) (2.76 MN/(kgf/m)) while
steel wire will only give 0.027 MN/(N/m) (0.26 MN/(kgf/m)). This means, 10
times more apparent weight for the same strength! The efficiency of the steel
in the chain in these terms will be much worse at 0.013 MN/(N/m)
131

(0.13 MN/(kgf/m)).
These results, referring to actual measurements of strength from yam removed
from two ropes, give a taste of the potential weight advantages to be had by
replacing part of the steel components in a deep water spread mooring
system with ropes made of polyester yarns assembled in low twist
constructions.
The minimum tensile strength of the core, based in the actual fibre cross-
sectional area, given by Linear Composites Ltd. (1983) for their PET parallel
yam rope, Parafil, is 0.617 GPa. This corresponds to 59% of the minimum yarn
tensile strength identified in this study, i.e. 1.05 GPa. The average value
obtained by Crawford & McTernan (1988) for a 10 tonne PET Parafil was
0.783 GPa. The later result would be consistent with the 84% strength
efficiency calculated by Burgoyne & Flory (1990) for a high modulus aramid
parallel yarn rope and a termination efficiency of around 90%. In terms of the
enclosed area of the core, the tensile strength quoted by LCL becomes
0.432 GPa and the measurements by Crawford & McTernan (1988) average
0.548 GPa.
Considering that: the average breaking strength of small steel wire ropes is
typically 10 to 15% higher than the minimum breaking load quoted by the
manufacturer (Chaplin (1992)) and that the tensile strength given by British
Ropes (1988, ref. blue strand catalogue) for a 12 mm diameter 6x36 +IWRC
rope using grade 1770 kN/mm2 wire is 0.802 GPa, the tensile strength
measured by Crawford & McTernan is between 60 and 62% of the actual
strength of a six strand wire rope of similar breaking load. It is also interesting
to note that based on these results and the tensile strength measured for PET
yam in the present study (1.15 GPa new), it is possible to conclude that, on the
basis of enclosed area, small size (100 kN MBL) parallel yarn Parafil PET
ropes convert yarn strength into rope strength with an efficiency similar if not
better than 6x36 +IWRC six strand wire ropes convert the wire strength.
There is no data available in the literature concerning actual test data for
larger diameter PET Parafil ropes, but from the yarn results now obtained and
the tests performed by Crawford & McTernan, it seems that the tensile strength
132

quoted by Linear Composites is conservative, provided terminations of similar
efficiency are used. This can only be proved in full size testing.
8.1.2 Ropes
Two model ropes of approximately 60 kN breaking load have been tested in
this work. The tensile strength of both ropes, tested without their covers, was
found to be very similar both in terms of weight per unit length and in terms of
the enclosed area. The average strength obtained for the Superline parallel
sub-rope construction was 0.575 N/tex (N/(g/km)) or 0.551 GPa. For the
. Brascorda Parallel parallel strand rope the strength was 0.547 N/tex
(N/(g/km)) or 0.564 GPa.
On a basis of fibre cross-sectional area, tensile strengths were 0.794 GPa and
0.755 GPa respectively. The later results are quite similar to the 0.783 GPa
measured by Crawford & McTernan (1988) for a 10 tonne PET Parafil, the
difference between the 3 ropes being not more than 5%. This is a remarkable
coincidence, since not even the yarn used to make the ropes is from the same
manufacturer or batch.
Although the parallel yarn rope could potentially be stronger than the parallel
strand which in its turn could be stronger than the parallel sub-rope, not all
potential strength is realised due to: variation in yarn strength, variable yarn
slack, load sharing between yarns increasing with complexity of construction,
and termination efficiency.
Based in the results obtained there is no reason to prefer any of the
constructions on the basis of the average strength.
Dividing the specific strength of each rope by the average specific strength of
the yarns in the rope we obtain the tenacity conversion efficiency which tells
us, in absolute terms how well the construction converts the strength of the
fibre. The measured efficiency of the model Superfine was 73.8% and the
efficiency of the model Brascorda Parallel was 70.9%. These results are
numerically equal to the rope tensile strength (based in the fibre cross-
sectional area) divided by the yarn tensile strength on the same area basis.
133
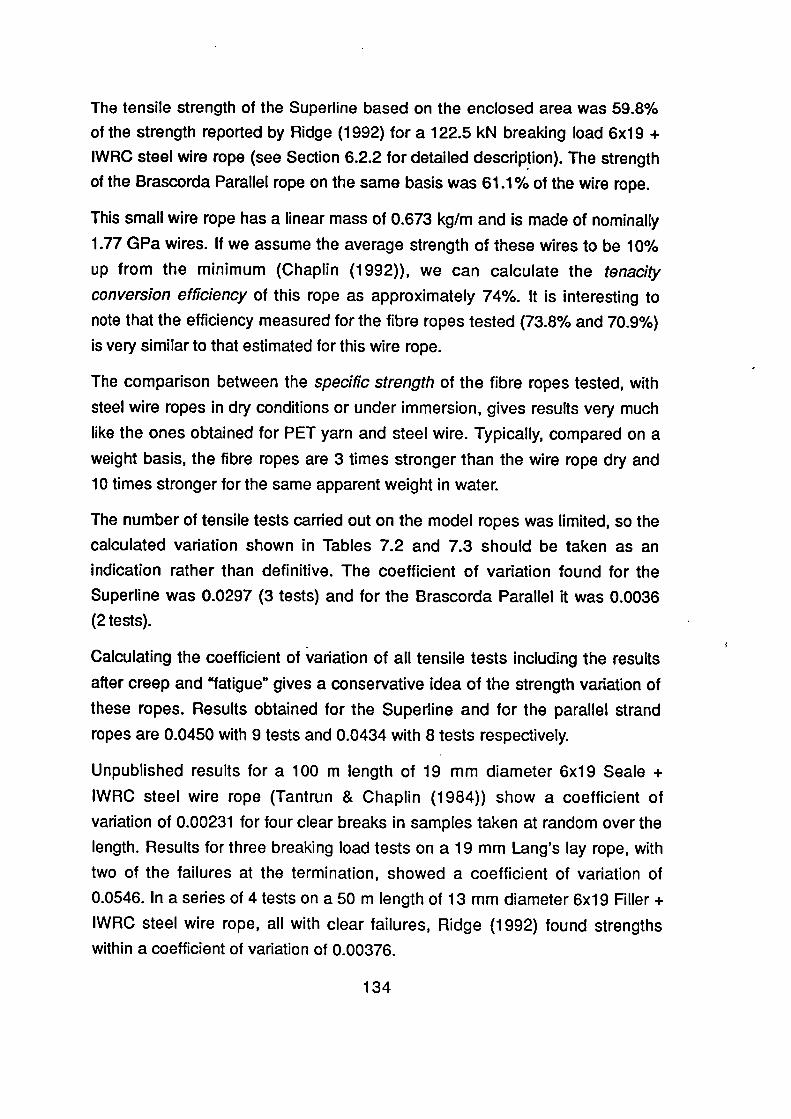
The tensile strength of the Superline based on the enclosed area was 59.8%
of the strength reported by Ridge (1992) for a 122.5 kN breaking load 6x19 +
IWRC steel wire rope (see Section 6.2.2 for detailed description). The strength
of the Brascorda Parallel rope on the same basis was 61.1% of the wire rope.
This small wire rope has a linear mass of 0.673 kg/m and is made of nominally
1.77 GPa wires. If we assume the average strength of these wires to be 10%
up from the minimum (Chaplin (1992)), we can calculate the tenacityconversion efficiency of this rope as approximately 74%. It is interesting to
note that the efficiency measured for the fibre ropes tested (73.8% and 70.9%)
is very similar to that estimated for this wire rope.
The comparison between the specific strength of the fibre ropes tested, with
steel wire ropes in dry conditions or under immersion, gives results very much
like the ones obtained for PET yarn and steel wire. Typically, compared on a
weight basis, the fibre ropes are 3 times stronger than the wire rope dry and
10 times stronger for the same apparent weight in water.
The number of tensile tests carried out on the model ropes was limited, so the
calculated variation shown in Tables 7.2 and 7.3 should be taken as an
indication rather than definitive. The coefficient of variation found for the
Superline was 0.0297 (3 tests) and for the Brascorda Parallel it was 0.0036
(2 tests).
Calculating the coefficient of variation of all tensile tests including the results
after creep and "fatigue" gives a conservative idea of the strength variation of
these ropes. Results obtained for the Superline and for the parallel strand
ropes are 0.0450 with 9 tests and 0.0434 with 8 tests respectively.
Unpublished results for a 100 m length of 19 mm diameter 6x19 Seale +
IWRC steel wire rope (Tantrun & Chaplin (1984)) show a coefficient of
variation of 0.00231 for four clear breaks in samples taken at random over the
length. Results for three breaking load tests on a 19 mm Lang's lay rope, with
two of the failures at the termination, showed a coefficient of variation of
0.0546. In a series of 4 tests on a 50 m length of 13 mm diameter 6x19 Filler +
IWRC steel wire rope, all with clear failures, Ridge (1992) found strengths
within a coefficient of variation of 0.00376.
134

From the results presented, it seems clear that the variation observed in
values of the breaking strength, measured for both model fibre ropes, is
compatible with the termination failures obtained. With termination failures,
one would expect to find a skewed distribution of breaking strengths, however
the limited dataset available did not show skew, and was not large enough to
suggest the use of a particular statistical distribution. Assuming a normal
distribution, 95% confidence limits for all Superline ropes (9) and Brascorda
Parallel ropes (8) would typically be set at ±3.5%. Therefore it is not
unreasonable to expect ( but still to be explicitly proven) that these ropes have
a similar strength variation to steel wire ropes.
The average tensile strength measured for the core only of the Superline
model rope (0.551 GPa) is 6% bigger than the strength reported by Karnoski &
Liu (1988) for a 53 mm diameter 1157 kN breaking load Superline with
braided jacket. Since the tensile stresses in the jacket are substantially lower
than in the core, the difference in core strength between the two ropes is
smaller than 6%.
Considering that a factor of 20 in breaking load exists between these ropes,
and very little change in ultimate tensile stress was observed, it is thought that
a sensible way to estimate the average tensile strength of ropes, with breaking
loads between 3000 kN and 6000 kN, is to put a penalty of 10% on the
average strength obtained for the model rope, i.e. to assume an average
strength of 0.496 GPa. Based on the scatter measured in this study, it is
considered that a sensible minimum strength to be used for design purposes,
with PET Superline ropes is 0.446 GPa, i.e. 90% of 0.496 GPa.
Using the same procedure for the Brascorda Parallel, parallel strand rope, it is
assumed that such ropes, in a size compatible with a mooring application, will
have an average tensile strength of 0.507 GPa and for design purposes a
strength of 0.457 GPa should be used.
If the same procedure is applied to the data obtained by Crawford & McTernan
(1988) for a 128 kN PET parallel yarn Parafil, the average tensile strength of
large PET Parafil ropes would be estimated as 0.493 GPa and the strength to
be used for design would be 0.444 GPa. This is only 2.8% greater than the
135

0.432 GPa quoted by Linear Composites Ltd. (1983).
It should be noted that using this procedure to obtain the strength of scaled up
Parafil and Brascorda Parallel ropes has no experimental support. Test on a
larger scale are needed to confirm these assumptions. For the time being it
seems unrealistic to consider that any of these 3 ropes has a tensile strength
greater than the others, and it is therefore thought reasonable to consider that
large ropes of any of these constructions have a minimum breaking strength of
0.44 GPa.
Elongation during installation
Elongation measured for the model Superline in the "installation" cycle
averaged 8.6%. This result is lower than the elongation of 11.3% observed in
H&T Marlow (1985) for a single loading to 50% of the breaking load in a new
rope. This is not unexpected since the model rope, like ropes for spread
mooring systems, have been manufactured with lower twist angles than
standard products.
Based on this figure it is thought safe to use an upper steel component
between the fibre rope and the fairlead with an initial length of 13% (1.5 x
8.6%) of the length of fibre rope, plus the take-up due to the change in
geometry in the lower component catenary, plus an a fixed length to account
for rope movement during anchor bedding in.
The elongation measured for the Brascorda Parallel model rope during the
installation cycle was 8.0%. Using a similar reasoning as for the Superline, it
is considered that a safe initial length for the upper component would be 12%
(1.5 x 8.0%) of the fibre rope length plus the same allowances described for
the Superline.
8.2 Stiffness and Hysteresis
8.2.1 Yarn Stiffness
The dynamic modulus measured for PET yarn at the lowest mean stress,
0.055 GPa, at the lowest frequency investigated in this study (0.005 Hz) was
136

18.27 GPa and the value indicated by the regression equation developed is
17.91 GPa. The static modulus reported by Hadley et al. (1969) for highly
drawn PET filament at very low mean and range of stresses was ca. 18 GPa.
Considering that Hadley's paper gives no indication of the precise stresses
used and that characteristics of the polymer, such as molecular weight,
distribution are certainly different from the material tested in this study, we can
consider the agreement between the results good.
Results reported by Van Der Meer (1970) for another PET yarn tested at 10 Hz
at varying mean stresses are in quite good agreement with the values now
measured. For example, at a mean stress of 0.22 GPa and for a frequency of
10 Hz the regression equation obtained in this study (note the extrapolation)
indicates a modulus of 23.1 GPa, while the value measured by Van Der Meer
was ca. 25 GPa.
Rim & Nelson (1991) cycling a PET tire yarn at 10 Hz between fixed strain
limits corresponding to ca. 1.25% and 3.75% of the breaking load measured a
modulus of 12.3 GPa while the regression equation now obtained indicates a
value of 13.4 GPa. The difference is acceptable since the yarn tested is not
exactly the same and the equation is being used as an extrapolation from
experimental data.
Due to variable yarn slack in the rope, the dynamic modulus of parallel yarn
ropes should fall slightly below the dynamic modulus of its constituent yarns,
for the same average stress condition in the filaments.
For the Parafil rope tested by Crawford & McTernan (1988) average tensile
strength was 75% of the yarn strength (on a fibre area basis): So when the
stress in the rope is say 20% of its breaking strength, the average stress in the
yarns is 0.75 x 20% of their breaking strength. The same factor applies to the
stress amplitude. Rewriting the yarn stiffness regression equation
(Section 7.2.1, equation (1)) taking this into account, we get an expression for
the maximum specific modulus of a PET Parafil having no yarn slack:
SM = 13.41 + 0.75. (0.1778. Lm- 0.1756. La) - 0.3835. Log T
where:
137

SM = specific modulus (in N/tex);
Lm = mean load (in % of the ultimate breaking load of the rope);
La = load amplitude (in % of UBL); and,
T = period (in seconds).
Incorporating the filling factor of 70% given by the manufacturer and taking
into account the material density we can obtain an estimate for the Young's
modulus of PET Parafil (Er) based on the enclosed area of the core as:
Er= (13.41 + 0.75. (0.1778. L m- 0.1756. La) - 0.3835. Log T) . 0.966
This equation produces values for modulus between those obtained for the
parallel strand rope (with a single twist operation) and the values measured
for PET yarn, and can be used as a sensible approximation in the absence of
experimental results for PET Parafil ropes. The results so obtained probably
overestimate the modulus, since yarn slack is not taken into account, and
should give conservative results when calculating wave frequency line
tensions.
8.2.2 Rope Stiffness
8.2.2.1 Wave Frequency and Low Frequency
"As Installed"
Results obtained for both model ropes, in the "as installed" condition, showed
clearly that dynamic modulus is a function of the previous history of loading
seen by the rope. A multivariate linear regression of the data obtained was
performed for each rope, to even out the influence of the particular loading
history used in the measurements, with time being considered on a
logarithmic scale. The equations obtained (one for each rope, below referred
to as "the regression equations") were statistically very significant (better than
99.9%). Significance obtained as measured by the F-statistic parameter was
better than obtained by Bitting (1980), who had incorporated quadratic
elements in his analysis. In agreement with Bitting (1980), the regression
138

equations indicate that, over the range of parameters investigated, the
stronger influence is caused by the mean load, followed by the load range
(twice the load amplitude used in the regression equations). The influence of
frequency was much smaller, with typically less than 10% difference in
modulus between wave frequency and low frequency results.
Young's modulus obtained for the model Superline was ca. 3.3 times the
values observed by Bitting (1980) for double braided PET ropes of similar
size, cycled at wave frequency. The parallel strand rope results were ca. 4
times Bitting's values. Results reported by Toomey et al (1990), also for double
braided ropes, were higher than Bitting's results but still well below the values
obtained here. The model Superline was approximately 2.2 times as stiff as
Toomey's double braid. The Brascorda Parallel was ca. 2.6 times as stiff.
These results clearly demonstrate that, contrary to what was suggested by
Flory et al. (1988), rope structure is a dominant parameter on the dynamic
stiffness of worked fibre ropes.
Karnoski & Liu (1988) found a Young's modulus of 8.4 GPa for a 53 mm
diameter Superline, including the braided jacket, cycled between 8% and
50% of its breaking load with a 10 s period. Making some reasonable
assumptions about the jacket characteristics the calculated modulus for the
rope core would be 9.6 GPa. Using the regression equation for the model
Superline gives a Young's modulus of 10.3 GPa, a bit higher but still in quite
good agreement with Karnoski & Liu (1988).
The results obtained here for the Superline rope reinforce the warning about
the use of the model presented by Ractliffe & Parsey (1985) because of the
rather low values of Young's modulus that it can produce.
The modulus now measured for the Brascorda Parallel model rope was about
15% lower than measured for the 40 kN rope with the same construction,
tested in the "pilot study". This difference draws attention to the
approximations that are made when basing the stiffness on the enclosed area,
particularly of a small diameter rope. It is considered that more consistency
can be obtained if specific stiffness is used instead.
Bearing in mind the simplicity of the rope constructions, especially of the
139

parallel strand rope, and the relatively low twist employed in their construction,
it is considered reasonable to model the equivalent stiffness of each rope in
terms of the yarn regression equation. The model used considered no
variation of rope diameter with load, each strand as a twisted yarn and, for the
Superline, approximated each 3-strand rope as a yarn made of three
filaments.
As explained in Appendix 3, under these assumptions, the equivalent specific
stiffness of the Superline parallel sub-rope construction (Es p) can be
approximated by:
E= E. cos2 a. cos2 [3,
and the equivalent specific stiffness of the Brascorda Parallel rope (Em) can
be approximated by:
EEp= E. cos2a,
where:
Ey is the specific modulus of the yarn, from Section 7.2.1 equation (1);
a is the helix angle of the outermost yarns in the strand; and,
(3 is the helix angle of the strands.
The values of mean load and load range to be used in Section 7.2.1
equation (1) to obtain Ey can be obtained by using equation (16) and (13) from
Appendix 3, respectively for the Superline and the Brascorda Parallel ropes.
Figure 8.1 is a plot of the specific modulus obtained using this model versus
specific modulus measured for both ropes (actually the values interpreted via
the rope regression equations). The assumptions made are such that results
are always conservative. Better results are obtained for the parallel strand
rope that has the simplest geometry.
Modelled results converge to the measured results for the high values of
specific modulus which correspond to high mean loads and small load
ranges. Global Maritime Ltd. (1989,1) calculated typical mean loads in
mooring lines under extreme conditions between 35% and 45 To of the
minimum rope breaking load. The amplitudes of line tension were calculated
140

to be between 15% (500 m water depth, North Sea) and 2% of MBL (2000 m,
Campos Basin). In this range of conditions, modelled results for the Superline
are between 5% and 18% greater than the measured modulus. For the
Brascorda Parallel the model overestimates the modulus by between 1% and
11°A.
In the absence of test data for a particular parallel sub-rope or parallel strand
rope, conservative stiffness data in the "as installed" condition can be
obtained from the yarn data given a knowledge of: rope construction
geometry, average breaking load and mass per unit length.
"After Fatigue"
Results of wave frequency modulus measured after fatigue cycling showed
that there is a limited amount of stiffening (about 6%) associated with long
term cycling at a constant load level. It was also observed that, as soon as the
conditions were changed, stiffness converged very quickly to the values
obtainable from the regression equations for the "as installed" condition.
Considering that long term cycling under constant loading conditions is
completely artificial as far as the real application is concerned, it can be
concluded that no stiffening should be considered in association with fatigue
loading.
"After Creep"
Wave frequency modulus values at 20 ± 10% of UBL, after creep testing at
30% of UBL, were found to be 4 to 7% lower than those indicated by the
regression equations for the as installed condition. Two alternative
explanations can be suggested for these results:
(i) either any stiffening that might have happened during the creep test
has disappeared in removing the rope from the creep testing
machine and taking it to the servo-hydraulic tester; or,
(ii) because the rope has been under a constant load of 30% of BL it
has set at this mean load and upon cycling at a lower mean load
behave in a more compliant manner.
The second explanation is more likely to be the principal cause of the lower
141

modulus measured after creep since it agrees with the findings in the after
fatigue condition, where for example, coming from a loading at 20 ± 10% of
UBL, to cycling at 10 ± 5% of UBL produced a stiffness lower than the fitted
data for the as installed condition.
For the amount of variation measured after creep and considering the
discussion above, it can be concluded that, for design purposes, there is no
need to correct the values for stiffness obtained in the as installedcondition for
the effect of long term constant loads.
8.2.2.2 Quasi-static
A simulated quasi-static load cycle was defined in terms of a typical reversal of
load between 10% and 30% of UBL taking place over a period of one week
with 3 days plateaux at both load extremes. Stiffness was measured as the
secant modulus between the extreme elongation data points. The values
obtained provide a realistic assessment of the apparent quasi-static modulus
shown by these rope constructions in a spread mooring application. This
experimental approach bunches together the time dependent a load
dependent behaviour of the tether (material plus construction). An analytical
modelling of this behaviour was out of the scope of this study but should be
considered for further work. There are no results for similar conditions
available in the literature for comparison purposes.
Results obtained for the two ropes were 7.32 GPa and 9.66 GPa for the
Superline and the Brascorda Parallel respectively These are about half the
values obtained for typical wave frequency storm conditions. It is strongly
suggested that these figures are taken into account when verifying the offset
performance of any mooring system incorporating these materials.
Table 8.1 shows selected values for Young's modulus and specific modulus of
both ropes for typical: "installation", quasi-static, wave and low frequency
regimes. Bearing in mind that the "installation" condition is only relevant to
size the upper steel component, the range of modulus to be taken into account
in a mooring analysis would be from 9.66 GPa to 19.16 GPa for a Brascorda
142

Parallel parallel strand rope and from 7.32 GPa to 16.29 GPa for a Superline
parallel sub-rope construction. This subject is discussed in more detail in
Chapter 9.
8.2.3 Hysteresis
Figure 8.2 shows the damping measured for the PET Superline in terms of
the loss coefficient as a function of the number of cycles performed at 20 ±
10% of UBL. A tendency for a constant or almost constant loss coefficient after
about 300 cycles was observed. A similar levelling off has been reported by
Parsey (1983) for eight strand plaited polyester ropes and by Kenney (1983)
for polyester yarn. The loss factor obtained, 0.03, is typically 5 times lower
than reported by Parsey for 8 strand ropes. This difference seems plausible,
since the rope tested here has a much simpler construction and is much less
compliant. The results obtained in this study are in agreement with the
preliminary measurements taken in the preparatory work, reported in
Section 4.6.9, for a 9.5 mm diameter parallel strand rope. The later is a slightly
stiffer construction, in a smaller diameter, which gave a loss factor of
approximately 0.02.
The results obtained for both the model Superline now tested, and the 9.5 mm
diameter parallel strand rope previously tested are within the range of loss
factors reported by Van Der Meer (1970), 0.013 to 0.035, and Rim & Nelson
(1991), 0.02 to 0.03, for polyester yarns. This shows that, at least for small
ropes, the hysteretic damping observed in low twist almost parallel
constructions is mainly due to material damping.
The increased damping observed when using stroke as a measurement of
displacement (Table 7.10) is compatible with the small test piece size but also
provides a warning about the increased friction present at the cylindrical
section of the socket, where minor abrasion damage was observed after the 1
million cycle "fatigue" tests.
The hysteretic damping of the steel wire rope was only measured once at 100
cycles indicating a loss coefficient of 0.0616. According to Casey (1988) the
143

loss factor of steel wire ropes under cyclic tension levels off in a similar way as
reported for PET ropes (Parsey (1983)). Stabilised levels between 40 and
70% of the hysteresis measured in the first few cycles are reported by Casey
(1988).
Although there might be a scaling up effect in the hysteresis of parallel strand
and parallel sub-rope PET fibre ropes, the value of loss coefficient measured
for the small wire rope, 0.0616, being about twice of the value measured for
the Superline model rope, practically rules out any worries that tether
"internal" damping would be high enough to be of significance when
compared with hydrodynamic damping, in systems incorporating a catenary in
the lower steel tether component.
Another concern inherent to fibre ropes is overheating of the rope core due to
hysteresis. Considering that the rope is immersed in water, its surface will
loose heat by convection to the water at a rate, q, given by Holman (1987):
q = h . A . (Tw - T.,) (1),
where:
q = heat transfer rate per unit length of rope;
h = convection heat transfer coefficient;
A = external area per unit length of rope;
Tw = temperature of the rope wall; and,
Tc.= is the water temperature remote from the rope.
The temperature in the centre of the rope (To), in its turn, can be estimated by
its difference to the rope wall temperature (Tw) which is given by Holman
(1987):
To - Tw = (el . R2) / (4. k) (2);
where:
q = heat generated by unit volume;
R = radius of the rope; and,
k = thermal conductivity.
Considering the almost straight line obtained in the loading portion of the
cyclic tension versus strain plot for both model ropes, di can be calculated as:
144

Ci.(tanD.7c/2 ).(Aa.e/2). 1/T (3);
where:
tanD = loss coefficient;
Au= cyclic stress range;
e = strain range; and,
T = cyclic period.
Using: a loss coefficient of 0.03 (as measured for the Superline model rope), a
typical storm RMS stress range of 10.7% of the minimum breaking strength
(Global Maritime Ltd. (1989,1)) with MBL taken as 0.445 GPa (Section 8.1.2),
a strain range of 0.375% as measured for the Superline when cycled between
45 and 55% of UBL, and a period of 17 s, equation (3) gives:
4 . 247.5 W/m3(4).
A rope with a breaking load of about 5000 kN will typically have a radius (R) of
72,5 mm (including an allowance for a cover). For such a rope, the heat
transfer rate per unit length would be:
q . 4.09 W/m (5)-
Using the lowest value of heat transfer coefficient measured by Li et al (1990),
i.e. h = 1000 W/m.°C (to be conservative), an external area per unit length of
rope (A) of 0.456 m 2/m, and (5) in (1), we get:
;- T., = 0.009°C,
confirming Li's conclusion that the wall temperature of the rope can be taken
as the water temperature.
To estimate To - T w we will use the thermal conductivity (k) of 0.17 W/m.°C
measured by Parsey (1983) for a dry PET yarn. This assumption is
conservative for a rope that has not got a water tight jacket or is flooded.
Substituting q from (5), k as above and R (72,5 mm) in (2) we find:
To - Tw = 1.9°C.
Therefore we can conclude that the Superline parallel sub-rope will not suffer
145

excessive heating of the core under the worst storm conditions envisaged.-
Considering the hysteresis results previously obtained for the Brascorda
Parallel rope, and the absence of twisted structure in the Parafil parallel yarn
ropes it can safely be concluded that these ropes will operate at even lower
core temperatures, and will have an internal damping less significant in terms
of the hydrodynamic line damping, than the Superline ropes.
8.3 Creep and Environmental Assisted degradation
8.3.1 Yarn
8.3.1.1 Creep
Creep results obtained in both the one week and the three months tests
confirmed the trend reported by ENKA (1985,3), Tabor & Wagenmakers
(1991) and Oudet & Bunsell (1987) of decreasing strain rate with the logarithm
of time, which was not observed by E. I. du Pont de Nemours & Co. (1987).
The strain measured in the short term test, performed in the universal testing
machine was typically 5% higher than under the dead weight for the same
elapsed time. This difference is compatible with the test methods used,
especially if we consider how the gauge length was measured. It should be
kept in mind that the accuracy of the 3 month test is better than the 1 week test
since the former has a properly defined gauge length. The reason for
performing the short term test, was to be able to investigate the variation in
strain rate during the initial phase of loading when optical measurements are
too slow to be meaningful.
Figure 8.3 shows the results obtained at a dead weight loading of 30% of YBL,
together with data obtained by ENKA (1985,3) at 20 and 30% of YBL. The
agreement is surprisingly good, if we consider that the yarn tested in this
investigation has been manufactured at least 5 years later than that tested by
ENKA. It is also worth noting the agreement obtained on the creep rates. For
example between 103 and 104 s ENKA reported a strain of 0.13% while 0.12%
has now been measured.
146

Using the data available for the polyester yarn it is possible to estimate the
elongation under constant load of a PET parallel yarn Parafil rope.
Considering that the average strain in the yarns of a Parafil rope is the same
as the strain in the rope, rope failure could happen by phenomena happening
in the terminations or by imbalances in the strength or in the slack of the yarns
in the rope. If we assume the average rope strength to be 0.783 GPa (as
measured by Crawford & McTernan (1988)) and the yarn strength to be 1.10
GPa, as typically found in this study, the average tensile stress in the yarns of
a PET Parafil rope would be about 71% of the rope stress (based on the
actual cross-sectional area of fibre).
Rope elongation will be the sum of average yarn elongation plus an increase
in length due to variable yarn slack in the rope. Considering that Parafil ropes
are also manufactured from quite stiff fibres, such as high modulus aramids,
with an average failure strain of only 2.5%, it is clear that the manufacturing
process cannot allow large yarn slacks to develop, otherwise the behaviour of
such rope would be disappointing, which is not the case ( Linear Composites
Ltd. (undated). Under these circumstances it is reasonable to assume that
average yarn slack does not exceed 1%.
So an estimate of the total creep elongation on a Parafil rope can be obtained
by adding 1%. i.e. 10000 liz to the yarn elongation under creep at a tensile
stress equal to the rope stress. Expressed as a percentage of YBL, the yarn
stress will correspond to 71% of the tensile stress in the rope, expressed as a
percentage of the ultimate breaking load of the rope.
For example, creep elongation of a PET Parafil rope at a load corresponding
to 30% of its breaking strength will be approximately 1% plus the yarn strain at
a stress of 21.3% of the average yarn breaking strength. Interpolating from
ENKA data at 20% and 30%, total strain in the Parafil rope at 10 4 seconds for
example would be about 4.8% (and of course not less than the yarn strain at
21.3% of YBL, i.e. 3.8%).
The creep rates measured in this study for a load of 30% of YBL for periods of
time longer than 1 day (see Table 7.13) are lower (as low as half, after 1
month) than the creep rate reported for a 3 tonne Parafil loaded at 40% of its
147

nominal breaking load. However the precision of the results presented by
Linear Composites Ltd. (1983) is such that it is not possible to draw any further
conclusion from the values quoted.
8.3.1.2 Environmentally Assisted Degradation
The quantitative assessment of yarn degradation due to hydrolysis proved
more difficult than originally thought. The main problem encountered in this
task was to obtain relevant data from tests performed for a relatively short
period of time (one year) on a variable that changes very slowly with time, in
comparison with the statistical variation in the measured values.
An additional difficulty observed was the growth of crystals on the exposed
surface of the yarn samples in artificial sea water at all temperatures but 4°C.
This is similar to what is observed on fixed sea structures (Chandler (1985)).
As observed in a yarn where crystals have been mechanically removed, the
filaments that where positioned out of the yarn periphery where found to have
an insignificant amount of crystals. Although crystal growth presented a
problem in the test programme, it made clear that maintaining a minimum
tension in the rope would probably be extremely beneficial, minimising crystal
growth inside the rope structure.
Dissolution of the crystals by a mild acid solution, after the constant load was
removed and before performing the break load test, was only a partial solution
to the problem of yarn damage induced by the crystals. Since they adhere to
the yarn when stretched by between 3.5% and 7%, and since upon load
removal about half of this strain was recovered almost immediately, some
damage must have been inflicted on the yarn before the crystals were
dissolved.
Mechanical measurements of elongation made on some yarn samples,
although carefully executed, introduced damage in the filaments resulting in
poor retained strength.
This was observed mostly in yarns which were kept under load in air. An
additional series of tests was performed, without measuring yarn elongation,
148

and no strength reduction was observed. Since the first series did not show
any influence of creep load, the second series was kept under a very small
constant load.
A series of statistical analyses was performed on the data obtained. For each
temperature, the correlation between breaking load and: creep load, time
under load and ambient, was investigated. Statistical significance was set at a
95% level for a two-tailled distribution. The main findings of these analyses
are listed below:
(i) Data from samples at 4°C showed very low negative correlation
between breaking load and both creep load and time under load.
The correlation between breaking load and the ambient (deionised
or sea water) was null. After one year the average retained
strength was 1% lower than the average strength of the new
samples tested wet (shown in Table 7.1, series 8, line 2). This
difference was not significant at a 95% level.
(ii) Considering all samples kept at 20°C together, a significant
negative correlation was found between breaking load and time
under load. This correlation becomes non significant when the
samples in air are removed from the dataset. Since the elongation
of the air samples was measured more often than any other
samples, it is suspected that they had been accidentally damaged.
(iii) An additional set of 5 samples was kept in air for 3 months, without
being measured. The average retained strength of these samples
(Table 7.1, series 8, line 3) was significantly higher (3.4%) than
when new (Table 7.1, series 8, line 2). Results presented in
Table 7.1 , series 8, line 2, were taken as the reference for all
further comparisons in this chapter (5 tests, 86.3 N average
breaking load and standard deviation of 1.75N).
(iv) A single sample broke clear of the terminations after 1 year in DIW
at a load of 86 N. This result does not indicate a signcant
degradation.
(v) Samples that stayed in artificial seawater for 1 year at 20°C and
149

30°C had average breaking loads of 81.8N and 84.0N,
significantly lower than the reference dataset. Considering the
level of crystalline precipitation on these samples, and the fact that
the available literature (McMahon et al (1959) and ICI (undated))
reports that hydrolytic degradation increases exponentially with
temperature, it is concluded that the strength degradation
observed was certainly not caused by hydrolysis but probably due
to damage inflicted by the crystals during yarn unloading.
(vi) Samples at 30°C in DIW showed quite low retained strength
(average breaking load of 82.6 N, 96% of the average breaking
load), especially the two samples that were loaded for one year
(with breaking loads of 77 and 82 N). It is thought that the low
values obtained are due to mechanical damage when measuring
elongation. This DIW tank also showed algae growth. This was
observed when removing the samples, which were slippery, and
verified with the optical microscope.
(vii) Samples in the 40°C tank that overheated (13 samples) were
plastically elongated by up to 30 mm, and drawing only stopped
when the dead weights touched the bottom of the tank. Even under
these extremely severe conditions, the average retained strength
was 83.69N, i.e. a significant reduction of 3% when compared with
the reference data base.
(viii) Three samples remained for 3 months in the 40°C tank and were
removed for assessment of residual strength before the tank
overheated. The average retained strength of these samples was
86.83N, 0.6% higher than the average of the reference dataset.
In a final attempt to identify and quantify any degradation effect due to
hydrolysis the data obtained for samples in deionised and sea water was
analysed separately. At a level of significance of 5% no correlation was found
in either dataset between retained strength and: temperature, creep load or
time under load.
Since no deleterious influence of sea water, as opposed to deionised water,
150

was found in the tests conducted at 4°C (where no crystal growth was
observed) it is recommended that further testing for assessment of the
hydrolysis of PET fibres, to be used for ropes operated permanently
submerged in sea water, should be conducted in deionised water. For long
term testing, consideration should be given to using some form of algae killing
product provided that it is harmless to the fibre, or to running the tests in the
dark. From the great quantity of algae found on the 3 month retest samples in
DIW, where plenty of light was available, compared with the much smaller
amount found in the 1 year test, where lighting conditions were substantially
reduced by the tank cover, it seems that light control can be an effective way of
avoiding algae growth.
Comparing the results now obtained with predictions based on equations (5)
and (6) in Section 4.4 (deduced from McMahon et at (1959), and from ICI
(undated), respectively), it is apparent that the ICI (undated) recommendations
are too conservative.
For example, samples kept at 40°C for 3 months showed a marginal gain in
strength of 0.6% over the reference dataset, which is well within one standard
deviation. The equation derived from McMahon et at (1959) predicts a
strength loss of 0.12% and is clearly compatible with the data measured,
considering that their results are for a PET yarn produced around 1958.
It should be noted that the yarn tested in this study has an average molecular
weight of 17000, higher than the yarn tested by McMahon et al (1959) at
15600. Furthermore high tenacity yarns currently in production have higher
proportions of crystalline phase than the early, but never the less high quality,
yarn tested by McMahon et al. From these differences it would be expected
that, if there was any difference in sensitivity to hydrolysis, the yarn now tested
would perform better than the material tested by McMahon et al.
However the predicted strength loss using ICI recommendation would be
2.3%, which seems very unlikely even considering the scatter in the results
now obtained.
151

8.3.2 Rope
8.3.2.1 Creep
Results obtained for 7 of the 8 rope creep tests executed were very consistent.
Due to an imprecision in load measurement the 3 month Superline sample
was loaded at 31.4% of UBL instead of 30% of UBL. Resulting from this error,
strain on this sample over the measurement time was typically 400011E higher
than the average of the other 3 samples. The strain observed in this test has
not been taken into account in the following discussion.
Figure 8.4 shows the strain data obtained for the seven consistent rope tests.
The strain is already 5.5% for the parallel sub-rope construction, after the first
100 seconds, while for the parallel strand rope it is only c.a. 4%. This
difference is maintained almost at the same level to the end of the tests with a
strain after one year of 7.1% for the Superline and 5.8% for the Brascorda
Parallel. This difference is due to the higher initial constructional
accommodation afforded by the Superline rope, that has one more twist
operation and higher twist angles. Twist migration and lateral contraction are
the major accommodation mechanisms.
In addition, we can observe a pronounced tendency for reduction in strain
rate, mainly in the Brascorda Parallel rope samples, at about 10 6 s (12 days).
Initial differences in slack between the strands, clearly observed in the
samples, are thought to be the reason for this behaviour. This is considered to
be a manufacturing problem that could be overcome by a better tension
control in the strands during rope making. A less likely, but possible,
explanation for the tendency of lowering strain rates would be a prolonged
bedding in of the terminations.
This observation highlights the advantage of using PET fibre over stiffer
materials such as aramids. The former can easily cope with construction
imbalances of the order of 1% without any significant problem. Such a
difference would have serious consequences for aramid, because of its low
failure strain.
152

For comparison with published data, we can consider typical creep rates (after
equalisation of constructional imbalances) to be about 0.25% and 0.20% per
decade for the parallel sub-rope and the parallel strand ropes respectively.
These rates are 2.8 and 2.2 times the rate reported by Linear Composites Ltd.
(1983) for a similar sized PET parallel lay rope at 40% of UBL.
These results are compatible since: the ropes tested here are more compliant
due to the constructional twist, and the loading used was lower than that used
by Linear Composites Ltd. (1983). As already mentioned PET fibres show
decreasing creep rates with load, for tensions between 15% and 50% of UBL.
Strain rates now measured for the Superline and the Brascorda Parallel ropes
are respectively 2.0 and 1.6 times the rates reported by Lewis (1982) for a
Kevlar 29 aramid wire rope construction tested at 40% of UBL. The
construction of this aramid rope has a similar compliance to that of the ropes
tested here. The lower creep rate observed by Lewis is explained by the
difference in creep rate between aramid and PET fibres and by the smaller
diameter (6.35 mm) of the aramid rope.
In view of the tendency for strain rates reducing with load discussed above,
the regression equations (1) and (2) from Section 7.3.2.1 (seen in Figure 8.4)
for both model ropes will provide conservative results for moderate
extrapolations. Considering the behaviour observed for PET yarns subjected
to loads of up to 40% of YBL for up to one year at 30°C it seems unlikely that,
at a load level of 30% of UBL, strain rates in these ropes could pick up for at
least another decade, i.e. 10 years. It should be noted that BS 4618 (1970)
states that the extrapolation of creep data should not exceed one time decade.
Although the ropes tested were meant to model larger ropes, it is considered
that, until data on full size mooring ropes is available, a safe approach would
be to allow for a 10% greater strain in these, full size ropes, than measured in
the model ropes. Table 8.2 shows suggested creep strains to be used in the
design of mooring systems incorporating parallel sub-rope (Superline), and
parallel strand (Brascorda Parallel) ropes. Also included are suggested creep
strains for a parallel yarn (Parafil) rope, based on the PET yarn creep data
obtained, and considering an average yarn slack of 1%.
153

To give a better illustration of the significance of these results, the actual rope
elongation was calculated for a 2500 m Superline at an average tension of
30% of UBL, as might be used for a mooring in 1000 m water depth. In the first
hour, stretch would be about 170 m most of which (c.a. 130 m) would take
place in the first minute.
During the rest of the first 24 hours, elongation would increase by about 13 m.
At the end of the first month another 10 m of stretch would have occurred, an
additional 6 m by the end of the first year and a further 5 m over the next 9
years.
The mooring system concept on which most attention has been focused
incorporates a substantial amount of chain as the lower component. Fibre
rope elongation will be absorbed by the combined mooring line as a decrease
in the length of chain lifted off the seafloor and as tension reduction of the line.
As a guide for operational procedures, a sensible maximum pretension loss
due to creep between retensionings would be 5% of the UBL. At a typical
breaking load of 5000 kN and for mooring stiffness between 50 and 300
kN/m (Global Maritime Ltd. (1989,1)), retensioning would need to take place
after elongations varying between 0.8 and 5 m.
For a Superline in 2500 m of water depth at an average tension level of 30%
of UBL this would mean between 7 and 41 retensioning operations in 10
years after the first hour. If we assume a line stiffness of 145 kN/m 20
retensionings are going to be needed in ten years, then 7 would need to take
place in the first day, another 6 would be needed in the next 29 days, 4 would
be spread over the next 11 months, completing the first year and only 3 more
would have to be performed over the remaining 9 years.
The maximum strains for both ropes after 10 years at 30% of UBL, which is a
fairly high mean load, would be about 85% of the respective "installation"
strain. It is then concluded that, under normal pretensions, creep is not the
dominant parameter in defining the length of the upper steel component to
avoid the connection to the fibre rope reaching the fairlead.
If the actual installation procedure of the mooring line is similar to that
154

assumed, i.e after being at 50% of UBL for c.a. 30 minutes, the load is
released to 30% of UBL, the strain soon after the rope is relaxed to 30% of
UBL will already be about 7.6%, equivalent to an elapsed time of 1 month at
30% of UBL.
If after the installation procedure the mooring line is operated at 30% of its
ultimate breaking load, the rope will initially experience a slight rope recovery
followed by a slow creep tending to follow the creep strain curves observed.
Under these circumstances, 10 years after the operating pretension load was
reached, total strain would only be about 0.5% (in the example 12.5 m) for
both ropes, and retensioning would only be necessary a very few times during
the service life time of the rope (seven times for the example given above).
8.3.2.2 Environmental assisted degradation
The residual strength measured after one year at a constant load of 30% of
UBL was 97.6% of the average breaking load "as new" for the Superline and
100.6% for the Brascorda Parallel model ropes, when compared with the
average strength "as new". The average retained strength of the 4 Superline
samples after creep over periods from 1 month to 1 year was 95.2% and the
average retained strength of the corresponding Brascorda Parallel samples
was 100.3%, both compared with their respective average results "as new".
Figure 8.5 shows the retained breaking load of all samples tested plotted
versus time under constant load. The valid breaking load results for the as
new rope samples are also shown in Figure 8.5 at zero time.
The results for both ropes do not show any obvious apparent trend of a loss in
retained strength with time under load.
Taking into account that the strength degradation behaviour of polyester yarn
was found by McMahon et al (1959) and by ICI (undated) to be a linear
function of time, a linear regression of the results obtained was attempted.
Each rope construction was considered separately. The valid data for the
samples tested "as new" was also taken into account. A total of seven data
points was then available for the Superline and six results for the Brascorda
155

Parallel model rope. The regressions equations obtained are also shown in
figure 8.5.
The correlations obtained were very weak, which is justified by the small
amount of degradation expected in comparison with the typical scatter in
strength determinations for fibre ropes. The average strength degradation of
the parallel strand rope was marginally negative, as shown by the positive
slope of the regression equation, indicating a gain in strength with time under
load in water. For the parallel sub-rope construction, a very small tendency for
degradation was observed, as shown by the respective regression equation.
In an attempt to enhance our knowledge of the degradation process the data
for both ropes was analysed in combination. This was done by normalising
the breaking loads measured for each sample by the average new breaking
load of that rope type. Results are plotted in Figure 8.6 and a linear regression
of the data indicates again no correlation between time and retained strength.
However it is worth noting that the regression equations of both ropes, tested
wet, and the combined equation for the normalised data, indicate an average
breaking load slightly below the average of the new samples, tested dry. This
would mean an immediate negative influence of water immersion on rope
strength. Considering the results obtained in the yarn testing programme, the
relatively small number of tests now carried on in ropes, and the fact that this
effect has never been reported in the literature, it is thought that this indication
is most probably due to scatter in the test data.
The results obtained indicate that the loss in strength measured by Bitting
(1980), i.e. 10% per year for double braided PET ropes and 4.8% per year for
8 strand PET ropes, was not due to hydrolysis of the fibres.
The observations made in this testing programme, concerning the retained
strength of yarns and ropes after immersion for up to one year in artificial
seawater under various constant loads, do not contradict the result reported
by Linear Composites Ltd. (1983) of no strength loss on a parallel yarn
polyester rope (Parafil) recovered from the sea after 10 years.
Predictions based on McMahon et al. (1959) data and ICI (undated), for a
duration of ten years, assuming a water temperature of 20°C, would be of
156

strength losses of 0.63% and 19.2% respectively.
Having calculated the maximum increase in rope core temperature under
centenary storm conditions in the most severe location, and for the rope with
highest hysteresis, to be equal to 1.9°C (see Section 8.2.3), we can consider
that the rope temperature will be equal to the water temperature for the
purpose of estimating hydrolysis degradation. Typical maximum design
temperature for the North Sea is approximately 20°C and for Campos Basin it
is 27°C (Petrobras S.A. (1991)).
As far as mooring applications are concerned the results obtained in this work
in conjunction with published data show that environmentally assisted
degradation does not significantly reduce the breaking strength of the ropes
tested over a period of one year. The trends obtained suggest that an
assumption of a linear rate of 1% strength loss per year is safe for long term
installations. It is felt that applications with longer design life, say 25 years,
would grant additional testing to a duration of up to 5 years.
8.4 "Fatigue"
After 1 million cycles under conditions equivalent to a 3 hour storm that,
statistically, would happen once in 100 years in the West of Shetlands, the
average retained strength of the 2 samples of the model Superline, cycled for
1 million cycles at 20 ± 10% of its breaking load, was 97.9%.
Two samples of the Brascorda Parallel rope, after the same treatment,
retained 95.2% of their original average strength.
The average retained strength of both ropes after cycling is compatible with
the 93% residual strength measured by Karnoski & Liu (1988), after 2 million
cycles between 8 and 25% of UBL, on a 1157 kN breaking load PET
Superline.
Considering the results obtained by Karnoski & Liu (1988) for a 1000 kN
breaking load Kevlar 29 aramid Parafil, the present results indicate that PET
ropes of parallel sub-rope construction, using either resin socket or splice
terminations, behave better than parallel yarn aramid ropes terminated with
157

spike and cone fittings, under mean loads of about 20% of UBL and with load
amplitudes close to 10% of UBL. The retained strength measured in the
samples of the Brascorda Parallel model rope terminated with resin cast
sockets indicates that the "fatigue" behaviour of these ropes is similar to that of
the Superline rope when terminated in the same way. Since "fatigue" failure of
low twist fibre ropes is always associated with the terminations, comparisons
can only be made between terminated ropes, and should not be extrapolated
to ropes with different terminations.
Two termination methods are available for the Superline, parallel sub-rope
construction tested, splicing and the resin socketing. The splicing method
used by Marlow Ropes for its Superline, performed reliably, for the sort of
loading expected on a deep water spread mooring system, on the 1157 kN
rope tested by Karnoski & Liu (1988). According to the manufacturer the
splicing procedure can be scaled up to a rope with a breaking load around
5000 kN without loss in "fatigue" performance or reliability (Banfield (1989)). It
is considered that the behaviour of such a termination would need to be
proven in full size tests.
The resin socketing procedure used in this study proved very reliable and
gave quite consistent results both in simple tensile tests and in "fatigue"
loadings similar to the most severe that are likely to happen in deep water
spread mooring systems. No problem can be foreseen in scaling up the
termination method used here. However before a full size application of these
ropes is implemented it is considered that the termination method feasibility
and performance have to be proven at a very similar size to that of the
application envisaged.
Only one termination method has been tried on the Brascorda Parallel,
parallel strand, rope tested in the study, resin socketing. Using the method
developed in this study, the performance of these terminations, both in simple
tensile tests, and in "fatigue" tests at the relevant loadings, was consistent and
reliable, similar to the behaviour of parallel sub-rope construction. As far as
scaling up the termination, the same comments made for the parallel sub-rope
construction apply.
158

The examination of the fibres from selected regions of one sample of each
rope after "fatigue" cycling indicated that:
(i) filament fatigue is not a cause of concern at these load ranges;
(ii) yarn on yarn and inter-strand abrasion, in the rope free length, are
not significant degradation processes again at these load levels;
and,
(iii) the only degradation mechanism observed was fibre abrasion at
the ill defined interface between the resin and the fibres at the
termination.
Based in these findings it is thought that any future model development for
predicting cyclic degradation of these kind of ropes with potted termination
should be based on an abrasion mechanism.
These results and observations also show that at the load levels envisaged in
spread mooring systems, cyclic loading does not cause significant strength
degradation to these fibre ropes.
Considering that the hysteresis measured for the Superline model rope, at the
loading regime used for cycling, is within the range of reported hysteresis
values for similar PET yarns (Van der Meer (1970) and Rim & Nelson (1991)) it
can be concluded that inter-yarn and inter strand slip is very limited. Therefore
it is not a surprise that no signs of frictional degradation were found in the rope
free length. From this point of view, low twist fibre rope constructions are in a
favourable position in comparison with wire ropes, where for low mean loads
full-slip between wires occurs at fairly low load ranges (Hobbs & Raoof, 1985).
The scaling up of the two constructions studied, to breaking loads of the order
of 5000 kN, typically involves either an additional twist operation and or an
increase in strand diameter. If the same twist (lay length) was used in both
rope sizes the bigger rope would have higher compressive forces. Since the
model ropes had higher twist for better stiffness simulation it is thought that in
general, scaled up ropes should be no more sensitive to yarn on yarn
abrasion than the ropes tested.
In the process of scaling up, an additional variable may be introduced in the
form of imbalance in the rope construction. Although results reported by
159

Karnoski & Liu (1988) for a 1157 kN Superline corroborate the findings of the
present study at a scale of 20:1, it is still considered wise to confirm these
findings for a full size mooring component.
160

LOADING REGIME SUPERLINE MODULUS BRASCORDA PARALLEL MODULUSYOUNG'S
GPaSPECIFIC
N/tex (N/(q/km)YOUNG'S
GPaSPECIFIC
N/tex (N/(q/km)
"Instalation" 2.89 3.02 3.56 3.46
20±10% of UBL- quasi-static 7.32 7.64 9.66 9.38
10±5% of UBL-7.5s period 10.14 10.59 12.53 12.16
20±10% of UBL-15s period 10.55 11.01 12.92 12.54
40±10% of UBL-15s period 13.45 14.04 16.05 15.58
50±2.5% of UBL-15s period 16.29 17.01 19.16 18.6
50±15% of UBL-15s period 13.89 14:59 16.59 16.1
50±15% of UBL-100s period 13.64 14.24 16.18 15.71
Table 8.1 - Specific modulus and Young's modulus for selected cycling
conditions.
ELAPSED TIME PARALLEL SUB-ROPESUPERLINE
PARALLEL STRANDBRASCOR DA PARALLEL
PARALLEL YARNPARAFIL
1 hour 6.74 5.21 5.43
1 day 7.21 5.76 5.58
lmonth 7.6 6.23 5.71
1 year 7.85 6.54 5.78
10 years 8.06 6.79 5.84
20 years 8.11 6.86 5.86
Table 8.2 - Typical creep strains to be used in the design of mooring systems
incorporating PET fibre ropes.

• Brasoorda Parallel
0 Superfine
0.05
0.04 -
0.03 - N0.02 -
0.01 -
0.00 . • 111 1 . 11 I II V I • . I I
0
200 400 600 800 1 000
1200
Number of cycles
Io 10
20
Actual specific stiffness (N/tex)
Figure 8.1 - Comparison between the dynamic rope modulus derived from
simple structural model and measured values.
Figure 8.2 - Influence of the number of cycles on the hysteresis of the
Superline model rope.

•••n64, •••••
• parallel sub-tcpe
o paraJlel strand
• I3 4 5
Log time (s)
2 6 7 8
6
5 - 0
13 13 0 alo CI CI ri 1:1
El
4 -
30°/0• ENKA209/0YEL▪ ENKA30%YE3L
2
1
-I •100 1 0 1 1 0 2 1 0 3 1 0 4 1 0 5 1 0 6 1 0 7
Time (s)
Figure 8.3 - Creep of Diolen 855T (ENKA (1985,3)) and Diolen 855TN at 30% .
of YBL.
Figure 8.4 - Creep of Superline and Brascorda Parallel model ropes (7 tests).

60 -
•1I • 1
IEi0•
WB ••
70
Id-- D Brascorcia Parallela- • Superine•50 -
40 -
30 -
20 -
10 -
• i .- 1 0 1 2 3 4 5 6 7 8 9 1 0 1 1 1 2 1 3
Time (months)
• 1 ' 1 ' 1 1 ' 1 • 1 • I •I •1 •
Figure 8.5 - Residual breaking load of model ropes after creep-
environmentally assisted degradation exposure.
1.0
0.8
0.6B Brascada Parallel
• Supetine
0.4
0.2
0.0-1 0 1
' 1 ' 1-' 1 • 1 ' 1 1 • 1 I
2 3 4 5 6 7 8 9 1 0 1 1 1 2 1 3Time (months)
1 1 1 ' 1 ' 1
Figure 8.6 - Normalised retained strength of all model ropes after creep-
environmentally assisted degradation exposure.

9. CASE STUDIES
9.1. Background
This chapter is primarily intended to provide an indication of how the tether
properties obtained in the materials investigation can influence the design of
spread mooring systems incorporating light weight tethers, by comparison
with the results obtained in the "pilot study" (Global Maritime Ltd. (1989,1)).
The aim was to examine the conclusions previously obtained, upon
introduction of experimentally validated time scale dependent tether
properties. Through analysis of the case studies more precise guidance can
be given on the design of spread mooring systems incorporating LWM.
The work described was first used to obtain experience in the use of the
analysis methods, developing a feeling for the influence of the various
parameters involved. This led to the decision to add a further mooring concept
to those tried in the "pilot study", in the form a line composed of a short upper
steel component attached to a long polyester fibre rope and a piled anchor
capable of taking vertical loads.
Recapitulating the differences observed between the tether properties derived
in the literature review (Section 4.6), which were used in the analyses of the
pilot study, and the behaviour observed in Otis sta4, as discussed in
Chapter 8, the relevant areas of dissimilarity were found to be rope strength
and rope stiffness.
The rope strength measured for the model parallel sub-rope, Superline, was
0.551 GPa and the recommended tensile strength for design (Section 7.1.2)
was 0.464 GPa ( 0.9 2 x 0.551 ), based in the enclosed area of the rope core.
This is 55% higher than the value of 0.3 GPa used in the "pilot study". The
strength assumed for the parallel strand, Brascorda Parallel, in the "pilot
study" was very similar to what is now being proposed.
The issue of stiffness is more complicated, since in the pilot study a single
value for modulus has been used throughout the analysis for each rope
construction. The test programme showed that the apparent modulus of
161

polyester ropes, based in the enclosed area of the rope core, may vary by a
factor of 2.3 from quasi-static to extreme wave frequency conditions, with an
intermediate value for the resonant low frequency response.
For the Superline, for example, a Young's modulus of 5 GPa was used
previously, while typical quasi-static, low frequency and wave frequency
results now advocated are respectively 6.6, 12.3 and 16.0 GPa. These values
correspond to: 90% of the value measured in the 1 week simulated quasi-
static cycle, 90% of the result obtained at 50±15% of UBL at a frequency of
0.01 Hz and the full modulus measured at 50±2.5% of UBL at 0.067 Hz.
A parallel sub-rope construction using a standard modulus aramid, Kevlar 29
or Twaron 1000, was also investigated and for this rope a single value of
Young's modulus, 72 GPa, was used in all analyses. This is an estimated
value, which was obtained by multiplying the PET Superline wave frequency
modulus by the ratio of the modulus of the aramid yarn to the modulus of the
PET yarn (the yarn moduli quoted by the manufacturers being used). This
stiffness is substantially higher than assumed for any standard modulus
aramid rope in the pilot study. The tensile strength of this rope was estimated
in a similar way and considered to be 0.95 GPa.
The cases studied were also intended to investigate the influence of axial
tether stiffness on wave frequency tensions, which was somewhat
contradictory in the literature. Results presented by Larsen & Fylling (1982) for
wire rope mooring lines in up to 300 m of water showed a pseudo axial elastic
behaviour for the most relevant range of first order frequencies and
pretensions, with dynamic line tensions being very close to the product of the
top oscillation and the axial spring constant of the line. Similar maximum
tension behaviour was observed by Global Maritime (1989,1) for mooring
lines consisting of wire rope, wire rope and chain, and fibre rope and chain
combinations. However it was observed that the tensions did not derive from a
real "frozen catenary" behaviour of the mooring components.
Pollack & Hwang (1982) also found increasing wave frequency tensions with
line stiffness for a Kevlar 29 aramid and chain combination system. However
tensions were not directly proportional to axial line stiffness. First order wave
162

frequency tensions, calculated by GVA (1990) for a wire rope chain
combination mooring system in 1000 m of water, were about half or less than
would be predicted by the "frozen catenary" behaviour.
The major difference between the assumptions made by Pollack & Hwang
(1982) and GVA (1990) and those made by Larsen & Fylling (1982) and
Global Maritime (1989), seems to relate to the nature of the fairlead
movements. The former considered a combined horizontal and vertical motion
in the plane of the line, while the later assumed an exclusively horizontal
fairlead motion.
9.2 Design Cases and Methods
A floating production system (FPS) based on an Aker H3.2, 8 column semi-
submersible was selected for all the cases. This is a widely available vessel,
which is actually being used as an FPS by Petrobras in Campos Basin,
offshore Brazil.
Platform displacement was taken as 225000 kN, with an 18 m draft. An eight
line symmetric mooring pattern was used (45° angle between each iine). The
system was considered as operated passively, i.e. no slackening of the
leeward lines or load equalisation on the windward lines. This choice was due
to the fact that testing performed in this study suggested the possibility of
crystal nucleation inside the rope structure at minimal tensions, and no data is
available on the cyclic performance of fibre ropes in sea water at very low
minimum loads. However minor pretension adjustments are going to be
needed to cope with fibre rope creep, as discussed in section 8.3.
Three water depths: 500, 1000 and 2000 m in two locations: Campos Basin,
and West of Shetlands, offshore UK, were investigated. Table 9.1 summarises
the extreme (centenary) environmental data for both locations as used in the
present analyses. Campos Basin data was extracted from recent surveys
available (Petrobras (1989)), West of Shetlands data used is a combination of
data used in the pilot study (Global Maritime Ltd. (1989,1)) and DnV
POSMOOR (1989).
163

Current speed was assumed to vary linearly with depth and to be zero at the
bottom. Wind speed was taken as the hourly mean, 10 m above the still water
level. A Harris wind spectrum was assumed for the Campos Basin and a
Kaimal spectrum in the West of Shetlands. An ISSC wave spectrum was used
for Campos Basin and a JONSWAP spectrum applied in the West of
Shetlands.
The results of the pilot study (Global Maritime Ltd. (1989,1)) for a similar
vessel indicated the quartering seas to be the most severe angle of incidence
for the West of Shetlands and one of the most severe at Campos Basin (an
observation which coincides with Petrobrds experience for the Campos
Basin). Hence only the quartering seas condition was analysed.
Three line configurations were investigated for all conditions and locations:
(i) a short upper length of steel tether (either chain or wire rope), and a
polyester Superline (parallel sub-rope) rope attached to a pile;
(ii) a similar upper component, a polyester Superline (parallel sub-
rope) intermediate segment with a lower section of oil rig quality
(ORQ) chain leading to a drag embedment anchor; and,
(iii) a long six strand wire rope upper segment and an ORQ lower
component leading to an anchor.
In a similar way as was done in the 4"pilot study", the short upper length of
steel component was considered small enough not to be incorporated in the
line model.
For a water depth of 1000m in the West of Shetlands, a further case was
analysed, consisting of a Kevlar 29, standard modulus aramid Superline,
parallel sub-rope construction, in combination with ORQ chain and anchor.
The evaluation was based solely on performance under maximum design
condition for intact systems as defined on the draft standard API RP 2FP1
(1991). A maximum offset of 10% of the water depth was selected and, in
accordance with the draft API standard, a maximum tension of 60% of the
guaranteed minimum breaking load was the tensile strength design criterion.
A number of other conditions must be evaluated in an actual design, however
164

this condition was chosen since it gives a better insight on the differences in
system behaviour than the other design conditions. In particular it is
recognised that, for mooring lines having a lower chain component
(configurations (i) and (iii) above), the length of lower section is going to be
dictated by the "one line broken" (damaged survival) condition (see
Section 2.4.7) and will be longer than calculated here. If the amount of extra
chain needed by the fibre rope-chain system is greater than the extra chain
necessary in the wire rope-chain combination, the cost comparison would be
biased in favour of the systems with lower strength light weight tethers. A spot
check was performed in 1000 m in the West of Shetlands with one line
broken, to verify the amount of extra chain needed to avoid anchor uplift.
The analyses were performed using a deterministic mooring analysis
package, DMOOR (Noble Denton & Assoc. (1986)). Five modules of the
programme suite were used in the analyses. A brief description of each one of
them is given below. More detailed information can be obtained from Noble
Denton & Assoc. (1986).
Module 1, DETER, fixes most of the input data concerning the type of analysis
to be performed, environmental data and vessel characteristics, including
environmental load coefficients. It computes the mean static environmental
forces and the low frequency spectra of winds and waves.
Module 2, STEADY, requires additional input for the mooring line composition,
properties and pretensions. It performs a conventional quasi-static analysis
based on the catenary equations applied to all individual lines. Each line is
discretized in up to 100 finite difference points, the procedure handles,
amongst other things, elastic stretch and intermediate buoys. This module is
also used to perform a static combination to incorporate the low frequency
motions with the mean displacement and to incorporate the wave frequency
motions in a quasi-static analysis (API RP 2P (1987));
Module 3, WAVFRQ, requires the response amplitude operators (RAO) for the
environmental directions analysed as additional input. It computes the transfer
functions horizontally and vertically for the first order end motions of each
mooring line.
165
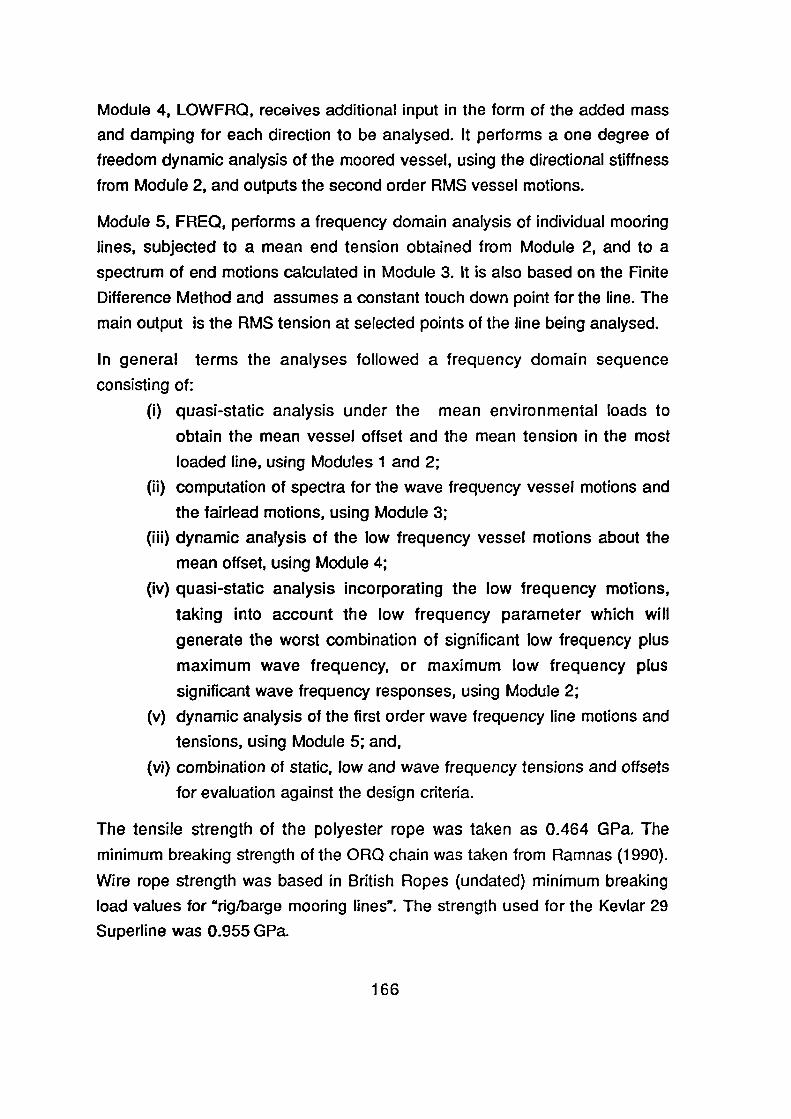
Module 4, LOWFRQ, receives additional input in the form of the added mass
and damping for each direction to be analysed. It performs a one degree of
freedom dynamic analysis of the moored vessel, using the directional stiffness
from Module 2, and outputs the second order RMS vessel motions.
Module 5, FREQ, performs a frequency domain analysis of individual mooring
lines, subjected to a mean end tension obtained from Module 2, and to a
spectrum of end motions calculated in Module 3. It is also based on the Finite
Difference Method and assumes a constant touch down point for the line. The
main output is the RMS tension at selected points of the line being analysed.
In general terms the analyses followed a frequency domain sequence
consisting of:
(i) quasi-static analysis under the mean environmental loads to
obtain the mean vessel offset and the mean tension in the most
loaded line, using Modules 1 and 2;
(ii) computation of spectra for the wave frequency vessel motions and
the tairlead motions, using Module 3;
(iii) dynamic analysis of the low frequency vessel motions about the
mean offset, using Module 4;
(iv) quasi-static analysis incorporating the low frequency motions,
taking into account the low frequency parameter which will
generate the worst combination of significant low frequency plus
maximum wave frequency, or maximum low frequency plus
significant wave frequency responses, using Module 2;
(v) dynamic analysis of the first order wave frequency line motions and
tensions, using Module 5; and,
(vi) combination of static, low and wave frequency tensions and offsets
for evaluation against the design criteria.
The tensile strength of the polyester rope was taken as 0.464 GPa. The
minimum breaking strength of the ORQ chain was taken from Ramnas (1990).
Wire rope strength was based in British Ropes (undated) minimum breaking
load values for "rig/barge mooring lines". The strength used for the Kevlar 29
Superline was 0.955 GPa.
166
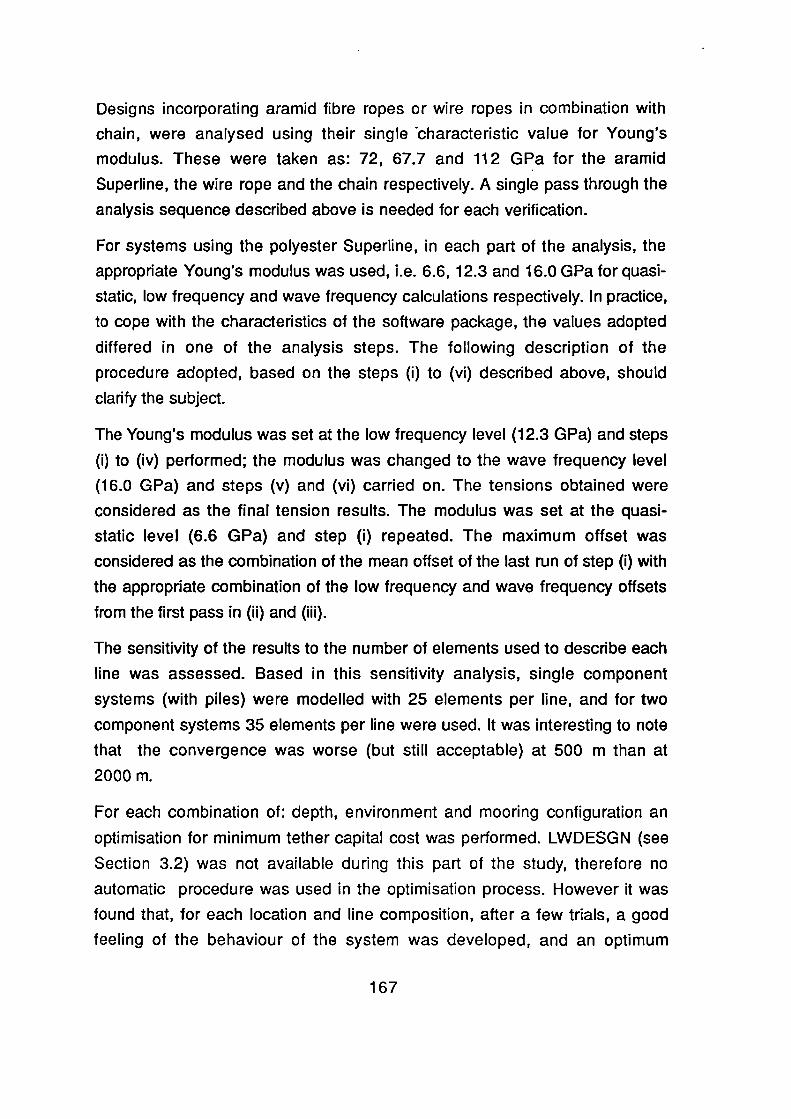
Designs incorporating aramid fibre ropes or wire ropes in combination with
chain, were analysed using their single -characteristic value for Young's
modulus. These were taken as: 72, 67.7 and 112 GPa for the aramid
Superline, the wire rope and the chain respectively. A single pass through the
analysis sequence described above is needed for each verification.
For systems using the polyester Superline, in each part of the analysis, the
appropriate Young's modulus was used, i.e. 6.6, 12.3 and 16.0 GPa for quasi-
static, low frequency and wave frequency calculations respectively. In practice,
to cope with the characteristics of the software package, the values adopted
differed in one of the analysis steps. The following description of the
procedure adopted, based on the steps (i) to (vi) described above, should
clarify the subject.
The Young's modulus was set at the low frequency level (12.3 GPa) and steps
(i) to (iv) performed; the modulus was changed to the wave frequency level
(16.0 GPa) and steps (v) and (vi) carried on. The tensions obtained were
considered as the final tension results. The modulus was set at the quasi-
static level (6.6 GPa) and step (i) repeated. The maximum offset was
considered as the combination of the mean offset of the last run of step (i) with
the appropriate combination of the low frequency and wave frequency offsets
from the first pass in (ii) and (iii).
The sensitivity of the results to the number of elements used to describe each
line was assessed. Based in this sensitivity analysis, single component
systems (with piles) were modelled with 25 elements per line, and for two
component systems 35 elements per line were used. It was interesting to note
that the convergence was worse (but still acceptable) at 500 m than at
2000 m.
For each combination of: depth, environment and mooring configuration an
optimisation for minimum tether capital cost was performed. LWDESGN (see
Section 3.2) was not available during this part of the study, therefore no
automatic procedure was used in the optimisation process. However it was
found that, for each location and line composition, after a few trials, a good
feeling of the behaviour of the system was developed, and an optimum
167

configuration could be obtained in a sensible time.
For each combination of location, water depth, and line composition it is
estimated that between 5 and 10 analyses were needed to achieve a
reasonably optimised solution. Not all of these trials needed to include a run
of the line dynamics module (FREQ), which consumes approximately half of
the time required to perform the analysis. The average computer time for each
full analysis in a 16 MHz, IBM 386-SX PC with a mathematical co-processor,
was 30 minutes, for the systems containing the polyester fibre ropes, and 20
minutes, for the other mooring configurations.
In addition to these case studies two other sets of analyses were performed:
(i) a set of quasi-static analyses, mainly for the systems incorporating
the PET Superline fibre rope; and,
(ii) a series of 7 analyses with the final design selected for the aramid
Superline combination with chain, varying the fibre rope stiffness.
The quasi-static analyses (item (i) above) were performed in the Campos
Basin conditions for the systems with piles and for the PET fibre rope
configuration with chain and anchor. In the West of Shetlands, only the PET
rope-chain combination (all depths) and the wire rope chain system, in
1000 m, were quasi-staticaly analysed. The recommended wave frequency
Young's modulus of 16 GPa was generally used for the fibre rope. Some runs
were performed using the recommended quasi-static Superline modulus,
6.6 GPa.
The analyses for the system containing the aramid rope (item (ii) above) were
all performed in 1000 m in the West of Shetlands, using the frequency domain
procedure described.
9.3 Results
Tables 9.2 and 9.3 summarise the optimum line configurations and the results
obtained in the dynamic analyses for the different water depths in Campos
Basin and in the West of Shetlands, respectively.
For each component, diameter, length and minimum breaking load (MBL) are
168

presented. Also given are the mean tension, the root mean square (RMS) first
order and the RMS low frequency tensions calculated. "Maximum tension (API
RP 2FP1)" is either the significant low frequency tension plus the maximum
wave frequency tension or the maximum low frequency tension plus the
significant wave frequency tension, whichever is greater, added to the tension
corresponding to the mean environmental loads. Offsets are presented in a
similar manner as tensions (API RP 2FP1 (1991)).
The RMS "frozen catenary" tensions presented have been computed
considering: a fixed touch down point, the equivalent elastic stiffness of the
line components between the fairlead and this point, and the RMS wave
frequency offsets. These results are also presented as percentages of the
calculated maximum RMS wave frequency tension in the line, calculated by
the dynamic analysis.
The costs tabulated correspond to the capital cost of the tethers without
jackets, based on the cost per unit weight supplied by the manufacturers
(same figures as used in the "pilot study"). No cost penalty has been added to
account for the vertical force imposed by the mooring system on the vessel.
The cost of piled anchors or drag embedment anchors has not been
considered either. The vertical force on the vessel has been computed in the
equilibrium position without environmental loads.
The results of the quasi-static analyses are presented in Tables 9.4 and 9.5 for
the Campos Basin and the West of Shetlands respectively.
In Campos Basin the maximum tension according to API RP 2P (1987) was
found to be the mean tension plus the significant wave frequency component
plus the maximum low frequency tension. In the West of Shetlands the wave
frequency tension dominated the design. Maximum tensions are presented in
absolute values (kN) and also as percentages of the results obtained from the
dynamic analyses.
Offsets were calculated in a similar way and are also presented as
displacements from the unloaded vessel position (metres) and as fractions of
the values from the dynamic calculation.
169

To verify the differences in the amount of extra chain needed, in the damaged
survival condition, to avoid anchor uplift between systems with PET fibre ropes
and systems with wire ropes, a quasi-static comparison was performed in
1000 m in the West of Shetlands. The results indicated that an extra 260 m of
chain would be needed by the optimum PET rope-chain system and an extra
315 m would be necessary on the wire rope-chain configuration.
Table 9.6 shows the tension results obtained by varying the rope modulus,
with other quantities remaining constant, based on the optimum design for the
aramid Superline, in combination with chain, in 1000 m West of Shetlands.
The RMS wave frequency "frozen catenary" tensions have been calculated
based on the equivalent axial stiffness of the suspended line components, as
discussed above. They are also presented as percentages of the RMS wave
frequency tensions (in the segment with the highest load) obtained from the
dynamic analyses.
9.4 Discussion
A primary function of a spread mooring system is to resist the mean
environmental loads. Since these forces do not cancel out over a reasonable
period of time, the mooring system has to provide a direct reaction to them.
This has to be done by offsetting from the pretension equilibrium position.
First order vessel motions, including platform offset, are virtually unrestricted
by the mooring system. Line tensions associated with these motions are a
direct function of tether characteristics.
The mooring system stiffness, in conjunction with the vessel characteristics,
determine vessel response to second order environmental forces. Therefore
tensions and offsets associated with these motions will be a function of line
stiffness.
Considering that, for an intact system, only a fixed proportion of the MBL is
"available" for use (60% according to API RP 2FP1 (1991)), a clear measure of
the technical merit of different mooring systems is how much of this proportion
is used in reaction to the loads which are independent of the mooring system
170

characteristics, i.e. the mean environmental loads.
9.4.1 Dynamic Analyses
In order to assess how well the different mooring systems performed their
function, the three components of the line tensions were plotted for all cases
analysed in four graphs.
Figures 9.1 and 9.2 present the absolute values, in kN, of the components of
line tension calculated according to API RP 2FP1 (1991), for the Campos
Basin and the West of Shetlands respectively.
It can clearly be seen that the absolute value of the mean tensions developed
in the systems incorporating fibre ropes is always lower than that developed in
the all steel system, the difference increasing markedly with water depth. This
is basically due to the catenary sag originating from the higher immersed
weight of the the steel tethers. The tensile behaviour of the systems with piled
anchors was similar to the PET rope/chain systems in all conditions except in
500 m in the West of Shetlands, which was high due to excessive system
stiffness.
The difference in dynamic environmental loading between Campos Basin and
the West of Shetlands is striking. In Campos Basin the design is dear*
dominated by the mean loads, while in the West of Shetlands strong first order
wave frequency forces are present.
In the West of Shetlands maximum wave frequency tension amplitudes were
found be almost as high as the mean loads, especially in the all steel system
and in the PET rope with piled anchor in 500 m of water. Under these
conditions of fluctuating tension, the very low minimum loads are potentially
very dangerous for tethers susceptible to kinking and/or torsional instabilities.
Both the Kevlar 29 rope and the steel wire rope combination systems with
chain in 1000 m are also far from safe from near slack conditions associated
with storms. This situation cannot possibly happen in storms in Campos Basin.
There is very little difference in low frequency tension between the two
171

locations studied, at least in storm conditions. However, in Campos Basin, the
low frequency components appear in the API summation as their maximum
value, for systems incorporating PET ropes, due to the mild wave frequency
loading.
Figures 9.3 (for the Campos Basin cases) and 9.4 (West of Shetlands cases)
show the same tension components normalised using the appropriate rope
breaking load (MBL).
The first striking characteristic is the excellent match between the performance
of almost all mooring systems and the environmental loading observed in
Campos Basin (Figure 9.3). Mean tensions consistently above 45% of the
tethers MBL were obtained.
In the West of Shetlands (Figure 9.4) it is possible to see that the systems with
polyester ropes did a good job of attenuating the the first order wave
frequency components in all depths, except in 500 m. Considering that, in the
later case, the maximum offset of the cost optimised systems (5.5% of water
depth for the system with piles and 6.7% for the combined mooring) is still
well below the limit selected (10%), there is a clear indication that a fibre rope
with a lower dynamic stiffness, possibly half of the modulus of the PET ropes
now analysed, could perform better.
In all conditions, the systems incorporating PET fibre ropes performed more
efficiently than the all steel and the aramid rope chain systems, as confirmed
by the higher percentage of the breaking load "used" in reacting the mean
loads. The only exception was the PET rope-pile system in 500 m in the West
of Shetlands environment (which was much stiffer than needed). For example,
in the West of Shetlands, in 1000 m, the systems with PET rope use 39 to
40% of their strength to cope with the mean environmental load while both the
all steel and the system with the aramid rope only use 32% of their MBL to
cope with the mean load.
The behaviour of the system with the aramid rope was very similar to the wire
rope-chain system in 1000 m. This is not a surprise since both ropes have
approximately the same dynamic stiffness, the heavier weight of the steel rope
being compensated by the longer length of chain lifted off the sea bed, in the
172

system with the aramid rope. The shorter length of aramid rope compared with
the PET ropes at the same depth is an outcome of the cost optimisation.
The significant wave frequency tension ranges, presented as percentages of
rope MBL, are shown in Figure 9.5 for both locations. As already observed the
ranges measured in Campos Basin are between two and three times lower
than in the West of Shetlands. It is worth noting the much lower tension ranges
in the systems incorporating polyester fibre ropes, which varied between 33
and 68% of the ranges in the all steel systems. The West of Shetlands 500 m
condition is an exception, as already discussed.
Figure 9.5 also gives an insight into the likelihood of "fatigue" damage due to
first order wave frequency tensions. Considering that the highest significant
wave frequency range (except the 500 m West of Shetlands conditions)
observed was 16.4%, not forgetting that these are centenary conditions, it is
clear that ropes that are able to withstand 1 million cycles, at a tension range
of 20% of their actual breaking load, will not be affected by the cyclic loads
available at these frequencies.
Low frequency tension ranges (in proportion to the tether breaking load) are
lower for the wire rope/chain systems and higher for the piled systems in all
conditions, with the fibre rope/chain systems giving intermediate values. Low
frequency tensions were found to be higher than first order wave frequency
tensions in some cases incorporating PET fibre ropes in the Campos Basin.
However the highest significant tension range calculated was 13.2% of MBL.
Considering that the number of cycles involved in this oscillations is typically a
third to a tenth of the cycles associated with wave frequency tensions, "fatigue"
damage due to low frequency tensions is less likely than cyclic damage
caused by first order tensions. It should be noted that, for a real application,
although seemingly improbable, the possibility of higher low frequency
tensions occurring under other environmental conditions should be
investigated.
Due to the design constraint on the tension safety factors ("Maximum tension
on rope, % MBL" in Tables 9.2 and 9.3), the minimum breaking load of the
tether components is directly proportional the maximum tensions developed in
173

the mooring lines.
The minimum breaking load of the rope component for all the conditions
investigated is shown in Figure 9.6. Except for the anomalous results at 500 m
West of Shetlands, the required MBL for the systems incorporating PET fibre
ropes is always substantially lower than the corresponding wire rope-chain
system. This difference increases with water depth, being maximum in the
West of Shetlands, in 2000 m water depth where the MBL of the PET based
systems is only 56% of the MBL of the wire rope-chain alternative. The
difference is somewhat smaller in Campos Basin, where the ratio only
reaches a maximum of 69%, at the same water depth of 2000 m.
It is curious to see that in 2000 m the same optimum system was obtained for
the PET rope/pile configuration in both locations. The same rope was also
used in the PET rope/chain system, but the minimum chain needed in
Campos Basin was found to be slightly bigger due to its higher mean loads.
Although an effort was made to use the full offset allowable (10%) in all
conditions, it was not always possible to get a minimum cost solution
simultaneously with maximum offset. In such cases a bonus low offset was
obtained. As can be seen in Figure 9.7, this happened with the polyester
rope/pile systems in all conditions and to a lesser extent to most of the PET
rope/chain combination cases. It should be noted that the polyester rope/pile
systems achieved maximum offsets between 6 and 7.4% without
compromising cost. These lower offsets offer potential advantages if
consideration is given to the possibility of installing rigid risers.
Figure 9.8 shows the capital cost of the tether components in relation to the
cost of the wire rope/chain combination system, in each location and water
depth. To compensate for the minor differences in tension safety factors
obtained, costs have been normalised to a safety factor of 1.667 (60% of MBL
maximum tension). The polyester rope/chain systems are cheaper in all
conditions and locations, the advantage being greater in the West of
Shetlands, with a typical ratio of 0.85 of the cost of the all steel system, except
in 500 m. Polyester rope/pile systems work out even cheaper, with ratios
between 0.37 and 0.65. The system based on the aramid rope/chain
174

combination had the highest capital cost (1.56 times the all steel system). It is
worth noting that this is an optimum cost system which does not show the
station keeping potential of systems incorporating high modulus fibre ropes.
By increasing the length of aramid fibre rope (and obviously spending more
money), these systems can be designed to give maximum offsets as low as
3% in 1000 m water depth.
For both Polyester fibre rope and wire rope in combination with chain it is
considered that differences in installation costs would not be significant, since
PET ropes are inherently damage tolerant (due to the high failure strain of
polyester fibres) and both ropes would probably be similarly jacketed for use
in a floating production system. The comparison between the cost of piles and
anchors is not straightforward, therefore any cost comparison involving
systems with piled anchors should be judged in the light of this omission.
As can be seen in Tables 9.2 and 9.3, the total vertical force, imposed by the
mooring systems based on fibre ropes on the vessel, in the equilibrium
position without environmental loads, in 500 m of water, is half of the force
imposed by the all steel system. As the depth increases so does the difference
in loading. In 2000 m vertical loading caused by moorings with synthetic fibre
ropes will only be about 25% of the load in all steel systems. The additional
vertical force, for the all steel system in 2000 m in Campos Basin, corresponds
to 5% of the displacement of the vessel studied. This effect can be seen as a
bonus payload available at the platform or as a penalty cost for providing the
additional buoyancy required.
An assessment of the advantages in using systems with fibre ropes taking into
account the cost of additional buoyancy was undertaken. No attempt was
made to obtain optimum systems based on cost incorporating an addition for
buoyancy. It was assumed that to generate the corresponding buoyancy
additional load on the platform had to be backed up by one fifth of that weight
in structural steel work in the platform (Global Maritime Ltd. (1989,1)). The cost
of the fabricated structure was taken as US$6,400/tonne (Lim (1988) and
Global Maritime Ltd. (1989,1)). Figure 9.9 shows the results obtained by
adding the cost calculated in this basis to the total capital cost from Tables 9.2
and 9.3 and normalising by the cost of the wire rope/chain combination
175

system for each location and water depth. To compensate for the minor
differences in tension safety factors, costs extracted from tables 9.2 and 9.3
have been normalised to a safety factor of 1.667 (60% of MBL maximum
tension).
The advantage of the polyester Superline rope/chain combination over the all
steel systems considerable. In 1000 m in the West of Shetlands, for example,
the system based in the PET rope is costed at 70% of the estimated cost for
the wire rope chain system. In 2000 m the advantage is even greater. The
system based on the aramid rope comes out only 23% more expensive than
the all steel system, which is quite surprising. However this particular aramid
system does not offer any advantage over the steel system, other than
corrosion resistance, and has a number of draw backs such as: sensitivity to
accidental damage and unproven performance when cycled at very low
minimum loads.
To assess the performance of the "frozen catenary" assumption, in comparison
with the results of the dynamic analysis conducted, total tensions were
compared as predicted by both methods. Figure 9.10 shows the ratio of the
total tension for the "frozen catenary" assumption divided by the tension from
the dynamic analysis. This ratio corresponds to a safety factor associated with
the simplified assumption.
All results obtained show the "frozen catenary" assumption to be conservative.
Agreement with dynamic analysis is seen to be quite good for the systems
based in PET fibre ropes, being very good for the Campos Basin cases. This
is explained by the low proportion of the loading coming from the wave
frequency component. Results for the system containing wire ropes and
aramid ropes came out too conservative to be of practical use.
Figure 9.11 presents the RMS wave frequency tensions obtained in the
analyses in 1000 m West of Shetlands, for the Kevlar 29 aramid rope/chain
system, as functions of the modulus of the fibre rope (varied from about 14 to
100 GPa). There is a pronounced flattening of the graph for increasing
modulus, possibly indicating a substantial movement of the grounding chain.
These results agree with the trend reported by Pollack & Hwang (1982).
176

The equivalent "frozen catenary" tensions are also shown in Figure 9.11.
Agreement with the tensions obtained in the dynamic analysis is good at low
modulus, but poor at the actual range of modulus expected for aramid ropes.
The dynamic behaviour found in the case studies analysed and reported by
Pollack & Hwang (1982), do not agree with the results obtained by Larsen &
Fylling (1982) and Global Maritime Ltd. (1989,1) for ropes with modulus above
ca. 20 GPa. Within the scope of the current work it was not possible to
investigate this discrepancy any further. One possible cause is the fact that, in
the present analysis as well as in the Pollack & Hwang (1982) study, both
horizontal and vertical fairlead motions were considered simultaneously. Only
horizontal fairlead motions were taken into account in the two remaining
studies.
The results obtained from the analyses confirm the trends indicated by Global
Maritime Ltd. (1989,1) of:
(i) cost effectiveness of mooring systems incorporating low twist
polyester fibre ropes in combination with chain;
(ii) lower vertical vessel loads and wave frequency tensions for these
ropes in comparison with wire rope/chain systems;
(iii) systems based on PET fibre ropes with strength significantly lower
than all steel systems being able to achieve the same tension
safety factors;
(iv) small influence of low frequency tensions in extreme design
conditions;
(v) moderate success of a simplified procedure based in a quasi-static
analysis, with wave frequency tensions calculated via an axial
elastic stiffness assumption, in predicting extreme tensions in
systems incorporating PET ropes;
9.4.2 Quasi-Static Analyses
The total tensions obtained in the quasi-static analysis (Tables 9.4 and 9.5),
using the first order wave frequency modulus proposed for the PET ropes
177

(16 GPa) and a modulus of 67.7 GPa for the steel wire rope, have been
plotted in Figure 9.12 as a function of the values obtained in the dynamic
analysis. The greatest difference is found for the wire rope/chain system, with
its high dynamic tensions.
As expected from the low levels of wave frequency tensions, agreement is
quite good in Campos Basin, where the greatest difference between the
results of the two methods is 2%. These results are in agreement with the
results of the pilot study (Global Maritime Ltd. (1989,1)). It should be noted
that using a Young's modulus of 16 GPa in a quasi-static analysis results in
erroneously small offsets (up to 34% lower than actual values). However a
safe prediction of offset can easily be obtained by using the apparent quasi-
static modulus, 6.6 GPa, in the quasi-static analysis (see Tables 9.4 and 9.5).
In the West of Shetlands the performance of the quasi-static analysis improves
with water depth, errors below 10% resulting for water depths greater than
1000 m.
178

Location I Wind Speed
m/s
Current Speed
m/s
Sig. Wave Height
m
Peak Period
s
Campos Basin
West of Shetlands
33.7
41
1.5
0.91
7.64
17
13.1
17.8
Table 9.1 - Environmental conditions used in the case studies.

c-a
E_c0
,..,
C) +CDcm 0
CD0 0r, p o 0LO N
-I- NY ,-
-_-, --- tr) a)cv 1.0 CID N.a) ..-
C7) „, ,ct al CO'Tr i-,!, cm 0.) CD 0 C)c) I,- CO ,-- 1-NI- '- '- '- -1-
co „,,. (0, , ,0-103 6 0-5 -5 8CO 145 c5 cm ,-T.-
COcr)a
VDri*.-„-)toT-
C
'cTsE_cCI
L.,C) +CM >•
faZ1.-
c)40 co c) c)03 to in CL).4..(.73 a
CO N ")
CO .... NCD 6 a) .4- co cr) co U)C9 , Cy 01 cc;1 Lo c,) .,
to0) ," CO . „,Ix; -1 co cf) --:.4- In p CO CO7- n-•
CDU)t.c3
-4-;7
a)E -ELC) +0CD D',CV o
CDoo c)• In. cot.z..._ •
-4-in
I-
to cr) .4-.- c.,„ CO ,- 03 C) C) •ctCO CV CO N CO CV 0)cv r- co
‘1*. a) co f"-v. cv 00 06 •(1:cv .cr r...,
nt 0
cmCOcoCO
01-1:1-
CcT)
E .c, ,CD ""0 +c) „,.- -
oo to40 c \ 1 CD Cl(o cm CV CV --. --. CT) LL,
cr.- o cto o00 0
LO co cp cy., CV co r,CD ":1- 010 CM II) to co tr) '-'01 C'"),_co T- ‘- '- cc)
a) (0 cy)(NI CO 00 • .`rN. 0.3 46 Fo.) a5
COCDcc-4
CDC.0a?.
C-C71E .c
CD,..,
C) +C),- .�,0o-
c)cp CDr, Lo c) o
C--\--1 c(\01 g.)c 0 (0 Nt- NJ-f-- T-M-
cr) to to... co co coRI '.- ii) it) Nto to pcm •- cm ,-
-,- a) o ,-c co-4: '-' °3 CO -r•-. -4: ci a) co
sN�8N
_cm'",_CO
n)
E-a.-CD .4.C)C) >..- o
CL
c)0LO 0
CD' -C-../ ' N.
U) NI-,-1-
0 0 ,-NCO 0 CV CD CD a)CV Cf) LC) Ul 03 CO I.0 .7i ,cm - N
CON: CC) 03 ina NN: cicc) z4:0as
41U)
(NIc7-)01
.0CTi
E -c0C3 +CD(,) 2
.§
, o— cpc, tr9 C°COCO - ta r......;--
,,,-.co 2-...in it)
LoC° •:1- CI) cr Cr3,,, 03 r,- .0.) el CO 01 i„5 to CMcm 1- T- .-- 01 NI- CM
(0 CM CO CI ln6 a) 03 r... •el 4 ci .4- cr)
mc\IoN
toCO—N141
Cz
E _ctaDa, 4-
13a_
CDc) tr)La (NI 0 0CV 03
ze:sco co co1 - •:.-
'-
2 Li,V- co g a, co co ,i, 0-, co ..:/: c ,
C°,s1 T: (0_,. •0.,0-) co co to to C) °•1 CO.- .-- CV I - T- %Al ,...• , cr'
83I,-.„-
a,
COcm
a).,E u-C) +at >,ID -0
0_
-c)toN Pm• i.e.)/ - • c 0
--4-.--
01V) CO CD 1- 7:2 00 CI CVa, to o c) ra La .- .-1r- " •- N ,- 1-
CO I.'"CO CO cucf5 rs:03 ci to-N .-- 4...) 01 -
cotor""
C‘I2cv
EE E
c Z ZE.___.E E
mZ Z Z Z Z -5..,____,c___ ..-. 3 zie
e0
EEEE .as...,
cr)
c)8
,
Z..
Co-.2 .,1CI .-
"g3 45„IA "g;
,Q)-7.----.
.0 .c0) enum c
:.,=,1 I.) _j __/43 .- CO 00.`-'0 51.:3, MalE crsE .cis.c cLom
c 0) °-(74 ci_c 00 cC
..—-8 c oi_
c _1w-r_ .- c
a) C C 8_ 2 CI)ci .0 c 05 o_ 2 152 8
2 (7-' -,?, ,9 12C c cf) -Cc)c (i) .,, a. E-- a) sti; < o cc 0g ci- — -- — -F, ;--_ 2 ci- ,- c c '.. a.,cu) .; al) 2--v)o....,a) La Essil 0 0 ..;
C E .._,a) a)c _> -.;,' a) m es 1-z•
as Eis E 0 0co cr) Ea) 2 3 2 cc co
m cu cp co2 Cr) E N NI
2 -,-cc cd
0 2cc u. u_
2
—,-a.
....,. LL.4-. (I) C \ Ia) en eLCA
tij t ° E ,I5u,U> • Ci- CL o0' <
CD" CD0 ,...2 >a) 1-:-Du) g.1-1 0 ml> -x-CO u) - al
2 cf) E 2 2
cc cc E.„- ia2
(/)Cl)
*cog-••-•0
8(1)—_,V.
eLCl)0
a)
4r21-2-co
tCD>WI
oI-

C76E _coCD
a +0) cpN ._
'
a °oCco c) a CD
M .4- CO COI:: ---. In N.C) CO 03 CD,-- CV
C9 a)CD vt " cv 0) 1- I,..co a) q. r-- an U).`1.03 .4 to
cs) CO 1̀ ...-(04 N- (31- al al•-• CV
Ill2an
co
2C°T.
.0RI'E .c
0 00 +0 ....._cm ,0
0.
CDa ocv ci a o
in ILIA Zi!'t 1.0 III U)co cm-
-ct a o 0)N. Cp C \J u)4' r.;') 0) - u) cm Q()J n-• 0C I ,- ,-CO
ir3 " -I . 'c7 c c1CD tri c%i ,-- CO-
0
C̀ )2in
Ir... .. 4 .;7
.0E ala +a0 >"CV 0
0-
aaa aco
• kr,) . ,,,t.1.0 U)CV••-•
cr),d. CD V. ...4. 8 r...., r.... cv)„Kr ,- a .-. ..... in ,- 0CV .- '- .- CO ,- •-
co en 03 ir)0.) . ci,C‘.1 CG • CV Lfjcr) •cl- N .-or-
4c,\31LC)CO
8
Tjt
C-ciE_c
c) 00 +0 01- ,_.§
0 CIc) aco in 8 F),F-,_ in Locs _,--. co co••n • ,.
.1.•
co co f2 N.. CO,, ,I.co CM C71 CI a in to acm •-- to In in ..- cm
1..... .4- ca 03 co1-.. cs). cr). a) 0;•zr CV
•ctCDCO
CDC)0)
C
.CT3-C
E 0.8 +a (No'1-- >
0Y
0) 0co o a 10% u) in cy-_,- LC) CO
_ -1-- CO CO- co
CD co 0 0,_ N 10 0 N. 0 0v- CO 0) Co co to 0 .....LGCV ••-• CO
CD .1- 03 .0-00
tri .,.0 \ I CI)...1rs: 014.;t--. “, ..., a) -
Cr1i n-4.Ers
10..--Nt-cn
C"E .c0
cO +a,- 2:,
oCL
a6 acz., 10 CD CD N. co r... 0, CP (3) 0.141) Q 12 CD
" c)co Cr) v- lt1-) C° CJ•z1- 10 10 U) ZN-i ..- •- •- c7) CM •""CO CV
.-
el co co co ,„6 u:). m• cci ....-:10 CO CV CO w
0__6̀1(NI
CO__cii0
0E -a_a +CZ)cp >...-• 0
CL
0aan o
CD• Q • •octit, 1.0CV,-
•Ct 0CV 0 CO CI.4. In.- 10 ,- N rj cc,C)CI0N .- N N CD CM '
CO CO co CO /....cri 6 6 cii -CO CV CV cc" it)
17.N-T-.
CO‘-c4-50-)
C"cTs
E -c°0 +
cDU) a)
in cocm u") a aLO % c.) r------ ,- 0•- CV o) co
c) co tr)cs) (\i ul N" co co Nr win U) 0 •-• in cm CVcu • CD Co 17) CI 10
ci! g 2 •-• •zt;C). . 1.--- ,..C \I CO CMI 'CI- '""
co0(.0ty
..ctCDCoca
.0
CIE -c
°a +Clin ,„.
0-
CO c,co S o aNr ,- a •:)-c• ...... U3 Cr>a 114 N. N.
r--La1--. r-- CD .ct C> CO " IDCO CI •....°3 ,,,G) ..-- co a acm i- " " v- tr) ,-
COw. F., 2 `q 1.--co • • cn
•(c;.- 1- CM CO
)CIInN
el0.)03CO
coE a0 +0 >„Ln o
O.
CDc)In o
• 2.7... • CDCO0 t,...
in.-
lt) r-- •zr cr) " cricr>CD N. N.•C> CD CDC')CI d. 10 Cr) C'cm .- 10 CO ,d. LO v-
10 CD CO CD inCi 'Kt.GI N.: ici1- 1- C \I N
14If)..-
ZFZI.CM01
EE E _1
coE E ..Z Ze _Ze _i 3 3 3 m 3 eE E 'e
0E E E E
.....?.
49.(i)=a8T.
Z...
Co--
75-0 6--o .00̀- "C, o0 00
"'" c:-7i
-C =a .....
a CCD 4)
.2" 1.2a) 2a3 mCCIa) a)E E c 0as 0 "ri 0-
1-6 :i-:-, ..c o_ 0 fr-E E13 00 CC
.......C vi
=2 so E- .0 c.= _c LL 0 iii otu 0 CV a_ C4-
0 C Cci .0 C (LI 0- 2 a 80 -L-) .2 c CC , in-5, 0 2 -2$ 7,- 'c .., c
u) ,-,- es. ; .-(1) .g. ...S .2 CC- .° 0 & ...-• c '2 'a, '.Cl)) -.-'- .._a) -0 .2 o 0 0c c cCD "- •:-- (2 E 0 (1)c (. 02 g.)
cp = to' liscc co cc > - 00a' E -g-tD 2 x c c=2 CC cn .- 43 CD CD
U) t .., N N2 2 ')- 2 2cc cc co
M
..........--o_LL
-•:: 1).CVau (I) •••
,.... •-•= '5 LL IP1-6 ci 0
.."2 ci- gr <CL =00 2- - E0 - 0 15 =
'-... > en aas 0 as = .=o x(7) 0) a s
2 0") E MCC M 'cc .E,
as
00C
---co
z•-•000T...=,a.as0
0,a•-•o
-(Fs2
".ccp>as .._.0I-

C
E _c
0 0
ci +c) >,CM
750.
aC. CD CONI- c) 0 CD LC) c, . ..., . c) ,,,,t.co to in co co a ..— *6' rn 0---.. ---.. LO ••;1* N a8 Lc?, tr) to co .--
II-
a)
E .a.-.c. +CDCD >•cv oa.
ac,c. c, el
. LC) • CO CO " w) cr) . 1
•iz..... CO Q C \ i 't
LO CO ,- N.
..-
c"as-
E .c0 C)CD +CD ...._.._ _,-.
0Q.
c.D CD
`it:: u) cii 3 'c7; CI —_,..., CD CD tr)
---(j
CO l's, I's 0) s.,-, CO CV CDco -6.- .4: t V- N LO CO I-N .-
a)E a
CD +C:30 ''''-0._
coCDc,ir) c:, co (NI cl ,_
I 5.�..1 I 0 LOP... 03 C3 CO in I 1
CO .cr cm "" C/)
._
C._co
E _c0C) +c.LC) ,...
oa_
CDa inco cm cz:. CD CO CV CO coCV CO CD CO C.....- VSR 7, CD cO CO CD V ) r-- ai c"CD CV .1- .4- 01 Cr) '1 ''"'r.... ,
...-
a)Eä.0 +a >,
c.
1--cm a in toI 7. . (NI CD ,-,, cc; ro , ,
cor--- —co ..zr CV .- ,..-
E'
C C CEE>-. >-. ›...'t _Zc _7c 3 -0 E -0 E°EE 0 0 0
zp, e -......
c0
0. .....w m
":)._ :.=:cCu-, .
a,a:II
.3 .3 ca0_ 0 a_ 0_
.3 00co a_ co co' 0 T-11 co_c _c 1.1.1 co II al II a)n _ LLI CL ul CI-15 ifi s ..-- . A .,... 1.L.1
— 1----Eh L:2-.' o_ co E (c!
a) a) Ca Ca " a 141 71 u. 9
`15E 1 7,3 cDE .7c cca- % cca-cm V)-0.921 — .. . ,:,_ c _ ..,..a 0 cc a 0 CL 75
.
.
•- (1) "-- *(7) < <cti Q. Cc ----.c 0 0 0) TD- Cu 1-6 ccs0 CC "co— '-' (.1) 2 (,) mc --
as al 0 "5x- 2
Cu asas 2 22
-do
t'oo)
Cu
0.
cou)0_2
1—
w
ILa)_c
co
mu)-5
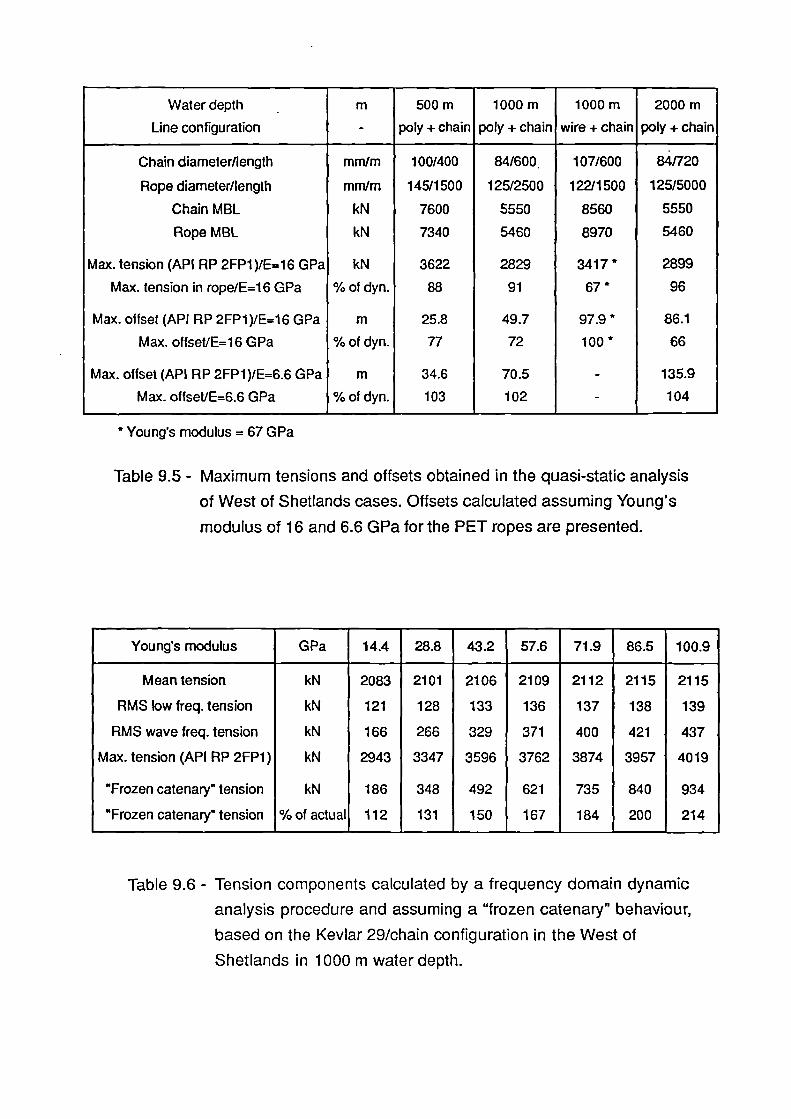
Water depth .
Line configuration
m
-
500m
poly + chain
1000 m
poly + chain
1000 m
wire + chain
2000m
poly + chain
Chain diameter/length mm/m 100/400 84/600, 107/600 84/720
Rope diameter/length mm/m 145/1500 125/2500 122/1500 125/5000
Chain MBL kN 7600 5550 8560 5550
Rope MBL kN 7340 5460 8970 5460
Max. tension (API RP 2FP1)/E=16 GPa kN 3622 2829 3417 * 2899
Max. tension in rope/E=16 GPa % of dyn. 88 91 67 * 96
Max. offset (API RP 2FP1)/E=16 GPa m 25.8 49.7 97.9 * 86.1
Max. offset/E=16 GPa % of dyn. 77 72 100* 66
Max. offset (API RP 2FP1)/E=6.6 GPa m 34.6 70.5 - 135.9
Max. offset/E=6.6 GPa % of dyn. 103 102 - 104
' Young's modulus = 67 GPa
Table 9.5 - Maximum tensions and offsets obtained in the quasi-static analysis
of West of Shetlands cases. Offsets calculated assuming Young's
modulus of 16 and 6.6 GPa for the PET ropes are presented.
Young's modulus GPa 14.4 28.8 43.2 57.6 71.9,
86.5 100.9
Mean tension kN 2083 2101 2106 2109 2112 2115 2115
RMS low freq. tension kN 121 128 133 136 137 138 139
RMS wave freq. tension kN 166 266 329 371 400 421 437
Max. tension (API RP 2FP1) kN 2943 3347 3596 3762 3874 3957 4019
"Frozen catenary" tension kN 186 348 492 621 735 840 934
"Frozen catenary" tension % of actual 112 , 131 150 167 184 200 214
Table 9.6 - Tension components calculated by a frequency domain dynamic
analysis procedure and assuming a "frozen catenary" behaviour,
based on the Kevlar 29/chain configuration in the West of
Shetlands in 1000 m water depth.

5000
4000
3000
2000
1000
I, . , :. , . t , 6
y . , 6, .:: y a,,,.7-4G '
- AC /..a /,,, ' ./.... ' . ..... v. .,6.:./...... ......- =
a.
2
aCAa.
a.
8
Ca a.
88
Ca
Tension(kN)
El mean tension
Ea lowfreq. tension
El wave freq. tension
5000
4000
1000
3000
Tension(kN)
2000
C.a_c_c
a)
I--alQ.
2
cco To
-co
E E
m mean tensim
bw freq. tension
El wave freq. tension
Figure 9.1 - Components of maximum tension according to API RP 2FP1(1991) for the Campos Basin cases.
Figure 9.2 - Components of maximum tension according to API RP 2FP1(1991) for the West of Shetlands cases.

60
50
40
Tension 30(%MBL)
20
10
(17;.ccs1
CY.
CO_c(.)CO
_c
-
a)
a.
a)
o.
a-
g)
60
50
40
Tension 30(% MBL)
20
10
a) c c a) c 0•
Ta.co
• Tipca •
i—_c
o_c
0
o
wo
w
a. .u. Q.; :2.
E E . I§ E E
to §§
§
EE
, §
To_c
N mean tension
N low freq. tension
im wave freq. tension
Figure 9.3 - Components of maximum tension, shown as percentages of
MBL, for the Campos Basin cases.
ineantensbn
• bw freq. tension
E3 wave freq, tension
Figure 9.4 - Components of maximum tension, shown as percentages of
MBL, for the West of Shetlands cases.

West of Shetlands
E. Carnpos Basin
a.
O.
c§
a)
a._c .2co.c0
a.
0as as.0 .0cs 01.-- Ew •0. 30E Ecoa§
-c7).
tr)
'E.
a_
00
CC-a
a.
—J 6000 -
•
co2
cc 4000 -
O West of Shetlands
O Campost3asin
-C
r-
36_
Figure 9.5 - Significant wave frequency tension range associated with
extreme environmental conditions.
Figure 9.6 - Minimum breaking load (MBL) required in the rope component.

Figure 9.7 - Maximum offset attained.
West of Shetlands
0 Carrpos Basin
Cost/all steelE3 West of Shetlands
Carpos Bash
co.c
In
.ca.
o_
.cC.
a_EY.
a)
a)
a.
a.
-c
(1)
(13
a
-c
8
16.
E•
tr)
cY.
Lc)
Figure 9.8 - Capital cost of the tether components, in relation to the capital
cost of the optimum all steel system in the same location.

To_c
Ta_c
Cost/all steel
C)
a.ct. CU
II0.
B West of Shetlands
O Canpos Basin
West of Shetlands
0 Campos Basin
3
co
CC
0
CEoc'7) cC
13
C73
0 a-
4Ci;
C.)
2
2
CCU
_c
c§8
CU
.61)
C)a_
n.
a.
o.
CU_c
a.
CU
Iiirt.
8
Ta.c
8
CU
I
CU_c
In
Figure 9.9 - Cost of tether options plus a cost penalty for buoyancy, in relation
to the cost of the corresponding optimum all steel systems.
Figure 9.10 - Performance of the "frozen catenary" assumption to account for
first order wave frequency tensions.

76
•
600 -c
F.! 400-
C)
200 -
•
0
•
Ej West of Shetlands
0 Campos E3asin
1.0
0.2
0.0
1000
•
•— 800 -z
•
O dynamb
• ftozen catenary
•20 40 60 80
100
1 20
Young's modulus (GPa)
Figure 9.11 - Influence of Young's modulus on the RMS wave frequency
tensions, based on the Kevlar 29/chain configuration in the West
of Shetlands in 1000 m water depth.
1.2
Figure 9.12 - Performance of the full quasi-static analysis procedure to
account for first order wave frequency tensions.
10. CONCLUSIONS AND RECOMMENDATIONS
10.1 Conclusions
This work has studied the use of light weight tethers in deepwater moorings.
Based on the results of a "pilot study", the behaviour of low twist construction
ropes, made from polyethylene terephthalate (polyester) fibres, has been
thoroughly investigated, under the relevant loadings and environmental
conditions. The properties obtained have been used to analyse selected
design cases for a deep water floating production system. The performance of
spread mooring concepts incorporating the ropes investigated was compared
with that of combined steel wire rope-chain moorings.
The conclusions of this study are given below:
1. Light weight ropes, using high strength polyester yarns in low twist
constructions based on current technology, provide practical cost
effective options for spread mooring systems for deep water platforms.
2. System configurations using a short length steel upper component and:
(i) a lower chain segment and a drag embedment anchor; or,
(ii) a short length of chain and a pile;
provided attractive solutions in terms of station keeping performance,
vertical loads on the vessel, minimum breaking load (MBL) and fatigue,
as well as cost.
3. It was found that a quantitative measure of the technical merit of different
systems could be obtained by calculating the proportion of the MBL used
in reacting the mean environmental forces.
4. Results of the case studies analysed, in line with results of the "pilot
study", showed that designing to the same offset and tensile safety factor
criteria the minimum breaking load necessary for the systems based on
PET fibre ropes is substantially lower than for the all steel systems. The
difference was found to be greater in the West of Shetlands than in
Campos Basin due to the higher wave frequency loads in the former
location. The difference generally increased with water depth due to the
179

greater immersed weight of the all steel system.
5. For the same tether safety factor, optimum cost systems based on
polyester ropes showed substantially lower dynamic loads than optimum
all steel systems. In particular first order wave frequency tensions on
these fibre ropes were much smaller, due to the low axial stiffness in
comparison with steel wire rope and chain. Therefore fatigue loading
was substantially reduced. The highest RMS wave frequency tension
range found for systems based on PET fibre ropes in all the case studies
analysed was 16.4% of MBL, except in 500 m in the West of Shetlands.
6. The results for the systems based on PET ropes in 500 m in the West of
Shetlands, indicated that the stiffness of the fibre ropes selected was too
high for the application. Ropes with more compliant constructions and/or
fibre could probably retain the same offset and safety factor criteria at a
lower cost, by attracting lower first order wave frequency loads.
7. For a water depth of 500 m in the West of Shetlands, all steel systems
were found to be in danger of being subjected to very low minimum
tensions. Even in 1000 m, a system based on a stiffer light weight fibre
(aramid) rope and an all steel system were both found to be far from safe
with respect to near slack conditions. This is potentially very dangerous
for tethers susceptible to kinking (aramid fibre ropes) or torsional
instabilities (steel wire ropes). Cyclic tensions with low minimum loads
were not predicted in the designs incorporating polyester fibre ropes, due
to the lower dynamic loads.
8. Low frequency tensions in the combined systems incorporating PET fibre
ropes were found to be of similar magnitude to those in the all steel
systems, however they represented a larger proportion of the MBL of the
tethers. This tendency was accentuated in the PET rope systems with
piles.
9. Based on prices obtained in 1989, the material cost of optimum
combined PET Superline rope-chain systems was found to be lower than
all steel systems in all conditions analysed, the advantage being greater
in the West of Shetlands.
180

10. A similar comparison incorporating a cost penalty for additional
buoyancy to react the vertical loads imposed by the tethers in the
platform, based on costs found in the literature, increased the advantage
of systems based on PET fibre ropes. Typical costs became 70% of that
of the corresponding all steel system.
11. Optimum cost systems based on a Superline aramid fibre rope in
combination with chain were found to be substantially more expensive
than the all steel option in 1000 m in the West of Shetlands. Also the
wave frequency tensions associated with storm conditions were of the
same proportion in relation to the MBL of the rope as in the equivalent
steel system.
12. Systems based on taut inclined PET Superline ropes connected to piles
showed a similar tension response as the PET rope-chain combination,
however a bonus low offset was obtained (at optimum cost). Although the
material cost was found to be much lower (typically 50%) than the all
steel system, a meaningful cost comparison can only be made if the
capital and installation cost of the systems are accounted for.
13. The assumption of a "frozen catenary" first order wave frequency
behaviour was found to be a convenient and reasonably accurate way of
computing the line tensions associated with these motions for systems
incorporating PET fibre ropes. However results obtained using the
"frozen catenary" assumption for all steel systems and combined systems
with aramid fibre ropes were found to be excessively conservative,
especially for the shallower water depths.
14. The performance of a quasi-static analysis procedure for systems based
on PET ropes in Campos Basin was very good. However the same was
not found either for the same systems in the West of Shetlands cases or
for the all steel systems in either location.
15. Based on the above results, the following recommendations are made
concerning analysis methods for systems incorporating fibre ropes:
(i) comparison of systems based on low twist PET fibre ropes in
benign environments such as Campos Basin can be performed
181

by means of a quasi-static analysis procedure;
(ii) comparison of systems based on low twist PET fibre ropes in
any location can be performed by means of a quasi-static
analysis procedure, accounting for the first order wave frequency
tensions by means of a "frozen catenary" assumption; and,
(iii) comparisons involving all steel systems and/or systems
incorporating high modulus light weight tethers should be
performed using a dynamic analysis procedure.
16. The specific tensile strengths obtained for the Superline and Brascorda
Parallel 60 kN model ropes were found to be 0.58 and 0.55 N/tex,
respectively, which is approximately 74% of the specific strength of the
yarns removed from these ropes. These results correspond to
approximate ultimate tensile stresses of 0.55 and 0.56 GPa (based on
the enclosed area of the rope core). Published results for a 1157 kN UBL
Superline rope agree well with the results of this study. The scatter
observed in the tensile test results was comparable with available data
for steel wire ropes including termination failures.
17. Rope axial stiffness was found to vary substantially according to whether
the tethers were loaded at first order wave frequency,low frequency or
statically. This behaviour should be taken into account in designing the
system.
18. Typical stiffness values obtained for the model ropes were 7.3, 13.6 and
16.3 GPa for the Superline and 9.7, 16.2 and 19.2 GPa for the Brascorda
Parallel at wave frequency, low frequency and quasi-static conditions
respectively. Values corresponding to 90% of the stiffness measured for
the model ropes at low frequency and for the quasi-static conditions, and
the full value measured at wave frequency were used in the case studies
and are advocated as reasonably safe assumptions for full size ropes.
19. A simple structural model was found to produce reasonably good
predictions for the dynamic stiffness of the Brascorda Parallel rope based
on the stiffness measurements for the polyester yarn. A similar model
gave passable results for the Superline rope. For both ropes predictions
182

were conservative. The quality of the prediction was found to improve for
loading conditions leading to high stiffness. For typical extreme loads,
stiffness predicted for the Brascorda Parallel overestimated the actual
modulus by between 1 and 11%. For the Superline the prediction was
out by between 5 and 18%.
20. It was found that the influence of long term constant load or long term
cycling between fixed load limits, on the low frequency or wave
frequency stiffness of low twist PET fibre ropes, is small and need not be
considered. Furthermore these conditions do not occur in practical
applications, due to the random nature of the tensions acting on the
mooring lines.
21. The hysteretic damping in the most compliant rope tested, the Superline,
was found to be similar to published data for polyester fibres, indicating
very little effect of constructional hysteresis. The loss coefficient
measured after 1000 cycles at 20±10% of UBL at 0.133 Hz, 0.0265, was
substantially lower than peak values reported in the literature for large
steel spiral strands, and also lower than values for a 13 mm diameter six
strand wire rope obtained here. Therefore it is thought that, as with wire
ropes, hydrodynamic damping will predominate over internal damping, in
the design of systems incorporating low twist PET fibre ropes. It was also
verified that the amount of heat generated by cycling would not be
sufficient to increase the temperature of the core, of a full size rope of the
constructions studied, by more than 1.9°C.
22. The elongation of the fibre rope during loading simulating installation
(50% of UBL for 30 minutes), was found to be the dominant parameter
controlling the minimum length of the upper steel component needed in
the concepts investigated here. Typical values for this elongation were
8.0 and 8.6% for the Brascorda Parallel and the Superline respectively.
23. PET yarn creep rates were confirmed to decrease with the logarithm of
time. The same trend was observed in the model ropes. Although creep
rates were similar for the two ropes tested, the total elongation of the
Superline, at 30% of UBL, was approximately 1.4% more than that of the
183

Brascorda Parallel.
24. Guidance on line retensioning due to creep is given in this study. If an
installation procedure similar to the one modelled is implemented,
retensioning of the mooring lines in 1000 m water depth is expected to
be needed between 5 and 10 times, for a period of operation of 10 years.
Most of the retensionings would have to take place at the beginning of
this period.
25. The tests performed to assess the combined effect of a sea water
environment and constant loads at levels likely to be found on a mooring
rope did not show a quantifiable reduction in yarn or rope samples, for
periods of up to one year. On the basis of the results obtained here and
from published data it is considered safe to assume a constant rate of
reduction in strength of 1% per year. This rate should not be used for
extrapolations beyond ten years.
26. Samples of both model ropes studied, cycled for 1 million cycles at
20±10% of UBL, showed no degradation in the rope free length and only
minor abrasion damage in the terminations. This result is corroborated by
limited published data for a 1157 kN Superline rope. Considering the
cyclic loads forecasted by the "pilot study" and the case studies
performed here, "fatigue" is not a problem for these ropes in the
application which has been addressed. The indications of abrasion
damage highlighted the need to validate terminations in full size tests.
10.2 Further Work
It is considered that short term work aimed at promoting the implementation of
mooring systems incorporating low twist polyester fibre ropes should be
directed to:
(i) full scale static and "fatigue" testing to validate termination design
and to confirm the stiffness characteristics relevant to design; and,
(ii) development of detailed installation procedures, having in mind the
danger of damage to fibre ropes when bearing against sharp
184

edges.
Necessary long term further work is seen to include:
(i) development of improved termination methods, possibly by
obtaining improved pressure distribution in resin sockets, to extract
more strength from low twist PET fibre ropes, and to reduce the
likelihood of "fatigue" damage associated with the terminations;
(ii) additional environmentally assisted degradation tests for periods of
up to five years to extend the safe operational life of PET fibre ropes
beyond ten years;
(iii) development of procedures for monitoring the in service
degradation of these ropes;
(iv) refinement of cost analysis and tools to do it, incorporating the
anchoring methods (including piling), the installation procedures
and the operational life of the mooring;
(v) an investigation of the use of low stiffness tethers in tension leg
platforms; and,
(vi) the performance of low twist polyester fibre ropes operating over a
fairlead and onto a winch drum.
Finally it is worth noting that a preliminary bending-tension (Chaplin (1986))
test was performed on a sample of the model Superline, cycled at 20±10% of
UBL at 0.19 Hz with an angle of wrap of 45° over a pulley with 240 mm
diameter and with a bending length of 30 mm. The test was stopped after
156600 cycles, approximately 2.5 times the expected life of a similar sized six-
strand wire rope (Ridge (1992)). Abrasion damage was found to be
concentrated in the rope cover and the residual strength was 53.2 kN (93% of
UBL).
185

11. REFERENCES
AKZO (undated) "Diolen 855T Product Specification". Arnhem, TheNetherlands, undated.
AKZO (1991) "Specification and Production Performance of Diolen 855TYarn in 1990". AKZO, 1991.
Andreassen, R. (1991) "Offshore Mooring Chain - Setbacks & Progress".Proceedings of International Offshore Mooring Seminar, London,Oct. 1991.
API RP 2P (1987) "Recommended Practice for Analysis of Spread MooringSystems for Floating Drilling Units". American Petroleum Institute,2nd edn., May 1987.
API RP 17A (1987) "Recommended Practice for Design and Operation ofSubsea Production Systems". American Petroleum institute, 1st edn.,Sept. 1987.
API RP 17B (1987) "Recommended Practice for Flexible Pipe". AmericanPetroleum institute, 1st edn., June 1988.
API RP 2T (1987) "Recommended Practice for Planning, Designing andConstructing Tension Leg Platforms". American Petroleum Institute,1st edn., 1987.
API RP 2Q (1984) "Recommended Practice for Design and Operation ofMarine Drilling Riser Systems". American Petroleum Institute, 2ndedn., April 1984.
API RP 2FP1 (1991) "Recommended Practice for Design, Analysis andMaintenance of Moorings for Floating Production Systems".American Petroleum Institute, draft for industry review, May 1991.
ASTM D885-85 (1985) "Standard Methods of Testing Tire Cords, Tire CordFabrics, and Industrial Filament Yarns Made from Man-MadeOrganic-Base Fibers". American Society for Testing and Materials,1985.
ASTM D1141-75 (1975) "Standard Specification for Substitute OceanWater". American Society for Testing and Materials, 1975.
ASTM D2256-88 (1988) "Standard Test Method for Tensile Properties ofYarns by the Single - Strand Method". American Society for Testingand Materials, 1988.
Ballara, A. & Verdu, J. (1989) "Physical Aspects of the Hydrolysis ofPolyethylene Terephthalate". Polymer Degradation and Stability, vol.26, no. 4, 1989, pp. 361-374.
186

Banfield, S.J. (1989) "Technical Discussion on the Use of PolyesterSuperline Ropes in Moorings". Dec. 1989.
Baxter, C. (1988) "Uses of Parafil Ropes for Mooring Offshore Platforms".Symposium on Engineering Applications of Parafil Ropes, London,Jan. 1988.
Beers, D.E. & Ramirez, J.E. (1990) "Vectran Fiber for Ropes and Cables".Proceedings of Marine Technology Society - Science andTechnology for a New Oceans Decade (MTS 90), Washington, Sept.1990, pp. 662-669.
Berteaux, H.O., Prindle, B. & Putnam, S.S. (1990) "Monitoring FishbiteActivities and Protecting, Synthetic Fiber Ropes Used in Deep SeaMoorings". Proceedings of Marine Technology Society - Science andTechnology for a New Oceans Decade (MTS 90), Washington, Sept.1990, pp. 301-312.
Beyer, H.B. (1989) "Personal Communication on the strength, Stiffness andCost of Kevlar Ropes". May 1989.
Bitting, K.R. (1980) "The Dynamic Behaviour ot Nylon and Polyester Line".Coast Guard Research and Development Center, USCG-D-39-80,Apr. 1980.
Bitting, K.R. (1980) "Cyclic Tests of New and Aged Nylon and Polyester Line".Proceedings of offshore Technology Conference, OTC 3852, Texas,May 1980.
Bleakley, W.B. (1984) "What structures to Expect for DeepwaterDevelopments". Petroleum Engineer International, Nov. 1984.
Borwick, G.R., Elliot, G. (1971) "Dynamic Properties of Marine Fibre Ropes".Proceedings of 2nd. International Tug Conference, Oct. 1971.
British Ropes (1987) "Blue strand Steel Wire Ropes". British Ropes Ltd.,1987.
British Ropes (1989) "Private Communication Concerning the Strength andStiffness of Spiral Strands". May 1989.
BS 4618: Section 1.1 (1970) "Recommendations for the Presentation ofPlastics Design Data. Part 1. Mechanical Properties. Section 1.1Creep". British Standards Institution, London, Aug. 1970.
BS 1932:Part 1 (1989) "Testing the Strength of Yarns and Threads fromPackages". British Standards Institution, London, 1989.
BS 7035 (1989) "Code of Practice for Socketing of Stranded Steel WireRopes". British Standards Institution, London, 1989.
Bunsell, A.R. & Hearle, J.W.S. (1974) "The Fatigue of Synthetic Polymeric
187

Fibers". Journal of Applied Polymer Science, vol. 18, 1974, pp. 267-291.
Burgoyne, C.J. & Flory, J.F. (1990) "Length Effects Due to Yarn Variability inParallel - Lay Ropes". Marine Technology Society - Science andTechnology for a New Oceans Decade (MTS 90), Washington, Sept.1990, pp. 49-55.
Casey, N.F. (1988) "Fatigue Testing of Wire Ropes". Wire Industry, 1988, pp.758-761.
Chandler, K.A. (1985) "Marine and Offshore Corrosion". Butterworths, 1985.
Chaplin, C.R. (1989) "Light Weight Material for Offshore Station KeepingFinal Report of a Joint Industry Project. Project Overview". Nov. 1989.
Chaplin, C.R. (1982) "Private Discussion on the Strength of Steel WireRopes". May 1982.
Chaplin, C.R. & Del Vecchio, C.J.M. (1992) "Appraisal of LightweightMoorings for Deep Water". Proceedings of 24th Offshore TechnologyConference, OTC 6965, Houston, Texas, May 1992.
Chaplin, C.R. & Potts, A.E. (1991) "Wire Rope Offshore - A Critical Review ofWire Rope Endurance Research Affecting Offshore Applications".Health & Safety Executive - Offshore Technology Report, HMSOpublication OHT91 341, London, 1991.
Chaplin, C.R. & Sharman, P.C. (1984) "Load Transfer Mechanics in ResinSocketed Terminations". Wire Industry, Oct. 1984.
Chen, J. (1988) "Three-Strand Rope Behaviour in Tension and Torque". MScThesis, Massachusetts Institute of Technology, Department ofMechanical Engineering, Sept. 1988.
Childers, M.A. (1973) "Mooring Systems for Hostile Waters". PetroleumEngineer, May 1973.
Childers, M.A. (1974) "Deep Water Moorings". Part I, Sept. 1974.
COBAFI (undated) "PET 855T Resultados de Testes". PET 855T Test Results(in Portuguese). Sao Paulo, undated.
Cordoaria Sao Leopoldo (undated) "Manual de Costuras". Splicing Manual(in Portuguese). São Leopoldo, undated.
Crawford, H. & McTernan, L.M. (1985) "Cyclic Load Testing at Sea-WaveFrequency of Continuously Wetted Man-Made Fibre Rope".Proceedings of Offshore Technology Conference, OTC 5061,Houston, 1985.
Crawford, H. & McTernan, L.M. (1983) "Cyclic Testing of Continuously WettedSynthetic Fiber Ropes". Proceedings of Offshore Technology
188
Conference, OTC 4635, Houston, May 1983.
Crawford, H. & McTernan, H.M. (1988) "Fatigue Properties of Parafil".Symposium on Engineering Applications of Parafil Ropes, London,Jan. 1988.
Croll, S.G. (1973) 'The Non-Linear Mechanical Response of Polymers". PhDThesis, University of Leeds, 1973.
D'Alo, B. & Ciaperoni, A. (1977) "The Chemical and Related Characteristicsof Polyester Fibres". 9th Shirley International Seminar, PolyesterTextiles, May 1977, pp. 55-84.
Davies, S. (1989) "The Man-Made Fibre Industry in Japan. Profiting fromHigh Technology". The Economist Intelligence Unit, London, March1989.
Davies, G.W. & Hill, E.S. (1984) "Polyester Fibers". In "Kirk - OthmerEncyclopedia of Chemical Technology", 3rd edn., 1984, vol. 18, pp.531-549.
Davies, G.W. & Talbot, J.R. (1985) "Polyester, Fibres". In Mark, H.F., Bikales,N.M., Overberger, C.G. & Menges, G. "Encyclopedia of PolymerScience and Engineering"., vol.12, 1985, pp. 118-193.
Del Vecchio, C.J.M. (1988) "Installation of a 50m Length of Aramid Rope in aChain Mooring Line". Rio de Janeiro, 1988.
Del Vecchio, C.J.M. (1989) "Pilot study on Light Weight Material for OffshoreStation Keeping. Review of Light Weight Mooring Materials". Oct.1988.
DnV POSMOOR (1989) "Rules for Classification of Mobile Offshore Units Part6 Chapter 2 Position Mooring". Det norske Veritas, Hovik, Norway,July 1989.
Dortmans, J.P.M. (1988) "Application of the High-speed Spinning Techniqueto PETP Industrial Yarns". In "Polyester Textiles: Papers Presented ata Shirley Institute Conference". Manchester, Shirley Institute, 1988.
E.I. du Pont de Nemours & Co. (undated) "Comparative Performance ofKevlar Aramid in Mooring Lines". Undated.
E.I. du Pont de Nemours & Co. (undated) "Riser Tensioner. Pendant.Mooring". Undated.
E.I. du Pont de Nemours & Co. (1987) "Kevlar Aramid Fiber Optic DatabaseManual". Wilmington, 1987.
Ellison, M.S., Fisher, L.D., Alger, K.W. & Zeronians, S.H. (1982) "PhysicalProperties of Polyester Fibers Degraded by Aminolysis and byAlkaline Hydrolysis". Journal of Applied Polymer Science, vol. 27,
189

1982, pp. 247-257.
ENKA (1985, 1) "Man-Made Fibres. Principles and Fields of Application moreParticularly with Respect to Rope". Arnhem, The Netherlands, June1985.
ENKA (1985, 2) "Twaron for Ropes and Cables". Arnhem, The Netherlands,1985.
ENKA (1985, 3) "Weathering Properties of Polyester and Polyamide".Arnhem, The Netherlands, 1985.
Flory, J.F. (1988) "OCIMF Hawser Guidelines and Procedures". Proceedingsof Offshore Technology Conference, OTC 5721, Texas, May 1988.
Flory, J.F. , Parsey, M.R. & Banfield, S.J. (1990) "Factors Affecting Life ofSynthetic Fiber Ropes in Marine Service". Proceedings of MarineTechnology Society - Science and Technology for a New OceansDecade (MTS 90), Washington, Sept. 1990, pp. 281-286.
Flory, J.F. , Parsey, M.R. & McKenna, H.A. (1988) "The Choice Between Nylonand Polyester for Large Marine Ropes". Proceedings of 7thConference on Offshore Mechanics and Arctic Engineering, OMAE-88-781, Houston, Feb. 1988.
Ford, J.E. (1988) "Polyester: A Technical and Commercial Perspective". In:"Polyester Textiles: Papers Presented at a Shirley InstituteConference". Manchester, Shirley Institute, 1988.
Global Maritime Ltd. (1989, 1) "Pilot Study on Light Weight Materials forOffshore Station Keeping. A Comparison of the Performance ofLightweight and Conventional Catenary Mooring Systems". Oct.1989.
Global Maritime Ltd. (1989, 2) "Pilot Study on Light Weight Materials forOffshore Station Keeping. Assessment of Light Weight Materials forUse as TLP Tethers". Sept. 1989.
Global Maritime Ltd. (1989, 3) "A Proposal for a Cooperative (Joint Industry)Project to Establish the Feasibility and Cost Effectiveness of DeepWater Catenary Moorings for Offshore Platforms".1989.
Goksoy, M. (1986) "A Study of Yarn-on-Yarn Abrasion". PhD Thesis,Department of Textiles, University of Manchester Institute of Scienceand Technology, Manchester, 1986.
Greenwood, J.H. & Rose, P.G. (1974) "Compressive Behaviour of Kevlar 49Fibers and Composites". Journal of Material Science, no. 9, 1974, pp.1809-1814.
GVA - Gotaverken Arendal AB (1990) "Technical Report - Semi-SubmersibleUnit - Petrobras XVIII. Mooring Analysis Re. 1 - Quasi Static and
190

Dynamic Analysis. Rev. B". 1990.
H & T Marlow Ltd. (1985) "Superline Product Catalogue". Hai!sham, 1985.
Hadley, D.W., Pinnock, RR. & Ward, I.M. (1969) "Anisotropy in Oriented Fibresfrom Synthetic Polymers". Journal of Materials Science, vol. 4, 1969,pp. 152-165.
Hanna, S.Y., Thomason, W.H. & Williams, J.G. (1987) "Influence of Tension,Weight and Hydrostatic Pressure on Deepwater TLP Tendons".Proceedings of Offshore Technology Conference, OTC 5610,Houston, April 1987.
Hasegawa, H., Hashimoto, T., Fukuda, M., Kawai, H. & Han, C.C. (1989)"Small-Angle Neutron Scattering Study for Characterising the WaterSorbed in High Speed Spun Poly(Ethylene Terephthalate)Filaments". Sen-I Gakkaishi, vol. 45, no.11, 1989, pp. 447-454.
Hearle, J.W.S. (1967) "The Structural Mechanics of Fibres". Journal ofPolymer Science: Part C, no. 20, 1967, pp. 215-251.
Hearle, J.W.S. (1991) "The Structural Mechanics of Fibres: 20 Years Review".Journal of Applied Polymer Science - Applied Polymer Symposia,vol. 47, 1991.
Hearle, J.W.S., Grosberg, P. & Backer, S. (1969) "Structural Mechanics ofFibers, Yarns and Fabrics. Volume 1". Wiley - Interscience, New York,1969.
Hearle, J.W.S., Lomas, B., Cooke, W.D. & Duerden, I.J. (1989) "Fibre Failureand Wear of Materials. An Atlas of Fracture, Fatigue and Durability".Ellis Horwood, 1989.
Hearle, J.W.S. & Parsey, M.R. (1983) "Fatigue Failures in Marine Ropes andTheir Relation to Fibre Fatigue". Plastic and Rubber Institute London,Fatigue in Polymers, 1983, pp. 16.1-16.11.
Hobbs, R.E. & Raoof, M. (1985) "The Behaviour of Large Spiral Strands".Proceedings of OIPEEC Round Table Conference, Glasgow, Jan.1985.
Holman, J.P. (1987) "Heat Transfer". McGraw-Hill, 6th edn., 1987.
Hood, H.A. (1978) "Comparison Tests for Fiber Ropes". Sea Technology, July1978.
Horn, M.H. Riewald, P.G. & Zweben, C.H. (1977) "Strength and DurabilityCharacteristics of Ropes and Cables from Kevlar Aramid Fibers".Proceedings of Oceans' 77 Conference, Marine Technology society &IEEE Council on Oceanic Engineering Los Angeles, Oct. 1977.
Horton, E.E., McCammon, L.B., Murtha, J.R. & Pauling, J.R. (1972)
191

"Optimisation of Stable Platform Characteristics". Proceedings ofOffshore Technology Conference, OTC 1553, Houston, May 1972.
ICI (undated) Technical note TA1/3 - "Chemical Properties of Terylene". ICIIndustrial Fibres Manual, Harrogate, UK, undated.
Ingamells, W., Lilou, S.H. & Peters, R.H. (1981) "The Accessibility of SulfonicAcid Groups in Basic Dyeable Polyester Fibers. I. The Prevention ofFiber Hydrolysis During Dyeing". Journal of Applied PolymerScience, vol. 26, 1981, pp.4087-4094.
ISO 2307 (1972) "Ropes - Determination of Certain Physical and MechanicalProperties. ISO 2307/72". ISO (The International Organisation forStandardisation) with Amendment 1 (1974), Switzerland, 1974.
Karnoski, S.R. & Liu, F.C. (1988) "Tension and Bending Fatigue Test Resultsof Synthetic Ropes". Proceedings of Offshore TechnologyConference, OTC 5720, Houston, May 1988.
Kenney, M.C. (1983) "Effects of Fatigue and a Sea Water Environment onNylon Fibers, Yarns, and Small Ropes". PhD Thesis, Department ofMaterial Science and Engineering, Massachusetts Institute ofTechnology, June 1983.
Kenney, M.C., Mandell, J.F. & McGarry, F.J. (1985) "Fatigue Behaviour ofSynthetic Fibres, Yarns and Ropes". Journal of Material Science, 20,1985, pp. 2045-2059.
Kim, K.S., Hahn, H.T. & Williams, J.G. (1988) "Application of Composites inTLP Tethers". Proceedings of 7th International Conference onOffshore Mechanics and Arctic Engineering, Houston, Feb. 1988.
Kingston, D. (1988) "Development of Parallel Fibre Tension Members".Proceedings of Symposium on Engineering Applications of ParafilRopes, London, Jan. 1988.
KIRK - OTHMER (1984) "Tire Cords". Encyclopedia of Chemical Technology3rd edn., vol. 23, 1984, pp.78-81.
Kirschbaum, R. (undated) "Advances in Gel-spinning Technology andDynema Fiber Applications". Sittard, The Netherlands, undated.
Koralek, A.S. & Barden, J.K. (1987) "Performance of a Lightweight AramidMooring Line". Proceedings of Offshore Technology Conference,OTC 5381, Houston, April 1987.
Larsen, C.M. & Fylling, I.J. (1982) "Dynamic Behaviour of Anchor Lines".Proceedings of 3rd International Conference on the Behaviour ofOffshore Structures, Cambridge, Aug. 1982.
Lazan, B.J. (1968) "Damping of Materials and Members in StructuralMechanics". Pergamon Press, Oxford, 1968.
192

Lewis, R.E. (1982) "An Overview of Deepwater Compliant Structures".American Petroleum Institute, Production Department, 1982 AnnualMeeting, pp. E1-E17.
Lewis, S.G. (1982) "Ropes and Cables of Kevlar Aramid". Wilmington, Oct.1982.
Li, S., Curran, E., Backer, S. & Griffith, P. (1990) "Hysteresis Heating ofSynthetic Fiber Ropes". Proceedings of Marine Technology Society -Science and Technology for a New Oceans Decade (MTS 90),Washington, Sept. 1990, pp. 295-300.
Lim, F.K. (1988) "Assessment of Alternative Materials and Designs for TLPTethers". Proceedings of 7th International Conference on OffshoreMechanics and Arctic Engineering, Houston, Feb. 1988.
Linear Composites Ltd. (1983) "Basic Physical Properties of Parafil Ropes".Technical Note 1, 2nd edn., Harrogate, April 1983.
Linear Composites Ltd. (undated) "Untitled - Report on the Tensile Test in a140 mm Type F Parafir. Harrogate, undated.
Ludewig, H. (1971) "Polyester Fibres, Chemistry and Technology". Wiley -Interscience, New York, 1971.
Mandell, J.F. (1987) "Modelling of Marine Rope Fatigue Behaviour". TextileResearch Journal, vol. 57, no. 6, June 1987.
Mandell, J.F., Steckel, M.G., Chung, S.-S. & Kenney, M.C. (1987) "Fatigueand Environmental Resistance of Polyester and Nylon Fibers".Polymer Engineering and Science, vol. 27, no.15, Aug. 1987, pp.1121-1127.
Mayo, N.C. (1972) "Polyurethane - Coated Nylon Pendants for Marine Use".MTS Journal, vol. 6, no. 5, Sept.-Oct. 1972, pp. 17-23.
McCabe, C. (1991) "Auger Field Challenges Drive TLP Design Innovation".Ocean Industry, Aug. 1991, pp. 57-62.
McKenna, H.A. (1979) "Synthetic Fiber Rope, Properties and CalculationsRelating to Mooring Systems". ASME Ocean Engineering DivisionDeep Water Mooring & Drilling, vol. 7, 1979.
McKenna, H.A. (1987) "Advances in High Performance Synthetic FiberTension Members". Proceedings of the 10th annual Energy - SourcesTechnology Conference and Exhibition, Dallas, Feb. 1987.
McKenna, H.A. (1987) "Polyurethane Coated Fiber Ropes for MooringSystems". AICHE Symposium series - Hazardous Chemicals, vol. 76,no. 194, 1980, pp. 127-132.
McKenna, H.A. (1990) "High Performance Polyester Rope". Proceedings of
193

Marine Technology society - science and Technology for a NewOceans Decade (MTS 90), Washington, Sept. 1990, pp. 656-661.
McKenna, H.A. (1991) "High Performance Polyester Rope". Sea Technology,July 1991, pp. 10-12.
McMahon, W., Birdsall, H.A., Johnson, G.R. & Camilli, C.T. (1959)"Degradation of Polyethylene Terephthalate". Journal of Chemicaland Engineering Data, vol. 4, no. 1, Jan. 1959, pp. 57-79.
Miller, I., Freund, J.E. & Johnson, R.A. (1990) "Probability and Statistics forEngineers". Prentice Hall International, London, 4th edn., 1990.
Morch, M. & Moan, T. (1985) "Comparison Between Measured andCalculated Behaviour of a Moored Semi-Submersible Platform".Behaviour of Offshore Structures, 1985.
Morton, W.E. & Hearle, J.W.S. (1975) "Physical Properties of Textile Fibers".John Wiley & Sons, New York, 1975.
National Coal Board (1979) "64-mm Diameter 'Viking' Polyester BraidlineRopes. Bridon Fibres and Plastics Umited". National Coal Board,Mining Research and Development Establishment,1979.
Niedzwecki, J.M. (1978) "A Comparison of Nonmetallic Ropes with WireRope and Chain Mooring Lines for Deep Water Applications".Proceedings of Offshore Technology Conference, OTC 3207,Houston, May 1978.
Niedzwecki, J.M. & Casarella, M.J. (1976) "On the Design of Mooring Linesfor Deep Water Applications". Transactions of ASME, Journal ofEngineering for Industry, vol. 98, May 19876, pp. 514-522.
Noble Denton & Associates Inc. (1986) "Deep Water Catenary MooringSystems for floating Production Platforms. Final Report. Volume III.Deterministic Mooring Analysis Program Suite DMOOR UserManual". 1986.
Ochi, M.K. & Shin, Y.S. (1988) "Wind Turbulent Spectra for DesignConsideration of Offshore Structures". Proceedings of OffshoreTechnology Conference, OTC 5736, Houston, May 1988.
Oudet, C. & Bunsell, A.R. (1987) "Effects of Structure on the Tensile, Creepand Fatigue Properties of Polyester Fibres". Journal of MaterialScience, vol.22, 1987, pp. 4292-4298.
Parsey, M. (1982) "Fatigue of SPM Mooring Hawsers". Proceedings ofOffshore Technology Conference, OTC 4307, Houston, May 1982.
Parsey, M. (1983) "The Fatigue Resistance and Hysteresis of Man-MadeFibre Ropes". Offshore Europe 83, SPE 11908, Aberdeen,September 1983.
194

Parsey, M. , Hearle, J.W.S. & Banfield, S.J. (1987) "Life of Polymeric Ropesin the Marine Environment". Polymers in a Marine Environment,1987, pp.205-214.
Parsey, M.R., Street, A. & Banfield, S.J. (1985) "Dynamic Behaviour of MarineRisers". Proceedings of Offshore Technology Conference, OTC 5009,Houston, May 1985.
Petrobras S.A. (1989) "Especificagdo Tecnica de Dados Meteo-Oceanograficos. Campo de Marlim". Technical Specification ofOceano-Meteorological Data. Marlin Field (in Portuguese).Petrobrds/Cenpes/Supen, Rio de Janeiro, Rev. A, 1989.
Petrobras S.A. (1991) "Unpublished report on the water temperature profile inMarlin Field". PetrobrAs S.A., 1991.
Philadelphia Resins Co. (1982) "Socket Fast the Convenient Resin Systemfor Socketing Wire Rope". Philadelphia Resins Co. Montgomeryville,1982.
Phoenix, S.L (1979) "Statistical Theory for the Strength of Twisted FiberBundles with Applications to Yarns and Cables". Textile ResearchJournal, vol. 49, 1979, pp. 407-423.
Pollack, J. & Hwang, Y.L. (1982) "A Permanent Mooring for a DeepwaterProduction System". Proceedings of Offshore TechnologyConference, OTC 4347, Houston, May 1982.
Prevorsek, D.C. & Kwon, Y.D. (1976) "Structural Interpretation of Enduranceof Polymeric Fibers". J. Macromol. Sci.-Phys., B12, 1976, pp. 447-485.
Ractliffe, A.T., & Parsey, M.R. (1985) "Man-Made-Fibre Ropes for MarineUse". North East Coast Institute of Engineers and Shipbuilders, 1985,Session 101.
Reading Rope Research & Global Maritime Ltd. (1988) "Pilot Study Proposalon Light Weight Materials for Offshore Station Keeping". ReadingRope Research & Global Maritime Ltd,1988.
Ridge, I.M.L. (1992) "Bending - Tension Fatigue". PhD Thesis, Department ofEngineering, University of Reading, 1992.
Riewald, P.G. (1986) "Performance Analysis of an Aramid Mooring Line".Proceedings of Offshore Technology Conference, OTC 5187,Houston, May 1986.
Riewald, P.G. (1979) "Ropes and Cables from Aramid Fibers for OceansSystems". 87th National Meeting of American Institute of ChemicalEngineers, Boston, 1979.
Riewald, P.G., Walden, R.G., Whitehill, A.S. & Koralek, A.S. (1986) "Design
195

and Deployment Parameters Affecting the Survivability of StrandedAramid Fiber Ropes in the Marine Environment". IEEE Oceans' 86Conference Proceedings, Washington, 1986.
Rim, P.B. & Nelson, C.J. (1991) "Properties of PET Fibres with High Modulusand Low Shrinkage (HMLS). I. Yarn Properties and Morphology".Journal of Applied Polymer Science, vol. 42, 1991, pp. 1807-1813.
Roberts, W.J. (1984) "Fibers, Chemical". Kirk-Othmer Encyclopedia ofChemical Technology, 3rd edn., vol. 10, 1984, pp. 148-166
Salama, M.M. (1984) "Lightweight Materials for Mooring Lines of DeepwaterTension Leg Platforms". Marine Technology, vol. 21, no. 3, 1984.
Salama, M.M. (1986) "Lightweight Materials for Deepwater OffshoreStructures". Proceedings of Offshore Technology Conference, OTC5185, Texas, May 1986.
Salama, M.M., Williams, Jr., J.H., Lee, S.S. & Vennet, R.M. (1985) "Materialsfor Lightweight Mooring Systems for Deepwater CompliantStructures". Proceedings of 4th ASME et Al. Int. Offshore Mech. &Arctic Engineering Symp., Dallas, 1985.
Salama, M.M. & Tetlow, J.H. (1983) "Selection and Evaluation of HighStrength Steel for Hutton TLP Tension Leg Elements". Proceedings ofOffshore Technology Conference, OTC 4449, Houston, May 1983.
Smith, I., White, G.J., Collings, C.S. (1985) "Synthetic Rope in the MooringSystem of the Hutton TLP". Proceedings of Offshore TechnologyConference, OTC 5063, Houston, May 1985.
Steckel., M.G. (1984) "Tensile Fatigue Behaviour of Polyester Yarns inAmbient and Sea Water Environments". MSc Thesis, Department ofMaterials Science and Engineering, Institute of Technology,Massachusetts, 1984.
Stidd, J. (1990) "Mechanical Properties of Technora Aramid Fiber andRopes". Marine Technology Society - Science and Technology for aNew Oceans Decade (MTS 90), Washington, 1990, pp. 677-680.
Street, A. (1989) "Fax Concerning the Twist to Be Used in the ModelSuperline Rope". Hailsham 1989.
Tabor, B.J. & Wagenmakers, J.C. (1991) "Some Long Term BehaviourAspects of Industrial Yarn, Related to Environmental Influence".Techtextil - Symposium, Frankfurt, May 1991.
Tantrun, N. & Chaplin, C.R. (1984) "Unpublished results of a Series of TensileStrength Determination in a Length of Wire Rope". 1984.
Taylor, R.J., Wadsworth, J.P., Shields, D.R. & Ottsen, M. (1987) "Design andInstallation of a Mooring System in 2,910 ft of Water". Proceedings of
196
Offshore Technology Conference, OTC 5529, Houston, April 1987.
Timoshenko, S.P. & Young, D.H. (1965) "Theory of Structures". McGraw - Hill,2nd ed., 1965.
Toomey, C.J., Mandell, J.F. & Backer, S. (1990) "Dynamic Behaviour of Nylonand Polyester Ropes under Simulated Towing Conditions". MarineTechnology Society - Science and Technology for a New OceansDecade (MTS 90), Washington, 1990, pp. 62-67.
van den Boom, H.J.J. (1985) "Dynamic Behaviour of Mooring Lines".Proceedings of 4th International Conference on Behaviour ofOffshore Structures, Delft, The Netherlands, July 1985.
Van Der Meer, S.J. (1970) "Dynamisch - Mechanische Eigenschappen enBlijvende Deformatie van Garens, Kooder en Weefsels". Dynamic-Mechanical Properties and Permanent Deformation of Yarns, Cordsand Plain-Weave Fabrics (in Dutch). PhD Thesis, TechnischeHogeschool Delft, Dec. 1970.
Van Leeuwen, J.H. (1981) "Dynamic Behaviour of Synthetic Ropes".Proceedings of Offshore Technology Conference, OTC 4003,Houston, May 1981.
Walton, J.M. & Yeung, Y.C.T. (1986) "The Fatigue Performance of StructuralStrands of Pultruded Composite Rods". Proc. I Mech E, Part C, 1986,pp. 315-320.
Ward, I.M. (1990) "Mechanical Properties of Solid Polymers". John Wiley &Sons, Chichester, 2nd edn., reprinted July 1990.
Werth, J.L. (1980) "An Evaluation of Materials and Rope Constructions forMooring Hawser Design". Proceedings of Offshore TechnologyConference, OTC 3851, Houston, May 1980.
Wiles, D.M. (1976) "Photo - Oxidative Reactions of Polymers". Journal ofApplied Polymer Science: Applied Polymer Symposia 35. Long-TermProperties of Polymers and Polymeric Material. Proceedings of theInternational Symposium held in Stockholm, Aug. 1976, pp.235-241.
Whinfield, J.R. & Dickson, J.T. (1946) "British Patent 578,079". 1946.
Wu, H.-C. (1990) "Modelling of Fibrous Assemblies. Tensile and BendingBehaviour". PhD Thesis, Department of Materials Science andEngineering, Institute of Technology, Massachusetts, June 1990.
Yoerger, D.R., Grosenbaugh, M.A., Triantafyllou, M.S. & Burgess, J.J. (1991)"Drag Forces and Flow-Induced Vibrations of a Long Vertical TowCable - Part I: Steady-State Towing Conditions". Journal of OffshoreMechanics and Arctic Engineering, vol. 113, Part 2, 1991, pp. 117-127.
197

extension›—
198
forceenergy disipated per cycle AU
o characteristic elastic energyinput per cycle U
A
APPENDIX 1
Hysteresis Terminology
The definitions presented here are based on Lazan (1968), where a full
description of the terminology used in damping is given.
Hysteretic damping is measured in terms of the energy dissipated per cycle
divided by a measure of the energy input per cycle. Linear materials present
elliptical hysteresis loops, while non-linear materials generally exhibit pointed
loops.
The energy dissipated per cycle (AU) is easily and uniquely identifiable, i.e.
the area inside the hysteresis loop, however several different definitions of
energy input have been used to obtain a non-dimensional measure of
hysteresis.
The definition of energy input per cycle more commonly used for wire ropes
(characteristic elastic energy input per cycle, U) is schematically represented
below and is adopted here.

From this definition of characteristic energy input various expressions are
used for non-dimensionalising the measurement of hysteresis. The
expressions found in the literature relevant to ropes are:
(i) loss coefficient, loss factor or tan 5,
=tan 5 =AU/2nU ;
(ii) logarithmic decrement,
A = AU/2U ; and,
(iii) relative damping,
D rei = AU/4U.
It should be noted that tan 8, for linear materials, is the ratio between the loss
modulus and the storage modulus.
199

APPENDIX 2
References for strength and stiffness values shown in Table 3.3
The strength values given in Table 3.3 have been based on the following
sources:
polyester double braid - Crawford & McTernan (1983) and National
Coal Board (1979);
polyester Superline - Karnoski & Liu (1988);
polyester Parafil - Riewald (1979) and Hood (1978);
polyester parallel strand - test performed for the "pilot study";
Spectra 900 double braid - estimate based on the polyester double
braid and the fibre strength ratio;
Kevlar 29 wire rope - Riewald et al. (1986), Riewald (1979) and
Koralek & Barden (1987);
Kevlar 29 Parafil - Riewald (1979), Karnoski & Liu (1988), and Hood
(1978);
Kevlar 49 wire rope - Riewald et al. (1986), Riewald (1979) and
Koralek & Barden (1987);
Kevlar 49 Parafil - Riewald (1979), Karnoski & Liu (1988), and Hood
(1978);
wire rope spiral strand - British Ropes (1989); and,
wire rope 6x36 - British Ropes (1987).
Wave frequency stiffnesses shown in Table 3.3 were based on the following
sources :
polyester double braid - National Coal Board (1979);
polyester Superline - Taylor et al. (1987);
polyester Parafil - yarn stiffness x filling factor (Linear Composites
Ltd. (1983));
polyester parallel strand - tested performed in the "pilot study";
Spectra 900 double braid - estimate based on the polyester double
braid and the fibres stiffness ratio;
Kevlar 29 wire rope - Riewald et al. (1986);
200


(4).
(5),
• APPENDIX 3
Rope Stiffness Model
Brascorda Parallel
The model is based on a formulation presented by Hearle et al. (1969). The
following equations from the book have been used:
I (h + h . sec a)/ 2 (1),
= Ey cos20 (2),
Ey = E f cos2a (3),
where:
I = mean length of filaments in a length h of twisted yarn;
h = length of one turn of twist;
a = surface angle of twist;
Ct = filament strain;
Cy = yarn strain;
0 = helical angle of filament;
E = specific modulus of the yarn; and,
Ef = specific modulus of the filament.
Let us call 0 the helical angle of the filament with length i . Then:
0= arc cos —h
Substituting (1) and (4) into (2) and sympliflying we get:( 2 2
el =EY • 1+seca)
where Ei is the strain in the filaments having the mean stress.
Let af and ay be the specific stress in the filament with average length and in the
yarn respectivelly. By definition:
o= Ei ei and,
202

(7),
(8).
ay = Ey . Ey •
Since all the filaments have the same modulus we can use interchangeably Ef
and Ef. Therefore we can write (3) as:
E = Ef- cos2a. (6).Y
Multiplying equation (5) by equation (6) and simplifying we get:
4 Ev . = Ey . E„ . /
7 kl +cosa)2
and using the definitions of of and ay we get:
4
(31 = GY . (1+cosa)2
For a strand it is necessary to approximate and write:
4
o- = a . (9)-Y s (1+cosa)2
The regression equations are based on loads as percentages of UBL, and so we
need to obtain an expression of the percentage of the yarn breaking load (%YBL)
as a function of the percentage of the strand breaking load (%SBL), to be used
with the yarn siffness regression equation.
By definition:
FsF;as = wa and 5 = 11,—; (10),
.. s viy
where:
Fs . Force in the strand;
F- - Force in the yarn with average length;Y-Ws . linear mass of the strand; and,
WY =linear mass of the yarn.
However:
Fs . %SBL . SBL and F- . %YBL . YBLY
203

where SBL and YBL are the breaking loads of the strand and of the yarn
respectivelly.
Therefore equations (10) can be writen as:
(YoSBL.SBLand
a_ = 'YoYBLYBL(12).as — Y Wws Y
Substituting the expressions for as and 5 into equation (9) we obtain:
4 SBL W_c cNBL . , '2 c'kUBLs • YBL • W_Y (13).
ki +cosa)2 s
For a given mean load or load amplitude in the strands of a Brascorda Parallel
rope (%SBL), equation (13) can be used to obtain the corresponding yarn loads
L m and La (mean and amplitude). These should be fed into the regression
equation (Section 7.2.1 equation (1)) to obtain E.
The modulus of the strand can then be obtained as:
E = •E cos2 a (14).s y
Superline
The model for the Superline begins in the same way as for the Brascorda Parallel
but a further approximation is needed, which considers the strands in each sub-
rope to be similar to yarns. Using the same equations for this additional level of
geometry we get:
4 4 CY
Y = G
r .
(1+cosa)2" (1+cos [3)2
where:
a . helix angle of the outermost yarn in the strand;
13. helix angle of the strands in the sub-rope; and,
ar = specific stress in the rope.
(15),
204