Final Statement of Policy on Qualifications for Failed Bank - FDIC
Upload
jonah-merithewCategory
view
213download
0
Déjà Vu All Over Again:Déjà Vu All Over Again: The Causes of U.S. Commercial Bank Failures The Causes of U.S. Commercial Bank Failures
ThisThis Time Around Time Around
bybyRebel A. Cole and Lawrence J. WhiteRebel A. Cole and Lawrence J. White
2010 FDIC Bank Research Conference2010 FDIC Bank Research Conference
Arlington, VAArlington, VA
Oct. 28, 2010Oct. 28, 2010

SummarySummary
We analyze the determinants of bank We analyze the determinants of bank failures occurring during calendar year failures occurring during calendar year 2009 (and first nine months of 2010).2009 (and first nine months of 2010).
We find that traditional proxies for the We find that traditional proxies for the CAMELS components, do an excellent job CAMELS components, do an excellent job in explaining the failures of banks that in explaining the failures of banks that were closed during 2009, just as they did were closed during 2009, just as they did in the previous banking crisis of 1985 – in the previous banking crisis of 1985 – 1992. 1992.

SummarySummary
C-A-E-L proxies include:C-A-E-L proxies include:
• C: Ratio of Total Equity to Total AssetsC: Ratio of Total Equity to Total Assets• A: Ratio of Nonperforming Assets to Total AssetsA: Ratio of Nonperforming Assets to Total Assets
NPA =PD30-89 + PD90 + Nonaccrual + REONPA =PD30-89 + PD90 + Nonaccrual + REO• E: Ratio of Net Income to Total AssetsE: Ratio of Net Income to Total Assets• L: Ratio of Liquid Assets to Total AssetsL: Ratio of Liquid Assets to Total Assets
Liquid Assets = Cash + SecuritiesLiquid Assets = Cash + Securities
SummarySummary
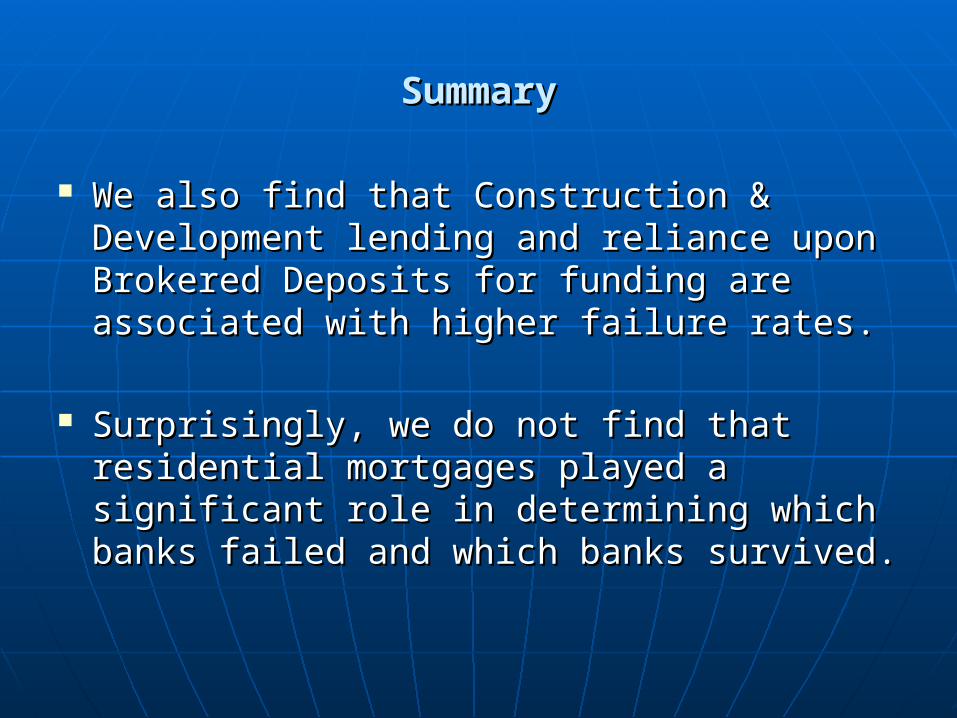
We also find that Construction & We also find that Construction & Development lending and reliance upon Development lending and reliance upon Brokered Deposits for funding are Brokered Deposits for funding are associated with higher failure rates.associated with higher failure rates.
Surprisingly, we do not find that residential Surprisingly, we do not find that residential mortgages played a significant role in mortgages played a significant role in determining which banks failed and which determining which banks failed and which banks survived.banks survived.
SummarySummary
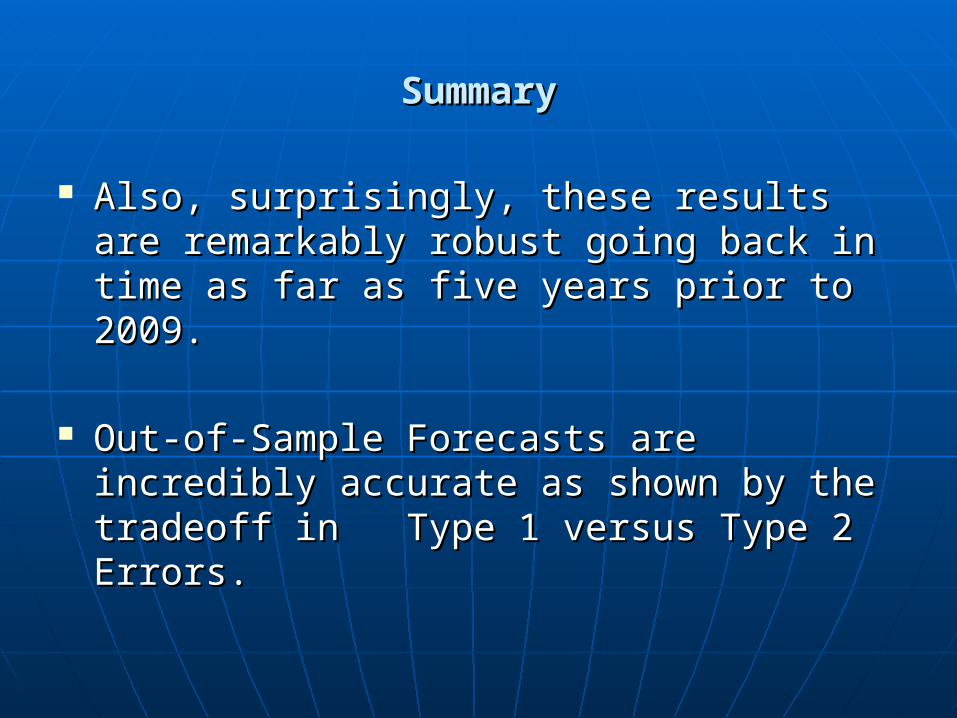
Also, surprisingly, these results are Also, surprisingly, these results are remarkably robust going back in time as remarkably robust going back in time as far as five years prior to 2009.far as five years prior to 2009.
Out-of-Sample Forecasts are incredibly Out-of-Sample Forecasts are incredibly accurate as shown by the tradeoff in Type accurate as shown by the tradeoff in Type 1 versus Type 2 Errors.1 versus Type 2 Errors.

IntroductionIntroduction
Why did the number of U.S. bank failures Why did the number of U.S. bank failures spike upwards in 2008 and 2009?spike upwards in 2008 and 2009?
During 2000 – 2007, only 31 U.S. During 2000 – 2007, only 31 U.S. commercial banks failed.commercial banks failed.
During 2008 and 2009, the number of During 2008 and 2009, the number of failures rose to 30 and 119, respectively.failures rose to 30 and 119, respectively.
Through Sep. 30, 107 commercial banks Through Sep. 30, 107 commercial banks have failed during 2010.have failed during 2010.

IntroductionIntroduction
The obvious (and incorrect) answer would The obvious (and incorrect) answer would be to attribute these failures to bad be to attribute these failures to bad investments in “toxic” subprime and other investments in “toxic” subprime and other residential mortgages, as well as the residential mortgages, as well as the securities backed by such mortgages.securities backed by such mortgages.
IntroductionIntroduction
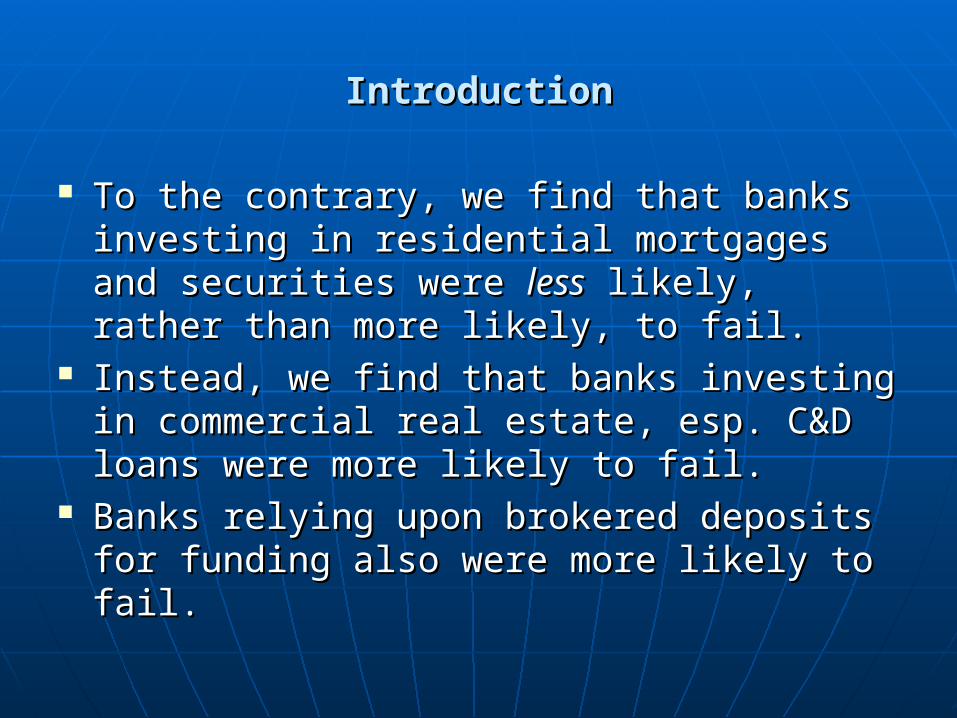
To the contrary, we find that banks To the contrary, we find that banks investing in residential mortgages and investing in residential mortgages and securities were securities were lessless likely, rather than likely, rather than more likely, to fail.more likely, to fail.
Instead, we find that banks investing in Instead, we find that banks investing in commercial real estate, esp. C&D loans commercial real estate, esp. C&D loans were more likely to fail.were more likely to fail.
Banks relying upon brokered deposits for Banks relying upon brokered deposits for funding also were more likely to fail.funding also were more likely to fail.
IntroductionIntroduction
Moreover, we find that these factors were Moreover, we find that these factors were apparent as far back as 2004—five years apparent as far back as 2004—five years before the failures we analyze.before the failures we analyze.

IntroductionIntroduction
Why is this important?Why is this important? Going back to Bagehot (1873) and Going back to Bagehot (1873) and
Schumpeter (1912), economists have Schumpeter (1912), economists have recognized the critical role of banks in recognized the critical role of banks in determining economic growth.determining economic growth.
More recently, King and Levine (1994) and More recently, King and Levine (1994) and Levine and Zervos (1998) have empirically Levine and Zervos (1998) have empirically linked financial intermediation to long-run linked financial intermediation to long-run growth in an economy.growth in an economy.

Literature on U.S. Bank FailuresLiterature on U.S. Bank Failures
Meyer and Pifer (JF 1970)Meyer and Pifer (JF 1970) Martin (JBF 1977)Martin (JBF 1977) Pettway and Sinkey (JF 1980)Pettway and Sinkey (JF 1980) Thomson (JFSR 1992)Thomson (JFSR 1992) Whalen (ER of FRB-Cleveland 1992)Whalen (ER of FRB-Cleveland 1992) Tam and Kiang (MS 1992)Tam and Kiang (MS 1992) Cole and Gunther (JBF 1995, JFSR 1998)Cole and Gunther (JBF 1995, JFSR 1998) Wheelock and Wilson (RESTAT 2005)Wheelock and Wilson (RESTAT 2005) Cole and Wu (mimeo 2010)Cole and Wu (mimeo 2010)

Literature on Recent U.S. Bank FailuresLiterature on Recent U.S. Bank Failures
Torma (SSRN 2010)Torma (SSRN 2010)
Cole and White (Stern NYU 2010)Cole and White (Stern NYU 2010)
. . . . Pretty sparse . . . .. . . . Pretty sparse . . . .

DataData
Failure data from FDIC’s websiteFailure data from FDIC’s website Quarterly Bank Call Report data from FRB-Quarterly Bank Call Report data from FRB-
Chicago’s website for 2004 - 2010Chicago’s website for 2004 - 2010• Going away at end of 2010!Going away at end of 2010!• Thank the greedy FFIEC for this loss of accessThank the greedy FFIEC for this loss of access• FFIEC provides vastly inferior productFFIEC provides vastly inferior product
Structure data also from FRB-Chicago’s Structure data also from FRB-Chicago’s website.website.• Not available from FFIECNot available from FFIEC• Thanks again FFIEC!Thanks again FFIEC!
MethodologyMethodology
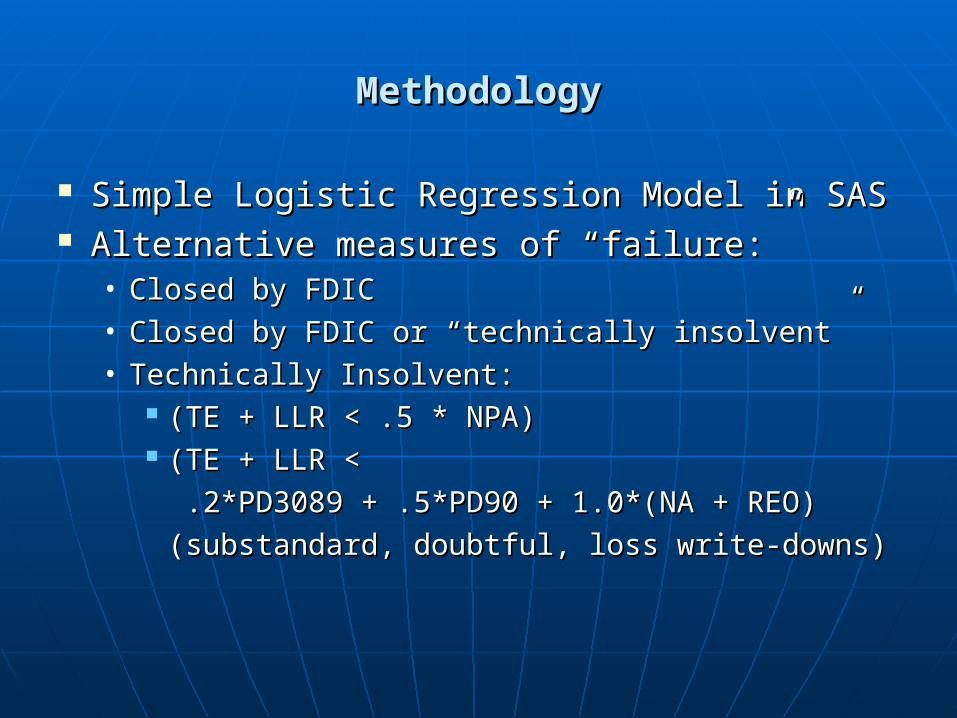
Simple Logistic Regression Model in SASSimple Logistic Regression Model in SAS Alternative measures of “failure:”Alternative measures of “failure:”
• Closed by FDICClosed by FDIC• Closed by FDIC or “technically insolvent”Closed by FDIC or “technically insolvent”• Technically Insolvent:Technically Insolvent:
(TE + LLR < .5 * NPA)(TE + LLR < .5 * NPA) (TE + LLR <(TE + LLR <
.2*PD3089 + .5*PD90 + 1.0*(NA + REO).2*PD3089 + .5*PD90 + 1.0*(NA + REO)
(substandard, doubtful, loss write-downs)(substandard, doubtful, loss write-downs)

MethodologyMethodology
117 Commercial Bank Closures117 Commercial Bank Closures
147 technical insolvencies147 technical insolvencies

ModelModel
Simple model specification that follows the Simple model specification that follows the existing literature:existing literature:• Proxies for CAMEL componentsProxies for CAMEL components• Loan portfolio allocationLoan portfolio allocation
Res RERes RE Comm RE: NFNR, MF and C&DComm RE: NFNR, MF and C&D C&IC&I ConsumerConsumer
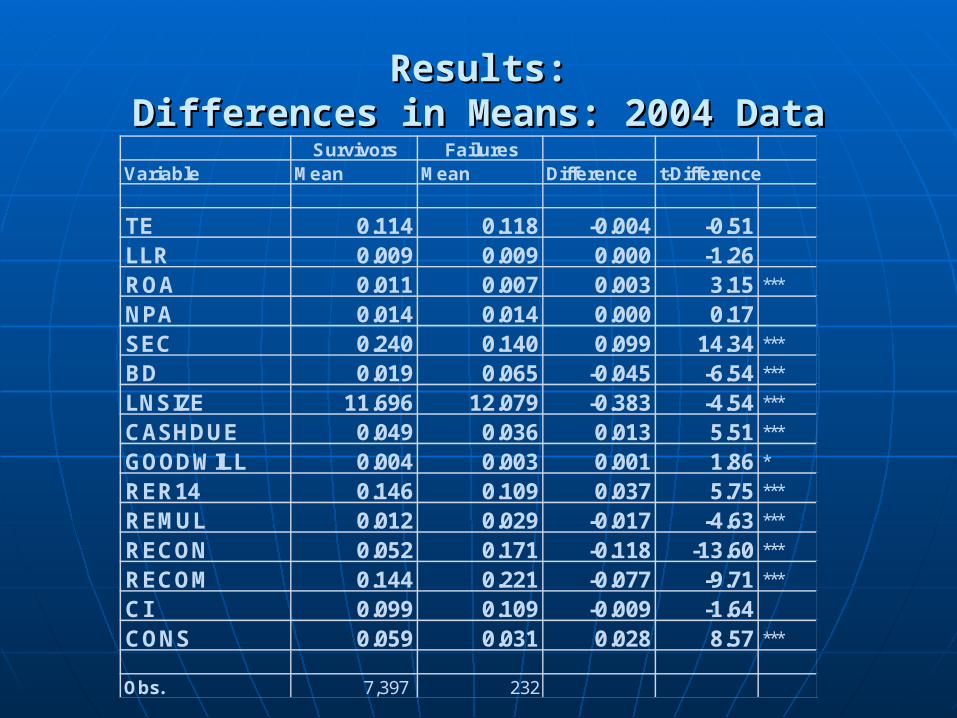
Results:Results:Differences in Means: 2004 DataDifferences in Means: 2004 Data
Variable Mean Mean Difference t-Difference
TE 0.114 0.118 -0.004 -0.51LLR 0.009 0.009 0.000 -1.26ROA 0.011 0.007 0.003 3.15 ***
NPA 0.014 0.014 0.000 0.17SEC 0.240 0.140 0.099 14.34 ***
BD 0.019 0.065 -0.045 -6.54 ***
LNSIZE 11.696 12.079 -0.383 -4.54 ***
CASHDUE 0.049 0.036 0.013 5.51 ***
GOODWILL 0.004 0.003 0.001 1.86 *
RER14 0.146 0.109 0.037 5.75 ***
REMUL 0.012 0.029 -0.017 -4.63 ***
RECON 0.052 0.171 -0.118 -13.60 ***
RECOM 0.144 0.221 -0.077 -9.71 ***
CI 0.099 0.109 -0.009 -1.64
CONS 0.059 0.031 0.028 8.57 ***
Obs. 7,397 232
Survivors Failures

Results: Results: Differences in Means of 2009Differences in Means of 2009
Survivors and FailuresSurvivors and FailuresVariable 2008 2007 2006 2005 2004
TE + +LLR - - - -ROA + + + + +NPA - - - SEC + + + + +BD - - - - -LNSIZE - - - - -CASHDUE + + + + +GOODWILL + + +RER14 + + + + +REMUL - - - - -RECON - - - - -RECOM - - - - -CI + CONS + + + + +

Results: Results: Logistic Regression: Logistic Regression:
2009 Failure = 1, 2009 Survivor = 02009 Failure = 1, 2009 Survivor = 0Variable 2008 2007 2006 2005 2004
TE - - +LLR - - -ROA - - - - -NPA + + + + +SEC - - -BD + + + +LNSIZE + +CASHDUE - - -GOODWILL + + - -RER14 -REMUL + + + +RECON + + + + +RECOM + + + +CI - CONS - - -

Out-of-Sample Forecasting AccuracyOut-of-Sample Forecasting Accuracy Type 1 vs. Type 2 Error Rates Type 1 vs. Type 2 Error Rates
How well does the model do in forecasting How well does the model do in forecasting future “out-of-sample” failures?future “out-of-sample” failures?
We examine trade-off of Type 1 vs. Type 2 We examine trade-off of Type 1 vs. Type 2 error rateserror rates
Type 1 Error: Failure misclassified as Type 1 Error: Failure misclassified as SurvivorSurvivor
Type 2 Error: Survivor misclassified as Type 2 Error: Survivor misclassified as FailureFailure
Out-of-Sample Forecasting AccuracyOut-of-Sample Forecasting Accuracy Type 1 vs. Type 2 Error Rates Type 1 vs. Type 2 Error Rates
For each Type 2 Error Rate, what For each Type 2 Error Rate, what percentage of Failures do we misclassify percentage of Failures do we misclassify (Type 1 Error Rate)?(Type 1 Error Rate)?
From a banking supervision perspective, From a banking supervision perspective, think of this as examining X% of all banks think of this as examining X% of all banks and identifying Y% of all banks that will fail and identifying Y% of all banks that will fail within next 9 months.within next 9 months.
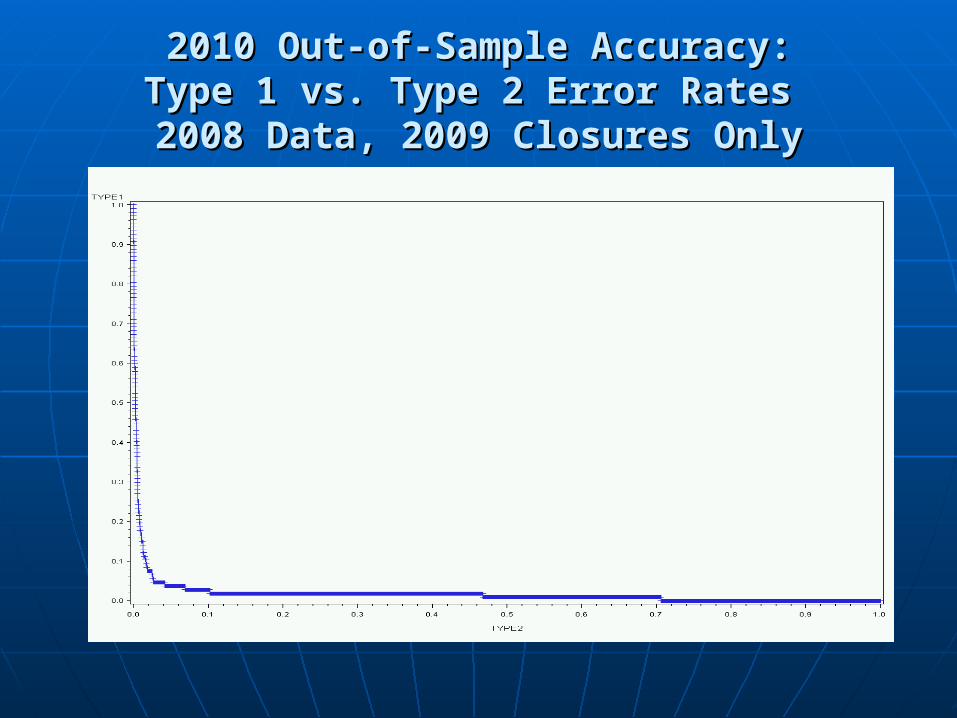
2010 Out-of-Sample Accuracy:2010 Out-of-Sample Accuracy:Type 1 vs. Type 2 Error Rates Type 1 vs. Type 2 Error Rates 2008 Data, 2009 Closures Only2008 Data, 2009 Closures Only

2010 Out-of-Sample Accuracy:2010 Out-of-Sample Accuracy:Type 1 vs. Type 2 Error Rates Type 1 vs. Type 2 Error Rates 2008 Data, 2009 Closures Only2008 Data, 2009 Closures Only
Type 2 Error RateType 2 Error Rate Type 1 Error RateType 1 Error Rate
10%10% 2.8% 2.8%
680 of 6,793680 of 6,793 104 of 107104 of 107
5%5% 3.7% 3.7%
340 of 6,793340 of 6,793 103 of 107103 of 107
1%1% 17.8% 17.8%
68 of 6,79368 of 6,793 88 of 107 88 of 107

2010 Out-of-Sample Accuracy:2010 Out-of-Sample Accuracy:Type 1 vs. Type 2 Error Rates Type 1 vs. Type 2 Error Rates
2008 Data, 2009 Closures and Insolvencies2008 Data, 2009 Closures and Insolvencies

Robustness ChecksRobustness Checks
Exclude technical failuresExclude technical failures Exclude actual failuresExclude actual failures Exclude 40 largest banksExclude 40 largest banks Divide sample into small banks and large Divide sample into small banks and large
banks at $300 M in assetsbanks at $300 M in assets

Robustness ChecksRobustness Checks
Add State dummies: AZ, CA, FL, GA, IL, NVAdd State dummies: AZ, CA, FL, GA, IL, NV FHLB Advances (thanks to Scott Frame)FHLB Advances (thanks to Scott Frame) Mortgage and Govt. Agency SecuritiesMortgage and Govt. Agency Securities Asset GrowthAsset Growth Anything else I could think of on the bank Anything else I could think of on the bank
balance sheet.balance sheet.
Nothing else seems to matter.Nothing else seems to matter.
ConclusionsConclusions
In this study, we analyzed the In this study, we analyzed the determinants of bank failures occurring determinants of bank failures occurring during calendar year 2009 (and first nine during calendar year 2009 (and first nine months of 2010).months of 2010).
We find that traditional proxies for the We find that traditional proxies for the CAMELS components, do an excellent job CAMELS components, do an excellent job in explaining the failures of banks that in explaining the failures of banks that were closed during 2009, just as they did were closed during 2009, just as they did in the previous banking crisis of 1985 – in the previous banking crisis of 1985 – 1992. 1992.

ConclusionsConclusions
We also find that Construction & We also find that Construction & Development lending and reliance upon Development lending and reliance upon Brokered Deposits for funding are Brokered Deposits for funding are associated with higher failure rates.associated with higher failure rates.
Surprisingly, we do not find that residential Surprisingly, we do not find that residential mortgages or RMBS played a significant mortgages or RMBS played a significant role in determining which banks failed and role in determining which banks failed and which banks survived.which banks survived.

ConclusionsConclusions
Finally, we find that this model is Finally, we find that this model is extremely accurate in out-of-sample extremely accurate in out-of-sample forecasting tests, at least for 2010 forecasting tests, at least for 2010 closures.closures.

Plus ça change, plus c'est la même Plus ça change, plus c'est la même chose… chose…