Deindustrialisation and the fear of r elocations in the ... and the fear of r elocations in ......
33
1 Deindustrialisation and the fear of relocations in the industry Hervé Boulhol * - Lionel Fontagné # This version: 13 July 2005 Abstract The steady decline in the share of industry in total employment currently seems to be accelerated by competition from low wage countries, which depresses international prices for manufactured products and is being translated into offshore outsourcing and defensive innovation. In order to fully address these issues, we define offshore outsourcing in a broader sense, the one which is generally adopted in the public debate, namely trade in goods with countries where offshoring takes place. We replicate and extend the estimations realised by Rowthorn and Ramaswami (1998) and ask what has been the responsibility of outsourcing in the observed deindustrialisation in sixteen OECD countries. Our estimation strategy, relying on a dynamic panel methodology, leads to the conclusion that net trade with low wage countries is associated with a non-negligible average decrease of around 2 points in the manufacturing employment share between 1970 and 2002. However, this contribution, which substantially varies across countries, represents only a fifth of the deindustrialisation over the period. We did not find any increased impact of imports from developing countries in the second half of the period (1986-2002), other than that due to increased trade. Key words: deindustrialisation, trade, outsourcing JEL Classification 01, 03, F16, F43 * IXIS-CIB and Université de Paris I, [email protected] # CEPII and Université de Paris I, [email protected]
Transcript of Deindustrialisation and the fear of r elocations in the ... and the fear of r elocations in ......

1
Deindustrialisation and the fear of relocations in the industry
Hervé Boulhol∗ - Lionel Fontagné#
This version: 13 July 2005 Abstract The steady decline in the share of industry in total employment currently seems to be accelerated by
competition from low wage countries, which depresses international prices for manufactured products
and is being translated into offshore outsourcing and defensive innovation. In order to fully address these
issues, we define offshore outsourcing in a broader sense, the one which is generally adopted in the public
debate, namely trade in goods with countries where offshoring takes place. We replicate and extend the
estimations realised by Rowthorn and Ramaswami (1998) and ask what has been the responsibility of
outsourcing in the observed deindustrialisation in sixteen OECD countries. Our estimation strategy,
relying on a dynamic panel methodology, leads to the conclusion that net trade with low wage countries is
associated with a non-negligible average decrease of around 2 points in the manufacturing employment
share between 1970 and 2002. However, this contribution, which substantially varies across countries,
represents only a fifth of the deindustrialisation over the period. We did not find any increased impact of
imports from developing countries in the second half of the period (1986-2002), other than that due to
increased trade.
Key words: deindustrialisation, trade, outsourcing JEL Classification 01, 03, F16, F43
∗ IXIS-CIB and Université de Paris I, [email protected] # CEPII and Université de Paris I, [email protected]
2
1. INTRODUCTION
International competition exhibits new patterns, characterised by the emergence of big new players and
the acknowledged international relocation of industrial production in low-wage countries. How such
patterns impact industrial employment in industrialised countries is a key issue for policy makers.
Offshoring and outsourcing fill the columns of the newspapers, and the disconnection between the
prudent diagnosis of the economic profession and the perception of the civil society is growing.
The steady decline in the share of industry in total employment currently seems to be accelerated by the
very forces of globalisation, which translates into a series of factories being dismantled, and at best for
European countries being relocated to new low wage eldorados, namely the new Member States.
Consequently, the civil society, as well as numerous commentators and politicians, are associating the
phenomenon of offshore outsourcing, and more generally competition with the South, with the observed
deindustrialisation, defined as the decline in the share of manufacturing in total employment. Such fears
regularly feed the political debate (e.g. Arthuis report, 1993), especially when a downturn in economic
activity matches the calendar of a political event: one may for instance recall that Ross Perot had predicted
a "giant sucking sound" caused by the loss of 5 million US jobs to Mexico if Congress ratified the
Agreement on the North American Free Trade Area (NAFTA).
The recent controversy between Samuelon (2004) and Bhagwati et al. (2004), should not hide that the
perception of these evolutions by a large majority of economists is less alarming than the one of the civil
society (e.g. Marin, 2004). Deindustrialisation is primarily a natural outcome associated with the
development of modern societies, and resulting from demand, supply and relative price effects. Therefore,
competition from the South (via specialisation or offshore outsourcing) is responsible for only a limited
part of the above phenomenon. However, if specialisation and trade are the source of positive gains,
adjustment costs can indeed be large and painful in certain regions or within certain parts of the
population. Thus, the more rigid the economy, the slower the adjustments, the more pronounced the
“local pains”. All in all, whereas the public opinion perceives deindustrialisation, outsourcing, offshoring
and the competition of emerging countries as the same frightening phenomenon, most professional
economists consider deindustrialisation as mostly a “domestic issue” rather disconnected from
international competition.

3
However, since relative prices are at stake, one can hardly neglect another strand of argument. First, the
new competitors, combining low labour costs with large productivity levels, thanks to the presence of
foreign multinationals, definitely depress international prices for manufactured products. Second, technical
progress is not exogenous: Its application in factories is mainly driven by competitive pressure. Defensive
innovation (Thoenig & Verdier, 2002) might thus reinforce the natural evolution of productivity in the
industrial sector.
As a result, even if offshore outsourcing plays a limited role in lay-offs, and deindustrialisation is mainly
driven by internal forces, and the net factor content of our trade with the South remains limited, there
could still be arguments highlighting the impact of competition from the South on the relative decline in
the share of industry in total employment in the North. By better addressing this issue, which matches the
concerns of the civil society, we hope to contribute to the clarification of the debate.
We will define offshore outsourcing in a broader sense, the one which is generally adopted in the public debate, namely trade in
goods with countries where offshoring takes place. In the following, we replicate and extend the estimations
realised by Rowthorn and Ramaswami in their seminal 1998 paper (RR, hereafter) and ask what is the
responsibility of outsourcing in the observed deindustrialisation? First, RR 1963-1994 period is extended up to 2002
and second, our estimation strategy relies on a dynamic panel specification using GMM methodology.1
We will here limit our investigation to manufacturing, but one should keep in mind that offshoring of
services is the other side of the coin: Amiti & Wei (2004), van Welsum (2004) and GAO (2004) are
seminal contributions as far as services are concerned. However, the kind of data and methodology to be
used differs largely.
The rest of this paper is organised as follows. Section 2 gives an overview of the debate, Section 3
proposes a simple theoretical framework for estimation purposes, Section 4 provides descriptive statistics
for a panel of industrialised countries, Section 5 discusses the results and Section 6 concludes.
2. OVERVIEW OF THE DEBATE
The very rapid development of the international division of labour, as fostered by the emergence of
competitors with a very broad spectrum of comparative advantages in industrial activities (e.g. China), and
sometimes in services too (e.g. India), has revived a leitmotiv in public debate in Europe, Japan and the

4
United States: the “hoovering-up” of jobs by competition from low-wage economies as well as the future
of the manufacturing industry.
In the United States, the “Manufacturing in America” report, commissioned by President Bush from the
US Department of Commerce, reflects the concerns above.2 For the US Secretary of Commerce,
“America’s manufacturers provide our nation and our people with good jobs, a better quality of life, and inventions that have
established our national identity. Manufacturing is the backbone of our economy and the muscle behind our national
security”. Such a statement echoes President Clinton’s views, who set the objective of restoring
manufacturing’s share of US employment from 17% to 20%. There is no need to quote European officials
on the subject, as similar statements could easily be found.
International competition is playing a role
Industry continues to play a key role in advanced economies: when the statistics are adjusted to take
account of the development of temporary work, the outsourcing of certain services by manufacturers
(cleaning, accounting, catering, etc.) and the increasingly blurred boundaries between services and
manufacturing in many sectors, the manufacturing industry is in fact more or less maintaining its volume
share of GDP. Many service activities owe their very existence to the presence of the manufacturing
industry.
However, opening up the economy can contribute to the decline in – though not the disappearance of –
the manufacturing industry as a result of the combination of four phenomena.
First, the advantage of the old industrialised economies is currently shifting from the factory to the office,
distribution network or trading desk. This means a growing specialisation in services and a commensurate
decline in manufacturing in the face of rising competition from imports originating in the newly
industrialised countries. The result would be a Nike-style industry, designing, importing and distributing
the goods that it no longer manufactures.
Second, the downward pressure exerted by new competitors with very low labour costs and lax
environmental rules may have a selection effect on firms, products and technologies in the North. Only
the most productive firms will survive; only upmarket products with no competition from low-cost
imports will hold their own; only the most productive, least labour-intensive technologies will be chosen.

5
Third, firms reorganise themselves on a global level to take advantage of international cost differentials,
specialising their overseas subsidiaries in different segments of the production process. The associated
fragmentation of the production processes characterised by a growing recourse to imported parts and
components from low-wage countries (Fontagné et al., 1996; Hummels et al., 2001): imports would be a
complement of, rather than a substitute to, domestic inputs (Aw & Roberts, 1985). This changing nature
of trade, which exploits the modularity of products in order to benefit from the differences in costs
between the various possible locations, had been on the cards for a long time (Sanyal, 1983; Sanyal &
Jones, 1982; Dixit & Grossman, 1982). But it is the sharp fall in transaction costs (in particular
plummeting communication costs) and the large-scale opening-up of the South’s economies that has
unleashed all this potential.
Last, the new markets are in the South and factories are located near the markets. Thus, the shift in
international demand to new areas, given the relative sluggishness of the EU economy, inevitably leads
European manufacturers to locate their new capacities in the neighbourhood of these dynamic new
markets.
Is there anything new about these phenomena? The answer is yes: though the emergence of new
competitors is nothing new, the combination of substantial cuts in transaction costs with the opening-up
of large economies, possessing an abundance of cheap labour that multinational corporations can tap
using advanced technologies, smashes a hole in the logic behind the division of labour between North and
South.
Arguments downplaying those fears
Economic analysis recalls that deindustrialisation is above all an internal development in the advanced
economies. Second, the direct impact of international competition with the South on the employment
level in the North is limited, notwithstanding potentially visible distributive impacts between categories of
workers.
The grounds of the former argument are as follows. The structure of household demand is impacted by
increasing purchasing power. During a lengthy industrialisation phase, the spread of industrial goods in
the society combines with the industrialisation of certain tasks (noticeably regarding housekeeping) and,
possibly, a taste for material goods: the income elasticity of demand for industrial goods is high. As needs

6
are saturated and personal wealth increases, society dematerialises, consumption shifts to services and the
sale of material goods includes a growing service content. The income elasticity of demand for industrial
goods diminishes. This demand effect combines with a supply effect. Indeed, technological developments
bring faster productivity gains in manufacturing than in services. This is because, roughly speaking, the
production process in industry can more easily automate tasks, whereas some services must take into
account personal characteristics and manage more complex information. The resulting change in relative
prices increases the consumption of material goods through a substitution effect. Up to a certain level of
income, the above two effects combine to increase volume demand for manufactured goods and so the
volume of manufacturing output; above that level, the substitution effect sustains stagnant or falling
demand for industrial products. Manufacturing industry holds its own in terms of volume, but its share in
the production of value – and therefore of jobs – diminishes. The decline of manufacturing industry’s
share of total employment is therefore inexorable.
Regarding the second strand of the argument, the issue of the hoovering-up of jobs by trade was
definitively covered by Lawrence & Slaughter (1993). Basically, the developing countries’ share of the
leading industrialised countries’ trade remains too small for imports from those countries to be the main
determining factor in labour-market trends in the North. Hine & Wright (1998), for example, found a
limited impact of imports on UK employment, around 6% of job losses in the manufacturing sector over
the period 1981-91. Sachs and Shatz (1994) estimated that developing country trade is associated with a
decline of 5.7% in manufacturing employment in the USA between 1978 and 1990, period during which
the share of manufacturing in employment has decreased by 27%. Although there has been an appreciable
divergence in pay or employment between skill groups in the old industrialised countries, technical
progress (which is biased against unskilled labour) is the likeliest suspect. However, technological progress
itself is not of an exogenous nature: it is, on the contrary, impacted by the competitive pressure.
How best to trace the phenomenon ?
Offshore outsourcing is a major issue for which we lack a definition precisely setting the boundaries of the
empirical studies. The “closing-down-followed-by-relocation-abroad-in-order-to-import” criterion, often
associated with the French notion of “délocalisation”, is by definition too narrow and hardly corresponds
to any statistical category or any sizeable phenomenon. The bulk of the phenomenon is of a different
nature, which is why a different kind of criterion is generally used, based on the matrix of alternatives

7
contemplated by the firm. The first alternative is “within the firm versus outside the firm” (the traditional
“make or buy” dilemma), and it puts emphasis on outsourcing – be it domestic or not. The second
alternative is to produce (or buy) domestically versus resorting to production abroad. Accordingly,
offshoring of activities to foreign affiliates, or offshore outsourcing, are the two faces of a same coin: the
location of a fraction of the value added chain abroad (in a low wage economy).
In order to trace the impact of such fragmentation on the domestic economy, the best strategy would be
to compile individual firm data. The problem is that such data is simply not available on a comparative
basis for OECD countries as a whole: we therefore face the risk of drawing conclusions on the basis of
limited evidence. An alternative is to rely on Input-Output coefficients (eventually combined with trade
data) in order to trace intermediate imports and their evolution over time (Feenstra and Hanson 1996 &
1999, Anderton & Brenton, 1999, Strauss-Kahn 2003, Hijzen et al. 2003). Once again, we are constrained
by the availability of the data and by the different nomenclatures of activity.
There is of course yet another possibility, which is to rely on trade data only. The drawback of such an
approach is of course that, besides the imports of intermediates associated with offshore outsourcing,
besides the imports of final products assembled in foreign subsidiaries or by subcontractors, we also
record the exports of low wage countries which simply result from their specialisation. China is exporting
tee shirts because Nike is subcontracting there, but also because China is exporting the kind of products it
is advantaged in, namely labour intensive products such as tee shirts. However, given the shape of the
debate in our countries, we will tentatively embrace such an approach. After all, the civil society is talking
about offshoring, outsourcing, “délocalisations” quite indifferently and is interpreting arm’s length exports
of Chinese clothing manufacturers as a part of this broad phenomenon. The same for deindustrialisation,
as stressed by Krugman: « Let me call (…) the view that the loss of high-wage manufacturing jobs due to
foreign trade (as opposed to purely domestic shifts in demand or technology) has been a major cause of
stagnating or declining incomes among American workers, the deindustrialization hypothesis ».3 All in all,
if such empirical strategy points to a limited impact of imports from the South in the deindustrialisation
process, we will not be accused of downsizing the phenomenon: what we will be considering is an upper
limit of the phenomenon at stake.
Actually, such avenue of research was initially explored by the IMF. Using data for 18 industrialised
countries over the period 1963-1994, RR estimated that a one percentage point increase in imports from

8
low wage economies translated into an 8.5% increase in the relative productivity of manufacturing in
importing countries. This effect on productivity being controlled, the depressive impact on prices of
import from low wage countries is no longer significant. Beside, regressing the relative employment in
manufacturing (which is an inverse measure of deindustrialisation) on income per capita, openness and
investment, they found that the contribution of trade with low wage economies is 20% at most. In total,
over the 1970-1994 period, net imports from low wage economies would have (indirectly through their
impact on productivity in the North) displaced 1.6% of the industrial jobs in the North. Accordingly, the
increasing competition from the South would have displaced no more jobs throughout the OECD in 25
years than the US economy creates within three months.
This seminal work, besides some econometric issues left pending, has a major drawback: it does not take
into account the recent period, characterised by an acceleration of the participation of emerging
economies in world trade. Hence the need to update this kind of study regularly in order to check out
whether such an order of magnitude continues to make sense.
3. A SIMPLE MODEL WITH TWO SECTORS
Relative prices and productivity
There are two sectors in the economy, industry I and services S. The production functions are:
jjj LAY .= with j =I, S.
For each sector, L stands for employment, Y production, A total factor productivity (TFP). TFP is
supposed to be growing at an exogenous rate Ig in industry and Sg in services, with SI gg > . Relative
labour productivity and price are denoted RELPROD and RELPRICE respectively:
tggSISSII
SIeAAALYLYRELPROD ).(0 ./)//()/( −==≡ (1)
SI ppRELPRICE /≡
The first-order conditions imply:
)()( RELPRODLogcteRELPRICELog −= (2)
9
The rise in the relative productivity of industry is totally passed on the relative price. Taking into account
capital and extending production functions to the case of constant elasticity of substitution, σ , would lead
to:
)/()./11.()()( rwLogRELPRODLogcteRELPRICELog σα −+−=
where α is a constant, positive if the industrial sector is relatively intensive in capital, negative otherwise,
and where w/r is the relative factor cost. When taking into account the upward trend in relative wages,
relative prices falls slightly less than relative productivity increases if the elasticity of substitution between
capital and labour is lower than 1.
Employment, value added at constant and current prices
On the demand side, utility is supposed to be CES of elasticity η between industrial goods and services.
Therefore, relative demand will verify:
)/(.)/( SISI ppLogcteXXLog η−= (3)
This simple model leads to the following results. First, combining (1), (2) and (3), relative employment is
given by:
tggcteLLLog SISI ).).(1()/( −−−= η
from which the trends in the relative share of industrial employment are deduced:
tgg
IS
ISIeLLtL
tL).1).(().0(/)0(1
1)(
)(η−−+
= (4)
where L stands for the total labour force. The elasticity of substitution η plays a key role in the
deindustrialisation. With η lower than unity, as the estimates confirm, the substitution between industrial
goods and services will not be large enough to compensate the decrease in the relative price resulting from
higher productivity gains in the industry. Consequently, the share of industry in the labour force decreases
towards zero because of productivity gains (in practice, because of the heterogeneity of industrial sectors,
productivity in industry slows until it is balanced with productivity in services, and industrial employment
eventually stabilises). The pace of deindustrialisation is slowed if the elasticity of substitution between
goods and services is strong: with the fall in prices, demand for manufactured goods (in volume terms)

10
increases all the more so as η is high and industrial employment declines at the pace )1).(( η−− SI gg .
With an elasticity of substitution of around 0.5, a 1.5% per year increase in relative productivity entails a
0.75% per year decline in relative employment.
Second, equations (2) and (3) imply:
η−=== 1)/(..//
...
SIS
I
SS
II
SS
II ppcteLL
cteAXAX
cteXpXp (5)
Relative industrial employment moves in lockstep with relative industrial value-added (in value terms), and
this corresponds to the stylised facts, as documented in Section 4.
Third, the economy growth’s rate converges in the long term towards growth in the least buoyant sector,
in other words services, i.e. Sg . Growth decelerates but from a high level of wealth: there is no other
possible growth path. 4
Turning point
The main flaw of the model consists in the forecasts about relative value-added in volume terms. For,
according to equation (3), the fall in industry prices should lead to a continuous rise in relative industry
output, and this does not seem to be borne out by the data, highlighting further a distortion in demand
related to development (see Section 4). To introduce this wealth effect and building on RR, Engel’s law
could be extended to industrial goods. According to Engel’s law, the relative consumption (in volume
terms) of agricultural products decreases from a certain level of development. In other words, at constant
relative price, the relative demand of industrial goods follow a hump shape based on the level of
development. To take this effect into account, real GDP per capita at PPP, YCAP, is introduced in the
relative demand equation:
)(.)(.)/(.)/( 2 YCAPLogbYCAPLogappLogcteXXLog SISI ++−= η (6a)
)(.)(.)/().1()/( 2 YCAPLogbYCAPLogappLogcteXpXpLog SISSII ++−+= η (6b)
We expect to find that the relative value-added of industry at constant prices increases until a certain level
of per capita income, which we call following RR the “turning point”, before diminishing subsequently
( 0,0 <> ba ). Figures 1 and 2 illustrate the combined effects of decreasing relative price and economic
development for value-added at constant and current prices respectively, according to (6a-b).

11
At constant prices: before the turning point is reached, the share of industry in volume terms increases via
the combination of the price effect (substitution) and the income effect. After the turning point, both
effects oppose one another and the resultant is indeterminate.
At current prices and for employment: before the turning point, the demand effect opposes the loss of
industrial employment linked to productivity gains, but it loses intensity over time. From the turning point
onwards, the two effects operate in the same direction and deindustrialisation accelerates.
<<Figures 1 and 2 about here >>
4. DATA AND DESCRIPTIVE STATISTICS
The data is mainly taken from the OECD STAN Database. “Industry” is restricted to manufacturing
industries (ISIC 15 to 37), and “Services” is its complement in the economy. The trends we study would
have been very similar, were the scope broadened to include the whole industry (with construction). The
fixed capital formation series is real private fixed investment excluding stockbuilding from the OECD
Economic Outlook. Trade variables are from the CHELEM-CEPII database. “Developed Countries” or
“North” is composed of OECD countries except the CEECs, Turkey, South Korea and Mexico, whereas
“Developing Countries” or “South” is the complement in total imports. Finally, real GDP per capita at
purchasing power parity is in 1997 US dollar (source IMF).
We are interested here in the change in the share of manufacturing in employment between1970-2002 for
the following countries: Austria, Belgium, Canada, Denmark, Spain, United States, Finland, France, United
Kingdom, Italy, Japan, South Korea, Netherlands, Norway, Portugal and Sweden. German data are not
available for the whole period and thus this country is excluded from the sample.
The declining share of industry in total employment
Let us first look at the declining share of industry in employment in Europe (Figure 3). This decline is
widely observed, with three exceptions: Spain, Finland and Sweden. In the latter countries, the decline was
stopped by the early ‘90s. All in all, manufacturing is occupying between 15% and 20% of the working
force in the member states, to be compared with 30% on average in the early ‘60s.
A similar outcome has been observed in other developed economies (Figure 4). This is the case in Japan,
in the United States, and in Korea since the early ‘90s. In Canada, the decline was stopped in the early

12
‘90s. Accordingly, the view that deindustrialisation is a “natural” outcome in developed economies is at
least partially confirmed: the phenomenon is recorded in various regions, for small as well as large
countries, having reached the peak of their relative industrial employment at different periods, because of
their different level of development. More interestingly, if one tries to date the phenomenon, we have very
often to go back to the early ‘70s, or even to the ‘60s concerning the UK. In fact, six countries only
(Finland, Italy, Japan, Korea, Portugal and Spain) have seen their manufacturing employment share peak
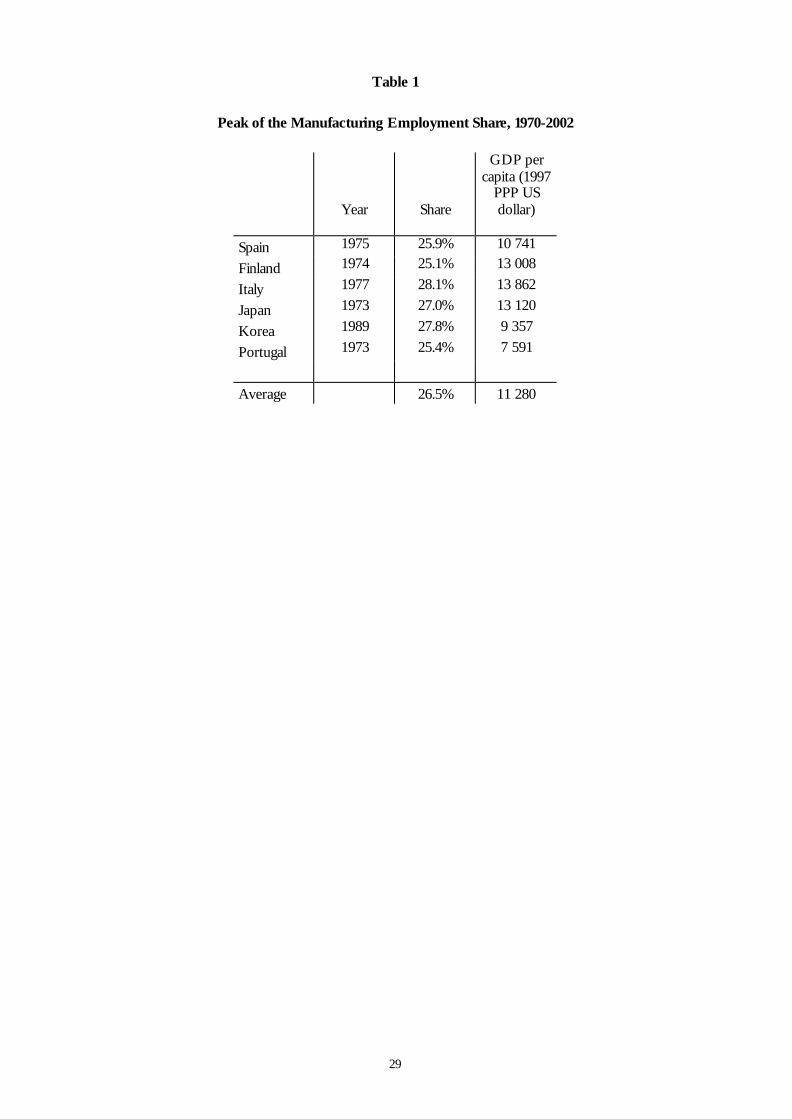
between 1970 and 2002. Table 1 indicates that this peak was reached in a fairly narrow range of real GDP
per capita ($10,000-$14,000) except for Portugal, where it occurred at an earlier stage of development.
Hence, the very forces of globalisation should not be interpreted, prima facie, as the engine of
deindustrialisation of our economies. On the contrary, we observe that certain countries have stabilised
the share of industry in total employment in the recent period characterised by the acceleration of
globalisation.
<<Table 1 about here>>
The role of relative prices
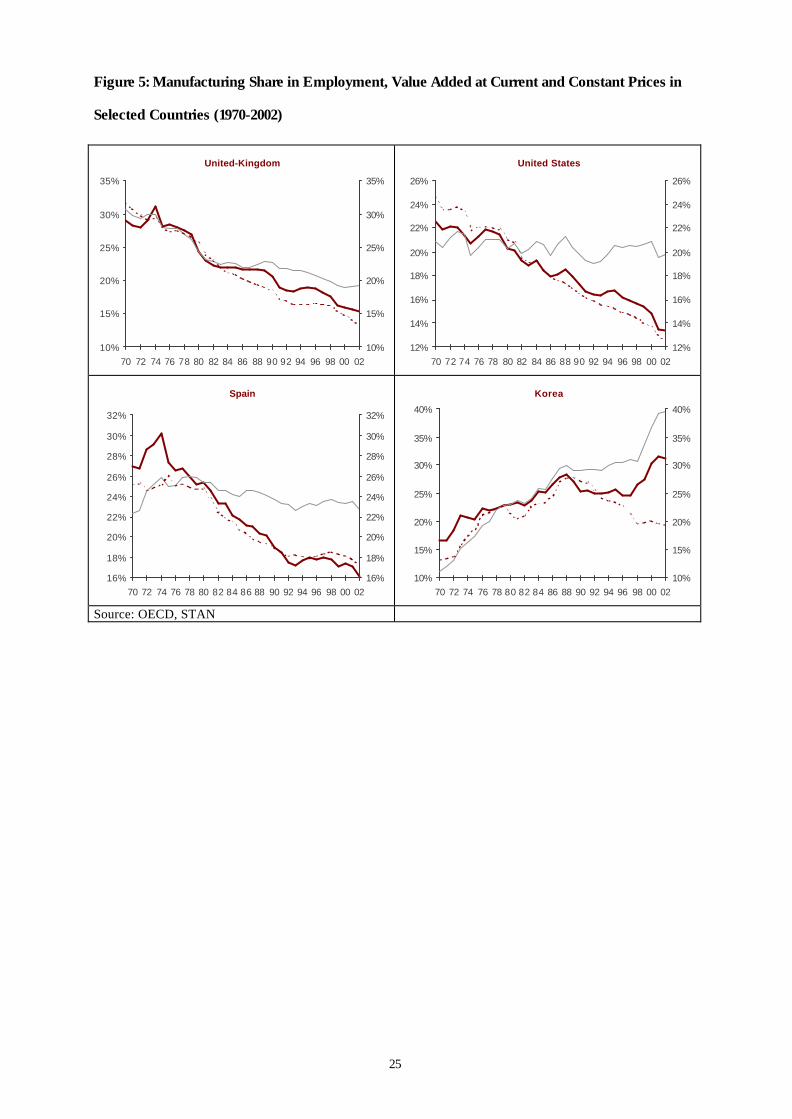
Since changes in relative prices are part of the explanation of the phenomenon at stake, we have to sort
this out in order to observe the value added of industry at constant prices. This is done in Figure 3 for
selected economies. The dotted line is the manufacturing share in total employment, the bold line the
share of manufacturing in total value added (in GDP) and the grey line the latter share at constant 1980
prices. We observe that employment is tightly link to the value added at current prices, while the value
added share at constant prices is rather stable. This confirms the mechanisms referred to above: larger
productivity gains in the industry translate into a reduction in its share in total employment. But
interestingly, when productivity gains are large, in the presence of increasing demand for manufactures,
the share of industry in total output can increase (even at current prices), despite the decline of its share in
total employment. Such outcome has been observed in Korea since the early 90s.
<<Figures 3, 4 and 5 about here >>
We plot in Figure 6 the manufacturing share in total employment for two periods: 1970-1986 and 1986-
2002. With the exception of Korea in the first period (where this country was in the process of rapid
convergence) and a negligible increase in Italy in the second period, the magnitude of the effect is a 4

13
percentage point change over each period on average (more precisely -4.4% of total employment in the
first period and -3.9% in the second period). In percentage, the employment share lost on average 30%
over the whole period, evenly spread over the two sub-periods when Korea is excluded. In total, one can
hardly infer that deindustrialisation has accelerated recently.
<<Figure 6 about here>>
On average, relative labour productivity of industry with respect to services increased at a pace of 1.6%
annually, ranging from -0.9% for Norway to 3.1% for Belgium. These productivity gains triggered an
average decrease in the relative price of 1.25% on average, ranging from +0.7% for Norway (the only
country with an increase in the relative price), to -2.3% for Korea and Japan. Figure 7 illustrates the linear
correlation of 76% between the two series (significant at 1%).
Lastly, we have to take into account the potential impact of the competition from the South on those
evolutions. The kind of mechanism referred to above is portrayed in Figure 8. Since the first oil shock, as
shown in the left hand panel, France has been facing a combination of declining relative production and
employment largely explained by the strong decline in relative prices: hence the suspect is definitively
productivity gains. However, the right hand panel in which imports from emerging economies are plotted
points to at least a coincidence of movements of relative prices and those imports. Accordingly, the
decline in relative prices through the induced productivity gains might be at least partially explained by the
competition from the South. Such evidence would fit the hypothesis of defensive innovation referred to
above. The cross-country linear correlation coefficient between relative (industry vs services) productivity
gains and the increase in manufacturing import ratios from developing countries between 1970 and 2002
is positive (56%) and significant at 3% level. In order to sort out these effects, an econometric exercise
will authorise to go beyond partial and bivariate evidence.
<<Figure 8 about here >>

14
5. ECONOMETRIC SPECIFICATION AND RESULTS
Econometric specification
The different mechanisms referred to in Section 3 can now be taken into account. Based on equation (6a),
the determinants of the relative (industry vs services) output in volume, RELOUTPUT, should include the
development level YCAP (income per capita) and the relative price, RELPRICE. Also, insofar as capital
investment increases the relative demand for manufactured products, fixed capital formation as a
percentage of real GDP, FIXCAP, should also be included. Finally, trade variables appear on the RHS.
RELOUTPUT = h (YCAP, YCAP2, RELPRICE, TRADE, FIXCAP)
In addition, trade has an indirect impact, channelling through the relative price. The latter is supposed to
depend also on exogenous relative TFP growth. To capture the total effect of trade, as relative
employment is the difference between relative output and relative labour productivity (all these variables
expressed in logarithm), the manufacturing share in total employment, EMPSHARE, is, in the reduced-
form equation, of the following type:
EMPSHARE = f (YCAP, YCAP², TRADE, FIXCAP, exogenous TFP)
As for the impact of international trade in manufactured products, the effect of imports from developing
countries should be taken into account separately. Indeed and following Wood (1994), the labour content
of trade, expressed as a percentage of GDP, is most likely larger if this given percentage comes from a
developing country rather than a developed one. This comes from differences in both capital/labour
intensity and labour costs. IMPSOUTH is defined as the imports from developing countries and
BALANCE is the trade balance, both expressed as a share of GDP.
Results
Let us start with the relative output share (at constant prices). All estimates in Table 2 include country
fixed effects and are in line with those of RR. In the first column, real income and relative price only are
taken into account. At constant relative price, manufacturing share in real output starts by increasing and
reaches a turning point at around $ 10,000 for the GDP per capita, which corresponds to the level of
development reached by the most developed countries in the early ‘60s. Moreover, RR got an elasticity of
–0.59 to the relative price, similar to our –0.62. To the extent that this relative price is exogenous, this

15
60% parameter could be interpreted as the elasticity of substitution between manufactured products and
services in the demand function, at constant income. Therefore, the OLS estimates are consistent with a
fairly slow (relatively high elasticity of substitution) deindustrialisation, being somehow accelerated by a
wealth effect materialising some forty years ago for the most developed countries. However, ignoring
supply effects means that this elasticity is biased downwards.
In the second column, we introduce imports from developing economies, overall trade balance and the
ratio of capital formation over GDP. The “elasticity of substitution” is then estimated lower at -0.49. The
investment variable is significant and has the expected positive sign. In addition, the trade variables have
some explanatory power and an increase in the trade balance of 1 point of GDP (which is roughly 5
points of manufacturing value-added) is associated with an increase of 1.8% in the relative real value-
added. Note that this applies for all trade, except imports from the South which do not appear to have any
impact overall.
<< Table 2 about here >>
Importantly, in addition to endogeneity issues, OLS residuals are poised with auto-correlation and since
the series is very likely persistent, a dynamic specification must be preferred. Therefore, estimates based
on the GMM methodology for dynamic panels developed by Arellano and Bond (1991) are presented
next, for the main focus of this study, the manufacturing employment share (defined as manufacturing
over total employment).
In order to control for exogenous TFP, the reduced-form specification must include time-dummies.
Results are presented in Table 3. The first column reports the OLS estimates in the static specification
case, for the sake of comparison. Column 2 and 3 refer to the GMM estimates, using the second to fourth
lags of the dependent and trade variables as instruments, for the partial adjustment model and a more
complete dynamic specification, respectively. The serial correlation and overidentification tests reject
neither the specification nor the validity of the instruments. However, the significance of the lagged
variable parameters and second-order serial correlation clearly support the more complete specification in
column 3, our benchmark estimates. Moreover, column 4 presents the estimates using the third to fifth lag
of the trade variables as instruments.
<< Table 3 about here >>

16
To get a more readable picture of the results, Table 4 gives the long-term sensitivities of the employment
share to the explanatory variables.5 The expected sign of the impacts of income per capita are recorded in
all estimates. However, the turning point is somewhat lower than expected from table 1.6 The significant
impact of investment does not resist to the dynamic specification and turns even negative in the more
complete setting.
Let us now focus on the trade variables. As explained in the preceding section, the impact of trade might
operate through both the volume output (as shown in table 2) and the relative productivity. From column
3, we infer that an increase in the imports from the South of 1 point of GDP reduces the manufacturing
employment share by 4.0% in the long term, whereas that number is 1.1% only if imports come from the
North. This fairly high ratio of 3.5 gives an order of magnitude for the labour content of imports from
South relative to that from North for a given dollar value.
We also tested whether the impact of imports from developing countries, as measured by the IMPSOUTH
parameter, was more pronounced in the second half of the period (1986-2002), and could not find any
significant difference between the two sub-periods.
How do these results compare with RR’s?
RR limit their approach to the static specification. In their Table 4, they present estimates with and
without time dummies, directly comparable to our own Table 4. The turning point and the impact of the
trade balance are very closely estimated. However, there are two main differences. In their specification
without time dummies, the IMPSOUTH parameter is greater in absolute terms than our 2.85 but not
significantly different. In the one with time dummies, which as we argued ought to be preferred to
account for exogenous TFP, their estimate seems large at 6.7, leading to a “South/North” ratio of 6.6.
Secondly, in both their specifications, they obtain a much higher sensitivity of the manufacturing
employment share to income per capita. When time dummies are included, this sensitivity might be
interpreted as the elasticity of manufacturing employment to income. In this case with a similar turning
point, this elasticity varies in a range of (0.25, -0.50) when GDP per capita increases from $5,000 to
$30,000 in our case, whereas from RR estimates, this range is (0.80, -1.40).

17
Finally, our results being close to RR’s overall, the dynamic specification and the treatment of trade
endogeneity, with the usual reservations due to the low power of the overidentification tests, reinforce the
confidence one could place in these numbers.
Contributions to deindustrialisation
Based on our benchmark estimates in column 3, Table 5 gives the changes in the manufacturing
employment share induced by the changes in explanatory variables, as well as the total contribution of
trade with developing economies. The contribution of trade with low wage economies would explain 20%
on average of the observed decline in the manufacturing employment share.7 The magnitude of such
effect varies from 7% only in Sweden, notwithstanding the remarkable internationalisation of Swedish
firms, to more than a third in Italy, Austria and Finland, where it is to be remembered that the total
decrease in the employment share is much lower than the average. The contribution for Korea cannot be
interpreted for obvious reasons.
Stated differently, trade with developing countries is associated with an average decrease of 1.9 points in
the employment share, varying from 0.7 points for Korea and Sweden to 4.3 points for the Netherlands.
One could calculate what would be manufacturing employment in 2002, if the countries had maintained
their trade ratios with developing countries at the 1970 level. For the USA, Japan and France, for example,
this means that, given the total employment in 2002 of 134.3, 65.4 and 24.9 million respectively, one can
assess that trade with developing countries “costs” around 3.3 million, 1.4 million and 350 000
manufacturing jobs respectively, part of which being compensated by jobs in the service sector.8
<< Tables 4 and 5 about here >>
Interestingly, one can also calculate such a contribution for the two sub-periods we have defined, namely
before and after 1986. Doing so, we can identify the expected acceleration of the phenomenon: it is
simply twice as large in the second sub-period.

18
The following conclusions can be drawn based on this econometric exercise:
- First, net trade with low wage countries is associated with a non-negligible decrease of around
2 points in the manufacturing employment share between 1970 and 2002, on average across
countries.
- Second, this represents, on average, only a fifth of the deindustrialisation over the period, i.e.
of the average drop of 8.3 points in the manufacturing employment share, despite the
acceleration of the phenomenon during the second half of our period. However, this
contribution varies a lot across countries, in a range of one to five.
- Third, not all trade flows with countries of offshoring are associated with offshoring: some
“autonomous” trade flows take place just because emerging economies are specialising and
trading with our rich economies. Accordingly, the average 20% contribution is a pessimistic
view.
6. CONCLUSION
The decline in the share of industry in total employment, the so-called deindustrialisation, currently seems
to be accelerated by the forces of globalisation. Civil society has come to fear a systematic relocation of
manufacturing activities towards low wage economies. Such a process is being favoured by the ongoing
international fragmentation of production, which makes more appealing to combine the comparative
advantages of the various locations available.
In order to address these fears, we tentatively measure the impact of trade with low wage countries
hosting offshore-outsourced activities on the observed deindustrialisation in sixteen OECD economies.
We use panel data covering the 1970-2002 period in order to estimate the respective contributions of
income per capita, investment and net trade with low wage countries offering these new appealing
locations.
We find that trade in goods with developing countries accounts, at most, for a third of deindustrialisation,
and for only a fifth on average in our sample. It appears that the best way to slow or even reverse the
decline of the industry is by increasing productivity in services.

19
7. REFERENCES
Amiti M., Wei S.J. 2004. Fear of Service Outsourcing: is it Justified?, NBER Working Paper, no. 10808.
Anderton, R., Brenton, P. 1999. Outsourcing and low-skilled workers in the UK, Bulletin of Economic
Research, vol. 51, no. 3: 1-19.
Arellano M., Bond S. 1991. Some Tests of Specification for Panel Data: Monte Carlo Evidence and an
Application to Employment Equations. Review of Economic Studies, vol. 58 : 277-297.
Arthuis J. 1993. Rapport du Sénat sur l’incidence économique et fiscale des délocalisations hors du territoire national des
activités industrielles et de services, no. 337.
Aw B.Y., Roberts M.J. 1985. The Role of Imports from the Newly Industrializing Countries in US
Production, Review of Economics and Statistics , vol. 67, no. 1.
Barba-Navaretti G., Castellani D. 2003. Investments Abroad and Performance at Home. Evidence from
Italian Multinationals, Centro Studi Luca d’Agliano Development Studies Working Papers, no. 180.
Bhagwati J., Panagariya J. & Srinivasan T.N. 2004. The Muddles over Outsourcing, Journal of Economic
Perspectives, vol. 18, no. 3.
Chen T.J., Ku Y.H. 2003. The Effect of Overseas Investment on Domestic Employment, NBER Working
Paper:, no. 10156.
Feenstra, R. C., Hanson G.H. 1996. Globalization, Outsourcing, and Wage Inequality, American Economic
Review, vol. 86, no. 2 : 240-45.
Fontagné L., Freudenberg M., Ünal-Kezenci D. 1996. Statistical Analysis of EC Trade in Intermediate
Products, Eurostat, Série 6D, March.
Hanson, G. H., Mataloni R. J., Slaughter M. J. 2003. Vertical Production Networks in Multinational Firms,
NBER Working Papers, no. 9723.
Hijzen A. 2003. Fragmentation, Productivity and Relative Wages in the UK: A Mandated Wage Approach,
GEP Research Paper, no. 03/17, University of Nottingham.
Hijzen A., Görg H., Hine R.C. 2003. International Fragmentation and Relative Wages in the UK, IZA
Discussion Paper, no. 717.

20
Hine R.C., Wright P.W. 1998., Trade with Low Wage Economies, Employment and Productivity in UK
Manufacturing, The Economic Journal, vol. 108, no. 450:1500-1510.
Hummels D., Ishii J ., YI K. M. 2001., The Nature and Growth of Vertical Specialization in World Trade,
Journal of International Economics, vol. 54, no. 1: 75-96.
Kirkegaard J.F. 2004. Outsourcing – Stains on the White Collar ?, Institute for International Economics working
document.
Krugman P. 1996. Domestic Distortions and the Deindustrialization Hypothesis. In The political economy of
trade policy: in honour of Jagdish Bhagwati: 33-49, Cambridge and London: MIT Press.
Mann C. 2003. Globalization of IT Services and White Collar Jobs: The Next Wave of Productivity
Growth, International Economics Policy Briefs, PB03-11, Institute for International Economics, Washington
DC.
Marin D. 2004. A Nation of Poets and Thinkers. Less so with Eastern Enlargement? Austria and
Germany. CEPR Discussion paper, no. 4358.
Roodman D. 2003. XTABOND2: Stata module to extend xtabond dynamic panel data estimator.
Statistical Software Components S435901, Boston College Department of Economics.
Rowthorn R.E., Coutts K. 2004. De-industrialisation and the Balance of Payments in Advanced
Economics, Cambridge Journal of Economics, vol. 28, no. 5: 767-790.
Rowthorn R.E., Ramaswamy 1997. Deindustrialization– Its Causes and Implications, IMF Economic issues,
no. 10.
Rowthorn R.E., Ramaswamy R. 1998. Growth, Trade an Deindustrialization, IMF working paper,
WP/98/60.
Sachs J.D., Shatz H.J. 1994. Trade and Jobs in U.S. Manufacturing, Brooking Papers on Economic Activity, vol.
94, no. 1: 1-84.
Samuelson P.A. 2004. Where Ricardo and Mill Rebut and Confirm Arguments of Mainstream Economists
Supporting Globalization , Journal of Economic Perspectives, vol. 18, no. 3 : 135-146.
Sanyal K. K. 1983. Vertical Specialization in a Ricardian Model with a Continuum of Stages of Production,
Economica, vol. 50, 197

21
Sanyal K. K., Jones R. W. 1982. The Theory of Trade in Middle Products, American Economic Review, vol.
72, no. 1.
Strauss-Kahn V. 2003. The Role of Globalization in the Within-Industry Shift Away from Unskilled
Workers in France, NBER Working Papers, no. 9716.
Thoenig M., Verdier T. 2002. A Theory of Defensive Skill-Biased Innovation and Globalization, CEPR
Discussion paper , no. 3416.
United States Government Accountability Office 2004. Current Government Data Provide Limited
Insight into Offshoring of Services, Report to Congressional Requesters, GAO 04-932.
van Welsum, D. 2004. Potential Offshoring of ICT-Intensive Using Occupations, Working Party on the
Information Eco.
Wood A. 2004. North-South Trade, Employment and Inequality, Oxford Clarenton Press.
Footnotes 1 In that sense, our results complement the recent update provided by Rowthorn and Counts (2004).
²US Department of Commerce (2004).
3Krugman (1996) p.5.
4 Obviously, this is a restrictive framework because the reasoning is conducted at a fixed scope. In practice, because
of innovation, new sectors are emerging, benefiting from both high productivity and sustained demand.
Furthermore, intern ational trade represents a leverage effect for the countries that manage to specialise in these
vibrant sectors (and vice versa for the other).
5For example, the long-term sensitivity to imports from developing countries of -2.848 in column 3 is defined as the
sum of 0.215 and -0.641 divided by 1 minus the sum of the lagged employment share parameters 1.009 and -0.159.
6Note that, based on the cumulative impact of the two curves in Figure 2, the employment share should peak before
the turning point.
7The average contribution is a weighted average using the absolute change in the employment share as weight. The
unweighted average is slightly less than two points higher. When Korea, the only country for which the employment
share has increased over the period, is excluded, the weighted average contribution increases from 19.8% to 21.2%.
8In the United States, the changes in trade with developing countries between 1970 and 2002 is associated with a 2.5
point loss in the manufacturing employment share and 2.5%*134.6 million=3.3 million.

22
Tables and Figures
Figure 1: Price and wealth effects on relative output (volume)
Time
Price effect Wealth effect
Figure 2: Price and wealth effects on relative value output and
employment
Time
Wealth effect Price effect

23
Figure 3: Manufacturing Share in Employment in Selected Member States (1970-2002)
10%
15%
20%
25%
30%
35%
70 72 74 76 78 80 82 84 86 88 90 92 94 96 98 00 0210%
15%
20%
25%
30%
35%
Austria Belgium
Netherlands
Source :
10%
15%
20%
25%
30%
35%
70 72 74 76 78 80 82 84 86 88 90 92 94 96 98 00 0210%
15%
20%
25%
30%
35% France UK
Source :
14%
16%
18%
20%
22%
24%
26%
28%
70 72 74 76 78 80 82 84 86 88 90 92 94 96 98 00 0214%
16%
18%
20%
22%
24%
26%
28%
Denmark Finland
Sweden
Source :
16%
18%
20%
22%
24%
26%
28%
30%
70 72 74 76 78 80 82 84 86 88 90 92 94 96 98 00 0216%
18%
20%
22%
24%
26%
28%
30%
Italy Portugal
Spain
Source :
Source: OECD, STAN

24
Figure 4: Manufacturing Share in Employment in Other Developed Countries (1970-2002)
12%
14%
16%
18%
20%
22%
24%
26%
70 72 74 76 78 80 82 84 86 88 90 92 94 96 98 00 0212%
14%
16%
18%
20%
22%
24%
26%
Canada Norway
USA
Source :
13%
15%
18%
20%
23%
25%
28%
30%
70 72 74 76 78 80 82 84 86 88 90 92 94 96 98 00 0213%
15%
18%
20%
23%
25%
28%
30%
Japan Korea
Source :
Source: OECD, STAN
25
Figure 5: Manufacturing Share in Employment, Value Added at Current and Constant Prices in
Selected Countries (1970-2002)
United-Kingdom
10%
15%
20%
25%
30%
35%
70 72 74 76 78 80 82 84 86 88 90 92 94 96 98 00 0210%
15%
20%
25%
30%
35%
United States
12%
14%
16%
18%
20%
22%
24%
26%
70 72 74 76 78 80 82 84 86 88 90 92 94 96 98 00 0212%
14%
16%
18%
20%
22%
24%
26%
Spain
16%
18%
20%
22%
24%
26%
28%
30%
32%
70 72 74 76 78 80 82 84 86 88 90 92 94 96 98 00 0216%
18%
20%
22%
24%
26%
28%
30%
32%
Korea
10%
15%
20%
25%
30%
35%
40%
70 72 74 76 78 80 82 84 86 88 90 92 94 96 98 00 0210%
15%
20%
25%
30%
35%
40%
Source: OECD, STAN

26
Figure 6: Percentage Change in the Share of Manufacturing in Employment, 1970-1986 and 1986-
2002
-15.0%
-10.0%
-5.0%
0.0%
5.0%
10.0%
15.0%au
t
bel
can
dnk
esp fin
fra gbr
ita jpn
kor
nld
nor
prt
swe
usa
aver
age
Source: OECD, Stan, author’s calculations

27
Figure 7: Correlation between relative (industry vs services) price and productivity changes between 1970 and 2002
-1.50%-1.00%-0.50%0.00%0.50%1.00%1.50%2.00%2.50%3.00%3.50%
-2.50% -2.00% -1.50% -1.00% -0.50% 0.00% 0.50% 1.00%
Average annual relative price change
Ave
rage
annu
al re
lativ
e lab
our
prod
uctiv
ity c
hang
e
Each diamond shape represents a country

28
Figure 8: Relative (Manufacturing vs Services) Employment, Production and Prices (left scale),
and Imports from Developing Economies (share of GDP, right scale): France, 1970-2002
Relative price
Relative employt
Relative production
1987 20021970-0.400
-0.300
-0.200
-0.100
0.000
0.100
0.200
0.300
0.400
1970 20021987
Relative employmt
Importsfrom
emerging
Relative price
-0.400
-0.300
-0.200
-0.100
0.000
0.100
0.200
0.300
0.400
0.000
0.005
0.010
0.015
0.020
0.025
0.030
Source: OECD- STAN, CHELEM-CEPII, authors’ calculation
29
Table 1
Peak of the Manufacturing Employment Share, 1970-2002
Year
Share
GDP per capita (1997
PPP US dollar)
Spain 1975 25.9% 10 741
Finland 1974 25.1% 13 008
Italy 1977 28.1% 13 862
Japan 1973 27.0% 13 120
Korea 1989 27.8% 9 357
Portugal 1973 25.4% 7 591
Average 26.5% 11 280

30
Table 2
Dependent variable: Log (Relative Share of Manufacturing vs Services
in Value Added at Constant Prices)
OLS OLS
YCAP 9.07 7.8 (0.399) (0.506) YCAP² -0.491 -0.427 (0.021) (0.027) RELPRICE -0.619 -0.493 (0.046) (0.044) IMPSOUTH 2.01 (0.83) BALANCE 1.817 (0.2) FIXCAP 0.176 (0.036) country fixed effects yes yes turning point ($ PPA) 10 263 9 260
Notes YCAP is the log of real GDP per capita. RELPRICE is the log of the relative price of manufactures vs services. IMPSOUTH is the share of manufacture imports from developing countries in GDP, BALANCE is the manufacture trade balance and FIXCAP is log of fixed capital formation, both as a percentage of GDP.

31
Table 3 Dependent variable: EMPSHARE = Log (Manufacturing Share in Total Employment)
Level
First-differences
First-differences
First-differences
OLS
(1)
GMM
(2)
GMM
(3)
GMM
(4)
Lag EMPSHARE 0.850*** 1.009*** 0.998*** (0.034) (0.073) (0.070) Lag2 EMPSHARE -0.159** -0.148* (0.069) (0.07) YCAP 4.521*** 0.271 3.022 3.072 (0.420) (0.580) (2.678) (2.757) Lag YCAP -5.301** -5.264** (1.893) (1.915) Lag2 YCAP 2.864** 2.831** (1.104) (1.058) YCAP² -0.23*** -0.016 -0.142 -0.144 (0.024) (0.033) (0.135) (0.140) Lag YCAP² 0.268** 0.265** (0.096) (0.097) Lag2 YCAP² -0.159** -0.157** (0.058) (0.055) IMPSOUTH -1.847*** -0.403 0.215 0.375 (0.600) (0.305) (0.229) (0.299) Lag IMPSOUTH -0.641** -0.658** (0.263) (0.297) BALANCE 0.983*** 0.137* 0.242** 0.197* (0.129) (0.076) (0.102) (0.095) Lag BALANCE -0.076 -0.114 (0.081) (0.088) FIXCAP 0.058** 0.031 0.035 0.03 (0.024) (0.019) (0.027) (0.026) Lag FIXCAP -0.044 -0.042 (0.027) (0.026) country dummies yes time dummies yes yes yes yes First-order serial correlation 0.017 0.003 0.004 Second-order serial correlation 0.120 0.851 0.800 Sargan-Hansen overid. test 1.000 1.000 1.000
Notes (i) Variables are described in Table 2. (ii) GMM is the one-step Arellano-Bond estimator, using as instruments the second to fourth lags of the dependent
variable in block diagonal form and the second to fourth lags of trade variables in columns 2 and 3, and the third to fifth lags of the trade variables in column 4.
(iii) Asymptotic standard errors, between parentheses, are robust to heteroscedasticity and autocorrelation and computed from Roodman (2003). *, ** and *** indicate significance at 90%, 95% and 99% confidence level, respectively.
(iv) For the Sargan-Hansen test, the number reported is the confidence level at which the overidentifying restrictions can be rejected.
(v) Serial correlation statistics are P-values for Arellano-Bond tests for first- and second-order correlation.

32
Table 4 Long-term Sensitivities based on table 3
Dependent variable: Log (Manufacturing Employment Share)
Level
First-differences
First-differences
First-differences
OLS
(1)
GMM
(2)
GMM
(3)
GMM
(4)
YCAP 4.521 1.808 3.926 4.285 YCAP² -0.229 -0.104 -0.216 -0.237 IMPSOUTH -1.846 -2.682 -2.848 -1.884 BALANCE 0.983 0.915 1.118 0.559 FIXCAP 0.059 0.205 -0.058 -0.069 turning point (1997 $, PPP) 19 202 6 220 8 690 8 550 Developing / Developed 2.9 3.9 3.5 4.4

33
Table 5
Changes in the Manufacturing Employment Share Induced by the Changes in Explanatory
Variables and Total Contribution of Trade with Developing Economies (in % of total change)
GMM estimates from column 3 of table 4
Country Change in the
employment share
Investment Income per capita
Manufact. trade
balance
Imports from
developing
Exports to developing
Residuals + exogenous
TFP
Contrib. of° trade
with developing
Italy -3.8 0.3 -4.5 0.2 -2.2 0.8 1.6 36.8
Austria -5.8 -0.1 -4 0.1 -2.9 0.8 0.3 36.2
Finland -3.5 0.6 -4 1.8 -2.4 1.2 -0.7 34.3
Netherl. -13.4 0.3 -4 0.4 -4.7 0.4 -5.8 32.1
Portugal -3.5 0.1 -0.9 -0.2 -1.1 0 -1.4 31.4
Japan -7.1 0.1 -4.7 0.3 -2.9 0.8 -0.7 29.6
Canada -7.6 -0.3 -3.9 0.4 -2.1 0 -1.7 27.6
USA -11.8 -0.3 -5 -0.2 -2.7 0.2 -3.8 21.2
Belgium -15.9 0 -4.6 1.3 -4.6 1.4 -9.4 20.1
Denmark -9.6 -0.1 -4 1.1 -2.4 0.5 -4.7 19.8
Spain -7.7 0 -2.6 -0.3 -1.9 0.4 -3.3 19.5
Norway -10.6 0.5 -5.7 -0.7 -1.6 -0.1 -3 16.0
France -10.3 0 -3.9 0 -1.8 0.4 -5 13.6
UK -18.1 -0.2 -4.3 -0.6 -2.2 0 -10.8 12.2
Sweden -9.8 0.1 -4.1 0.9 -1.3 0.6 -6 7.1
Korea 6.1 -0.5 2.5 0.5 -2.1 1.4 4.3 -11.5
average -8.3 0.0 -3.6 0.3 -2.4 0.5 -3.1 19.8