![Investigation of mechanical degradation mechanism onto the ......[1] Jack W. Ekin, Experimental Techniques for Low-Temperature Measurements : Cryostat Design, Material Properties,](https://static.fdocuments.us/doc/165x107/5f0442b77e708231d40d19b1/investigation-of-mechanical-degradation-mechanism-onto-the-1-jack-w-ekin.jpg)
Degradation Analysis Techniques Degradation Analysis Techniques Dr Pavan Addepalli, Research Fellow...
26
www.through-life-engineering-services.org Degradation Analysis Techniques Dr Pavan Addepalli, Research Fellow 03 June 2019
Transcript of Degradation Analysis Techniques Degradation Analysis Techniques Dr Pavan Addepalli, Research Fellow...

www.through-life-engineering-services.org
Degradation Analysis Techniques
Dr Pavan Addepalli, Research Fellow
03 June 2019

2 © Cranfield University 2019
• Overview
• Degradation Drivers & Failure Modes
• The ‘Big Five’ NDT
• The maintenance perspective
• USE Case: Active Thermography
• Summary
Outline
3 © Cranfield University 2019
Loss of relevant properties that determine the performance of the material and or a part
belonging to the asset
Natural or induced
Results in the form of a physical, mechanical, material or chemical phenomena
Intrinsic or specific to operational activity of the asset
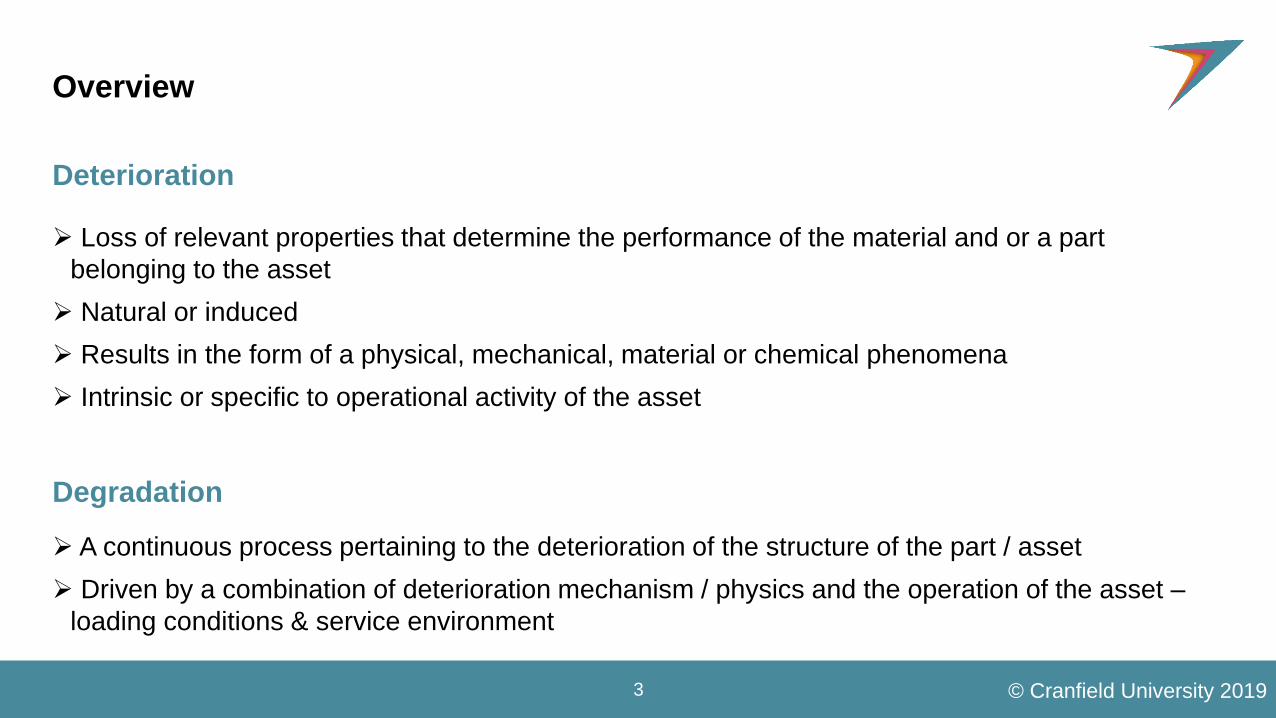
Overview
Deterioration
A continuous process pertaining to the deterioration of the structure of the part / asset
Driven by a combination of deterioration mechanism / physics and the operation of the asset –
loading conditions & service environment
Degradation

4 © Cranfield University 2019
Why is this important?
http://www.youtube.com/watch?v=9m7zRLJEIvw

5 © Cranfield University 2019
Why is this important?
http://news.bbc.co.uk/1/hi/world/europe/986737.stm
http://www.deltatest.de/en/dienstleistungen/turbinenschaufelpruefung.php
http://news.aviation-safety.net/2012/04/17/atsb-releases-report-on-qantas-
boeing-747-uncontained-engine-failure

6 © Cranfield University 2019
Why is this important?
http://www.cnde.iastate.edu/ultrasonics-and-composites/modeling-cracks-and-delaminations-carbon-fiber-composites-frank-margetan
http://news.bbc.co.uk/sport1/hi/other_sports/sailing/1364392.stm
Crack
7 © Cranfield University 2019
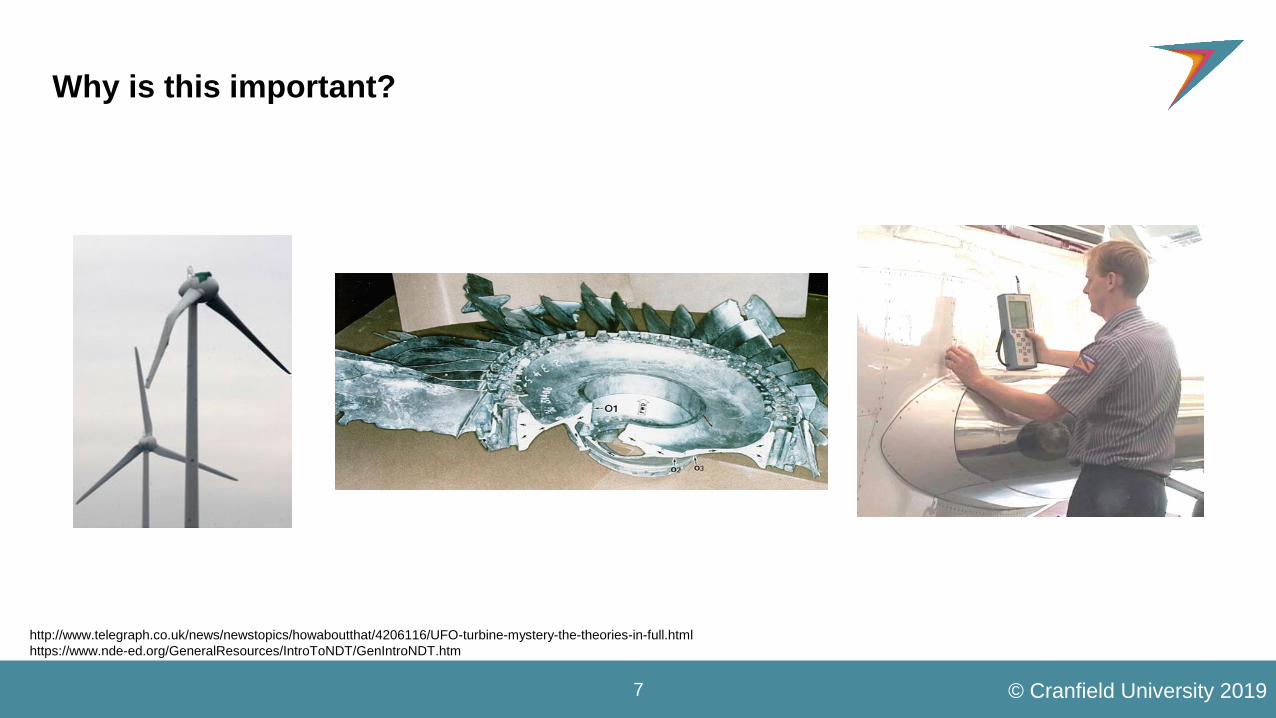
Why is this important?
http://www.telegraph.co.uk/news/newstopics/howaboutthat/4206116/UFO-turbine-mystery-the-theories-in-full.html
https://www.nde-ed.org/GeneralResources/IntroToNDT/GenIntroNDT.htm

8 © Cranfield University 2019
Degradation Drivers
Use Case: Precision Ball Bearings

9 © Cranfield University 2019
Failure Modes
Source: ISO 15243:2017
10 © Cranfield University 2019
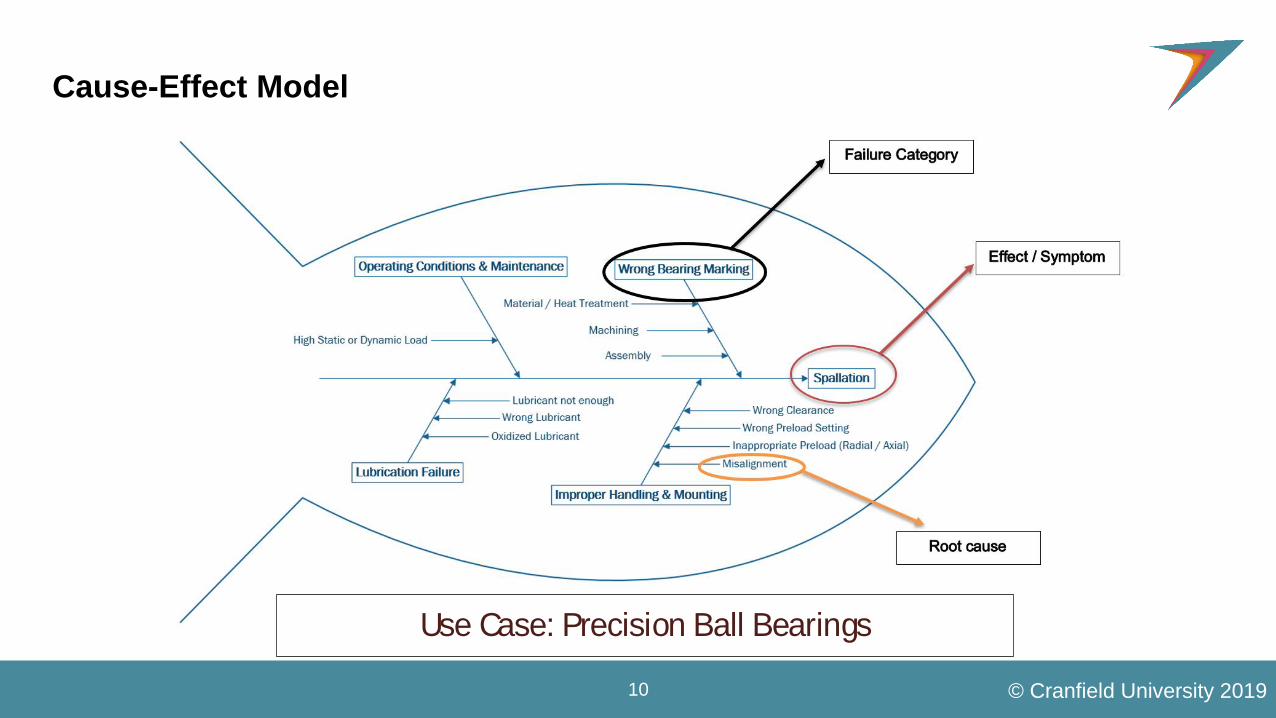
Cause-Effect Model
Use Case: Precision Ball Bearings

11 © Cranfield University 2019
The ‘Big Five’ NDT techniques in industry
Radiography
Ultrasound
Eddy current
MPI
LPI
Magnetic
particle
Magnetic field
Crack
N SS
N
12 © Cranfield University 2019
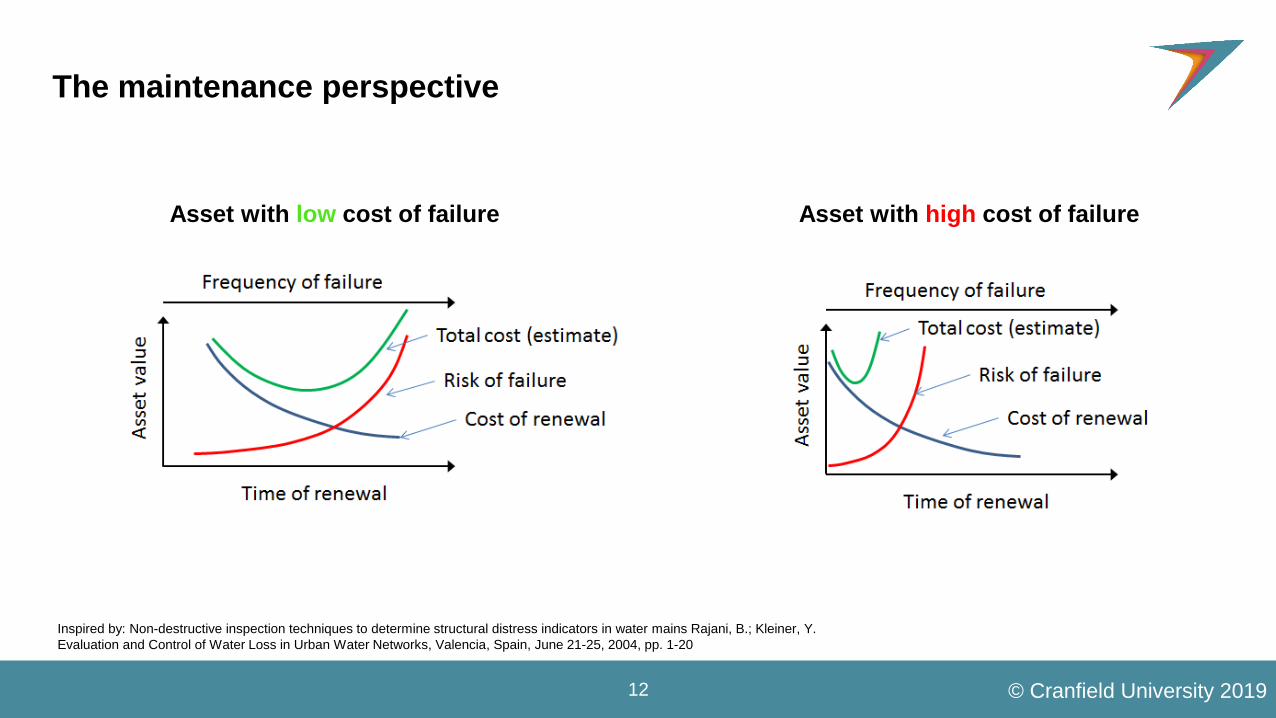
The maintenance perspective
Inspired by: Non-destructive inspection techniques to determine structural distress indicators in water mains Rajani, B.; Kleiner, Y.
Evaluation and Control of Water Loss in Urban Water Networks, Valencia, Spain, June 21-25, 2004, pp. 1-20
Asset with low cost of failure Asset with high cost of failure
13 © Cranfield University 2019
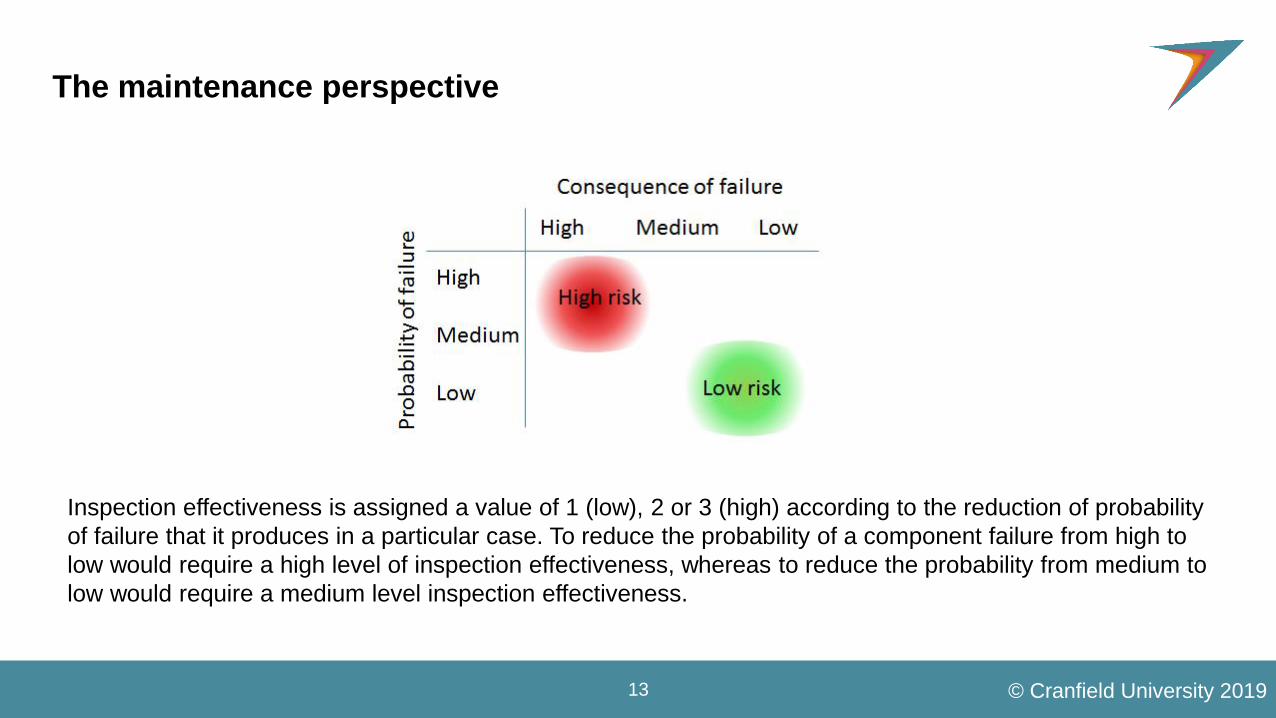
The maintenance perspective
Inspection effectiveness is assigned a value of 1 (low), 2 or 3 (high) according to the reduction of probability
of failure that it produces in a particular case. To reduce the probability of a component failure from high to
low would require a high level of inspection effectiveness, whereas to reduce the probability from medium to
low would require a medium level inspection effectiveness.

14 © Cranfield University 2019
Aim:
Better visualise the damage of composites in a relatively easy-to-use way and automatically and
quantitatively measure the properties of the degradation.
Use Case: Active Thermography
Degradation Assessment of Composites
Specimen
Preparation
Thermography Inspection
Feature Extraction
ClassificationDamage
VisualisationValidation
15 © Cranfield University 2019
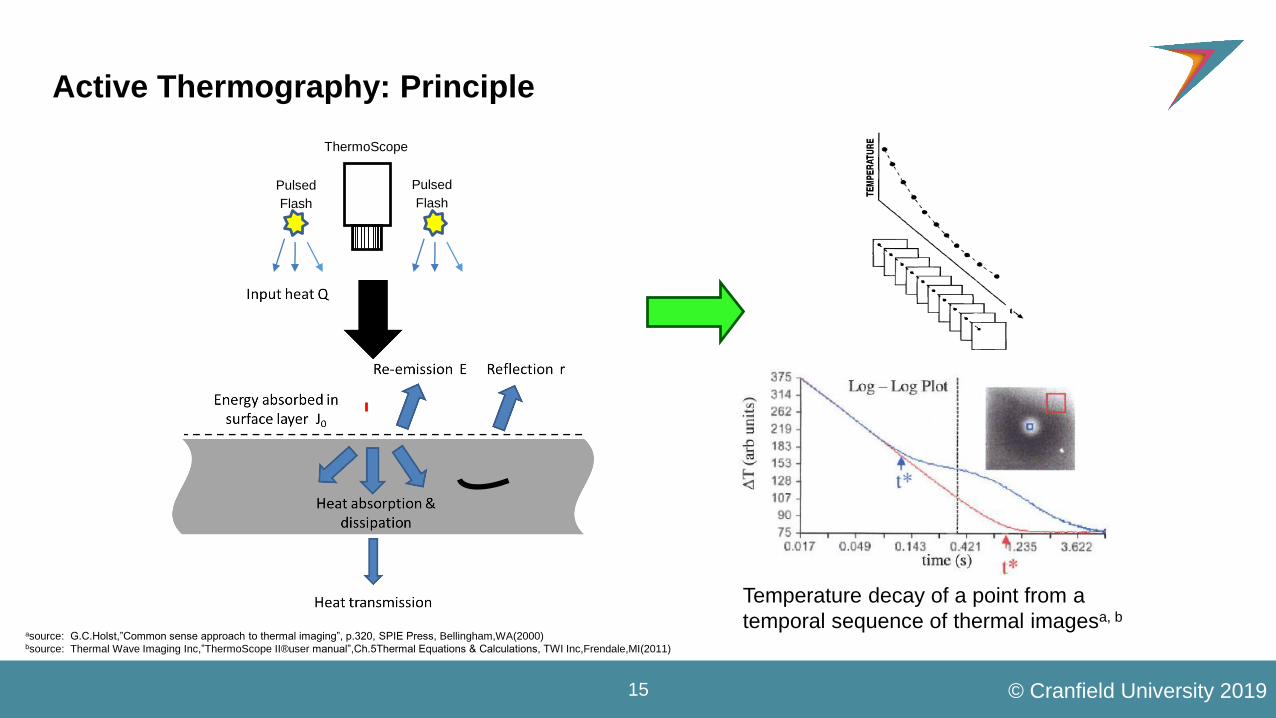
Active Thermography: Principle
asource: G.C.Holst,”Common sense approach to thermal imaging”, p.320, SPIE Press, Bellingham,WA(2000)bsource: Thermal Wave Imaging Inc,”ThermoScope II®user manual”,Ch.5Thermal Equations & Calculations, TWI Inc,Frendale,MI(2011)
ThermoScope
Pulsed
Flash
Pulsed
Flash
Temperature decay of a point from a
temporal sequence of thermal imagesa, b

16 © Cranfield University 2019
Visualisation 1: RAW Thermal Image
RAW TSR
1st Derivative 2nd Derivative
17 © Cranfield University 2019
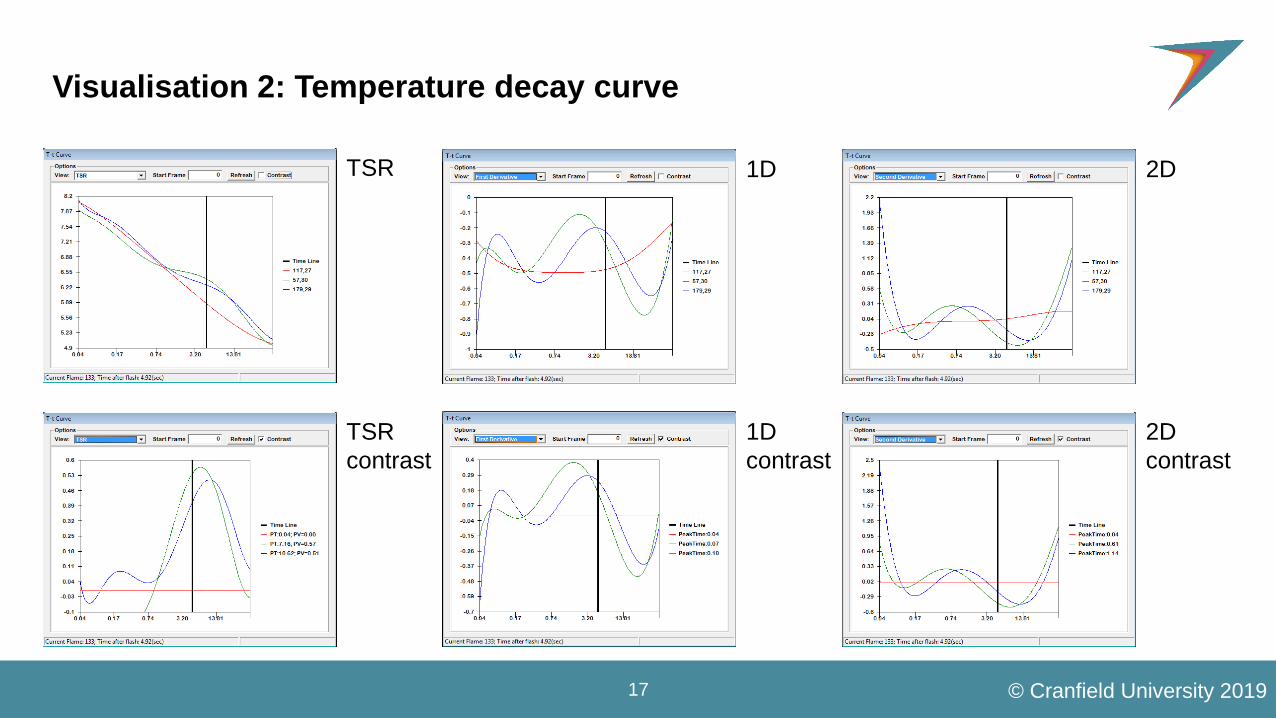
Visualisation 2: Temperature decay curve
TSR 1D 2D
TSR
contrast
1D
contrast
2D
contrast

18 © Cranfield University 2019
Comparison of thermography, X ray and Ultrasonic imaging
Detection of Foreign Object Debris in a graphite-epoxy sandwich panel
TWI Thermography X-Ray UT (transmission)
Thermal Wave ImagingTHE ART OF INSPECTIONSource: Thermal Wave Imaging Inc.

19 © Cranfield University 2019
Clustering results using the CCA method
The classification results based on the scatter of the first order coefficient and the second order
coefficient for all specimens, where the green colour denotes the detected sound pixels and the red
colour denotes the detected damaged pixel.
20 © Cranfield University 2019
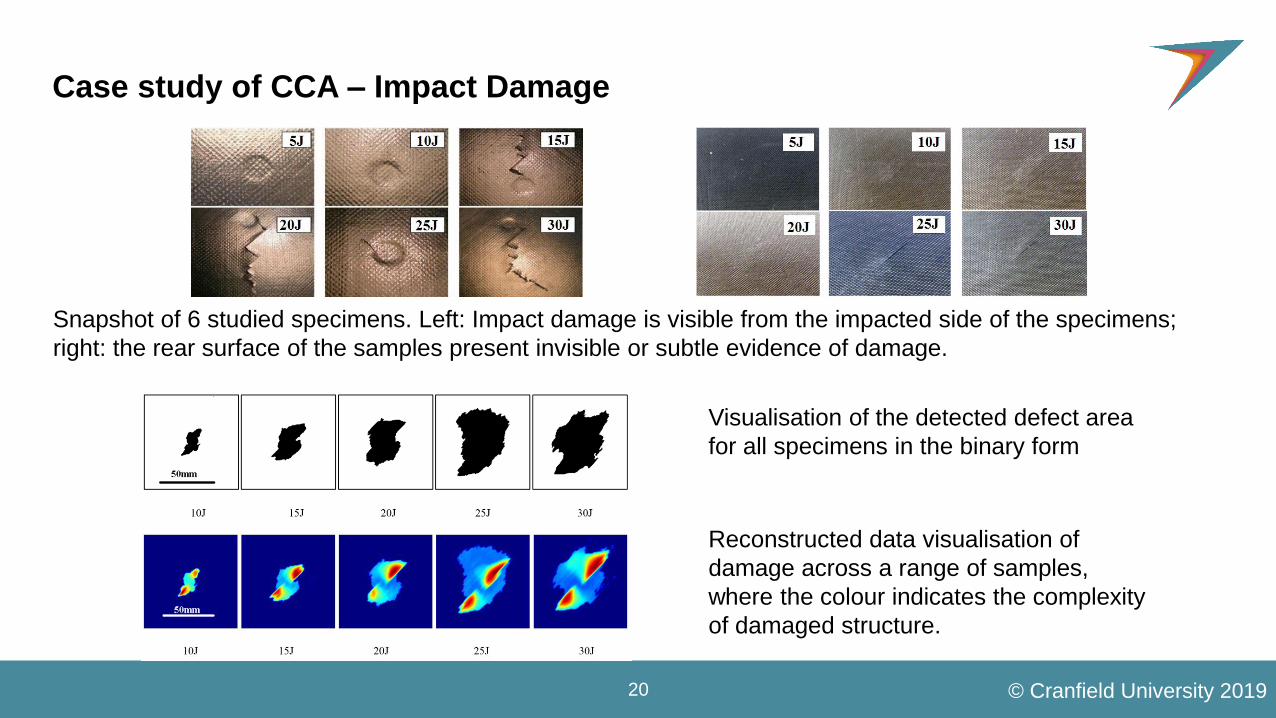
Case study of CCA – Impact Damage
Snapshot of 6 studied specimens. Left: Impact damage is visible from the impacted side of the specimens;
right: the rear surface of the samples present invisible or subtle evidence of damage.
Visualisation of the detected defect area
for all specimens in the binary form
Reconstructed data visualisation of
damage across a range of samples,
where the colour indicates the complexity
of damaged structure.

21 © Cranfield University 2019
Measurement
Colour Binary Connected
component analysis
Damage
enhancement
Sizing
22 © Cranfield University 2019
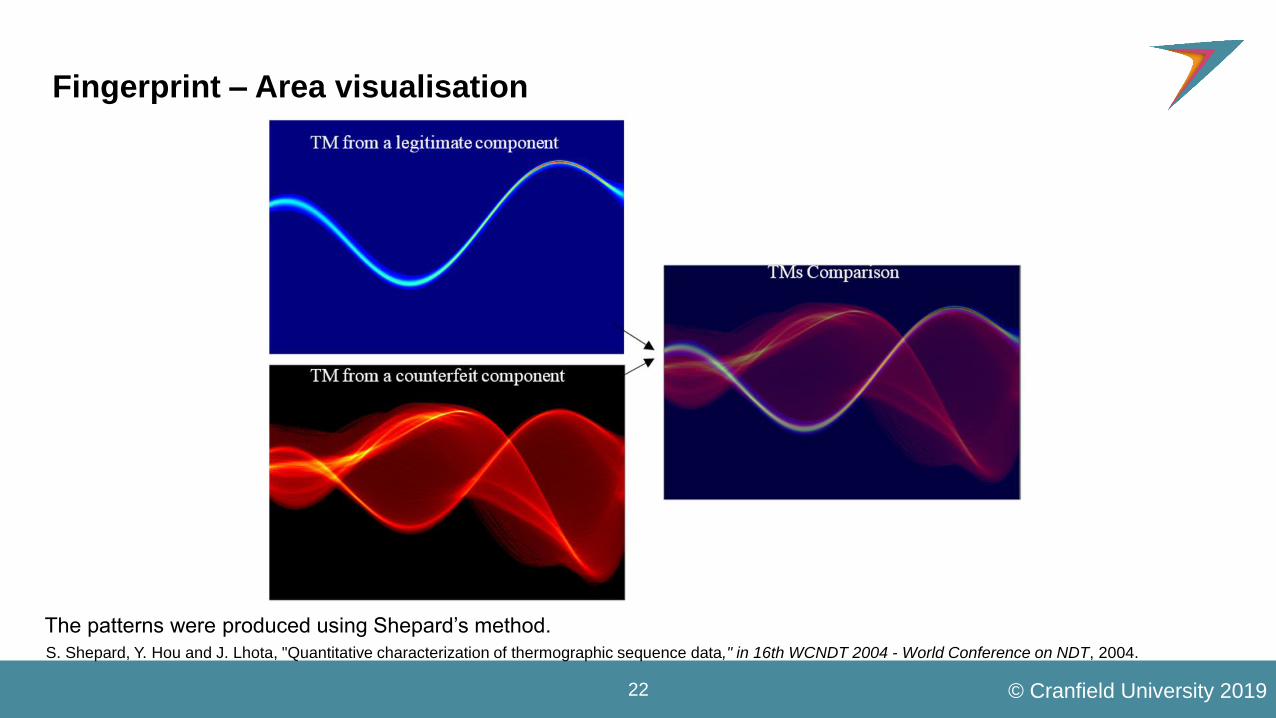
Fingerprint – Area visualisation
The patterns were produced using Shepard’s method.
S. Shepard, Y. Hou and J. Lhota, "Quantitative characterization of thermographic sequence data," in 16th WCNDT 2004 - World Conference on NDT, 2004.

23 © Cranfield University 2019
Thermal material property measurement
Thermal diffusivity measurement for a defect-free composite sample using a novel nonlinear system identification
(NSI) method. Left: the map of measured thermal diffusivity; right: the histogram of measured thermal diffusivity.

24 © Cranfield University 2019
A Confidence Map based Damage Assessment Approach
1. Defect detection
2. Confidence map
3. Depth map with high confidence

25 © Cranfield University 2019
Summary
• Degradation in high-value products (gas turbine and aero-engines) is a demanding and
challenging area and understanding & establishing a cause-effect model will help maintain the
asset
• Such damage reduces performance and shortens the life of the product
• Potential to cause ‘in-service’ product failure and the need for multiple maintenance strategies is
essential
• Response strategies in design and service conditions based on degradation and mitigating their
propagation mechanisms is the current trend
• Non-destructive inspection is a mandatory requirement during service to evaluate the remaining
component life

www.through-life-engineering-services.org
Thank you for your attention
Dr Pavan Addepalli
Research Fellow in Mechanical Component Degradation Analysis, SATM
TES Centre, Building 30, Cranfield University, Cranfield MK43 0AL. UK
T: +44 (0)1234 758346