Deformations and damage to buildings adjacent to deep ...
143
Deformations and damage to buildings adjacent to deep excavations in soft soils literature survey F531 © Deltares, 2009 Mandy Korff
Transcript of Deformations and damage to buildings adjacent to deep ...

Deformations and damage to buildings adjacent to deep excavations in soft soils literature survey F531
© Deltares, 2009
Mandy Korff
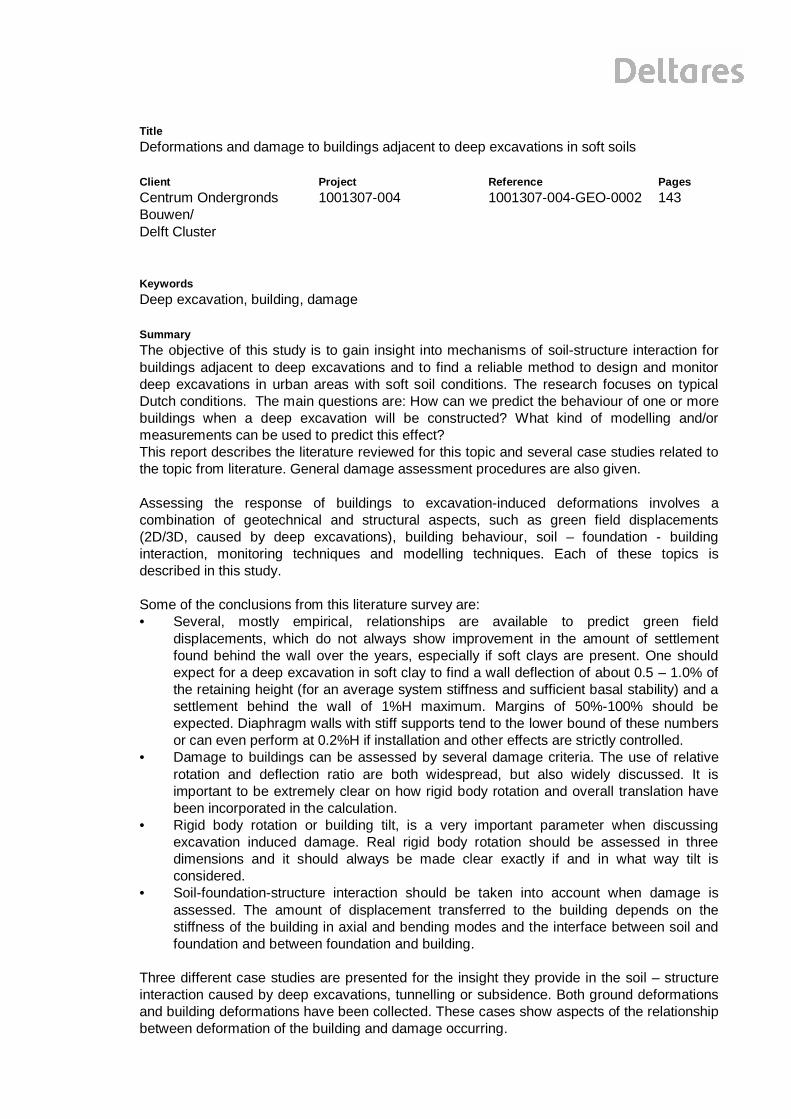
Title Deformations and damage to buildings adjacent to deep excavations in soft soils Client Centrum Ondergronds Bouwen/ Delft Cluster
Project 1001307-004
Reference 1001307-004-GEO-0002
Pages 143
Keywords Deep excavation, building, damage Summary The objective of this study is to gain insight into mechanisms of soil-structure interaction for buildings adjacent to deep excavations and to find a reliable method to design and monitor deep excavations in urban areas with soft soil conditions. The research focuses on typical Dutch conditions. The main questions are: How can we predict the behaviour of one or more buildings when a deep excavation will be constructed? What kind of modelling and/or measurements can be used to predict this effect? This report describes the literature reviewed for this topic and several case studies related to the topic from literature. General damage assessment procedures are also given. Assessing the response of buildings to excavation-induced deformations involves a combination of geotechnical and structural aspects, such as green field displacements (2D/3D, caused by deep excavations), building behaviour, soil – foundation - building interaction, monitoring techniques and modelling techniques. Each of these topics is described in this study. Some of the conclusions from this literature survey are: • Several, mostly empirical, relationships are available to predict green field
displacements, which do not always show improvement in the amount of settlement found behind the wall over the years, especially if soft clays are present. One should expect for a deep excavation in soft clay to find a wall deflection of about 0.5 – 1.0% of the retaining height (for an average system stiffness and sufficient basal stability) and a settlement behind the wall of 1%H maximum. Margins of 50%-100% should be expected. Diaphragm walls with stiff supports tend to the lower bound of these numbers or can even perform at 0.2%H if installation and other effects are strictly controlled.
• Damage to buildings can be assessed by several damage criteria. The use of relative rotation and deflection ratio are both widespread, but also widely discussed. It is important to be extremely clear on how rigid body rotation and overall translation have been incorporated in the calculation.
• Rigid body rotation or building tilt, is a very important parameter when discussing excavation induced damage. Real rigid body rotation should be assessed in three dimensions and it should always be made clear exactly if and in what way tilt is considered.
• Soil-foundation-structure interaction should be taken into account when damage is assessed. The amount of displacement transferred to the building depends on the stiffness of the building in axial and bending modes and the interface between soil and foundation and between foundation and building.
Three different case studies are presented for the insight they provide in the soil – structure interaction caused by deep excavations, tunnelling or subsidence. Both ground deformations and building deformations have been collected. These cases show aspects of the relationship between deformation of the building and damage occurring.

Title Deformations and damage to buildings adjacent to deep excavations in soft soils Client Centrum Ondergronds Bouwen/ Delft Cluster
Project 1001307-004
Reference 1001307-004-GEO-0002
Pages 143
The case studies show that improvements are needed in the way damage indicators are handled and in the analysis of measurements of soil-construction interaction: • The three-dimensional behaviour of the deep excavation can reduce or increase the
amount of damage in an adjacent construction. • The ratio between the wall deflection and the settlement behind the wall falls within the
general band of 0.5-1.5. In special circumstances (such as extreme ground-water lowering outside the excavation) this ratio might increase.
• Actual green field displacements were in general larger than the predicted ones, mainly caused by installation effects, ground-water lowering or other effects not accounted for. The effect of the excavation itself is generally predicted rather well.
• Curvature of the building can cause substantial damage. If buildings are homogeneous structures, taking into account rigid body tilt may limit the damage expected.
• In certain cases also rigid body tilt can cause substantial damage, although this is not commonly acknowledged. Especially when several rigid bodies are connected (such as in a row of houses built together or building parts connected by flexible joints) the differential rigid body rotations can cause severe cracking in the joints. For very large rigid body tilts (say over 1:100) tilt becomes clearly noticeable and can effect structural stability and functional performance. Using the limiting tensile strain method will exclude this effect.
• Relative rotation and deflection ratio give similar results as indicators for damage if they are calculated in a similar way. This means that hogging and sagging parts of a building should be separated and tilt included if this is present. For relative rotation this is not straightforward, but can be done in an objective manner. Presentation of a continuous value of damage indicators along a building does not mean much and should be avoided.
• There are very few cases available with both green field and building deformations, especially for buildings founded on piles. There is an even greater lack of case histories with sufficient data on horizontal deformations of the building compared to green field and subsoil deformations.
In the next phases of this research, a detailed look will be taken into the NoordZuidlijn project to obtain a full record of a case study of which many details will be available. The models to described in this report will be validated using the monitoring data of the NoordZuidlijn project. It is intended to further analyse the monitoring data and describe a general prediction model in the following years of this project, according to the Basis Project Plan F531. The research project is a cooperation between COB (F531) with Deltares and the University of Cambridge Version Date Author Initials Review Initials Approval Initials 02 2009-11-26 Mandy Korff Frits van Tol Marco Hutteman State final

Title Deformations and damage to buildings adjacent to deep excavations in soft soils Client Centrum Ondergronds Bouwen/ Delft Cluster
Project 1001307-004
Reference 1001307-004-GEO-0002
Pages 143

1001307-004-GEO-0002, Version 02, 26 November 2009, final
i
Contents
1 Introduction and scope 1 1.1 Underground construction in densely populated areas 1 1.2 Failure costs in underground construction 1 1.3 Specific problems of underground construction 1 1.4 Deep excavations 1 1.5 Typical Soft Soil conditions 2 1.6 Using monitoring data for model validation 2 1.7 Project cooperation 2 1.8 Scope of this research 2
2 Layout 5 2.1 Objective 5 2.2 Research questions 5 2.3 Definitions 6 2.4 Outline literature report 6
3 Literature review 7 3.1 Introduction 7 3.2 Deep excavations 8
3.2.1 Empirical work, all construction activities combined 8 3.2.2 Empirical work, effect of excavation and installation 10 3.2.3 Semi-empirical methods, shape of settlement trough due to excavation 15 3.2.4 Predicting displacements due to installation of diaphragm walls 18 3.2.5 Conclusions on displacements due to deep excavations 21
3.3 Building behaviour 22 3.3.1 Introduction 22 3.3.2 Causes of damage in buildings 22 3.3.3 Classification of damage 25 3.3.4 Building response related to excavations 27 3.3.5 Definitions 27 3.3.6 Criteria for damage to buildings 28 3.3.7 Limiting tensile strain method 36 3.3.8 Discussion points limiting tensile strain method 39
3.4 Buildings effect on excavation–induced displacements 43 3.4.1 The effect of building stiffness 43 3.4.2 The effect of building weight, stiffness and interface 45 3.4.3 The response of piled foundations near deep excavations 48 3.4.4 The response of piled foundations due to tunnelling 50 3.4.5 Damage assessment procedures 54
3.5 Modelling 55 3.5.1 Comparing geotechnical models with measurements 55 3.5.2 3D or corner effects 59 3.5.3 Coupled models 59
3.6 Monitoring 60 3.7 Conclusions 61
3.7.1 Green field displacements 61 3.7.2 Building deformations and damage 62

1001307-004-GEO-0002, Version 02, 26 November 2009, final
ii
3.7.3 Soil-structure interaction 63 3.7.4 Future work analysing case histories 63
4 Cases from literature 65 4.1 Chater Station, Hong Kong (Davies and Henkel, 1982) 65
4.1.1 Situation 65 4.1.2 Diaphragm wall installation 66 4.1.3 Dewatering 67 4.1.4 Excavation 67 4.1.5 Final deformations 68 4.1.6 Damage 69 4.1.7 Conclusion from this case study 71
4.2 Subsidence in Sarno, Italy (Cascini et al., 2007) 72 4.2.1 Subsidence due to groundwater withdrawal. 72 4.2.2 Town hall and church 72 4.2.3 Conclusion from this case study 77
4.3 Influence of Jubilee Line Extension on Ritz building, London 78 4.3.1 Situation overview 78 4.3.2 Damage criteria 79 4.3.3 Conclusions for this case study 81
4.4 KPE Singapore (Lee et al., 2007) 82 4.4.1 Introduction 82 4.4.2 Damage prediction and results 83 4.4.3 Conclusion from this case study 85
4.5 Excavation next to Xavier Warde School, Chicago (Finno et al., 2002) 86 4.5.1 Situation 86 4.5.2 Construction activities, measurements and building damage 87 4.5.3 Conclusion from this case study 93
4.6 Nicoll Highway collapse, Singapore 95 4.6.1 Description of the project 95 4.6.2 Description of the failure 96 4.6.3 Shortcomings 96 4.6.4 Cause of the collapse 97 4.6.5 Method A versus Method B 97 4.6.6 Lessons learned 99
4.7 Conclusions from case studies 100
5 Building damage assessment procedures 103 5.1 State of the art 103 5.2 Dutch practice 103 5.3 Important factors for damage assessment procedures 106
6 Data set collection 108 6.1 NoordZuidlijn project 108
6.1.1 Rokin Station 109 6.1.2 Vijzelgracht Station 110 6.1.3 Ceintuurbaan Station 111
6.2 Typical Dutch and Amsterdam Soil conditions 111 6.3 Typical Dutch buildings and foundation types 113 6.4 Monitoring system NoordZuidlijn 115
6.4.1 Overview 115

1001307-004-GEO-0002, Version 02, 26 November 2009, final
iii
6.4.2 Monitoring of adjacent structures 115 6.4.3 Subsurface measurements 116 6.4.4 Example of monitoring results 117
7 Plan for future research 122 7.1 Conclusions from literature survey and cases 122
7.1.1 Green field displacements 122 7.1.2 Building deformations and damage 123 7.1.3 Soil-structure interaction 123
7.2 Research questions from literature survey and cases 124 7.3 Analysis methods 125 7.4 Activities for future research 125
8 List of references 128

1001307-004-GEO-0002, Version 02, 26 November 2009, final
Deformations and damage to buildings adjacent to deep excavations in soft soils
1
1 Introduction and scope
1.1 Underground construction in densely populated areas In many cities in densely populated areas around the world, the application of deep excavations for the realisation of underground spaces (such as car parks, shops or cellars) or infrastructure is becoming common practice. Underground construction supports the quality of life in cities due to the availability and quality of the space that remains above ground. Due to increasing demands on space for many functions such as transportation, housing, power lines, sewers etcetera, the conditions in which these projects have to be built increased in complexity in recent years. Although a lot of effort is put into design and construction of these facilities, this however does not mean that their construction is without problems. On the contrary, during many underground construction activities problems such as damage, delays and cost overrun will be encountered. To limit damage to buildings and nuisance for neighbouring residents all kinds of measures are taken. That the desired result is not always achieved becomes clear from several examples such as described by Van Tol (2007), Simpson et al. (2008) and many others.
1.2 Failure costs in underground construction This research aims to contribute to the reduction of failure costs in the building industry and more specifically in underground construction. Problems and failure costs related to underground construction (e.g. for underground parking facilities, basements, infrastructure) are increasingly acknowledged, since it has become clear that they have a large influence on the image of the sector and the results in terms of money (5-10% loss of effectiveness due to failure costs compared to 2-3% net profit, see also Van Staveren (2006)). Risk management is a key element to achieve reduction of these costs. To improve quantitative risk analyses, which form part of good risk management, improvements are needed to methods that can be used to indicate whether or not and to what extent buildings will be influenced by construction activities. Based on these analyses, relevant measures can be taken in a cost-effective way.
1.3 Specific problems of underground construction Underground construction is likely to be more sensitive to failure costs due to the following aspects or especially in the following circumstances: • the inability to check the quality of many construction parts simply because they are
made and remain under ground • heterogeneity of the ground and the limitations in soil investigation techniques and
procedures • when soft soils are present; due to potentially larger deformations • when high ground water tables are present; due to potential for leakages etcetera • the presence of (often unexpected) obstacles such as former foundations, pipes, piles,
cables and large stones or rock; due to potential deviations in quality and performance.
1.4 Deep excavations In underground construction, both tunnelling and (deep) excavations are commonly used. Both types of constructions affect the structures directly adjacent to them. To identify which

1001307-004-GEO-0002, Version 02, 26 November 2009, final
Deformations and damage to buildings adjacent to deep excavations in soft soils
2
buildings will be influenced and to what extent, an assessment of the building damage is usually performed. This assessment might be either very simple or complex, but ideally should consist of the following steps: 1) determine green field displacements, 2) impose displacements onto building, 3) assess potential damage, 4) design measures if necessary. Most methods to assess the impact on the buildings are originally derived for tunnelling projects, which is not always problematic, but could be improved by specifically looking at deep excavations. Since trends in construction of deep excavations include deeper excavations, and situated closer to buildings, this research aims to improve the methods to assess building damage related to deep excavations.
1.5 Typical Soft Soil conditions This research deals with deep excavations in soft soil conditions only. Soft soils typically cause large displacements due to the compressibility of the material and are usually combined with high groundwater tables. In Western Europe these soils are found in large parts of the Netherlands, Ireland, Norway, Denmark, Sweden and some parts of the UK. Other parts of the world such as Singapore and Hong Kong also have significant amounts of soft soils. Soft soils are often found in deltaic areas, where rivers and oceans supplied fine grained sediments such as clay, peat and fine sands. These Deltaic areas also happen to be the most densely populated areas in the world. The results of this research can thus mostly be used in these areas.
1.6 Using monitoring data for model validation The Netherlands Centre for Underground Construction (COB) performs studies at all shield-tunnelling projects in the Netherlands. These studies include the behaviour of deep excavations and tunnelling constructions. The results of measurements and analyses performed at deep excavations at several locations are included in this research. The most recent project, the NoordZuidlijn project in Amsterdam, where several deep excavations will be made, forms the main source of information and focus of this research. The obtained data will be used to validate current and improved design methods. This project is the construction of the deep stations for the NoordZuidlijn, being the new Amsterdam Subway. Special attention is given to the stations Vijzelgracht and Ceintuurbaan, in the historic centre of Amsterdam. The monitoring data will be used for an evaluation of the prediction models, the monitoring system itself and the reliability of the measures taken. These deep excavations are special for their (potential) use of air pressure as a method to prevent uplift. Between 2007 and 2010 the deep excavations will be excavated, so that the design, execution and evaluation can be performed. A more detailed description of the project is given in section 7.1.
1.7 Project cooperation The research project is a cooperation between COB (F531) with Deltares and the University of Cambridge.
1.8 Scope of this research Following the setting of the problem as described above, the scope of this research is narrowed down to typical Dutch conditions of underground construction. Experience, field data, models and experiments from all over the world will be used to obtain a model that suits

1001307-004-GEO-0002, Version 02, 26 November 2009, final
Deformations and damage to buildings adjacent to deep excavations in soft soils
3
those typical Dutch conditions. This means that the assumed ground conditions are soft clays and sands, high ground water table, deep excavations from about 10 to 30 m deep, usually made with vertical cut offs and close to neighbouring buildings. Buildings might have a shallow or more commonly pile foundations. Use of the results should be limited to this type of situation, or else specific attention has to be paid to the differences in conditions.

1001307-004-GEO-0002, Version 02, 26 November 2009, final
Deformations and damage to buildings adjacent to deep excavations in soft soils
4

1001307-004-GEO-0002, Version 02, 26 November 2009, final
Deformations and damage to buildings adjacent to deep excavations in soft soils
5
2 Layout
2.1 Objective The objective of this study is to gain insight into mechanisms of soil-structure interaction for buildings adjacent to deep excavations and to find a reliable method to design and monitor deep excavations in urban areas with soft soil conditions. The research focuses on typical Dutch conditions. This study focuses on the following topics: • The behaviour of the supporting structure (walls, struts etc.) during excavation • Ground displacements outside the deep excavation in green field conditions • Influence of the presence of buildings on the “green field” displacements • Deformation of the adjacent structures as a result of the ground displacements
(including influence of construction stiffness and foundation type).
2.2 Research questions Taking the end result, a general method to assess excavation induced building damage for soft soil conditions, there is a need to answer several research questions. The main questions are: How can we predict the behaviour of one or more buildings when a deep excavation will be constructed? What kind of modelling and/or measurements can be used to predict this effect? The research questions for the behaviour of the deep excavation during excavation are: • How do the soil stresses change as a result of the excavation? Changes involve
changes of water pressures and vertical and horizontal stresses in the soil beneath the excavation and consolidation.
• How do the strains in the soil behind the deep excavation change at increasing excavation depth or decreasing safety against basal heave?
• How is the (building) load next to the deep excavation transferred to the wall, floor and struts or anchors?
Specific for the adjacent buildings the research questions of main importance are: • What is the difference between the predicted and measured influence on soil surface,
deeper soil levels and buildings and why does it occur? This must be related to the construction phases and the influence of prestressing the struts.
• Which assessment method fits best with the measured displacements of the surface and the buildings?
• What is the influence of the location along the excavation (3D effects, corners etc) on both the horizontal and the vertical deformation in the adjacent buildings?
• How do the results of the deformation prediction fit with probabilistic estimations? • Which monitoring is suitable for the specific aims of following the behaviour of soil and
construction in and outside the deep excavation? • How and to what extent does the monitoring contribute to decision-making processes
for mitigating measures during the construction process? These rather broad and general questions on soil-structure interaction for deep excavations will be reconsidered in Chapter 8 based on the results presented in this report.
1001307-004-GEO-0002, Version 02, 26 November 2009, final
Deformations and damage to buildings adjacent to deep excavations in soft soils
6
2.3 Definitions The symbols and definitions used in this report are explained in the text. Three definitions have been used consistently throughout this report, following upon CIRIA report C580 Gaba et al. (2003): Displacement refers to ground movements in any direction Settlement represents the vertical component of ground displacement Deformation refers to movement of or within structures
2.4 Outline literature report This literature report describes the literature reviewed for this topic in Chapter 3 and several case studies related to the topic from literature (Chapter 4). General damage assessment procedures are given (Chapter 5). It is intended to further analyse the project data and describe the general model in the following years of this project, according to the Basis Project Plan F531.

1001307-004-GEO-0002, Version 02, 26 November 2009, final
Deformations and damage to buildings adjacent to deep excavations in soft soils
7
3 Literature review
3.1 Introduction Assessing the response of buildings to excavation-induced deformations involves a combination of geotechnical and structural aspects. The first step to take is knowing what kind of effects, such as deformations and stress changes, the excavation imposes on its surroundings in so-called green field conditions. The second important aspect is the building itself. How are buildings influenced by changes in the ground conditions? On both topics, an extensive amount of literature and knowledge about the system is available, of which an overview is given in this chapter. The key question in predicting the reaction of the building to the changing ground conditions is however the interaction between the two aspects. This interaction is the main topic of this research and is generally known to be two-sided: • the soil displacements cause an effect in the building in the form of deformations, strain
and sometimes cracks or other types of damage. • the presence of the building modifies the soil displacements immediately beneath it. The main focus of this research is pictured in Figure 3.1. Figure 3.1 Interaction between excavation and adjacent buildings This literature survey first describes the above mentioned effects: • green field displacements in 2D/3D, caused by deep excavations • building behaviour • soil – foundation - building interaction. The objective of this study is to find a general method to assess excavation induced building damage for typical soft soil (Dutch) conditions and validate this model with the monitoring data from the Amsterdam NoordZuidlijn project. This means some other topics are also relevant, such as: • monitoring techniques of deep excavations and buildings • modelling of deep excavations. Each of these topics is described in this study.
Excavation causes deformations and stress changes
Presence of building modifies soil deformations.

1001307-004-GEO-0002, Version 02, 26 November 2009, final
Deformations and damage to buildings adjacent to deep excavations in soft soils
8
3.2 Deep excavations The first step in the prediction of excavation-induced displacement is to predict the green field displacements. Current prediction models provide an estimate of green field displacements for two or three-dimensional situations. Ground movements related to deep excavations have multiple sources or causes and can be predicted either for all stages overall or per stage of the construction, such as: • Installation of walls and other construction elements, including densification caused by
vibrations • Excavation and subsequent movements of the construction parts • Possible lowering of groundwater levels • Consolidation effects due to all activities mentioned above. Several methods exist to determine these ground movements. Some of these methods include all construction activities, whereas others only describe a specific aspect, so that the different contributions have to be added to a total. The following section presents empirical results for displacements due to the combined effect of all activities, whereas the second section presents data on the displacements caused by the excavation itself. Prediction of effects of installation of walls and ground water lowering are shortly presented in the third section, but will be studied more extensively in the second stage of this research.
3.2.1 Empirical work, all construction activities combined Methods that include all construction activities are, due to the complex nature of the construction, mostly empirical and thus based on experience such as the early work by Peck (1969) and Goldberg (1976). As early as in 1969 Peck (1969) published graphs to estimate settlements caused by excavations, which is based on numerous projects mostly from Chicago around that time. The projects are usually temporary constructions with several wall types, such as Berliner walls and sheet pile walls. His empirical models distinguish between sands, stiff clays and soft clays with increasing settlements. Peck’s model includes all building activities, the stability of the excavation and even consolidation during construction. Peck’s diagrams usually prove to be conservative. Peck’s models relate the settlement of the ground level, normalized by the depth of the excavation (H) to the distance from the excavation, also normalized to its depth. For sand and hard clays, the maximum settlement directly besides the wall is 0-1% H and reaches to a distance of about 2H, depending on the thickness of the clay, the stability of the excavation and the workmanship of the crew. For soft clays, the maximum settlement directly besides the wall is 1-2%H and reaches to a distance of 3 to 4H.

1001307-004-GEO-0002, Version 02, 26 November 2009, final
Deformations and damage to buildings adjacent to deep excavations in soft soils
9
Figure 3.2 Settlements caused by all activities relating to deep excavations in various soils The use of Peck’s model is restricted to excavations in which the supports have been installed at an early depth, because late installation is noted as an important cause of subsequent displacement. The work by Peck was extended by Goldberg (1976) to include more wall types. Goldberg relates the vertical soil movements behind the wall to the horizontal wall deflection and finds a factor of 0.5-2.0. Soil settlements behind the wall are generally less than 0.5% of the excavation depth in sands and stiff clays and over 1 % for soft clays (except pre-stressed diaphragm walls which stay within 0.25%H). These smaller displacements compared to Figure 3.2 are explained by improvements of excavation and support techniques. In soft clays, the settlements are generally well in excess of the horizontal wall displacements, as shown in Figure 3.4. This is attributed to consolidation settlements arising from lowering of ground water levels outside the excavation.

1001307-004-GEO-0002, Version 02, 26 November 2009, final
Deformations and damage to buildings adjacent to deep excavations in soft soils
10
Figure 3.3 wall deflection compared to ground settlements for all soils by (Goldberg, 1976)
Figure 3.4 wall deflection compared to ground settlements for soft soils (Goldberg,1976) In more recent literature several causes of displacements are usually considered separately, with a clear focus on the effect of the excavation, with or without the effect of consolidation.
3.2.2 Empirical work, effect of excavation and installation Clough and O’Rourke (1990) extended the work by Goldberg and Peck, but excluded the cases with unusual construction effects or with late strut installation and with a focus on sheet piles and soldier piles with struts. All presented displacements are caused by excavation and normal installation of construction parts. Clough and O’Rourke focus on the deformation of the wall after installation and excavation. Depending on the presence and number of struts

1001307-004-GEO-0002, Version 02, 26 November 2009, final
Deformations and damage to buildings adjacent to deep excavations in soft soils
11
the shape of the wall is attributed to cantilever or deep movement deformation, as can be seen in Figure 3.5.
Figure 3.5 Typical profiles of movement for braced and tied-back walls (Clough and O’Rourke, 1990) In stiff clays, residual soils and sands the maximum horizontal wall deflection tends to average about 0.2% of the excavation depth with a maximum soil settlement behind the wall of about 0.15% - 0,3% of the excavation depth. The zone of influence reaches to a distance of 3 times the excavation depth. The design graphs, as shown in Figure 3.6, include the type of the wall, although this proved to be not very important in these cases.
Figure 3.6 Observed maximum wall deflection and settlements for stiff clays, residual soils and sands (Clough and
O’Rourke, 1990) In soft clay (Figure 3.7) the data show a significant influence of the wall stiffness and support spacing on the wall deflection and generally the same maximum deformations as observed by Peck (1969). The surface settlement profile from the edge of the excavation shows that the maximum settlement occurs in a zone up to 0.75 times the excavation depth from the wall. The settlement decreases linearly to zero at a distance of twice the excavation depth.

1001307-004-GEO-0002, Version 02, 26 November 2009, final
Deformations and damage to buildings adjacent to deep excavations in soft soils
12
Figure 3.7 Measured settlements adjacent to excavations in soft to medium clay (Clough and O’Rourke, 1990) For design purpose Clough and O’Rourke (1990) recommended dimensionless settlement envelopes for estimating the distribution of ground settlement adjacent to excavations in different soil conditions, see Figure 3.8.

1001307-004-GEO-0002, Version 02, 26 November 2009, final
Deformations and damage to buildings adjacent to deep excavations in soft soils
13
Figure 3.8 Dimensionless envelopes of settlement profile for estimating settlement adjacent to excavations in different soil
types (Clough and O’Rourke, 1990) Another dataset was collected by Bentler (1998), consisting of 41 deep excavations presented between 1989 and 1998. His results comply well with later review by Long (2001). The maximum horizontal wall deflection for excavations in sand or hard clays are 0.19% H and for soft –stiff clays 0.45% H. Vertical deformations tend to average in similar ranges, being 0.22% H in sands/hard clays and 0.55%H in soft-stiff clays. In the early 21st century the amount of data available to present in design charts grew steadily, especially as a result of an extensive survey presented by Long (2001) and later extended by Moormann and Moormann (2002) to over 500 cases. For excavations in stiff clay, the average maximum wall deflection is 0.16-0.19% H (with H is the excavation depth) and the average maximum vertical settlement is 0.12-0.20% H (Long, 2001). For excavations with struts in soft clay, the average maximum wall deflection is 0.39% H with an average maximum vertical settlement of 0.50% H when there is a high factor of safety against basal heave or about double that amount for lower factors of safety. For top-down construction similar values have been found, which surprisingly tend to the upper bound of the results, possibly because the roof will shrink somewhat during stiffening and can not be prestressed. The extended database by Moormann and Moormann (2002) concentrates on excavations in soft soils (cu<75 kPa) and consists merely of cases collected between 1991 and 2001. The new data is plotted on the chart by Peck (1969) to show that displacements are generally much smaller than Peck’s cases, but with some large displacements in cases with soft soils

1001307-004-GEO-0002, Version 02, 26 November 2009, final
Deformations and damage to buildings adjacent to deep excavations in soft soils
14
and low factor of safety against basal heave. It is concluded from these data that technological developments and increase in stiffness of retaining systems did not reduce the wall deflection measured. The maximum wall deflection averages to 0.87% H for soft clays, with a rather large spread around it. Maximum vertical soil displacements tend to be 50%-200% of the horizontal deflection, with an average for soft clays of 1.1%H and occur within a distance smaller than 0.5H. Soil displacements tend to become zero at 2H, which is similar to results presented by Peck (1969). .
Figure 3.9 Horizontal displacement as a function of excavation depth (Moormann and Moormann, 2002).
Figure 3.10 Horizontal versus vertical displacement (Moormann and Moormann, 2002).

1001307-004-GEO-0002, Version 02, 26 November 2009, final
Deformations and damage to buildings adjacent to deep excavations in soft soils
15
Figure 3.11 Moormanns database results plotted against settlement zones by Peck (1969)
(Moormann and Moormann, 2002). According to Moormann and Moormann (2002) there does not seem to be a relationship between the maximum horizontal deflection and the support spacing, although theoretically there should be one. The influence of the retaining wall stiffness could not be found as well, although in contrast to Long (2001) top-down constructions seem to induce smaller movements. Konstantakos (2008) introduces a database of 39 deep excavation projects from the United States of America. Most cases involve diaphragm walls and excavation depths range from 6 to 31 m in rather soft soils with high ground water tables. Konstantakos (2008) groups the data in four different types of excavations: A strutted excavations B anchor supported keyed wall excavations C floating wall excavations D top/down constructed excavations. A large portion of the strutted walls (either constructed bottom up or top down) deflected less than 0.2%H, which is consistent with Clough and O’Rourke (1990). The average deflection is 0.8%H for the braced walls, including some walls with clearly larger deflections. A large spread in results is found with no obvious reason in most cases. Settlements behind the wall were given for half of the number of cases and averaged about 0.2 – 0.4%H for braced and top-down constructions, which is generally about or a little less than the horizontal deflection of the wall. A relationship is found with the basal stability factor (BS), giving a sharp distinct between BS < 1.8 and BS > 1.8. At BS<1.8 the deflection of the wall was much higher than 0.2%H.
3.2.3 Semi-empirical methods, shape of settlement trough due to excavation
Most literature presented in the first part of this chapter focuses on the maximum deflection and settlement behind the wall. However, especially the shape of the settlement trough is very important when assessing excavation-induced damage to buildings. This shape determines the deformation of the building and thus the strains in its construction. Some of the literature presented above describes the shape of the trough behind the wall based on

1001307-004-GEO-0002, Version 02, 26 November 2009, final
Deformations and damage to buildings adjacent to deep excavations in soft soils
16
empirical data. Other researchers have found, usually based on analytical or Finite Element models, other kinds of shapes for certain situations. Bowles (1988) describes an easy-to-use parabolic shape of the settlement curve, given a certain maximum value at the location of the wall. S (x) = Smax* [(W-x)/W]2 With x is the horizontal distance from the wall S is the settlement at location x Smax is the maximum settlement at the wall W is the settlement trough width, given by Caspe (1966) Wcaspe = (H + Hd)*tan(45- /2), where H is the excavation depth and Hd is the influence depth below the excavation; Hd = 0.5 * excavation width * tan(45+ /2) for soils with > 0 or Hd = B for cohesive soil with =0, where B is the width of the excavation Peck’s Gaussian curve for tunnelling Peck (1969) can also be used for deep excavations, assuming the wall is located at the point of inflection and only deformations in hogging occur. (Lee et al 2007) describes this formula for excavations as: S (x) = Smax* exp[0.5 – 0.5(1+2x/W2)], The Gaussian shape with assumed trough width equal to 2i, with i = half the height of the excavation Lee et al. (2007) compares well with the estimation of the trough width from Bowles (1988). The trough is constructed from the depth of zero moment in the wall at an angle of 45- /2 to the vertical line to the ground surface. Lee et al. (2007) took = 0 for soft clay to construct this line.
Shape of settlement behind wall
-120
-100
-80
-60
-40
-20
00 0,5 1 1,5 2 2,5
distance from wall/excavation depth
S/Sm
ax (%
)
Peck, zone IBowlesGaussian
Figure 3.12 Shape of the settlement trough by Bowles (1988) and Peck (1969) compared Opposed to the fully hogging shapes, usually related to cantilever walls, some researchers have suggested a more complex shape with sagging just behind the wall and hogging a little further away for excavations with more than one level of supports.
1001307-004-GEO-0002, Version 02, 26 November 2009, final
Deformations and damage to buildings adjacent to deep excavations in soft soils
17
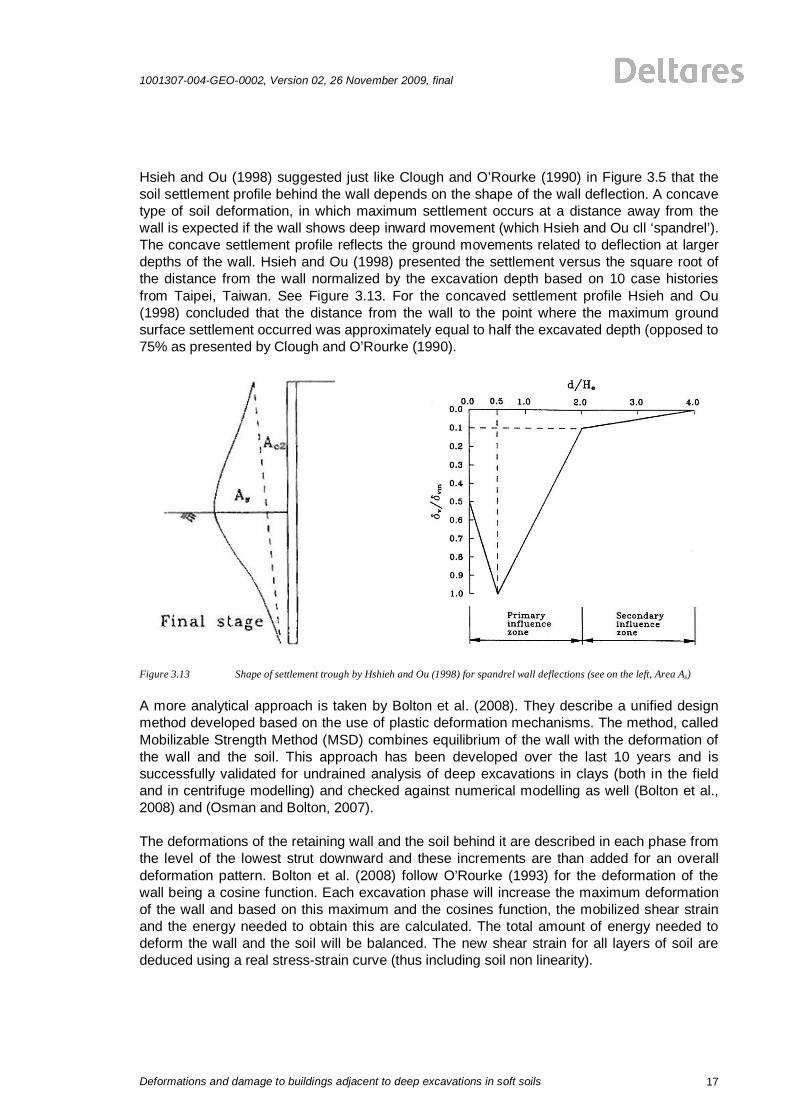
Hsieh and Ou (1998) suggested just like Clough and O’Rourke (1990) in Figure 3.5 that the soil settlement profile behind the wall depends on the shape of the wall deflection. A concave type of soil deformation, in which maximum settlement occurs at a distance away from the wall is expected if the wall shows deep inward movement (which Hsieh and Ou cll ‘spandrel’). The concave settlement profile reflects the ground movements related to deflection at larger depths of the wall. Hsieh and Ou (1998) presented the settlement versus the square root of the distance from the wall normalized by the excavation depth based on 10 case histories from Taipei, Taiwan. See Figure 3.13. For the concaved settlement profile Hsieh and Ou (1998) concluded that the distance from the wall to the point where the maximum ground surface settlement occurred was approximately equal to half the excavated depth (opposed to 75% as presented by Clough and O’Rourke (1990).
Figure 3.13 Shape of settlement trough by Hshieh and Ou (1998) for spandrel wall deflections (see on the left, Area As) A more analytical approach is taken by Bolton et al. (2008). They describe a unified design method developed based on the use of plastic deformation mechanisms. The method, called Mobilizable Strength Method (MSD) combines equilibrium of the wall with the deformation of the wall and the soil. This approach has been developed over the last 10 years and is successfully validated for undrained analysis of deep excavations in clays (both in the field and in centrifuge modelling) and checked against numerical modelling as well (Bolton et al., 2008) and (Osman and Bolton, 2007). The deformations of the retaining wall and the soil behind it are described in each phase from the level of the lowest strut downward and these increments are than added for an overall deformation pattern. Bolton et al. (2008) follow O’Rourke (1993) for the deformation of the wall being a cosine function. Each excavation phase will increase the maximum deformation of the wall and based on this maximum and the cosines function, the mobilized shear strain and the energy needed to obtain this are calculated. The total amount of energy needed to deform the wall and the soil will be balanced. The new shear strain for all layers of soil are deduced using a real stress-strain curve (thus including soil non linearity).

1001307-004-GEO-0002, Version 02, 26 November 2009, final
Deformations and damage to buildings adjacent to deep excavations in soft soils
18
Figure 3.14 Incremental displacement field for narrow excavations (Bolton et al., 2008) The MSD method combines an analytical approach based on equilibrium with an empirical approach for the shape and maximum deformation of the wall (see figure 3.14). It explains why and how there is a relationship between the shape of the wall deflection and the soil deformations and soil strain pattern, as others have shown earlier in this section based on empirical data. The method is still being extended and validated, so an update of this is expected in due time. The method is considered conservative in the sense that the maximum deformation behind the wall is equal to the wall deflection and that stiffness of sand layers is usually assumed equal to the clays that are present. The method is not designed for deep excavations in sands and layered profiles need (for now?) to be simplified to a homogenous profile.
3.2.4 Predicting displacements due to installation of diaphragm walls Stresses in the soil around retaining walls not only change during excavation, but also during installation of the wall itself. These changes may be due to dynamic effects during sheet pile driving or change of horizontal effective stress in case of bored or auger piles and diaphragm walls. These stress changes lead to soil movements. This section gives a short overview of some of the methods available for predicting wall installation effects for diaphragm walls. Clough and O’Rourke (1990) show the amount of settlement found behind a diaphragm wall after installation as a function of the depth of the wall for several types of soil.

1001307-004-GEO-0002, Version 02, 26 November 2009, final
Deformations and damage to buildings adjacent to deep excavations in soft soils
19
Figure 3.15 Settlement due to installation of a diaphragm wall (Clough and O’Rourke, 1990) Soil types include granular soil (Hong Kong, but extremely deep panels, large settlements), soft to medium clay (Studenterlunden Norway), stiff to very hard clay (London, Bell Common, South Cove). The upper bound of the settlement data in Figure 3.15 is largely influenced by the Hong Kong data, which were not fully representative due to problems with ground-water lowering. Clough and O’Rourke (1990) overestimate the ground movements in cases of not too soft clays and good workmanship (which would include panel lengths and slurry levels). Other authors, such as for example Leung and Ng (2007) and Ter Linde (1999) have found that not only the depth of the wall but also the length of the panels, the margin of safety against trench instability (depending on the slurry level) and the amount of time needed for the excavation (open trench) influence the amount of settlement around the diaphragm wall. At the The Hague Tramtunnel measurements were made of installation effects of diaphragm walls, with a wall depth of 30m, a wall thickness of 1.5m and panel widths of 4-5m. Ter Linde (1999) results, presented in figure 3.16, confirm the general trend that with a high factor of safety (1.3-1.5, according to DIN 4126) the amount of deformation (of the building or the soil) can be limited to 5-6 mm at 2-3 m distance.

1001307-004-GEO-0002, Version 02, 26 November 2009, final
Deformations and damage to buildings adjacent to deep excavations in soft soils
20
Distance from wall / panel depth (-)
Settl
emen
t/pan
el d
epth
(%)
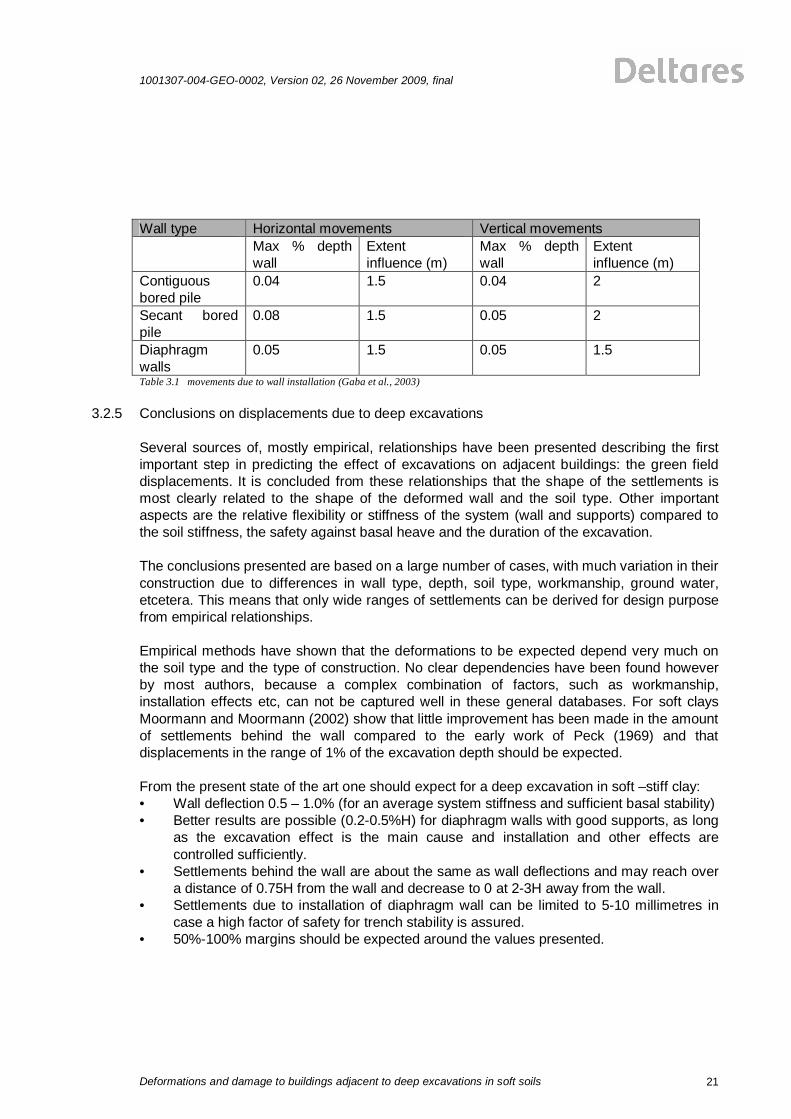
Figure 3.16 Settlement due to installation of a diaphragm wall (Ter Linde 1999) CIRIA report 580 (Gaba et al., 2003) summarizes horizontal and vertical wall movements due to installation of diaphragm walls and bored pile walls in stiff clays (see figure 3.17 and Table 3.1). The results fall between the upper bound by Clough and O’Rourke (1990) and the values by Ter Linde (1999).
Figure 3.17 Vertical deformations due to diaphragm wall installation (Gaba et al. 2003)
1001307-004-GEO-0002, Version 02, 26 November 2009, final
Deformations and damage to buildings adjacent to deep excavations in soft soils
21
Wall type Horizontal movements Vertical movements Max % depth
wall Extent influence (m)
Max % depth wall
Extent influence (m)
Contiguous bored pile
0.04 1.5 0.04 2
Secant bored pile
0.08 1.5 0.05 2
Diaphragm walls
0.05 1.5 0.05 1.5
Table 3.1 movements due to wall installation (Gaba et al., 2003)
3.2.5 Conclusions on displacements due to deep excavations Several sources of, mostly empirical, relationships have been presented describing the first important step in predicting the effect of excavations on adjacent buildings: the green field displacements. It is concluded from these relationships that the shape of the settlements is most clearly related to the shape of the deformed wall and the soil type. Other important aspects are the relative flexibility or stiffness of the system (wall and supports) compared to the soil stiffness, the safety against basal heave and the duration of the excavation. The conclusions presented are based on a large number of cases, with much variation in their construction due to differences in wall type, depth, soil type, workmanship, ground water, etcetera. This means that only wide ranges of settlements can be derived for design purpose from empirical relationships. Empirical methods have shown that the deformations to be expected depend very much on the soil type and the type of construction. No clear dependencies have been found however by most authors, because a complex combination of factors, such as workmanship, installation effects etc, can not be captured well in these general databases. For soft clays Moormann and Moormann (2002) show that little improvement has been made in the amount of settlements behind the wall compared to the early work of Peck (1969) and that displacements in the range of 1% of the excavation depth should be expected. From the present state of the art one should expect for a deep excavation in soft –stiff clay: • Wall deflection 0.5 – 1.0% (for an average system stiffness and sufficient basal stability) • Better results are possible (0.2-0.5%H) for diaphragm walls with good supports, as long
as the excavation effect is the main cause and installation and other effects are controlled sufficiently.
• Settlements behind the wall are about the same as wall deflections and may reach over a distance of 0.75H from the wall and decrease to 0 at 2-3H away from the wall.
• Settlements due to installation of diaphragm wall can be limited to 5-10 millimetres in case a high factor of safety for trench stability is assured.
• 50%-100% margins should be expected around the values presented.

1001307-004-GEO-0002, Version 02, 26 November 2009, final
Deformations and damage to buildings adjacent to deep excavations in soft soils
22
Strain
Size change Foundation movement
Temperature Moisture content
Chemical reactions
Cracking
Other…
3.3 Building behaviour
3.3.1 Introduction This section describes the reaction of buildings to external influences in general and more specifically to excavation induced deformations. Buildings adjacent to excavations usually experience several types of deformations. First some aspects of the buildings itself are listed, followed by details about damage and damage criteria for buildings. Buildings under specific loading can move, deform, tilt, crack or be damaged in any other way depending on their construction type, stiffness, openings and joints. Already during construction, the building deforms under its self-weight. Cracking in buildings can have several, also non-construction related causes. It is most likely caused by size changes of the building and in few cases (although specifically in the case of excavations more commonly) by foundation movements. Size changes are caused by temperature changes, change of moisture content or several other possible causes, such as chemical reactions within the building material itself. Figure 3.18 Several causes of cracking Deformations due to foundation movements cause strain in the building, which will be described later in section 3.3.7. These strains may cause damage to the structure. However, even if we can determine the strain in a building it is still hard to assess what kind of damage will follow from them. The exact material parameters are usually not known and the history of the building and any previous loading are just as important as the stress levels. The relationship between damage and strain level might be known for homogenous, individual (or model) parts of the building, but not for true buildings. Therefore, first some literature about the damage itself is reviewed, before methods to predict damage are further presented.
3.3.2 Causes of damage in buildings When evaluating a damaged building, it is important to distinguish between the different deformation modes related to damage. This section describes the identification of cracks related to deformation of the foundation (such as caused by excavations or tunnelling). Most damage involves cracks; so cracks are the main indicators of damage to a building. Cracks can be caused by external effects, such as temperature/moisture/chemical reactions or by deformations of the building. Bonshor (1996) distinguishes between several types of cracks as shown in Figure 3.19. Cracks that are of uniform width throughout their length are usually temperature or moisture related and unlikely to progress in time (once cracked the stresses have gone and unless bigger temperature changes or moisture changes than before occur, no widening of the cracks is expected). Temperature cracks usually are not larger than

1001307-004-GEO-0002, Version 02, 26 November 2009, final
Deformations and damage to buildings adjacent to deep excavations in soft soils
23
5 mm. Cracks due to changes in moisture content of the soil (e.g. when a tree is removed) will be caused by reversion of the soil to its original volume, leading to a relatively rapid change. Fast changes are usually more damaging than slower changes. Cracks due to deformations of the building have a number of specific characteristics: • Cracks are usually tapered (small at one end and wider at the other). • Cracks are often seen on the inside and the outside of the building. • Cracks continue below and above ground level. • The location and the direction of the crack are directly related to the deformation mode
(hogging, sagging, as discussed in section 3.3.4). Other damage might include broken windows and jamming doors because windows and door openings are distorted, sloping floors and tilting walls (see Figure 3.21 for tilting walls).
BRE (1995) shows how to identify cracks by their nature and divides between tensile cracks, compressive cracks and shear cracks. Compressive cracks often show small flakes of brick squeezed from the surface or localised crushing. Shear cracks (Figure 3.20) show relative movement of points on opposite side of the crack. When the cracks are produced by foundation movement they tend to be concentrated in areas where maximum structural distortion occurs, or at weak points in the structure. Since it is impossible to build a structure without cracks and that economic structures should incorporate a certain amount of cracks (Institution of Structural Engineers 1989), it is to be expected that those cracks (e.g. from self-weight or temperature) may become excessive when other movements are concentrated around them. In the figures 3.19 to 3.21 some examples are given for cracks due to deformations.

1001307-004-GEO-0002, Version 02, 26 November 2009, final
Deformations and damage to buildings adjacent to deep excavations in soft soils
24
Figure 3.19 Crack patterns due to different deformation modes (Bonshor, 1996)
Figure 3.20 Crack due to shear deformation

1001307-004-GEO-0002, Version 02, 26 November 2009, final
Deformations and damage to buildings adjacent to deep excavations in soft soils
25
Figure 3.21 Crack due to relative rotation of one building to the other
3.3.3 Classification of damage The nature of the crack does not say anything about the amount of damage it causes. Classification of damage is usually based on the size and number of visible cracks, but more important also is the effect these cracks have on the appearance or use of the building. This again is related to the necessary amount and ease of repair. BRE (2005) summarizes the amount of damage into three broad categories: • Aesthetic damage comprises damage that affects only the appearance of the property. • Serviceability damage includes cracking and distortion that impair the weather tightness
or other function of the wall (eg sound insulation), fracturing of service pipes and jamming of doors and windows.
• Stability damage is present where there is an unacceptable risk that some part of the structure will collapse unless preventive action is taken.
Burland et al. (1977) refines these broad categories into six categories of damage, numbered 0 to 5 with increasing severity. The classification is based on the ease of repair of visible damage to the building fabric and structure. For most cases, Categories 0, 1 and 2 can be taken to represent ‘aesthetic’ damage, Categories 3 and 4 ‘serviceability’ damage and Category 5 ‘stability’ damage.

1001307-004-GEO-0002, Version 02, 26 November 2009, final
Deformations and damage to buildings adjacent to deep excavations in soft soils
26
Category of damage
Normal degree of severity
Description of typical damage Ease of repair in italic type
0 Negligible Hairline cracks of less than about 0.1 mm 1 Very slight Fine cracks which can be treated easily using
normal decoration. Damage generally restricted to internal wall finishes; Close inspection may reveal some cracks in external brickwork or masonry. Typical crack widths up to 1 mm.
2 Slight Cracks easily filled. Redecoration probably required. Recurrent cracks can be masked by suitable linings. Cracks may be visible externally and some repoin-ting may be required to ensure weather-tightness. Doors and windows may stick slightly. Typical crack widths up to 5 mm.
3 Moderate Cracks which require some opening up and can be patched by a mason. Repointing of external brickwork and possibly a small amount of brickwork to be replaced. Doors and windows sticking. Service pipes may fracture. Weather-tightness often impaired. Typical crack widths 5 -15 mm, or several > 3 mm.
4 Severe Extensive repair work involving breaking-out and replacing sections of walls, especially over doors and windows. Windows and door frames distorted, floor sloping noticeably*. Walls leaning or bulging noticeably*, some loss of bearing in beams. Service pipes disrupted. Typical crack widths 15 - 25 mm, but also depending on the number of cracks.
5 Very severe Structural damage which requires a major repair job, involving partial or complete rebuilding. Beams lose bearing, walls lean badly and require shoring. Windows broken with distortion. Danger of instability. Typical crack widths are greater than 25 mm, but depends on number of cracks.
Table 3.2 Classification of visible damage (Burland, 1977, slightly modified by BRE, 2005) * Local deviation of slope, from the horizontal or vertical, of more than 1/100 will normally be clearly visible. Overall deviations in excess of 1/150 are undesirable. The following points should be noted about this table, according to BRE (2005): • The classification applies only to brick or block work and is not intended to be applied to
reinforced concrete elements. • The classification relates only to visible damage at a given time and not its cause or
possible progression, which should be considered separately. • Great care must be taken to ensure that the classification of damage is not based solely
on crack width since this factor alone can produce a misleading concept of the true scale of the damage. It is the ease of repair of the damage that is the key factor in determining the overall category of damage for the whole building.

1001307-004-GEO-0002, Version 02, 26 November 2009, final
Deformations and damage to buildings adjacent to deep excavations in soft soils
27
It must be emphasized that Table 3.2 relates to visible damage and more stringent criteria may be necessary where damage may lead to corrosion, penetration or leakage of harmful liquids and gases or structural failure. Localized effects, such as the instability of an arch over a doorway, may influence the categorization. Judgement is always required in ascribing an appropriate category to a given situation.
This classification is widely used for building damage assessment due to tunnelling, deep excavations and other causes.
3.3.4 Building response related to excavations Literature about damage due to deformations is usually based on the fact that damage relates to the curvature of the building. More curvature means higher strains and more damage. Buildings subject to soil displacements caused by excavations follow about the same pattern as those caused by tunnelling. The most likely deformation modes are the ‘hogging’ mode and the ‘sagging’ mode, such as described by Burland and Wroth (1974). Hogging is the mode where the sides of the building settle more than the average, whereas in sagging the centrepiece of the building settles most (figure 3.22).
Figure 3.22 Sagging and hogging deformation modes Curvature can be calculated as derivative of the deformation and uses symbol . Similar to curvature the radius R (R=1/ ) is an indicator for possible damage. More curvature means higher strains and more damage. This means that buildings that rotate rather than bend usually experience less damage. Curvature of the building can be specified in more detail into several modes of deformation, such as shear deformation and bending as well as extension or compression. Generally, a combination of deformation modes occurs simultaneously.
3.3.5 Definitions This report will follow the definitions of ground and foundation movements as proposed by El Shafie (2008), which follows up on the work by Burland and Wroth (1974), Boscardin and Cording (1989), Burland (2004) and Mair et al. (1996). See also figure 3.23. Sv Settlement or downward displacement
S Relative settlement or differential settlement (between two points on building)
Rotation between two points on a building or slope of a settlement curve max Relative deflection, the maximum vertical displacement relative to the
straight line connecting two reference points /L Deflection ratio, the maximum deflection over a specific length L of the
building Tilt, rigid body rotation of the entire superstructure Relative rotation or angular distortion, the rotation of the line joining two
reference points, relative to the tilt
hogging
sagging

1001307-004-GEO-0002, Version 02, 26 November 2009, final
Deformations and damage to buildings adjacent to deep excavations in soft soils
28
h = L/L Horizontal strain, sometimes also denoted as lateral strain H Height of the building (usually distance from foundation to the roof)
Figure 3.23 Definitions used in this research as given by El Shafie (2008)
3.3.6 Criteria for damage to buildings Limits for damage to buildings are available in various forms and can be derived either theoretically or from field observations. The simplest limits are given in the form of maximum settlement of the structure or differential settlement; others describe the maximum rotation of the building. One step more advanced could be considered to be the deflection ratio or relative rotation. Calculating strains from the deformation (by using deflection ratio, relative

1001307-004-GEO-0002, Version 02, 26 November 2009, final
Deformations and damage to buildings adjacent to deep excavations in soft soils
29
rotation or any other method such as fully coupled FEM) is currently the state of the art for predicting building damage from expected deformations. The first criteria for assessing building damage were mainly derived for damage due to the self-weight of the building. Later (from Rankin 1988 and onwards) specific attention has been given to the damage caused by construction activities. The first to describe the effect of building damage are Skempton and MacDonald (1956), who describe the criterion of S/l (later defined as relative rotation with l being the distance between two footings or points on a building) to be promising. Direct evidence in 19 cases (taken from 14 buildings) of which 8 experienced damage and indirect evidence in over 35 cases prove that S/l = 1/300 distinctly divides between cracking and non-cracking in wall panels and masonry for mostly industrial buildings. Structural damage in beams or columns can occur from S/l = 1/150. In that study the effect of the geometry of the building (L/H) and any horizontal deformations are not taken into account. The authors do however recognize the importance of excluding tilt from the results, as will be shown in section 3.3.8. Bjerrum (1963) extended Skempton’s work with more levels of serviceability damage based on the relative rotation of the building, as given in Figure 3.24.
Figure 3.24 Damage criteria based on angular distortion by (Bjerrum, 1963) At about the same time, but independently Polshin and Tokar (1957) based their criteria on observations from over 100 buildings in the former Soviet Union, including the effect of the building geometry based on L/H. Results for 10 masonry buildings are presented in Figure 3.25. Based on a theoretical study they use 0.05% as the limiting tensile strain for brick buildings with L/H>3. It should be noted that the length L which is referred to as the distance between two separating joints, and not the necessarily the whole building length.

1001307-004-GEO-0002, Version 02, 26 November 2009, final
Deformations and damage to buildings adjacent to deep excavations in soft soils
30
Figure 3.25 Deflection ratio versus building length/height for 10 brick buildings (extracted from Polshkin and Tokar (1957),
a/b/c describe the theoretical line) Goh (2008) summarized the above-mentioned criteria based on Burland (1977), including the work by Meyerhof (1953) in Table 3.3, mainly for framed buildings. Damage description Limiting relative
rotation Source
Structural damage 1/150 Cracking in walls and partitions 1/300 Safe limit against cracking 1/500
(Skempton and MacDonald, 1956)
Cracking to no infill structures or no danger of damage to cladding
1/200
Cracking to steel and concrete frame infilled structures
1/500
(Polshin and Tokar, 1957)
Cracking in open frames 1/300 Cracking in infilled frames 1/1000 Cracking in load bearing walls or continuous brick cladding
1/2000
(Meyerhof, 1953)
Table 3.3: Empirical criteria of limiting building deformations for frame buildings (modified from Goh, 2008) For unreinforced load bearing walls other criteria are mentioned. It is recommended that deflection ratio /L is used in those cases and that the ratio of L/H plays a more important role. Damage description Limiting /L Source Sagging L/H 3 1/3300-1/2500 Sagging L/H 5 1/2000-1/1400
(Polshin and Tokar 1957)
Sagging 1/2500 (Meyerhof 1953) Table 3.4: Empirical values limiting building deformations for unreinforced load bearing walls
______ Theoretical line x walls with cracks ………. Practical line walls without cracks

1001307-004-GEO-0002, Version 02, 26 November 2009, final
Deformations and damage to buildings adjacent to deep excavations in soft soils
31
The above-mentioned criteria are mainly related to damage due to self-weight of the building and therefore sagging is the main deformation mode. Later criteria specifically relate to damage due to construction activities, such as tunnelling or deep excavations. Based on values used for planning and design purposes Rankin (1988) states that damage in any building experiencing not more than 10 mm of settlement and a maximum slope of any part of the building of 1/500 is unlikely, even for superficial damage. Rankin also give values for moderate and severe damage, but those are not supported by data. Rankin does not include horizontal deformations in the criteria, but does mention them as being important. For construction related damage, the following tables summarize the limiting values of relative rotation and deflection ratio. Damage description Limiting relative
rotation Source
superficial damage unlikely 1/500 (Rankin, 1988) Table 3.5 : Limiting relative rotation for frames Damage description Limiting /L Source hogging L/H = 1 1/5000 hogging L/H = 5 1/2500
(Burland and Wroth, 1975)
Table 3.6: Limiting deflection ratio for unreinforced load bearing walls Buildings are thus more vulnerable in hogging deformation than in sagging as can be seen by comparing the values of Tables 3.3 and 3.4 with those of Tables 3.5 and 3.6. Kerisel (1975) showed that the critical radius for old buildings in hogging is four times bigger than for framed buildings. This is similar to findings by O’Rourke et al. (1976) who found that the limiting value for architectural damage for brick load bearing walls behind excavations is about one third the value proposed by Skempton and MacDonald (1956) for frames. Deflection ratio and relative rotation are used as measure for damage, whereas the cracks themselfs will be caused more directly by the amount of strain in the building. Boscardin and Cording (1989) related the degree of damage to tensile strains from Bjerrum (1963) and Skempton and MacDonald (1956). This work was later updated by Son and Cording (2005).

1001307-004-GEO-0002, Version 02, 26 November 2009, final
Deformations and damage to buildings adjacent to deep excavations in soft soils
32
Category of damage
Normal degree of severity
Approximate crack widths (mm) Limiting tensile strain (%)
(Burland et al 1974)
(Son + Cording 2005)
(Boscarding+Cording 1989), (Burland 1995)
0 negligible <0.1 5,00E-04 5,00E-04
1 very slight 0.1 - 1 7,50E-04 7,50E-04 2 slight 1-5 1,67E-03 1,50E-03
3 moderate to severe
5-15 or several cracks 3 3,33E-03 3,00E-03
4 severe
15-25, depends on number of cracks
5 very severe > 25, or large number
> 3,33E-03
>3,00E-03
Table 3.7 Summary of limiting tensile strains for different damage categories These values are also used by Boone et al. (1999), who shows that a better agreement between the damage and crack width (calculated values according to section 3.3.7, not observed values) was found by increasing the threshold values in the fourth column of table 3.7 by a factor of 1.5. Boone also compiled an overview of physical tests, which show critical strains at the onset of cracks for poor mortar and brick construction as summarised in Table 3.8 (Boone 2001). Test Conditions Mode of Deformation Critical Strain Brick buildings with L/H>3 Tensile from flexure 0.05%
Diagonal-tensile 0.081% to 0.137% Full scale frames with brick in-fill Shear approximation 0.16% to 0.27%
Hollow tile & clinker block, brickwork Shear distortions 0.22% and 0.33% Hollow tile & clinker block, brickwork Diagonal-tensile 0.11% to 0.16% Full scale brick walls with supporting concrete beams, 1.2<L/H<3.0
Tensile from flexure 0.038% to 0.06%
Concrete beams supporting brick walls
Tensile from flexure 0.035%
Fibreboard or plywood on wood frame Shear strain 0.6% to 1.66% Gypsum/fiberboard/plaster on wood frame
Shear strain 0.37% to 0.7%
Structural clay tiles with cement-lime mortar
Shear strain 0.1%
Clay brick with cement-lime mortar Shear strain 0.1% to 0.2% Cement-lime mortared concrete blocks
Shear strain 0.1%
Core samples of brick and mortar Tension 0.001% to 0.01% Full scale brick walls in field test Tension 0.02% to 0.03% Re-evaluation of full scale wall panel tests
Principal tensile 0.02% to 0.03%
Table 3.8: Summary of critical cracking strain data (Boone, 2001)

1001307-004-GEO-0002, Version 02, 26 November 2009, final
Deformations and damage to buildings adjacent to deep excavations in soft soils
33
Zhang and Ng (2005) obtained the limiting tensile strains not from a structural analysis, but by statistically comparing field data about damage with tensile strains. Based on over 200 cases from the databases of Skempton and MacDonald (1956), Grant et al. (1974) and over 100 cases from South-east Asian they distinguish between tolerable and non-tolerable cases, not making it clear what exactly is meant by non-tolerable. Although rather subjective, the state of the buildings that are considered intolerable is described in Table 3.9. Type of structural damage Number
of buildings Architectural issues 13 Cracking in panels 22 Functional issues 14 No cracking in panels 34 Structural damage 20 Tilting 73 Vertical displacement 33 Wall cracking 7 Total 300 buildings Table 3.9 Type of damage considered non-tolerable by (Zhang and Ng, 2005) In Zhang and Ng (2007) a more extensive survey of about 380 cases is presented. Most of the buildings are situated on clay. About half of the structures are frame types, 15% load bearing and a relatively large number unknown types (35%). The buildings are ‘office’ type (40%) or ‘mill’ type (10%, rest unknown) and have either deep (30%) or shallow foundations (50%, rest unknown). In terms of damage category, it seems that this study determines the threshold between category 2 and category 3 as the boundary between tolerable and intolerable, although this is not stated in any of the papers. The first survey by Zhang and Ng (2005) showed that from 95 buildings with settlement data, 37 were considered intolerable. From 205 buildings with data on relative rotation, 124 were considered intolerable, which is about 40% to 60% in total. The authors note that some buildings experienced functional and architectural problems even when relative rotations were smaller than 1/1000. Based on a statistical analysis they find for tolerable cases that the limiting relative rotation is in the range of 0.0025-0.0030 (1/400-1/333) and limiting settlements in the order of 100-130 mm for deep and shallow foundations respectively. The extended survey by Zhang and Ng (2007) with 380 buildings resulted in more scatter in the data. From 221 buildings with settlement data, 75 were considered intolerable. The limiting relative rotation is in the range of 0.002-0.006 (1/500-1/167) and limiting settlements in the order of 100-220 mm for deep and shallow foundations respectively. Especially for shallow foundations, these values are less strict than in Zhang and Ng (2005), but both come with large standard deviations (about as much as the average values).

1001307-004-GEO-0002, Version 02, 26 November 2009, final
Deformations and damage to buildings adjacent to deep excavations in soft soils
34
The authors also compared the characteristics of the buildings and the following conclusions are supported by their data:
• Buildings with deep foundations as opposed to shallow foundations are found to experience damage (being intolerable) at lower values of building settlements (maximum) and relative rotations, as can be seen in Figure 3.25. This effect might be related to the way the decision between tolerable and intolerable is made. Buildings with shallow foundations are more likely to spread the deformation or relative rotation more smoothly than buildings on individual piles, which may lead to lower experienced damage.
• Buildings on clay have larger limiting tolerable vertical displacements compared to those on sand and fill, mainly supported by the slower occurrence of settlements with time. Tolerable settlements for sand tend to be half those for clay, but tolerable relative rotations do not show large differences for clay or sand.
• Given the same vertical displacement, frame structures can accommodate differential displacements by deformation of the beams, whereas load-bearing walls need to bend, which leads to cracking more easily. This leads to a 20-25% lower tolerable relative rotation and settlement for load bearing walls.

1001307-004-GEO-0002, Version 02, 26 November 2009, final
Deformations and damage to buildings adjacent to deep excavations in soft soils
35
Figure 3.26 Tolerable versus intolerable relative rotations for all foundations (a), shallow foundation (b) and deep
foundations (c) according to Zhang and Ng (2005). The method used in these papers is interesting because rather than being derived from a simplified theoretical understanding of the building it relates to visual inspections of buildings, just like the earlier empirical methods for self-weight induced deformations. The results obtained are within reasonable boundaries using the framework of the limiting tensile strains, but might possibly be improved when linked to damage categories as specified by Burland (1977).

1001307-004-GEO-0002, Version 02, 26 November 2009, final
Deformations and damage to buildings adjacent to deep excavations in soft soils
36
3.3.7 Limiting tensile strain method Burland and Wroth (1974) first introduce the concept of limiting tensile strain to translate the effect of ground displacement into strain in the building. The building is seen as a simple beam model. When settlements affect the building (or the beam) direct tensile strains occur due to bending deformation and diagonal strains due to shear deformation, generally both at the same time.
Figure 3.27 Deformation modes (Burland, 1977) and (Burland and Wroth, 1974) With the relationship between the deflection of the beam and the load from Timoshenko (1957), Burland and Wroth introduce a relationship between the deflection and the maximum extreme fibre strain as well as the maximum diagonal strain. The load can be modelled by a central point load or a uniform load. In hogging the neutral axis for bending is assumed at the bottom of the beam or wall and in sagging it remains at mid-height. Table 3.9 gives the solutions for these four cases, based on Burland and Wroth (1974), but altered slightly according to denotations by Mair et al. (1996). Maximum strain (bending) Diagonal strain (shear) Central point load
max23
12 bGE
tLHI
tL
L
max
2
181 dE
GI
HLL
Uniform load max2
3485
bGE
tLHI
HL
L
max
2
1445
21
dEG
IHL
L
Table 3.9 Bending and shear strains from beam model In which:
Is the mid span deflection t
is the distance of the neutral axis to the edge of the beam (which is in a sagging case 0,5H if we assume the neutral axis in the middle, and H for the hogging case if we assume the neutral axis to be at the bottom)
H height of the building from foundation to roof L length in sagging / hogging G shear modulus building

1001307-004-GEO-0002, Version 02, 26 November 2009, final
Deformations and damage to buildings adjacent to deep excavations in soft soils
37
E young's modulus building I is the moment of inertia of the building (H3/12 for sagging and H3/3 in hogging) t Distance to neutral axis = H/2 (sagging), H (hogging) E/G 2.6 for masonry (elastic), 12.5 for frames
h horizontal strain b, max Maximum bending strain d, max Maximum diagonal strain
These equations have formed the basis of work by many other researchers assessing strains in buildings. An important improvement to this method was made by Boscardin and Cording (1989), who added horizontal strains to the bending and shear deformations, because in contrast to the settlement of a building under its own weight, deformations caused by excavation or tunnelling cause horizontal strains as well. In later work Burland, Mair and co-workers extended their framework to include horizontal strain as well. The total bending strain (which is the bending strain due to deflection and lateral extension) is obtained by directly adding the horizontal strain to the strain obtained in Table 3.9 Mair et al. (1996):
hbtotb max, The diagonal strain is more difficult to obtain, because it depends on the angle at which the strains appear. At the maximum angle ( max) with the horizontal the combined strain will be:
max2
maxmaxmax, cossincos2 hdtotd Burland et al. (2004) described this combined diagonal strain using Mohr’s circle of strain
21
21
max,2
22
, hdhtotd
Where is the Poisson’s ratio. Mair et al. (1996) used the same equation but assumed a Poisson’s ratio of 0.3.
5,0max,
22, 65.035.0 dhhtotd
These authors compare the limiting tensile strains with the maximum combination of bending or shear strains and horizontal strain. As stated above, Boscardin and Cording (1989), who were the first who used this combination of horizontal and vertical deformations, based their relationships on angular distortion rather than deflection ratio. Their work was later updated by Son and Cording (2005) to get a lateral strain independent of L/H, E/G and the position of the neutral axis.
maxmaxmax2
)(),( cossincoshltotdp with
)(max )2tan(
hl
Where: is the direction of the crack, measured from a vertical plane p (=d,tot) = principal tensile strain l (=h) = lateral or horizontal strain

1001307-004-GEO-0002, Version 02, 26 November 2009, final
Deformations and damage to buildings adjacent to deep excavations in soft soils
38
Figure 3.28 Relationship between angular distortion and horizontal strain (Boscardin and Cording, 2005) Boscardin and Cording assumed buildings with 6-40 m length, with L/H=1 and an isotropic beam with E/G = 2.6. For L/H>1 figure 3.24 gives conservative boundaries between the damage categories. They also presented results from the National Coal Board which indicates the influence of the length of the building in case horizontal strains govern the deformation, for buildings of 40 m length (Figure 3.29).
Figure 3.29 Length effect due to horizontal ground strain (taken from National Coal Board) The work by Boscardin, Son and Cording focused merely on buildings experiencing shear deformation, which is mainly the case for rather flexible buildings. According to several authors, such as Lee et al. (2007) and CIRIA publications 199, 201 and 316, low rigidity buildings like brick walls (i.e. unreinforced load bearing masonry) are probably governed more in bending than shear. In cases where large openings exist, buildings will behave more flexible, and shear might govern instead. Boone takes a similar approach combining horizontal and vertical deformations and transferring them to a beam model. His concept of the excavation induced deformation to buildings also relates to angular distortion (denoted as v’, not in figure 3.30) as he assumes

1001307-004-GEO-0002, Version 02, 26 November 2009, final
Deformations and damage to buildings adjacent to deep excavations in soft soils
39
a uniformly loaded beam with the neutral axis at the centre (in contrast to Burland and colleagues). He considers critical tensile strains to be the absolute minimum of 0%, because building may have exhibited some initial cracking and those cracks will widen rather than new cracks occurring.
Figure 3.30 Deformation modes (taken from Boone 1996) For bending of the beam, the radius R of the beam is derived from the geometry as well as . The bending strain then becomes (modified from Boone et al. (1999) to match the above described methods) with =L/2R
221
max /88,21tansin
LHLH
b
and hbtotb max, With Poisson’s ratio = 0.5 (Boone et all 1999) the shear strains become
221
max /88,2111tan25.0
LHd
and hdhtotd 25,025,0 max,22
, In Boone’s method the limiting tensile strains (the combination of bending and shear) are individually translated into crack width (C) by multiplying them with a representative strain
length. They are then combined according to: totbtotdprincipal CCC ,2
,2 .
3.3.8 Discussion points limiting tensile strain method Several discussion points remain at present when using the limiting tensile strain method. The most relevant topics are discussed in this section.

1001307-004-GEO-0002, Version 02, 26 November 2009, final
Deformations and damage to buildings adjacent to deep excavations in soft soils
40
1) Isotropic – orthotropic behaviour of buildings Several authors have pointed out that real buildings do not behave like isotropic beams, although most criteria are based on this assumption. This means that the relationship between bending and shear stiffness does not follow E = 2 (1+ )G, usually with =0.3. Burland and Wroth (1974) already showed that buildings are not isotropic. Masonry is orthotropic and a number of factors influence the E/G ratio, such as the number of openings and the L/H value of the influenced (part of the) building. Even a solid masonry wall will have an E/G larger than isotropic, further increasing with the number and size of the openings. E/G = 2.6 for isotropic beams (with =0.3), E/G = 0.5 for masonry buildings in hogging (those are horizontally flexible compared to vertical) E/G = 12.5 for frame buildings (those are horizontally stiff compared to vertical) Son and Cording (2007) show that shear stiffness of a masonry structure is much lower than the bending stiffness, which makes the shear deformation dominant. They refer to Cook (1994) who showed a ratio of bending to shear stiffness (E/G) of 30 for equivalent stiffnesses, which is much higher than the value of 12.5 by Burland and Wroth (1974). 2) Distribution of shear over height and bending of long buildings Netzel (2005) reviews the limiting tensile strain method and suggests some alterations. The first point he shows is the assumption that the shear strain does not vary over the height of the building. Timoshenko and Gere (1972) proved that the distribution of shear over the building height can be taken into account by using a shear factor of 1.2 instead of the usual 1.5. This leads to the new formula: Maximum strain (bending) Diagonal strain (shear) Central point load
max2.1
12 bGE
tLHI
tL
L
max
2
4.141 dE
GI
HLL
Table 3.10 Bending and shear strain according to Timoshenko and Gere (1972) Strains calculated increase with 20-25% due to this alteration. Netzel (2005) also points out that for long structures it is not conservative to disregard building sections that do not experience settlement (or very small settlements), if the building is a homogenous unit. The large L/H and slightly larger deflection ratios cause a significant increase in the calculated strains. Netzel (2005) thus recommends to consider the whole building. This however should only be done if the building forms a homogenous unit, without structural divisions, which tend to behave differently. 3) Use of relative rotation versus deflection ratio Even as early as 1974 discussions started on the use of versus /L (Grant et al 1974) and later returned several times (e.g. Burland et al 2004, Netzel 2005). In the theoretical case of a circular deformation (R is constant), the relationship between and can be derived from =L2/8R and =L/2R this will give:

1001307-004-GEO-0002, Version 02, 26 November 2009, final
Deformations and damage to buildings adjacent to deep excavations in soft soils
41
L4
Burland et al. (2004) showed the relationship varies between 2 and 4, as confirmed by Son and Cording (2005), or more specifically 2(G/E)(L/H) to 4(G/E)(L/H).
Figure 3.31 Relationship between and /L for various L/H and E/G (Burland et al. 2004) Netzel (2005) shows that the translation of “real” situations to elastic beam models may give significant differences in using or /L. It is not possible to describe a Gaussian deformation (sagging in the example in figure 3.32) by the same strain using both methods. The author calculated that bending strains are overestimated when average or maximum relative rotations are used and only correct when deflection ratio or minimum relative rotations are used. For shear strains, the opposite is valid: maximum relative rotations should be used to get a good fit with the ‘actual’ strains. This shows that even for rather ‘smooth’ forms of deformation the comparison between deflection ratio and relative rotation is not always simple and/or consistent.
Figure 3.32 Transformation of “real” situation to elastic beam model (Netzel, 2005) Besides the geometrical differences, there are also physical differences between the two methods. In general shear deformation is better described by relative rotation and bending

1001307-004-GEO-0002, Version 02, 26 November 2009, final
Deformations and damage to buildings adjacent to deep excavations in soft soils
42
deformation is better described by the deflection ratio (e.g. Ward, 1956). CIRIA316 concludes that for normal masonry buildings on shallow spread foundations tunnelling would usually result in shear deformation, thus making relative rotation the appropriate criterion. If, on the other hand bending would occur, this will generally be more damaging. Other arguments in this discussion include the ease of use of the different methods, but there does not seem to be a general opinion on this. 4) Effect of rigid body tilt Rigid body tilt of a building can be included or excluded from the damage assessment. Usually rigid body tilt is considered not to contribute to the stresses and strains in the building and thus not to the damage. However, looking in a more detailed way, tilt causes indirect damage due to gravity forces on structural elements like walls. Leonards (1975) states that for framed structures on isolated footings, tilting contributes to stress and strain in the frame, unless each footing tilts or rotates through the same angle as the overall structure, which is unlikely. Burland et al. (1977) also suggested that accounting for tilt in frame buildings on separate footings might be quite inappropriate. Tilt is also difficult to ascertain unless several aspects of the distortion of the building are known. Measurements of settlements at the top of the building combined with the base could provide an indication of tilt, just as direct tilt measurements. (Skempton and McDonald 1956) give an example of how to include tilt in figure 3.33. A three-dimensional settlement contour of a building is projected, the tilt is considered as the rigid body rotation, in this example case diagonally over the building. In any cross section (perpendicular to the excavation), this overall tilt is subtracted before calculating S/l. This procedure is repeated for the vertical translation. Both tilt and overall translation values are based on the deformations at the edges of the building. Any cross section of the building assessed is corrected for the overall tilt and translation. This approach leads in plane strain deformations to the fact that tilt and translation are the same for each cross section. Tilt is rather easily calculated in plane strain as the connecting line between the outermost points of the building.
Figure 3.33 Building deformation including uniform settlement and tilt (Skempton and McDonald, 1956)

1001307-004-GEO-0002, Version 02, 26 November 2009, final
Deformations and damage to buildings adjacent to deep excavations in soft soils
43
Almost all literature examples exclude the effect of tilt or use the approach as stated by Skempton and McDonald (1956), based on the settlements of the bottom of building. Only Son and Cording (2003) assess tilt from measurements of the top of the building as well. In a row of attached buildings a separation between two tilting bodies would not result in high deflection ratio’s and thus not considered as severe damage, although it might be clearly visible damage that has to be repaired. This all makes tilt an important parameter when discussing excavation induced damage and it should always be made clear exactly in what way tilt is considered.
3.4 Buildings effect on excavation–induced displacements So far, in this study, all excavation–induced displacements considered are green field displacements. These displacements are usually directly projected on the building, leading to bending and shear strains as discussed above. It is however known that the presence of the buildings also influences the settlement trough and the interface between building and soil influences the way the displacements are transferred to the building. This section deals with this interaction problem. The following aspects of the buildings presence are important to take into account: • building stiffness • building weight • interface between building and soil, including type of foundation. Most work on this type of interaction has been done for tunnelling situations, but this hardly affects the outcome for deep excavations.
3.4.1 The effect of building stiffness Potts and Addenbrooke (1997) produced a standard work on the influence of the building on tunnelling induced displacements. They present results of a parametric study in which the width of the structure, its bending and axial stiffness, its position relative to the tunnel and the depth of the tunnel are considered. The study is valid for typical London situations with London Clay present and typical tunnel dimensions and depths. Potts and Addenbrooke introduce relative stiffness parameters, which combine the bending and axial stiffness of the structure with the stiffness of the soil.
Bending stiffness 4HEEI
s
and axial stiffnessHE
EA
s
Where: H is half the width of the beam/building (B/2) E is the stiffness of the building Es is a representative soil stiffness at 0,01% axial strain at half the tunnel depth. Design curves are established for the likely modification to the greenfield settlement trough caused by a surface structure based on deflection ratio (DR) and horizontal strain. MDRsag = DRsag/DRg
sag and MDRhog = DRhog/DRghog

1001307-004-GEO-0002, Version 02, 26 November 2009, final
Deformations and damage to buildings adjacent to deep excavations in soft soils
44
M hc = hcghc and M ht = ht
ght
In which: • M is the ratio between deformation of the building and the green field displacement
(denoted with g). • Sag/hog represent sagging and hogging respectively • hc is the maximum horizontal compressive strain • ht is the tensile strain.
Figure 3.34 Modification factors for effect of building stiffness (upper bound – design values) In their FE-modelling, Potts and Addenbrooke (1997) used the following for modelling buildings and soil displacements in one analysis: • Soil is modelled non-linear based on Jardine et al. (1986) with Mohr coulomb yield
surface, • Soil is considered undrained • The building is modelled as a weightless, elastic beam with the neutral axis at mid-
height, which overestimates the building stiffness. • The interface between soil and building is considered rough. The equivalent thickness (d) and stiffness (E) of the building slab in plane strain are calculated from:
EAEId FE
12 and
FEFE d
EAE
Where I is the second moment of inertia of the building A is the area of the building in plane strain. In case of an n-storey building where the walls and columns transfer the same deformed shape to each storey, an equivalent stiffness can be calculated as:
))(1( AEnEA cstructure and1
2 )(n
nslabslabcstructure HAIEEI
Where Subscript structure denotes that it is the equivalent value for the building Ec is the modulus of the concrete slab of each storey.

1001307-004-GEO-0002, Version 02, 26 November 2009, final
Deformations and damage to buildings adjacent to deep excavations in soft soils
45
Their parametric study also shows the combined effect of axial and bending stiffness. Buildings with high bending stiffness and low axial stiffness still follow the green field settlement. With higher axial stiffness, the modification factor increases. On the other hand, for buildings with very low bending stiffness the maximum settlements are greater than those calculated from the green field, although no building weight is introduced. Buildings with high axial stiffness resist horizontal ground movements the best; the bending stiffness does not influence the horizontal strains.
3.4.2 The effect of building weight, stiffness and interface Franzius et al. (2004) extended the works by Potts and Addenbrooke, by including the effect of building weight. A parametric study in which combinations of building loads and stiffness’s were considered shows that the effect of the building stiffness is small (MDR and M h increased with building load) compared to the decrease of MDR and M h for larger stiffness of the building. Horizontal strains show more dependency of the building load; tensile strains doubled at a load of 100 kPa versus 0 kPa and compressive strains increased by 50%. Franzius et al. (2004) showed that this can be explained by two effects: • the increase in stiffness in the top level reduces the horizontal movement, but • the soil will be more able to transfer the strains to the building, • leaving a net increase in the building strains. Franzius et al. (2006) further extended the work by varying the soil-structure interface and performing 3D analyses. For smooth interfaces, the horizontal strain in the building reduced dramatically, while MDR values showed only a small reduction. The original modification factors also give upper bound values for smooth interfaces. They recommended modifications to the definitions of relative building stiffness’s in order to reduce the scatter in the data and to take 2D and 3D situations into account.
Revised bending stiffnessLBzE
EI
s2
0
*mod and axial stiffness
BLEEA
s
*mod
where B is the width and L is the length of the building and z0 is the depth of the tunnel. Franzius et al. (2006) give new design charts for the modification factors based on the revised relative building stiffness’s and including a variation in interfaces. When horizontal relative movements between the soil and building were allowed in a smooth soil-structure interface, there was a large reduction in M h values whilst the MDR values were less affected. Hence, the upper bound design curves derived based on a rough interface would still be valid. Several cases in the Jubilee Line Extension project have been investigated in this respect. Well known cases include the Treasury building, Elizabeth House and Neptune House (Mair, 2003). Conclusions from these cases are that deflection ratio’s of the buildings are often modified from the green field situations, except for very flexible buildings and that buildings are less stiff in hogging than in sagging. Horizontal deformations are also usually less for buildings than in green field situations, but also here exceptions exist, such as in case of foundations with individual footings. Dimmock and Mair (2008) reviewed cases in Moodkee Street (Neptune House, Murdoch House and Clegg House) and Keatons Estate and found that compared to the original Class A predictions (Mair, 2001) the following adaptions to the modification factors by Potts and Addenbrooke (1997) would improve the results: • base the bending stiffness in hogging on the foundation only

1001307-004-GEO-0002, Version 02, 26 November 2009, final
Deformations and damage to buildings adjacent to deep excavations in soft soils
46
• reduce the calculated bending stiffness in sagging by about one order of magnitude to include the effect of window and door openings.
The bending stiffness in hogging would thus be: EI = Efoundation*bd3/12 Where Efoundation is Econcrete (about 16,500 MPa) or Emasonry (about 10,000 MPa) b is 1 m for plane strain calculations d is the height of the foundation slab, usually about 0.5 – 1.0 m. Franzius et al. (2006) describe a similar modification factor as the one from Potts and Addenbrooke, but for the twist behaviour of buildings, based on their stiffness. This value ranges from 0.05 for 10 storey building to 0.9 for a 1 storey building. This factor increases towards 1.0 for longer lengths or widths of the building. Due to the limited number of analyses, no design charts have been made by the authors or others. This effect was studied in an experimental way by El Shafie (2008), who performed centrifuge tests on model buildings subject to excavation-induced ground displacements, see figure 3.35. The tests included buildings made from micro-concrete with various stiffness’s, weights and with either a rough or smooth interface. The objective of the research was to compare the building deformation to the green field deformation to validate the soil-structure interaction effects as described above. His conclusions were: • The effect of building stiffness influencing the deformation was confirmed; larger
curvature of the building is found with decreasing bending stiffness, especially for a rough soil/building interface. All buildings followed the vertical displacement of the soil surface, but NOT the horizontal displacements. Slip between the buildings and the soil surface was found and the horizontal deformation of the soil surface is significantly affected by the axial stiffness of the blocks.
• The effect of building weight (up to 40 kPa) was small (maximum about 10% increase in deflection ratio) as long as a high factor of stability (> 1.4) of the wall was maintained.
• The effect of the interface between the soil and the building is found for buildings with low bending stiffness. Stiff buildings tend to tilt regardless of the interface. Horizontal displacements are clearly influenced by a smooth interface, leaving the green field soil displacements intact, even for higher axial stiffness. Slip between building and soil occurred. Rough interfaces restrained the horizontal movements of the building.
• Buildings with individual spread footings experience large differential settlements, because footings outside the zone of influence do not follow the influenced part of the building. This results in significant distortions and tensile strains concentrating at the weak parts of the buildings.
The modification factors found in the centrifuge were confirmed by FEM and are shown in figures 3.36 and 3.37 for deflection ratio and horizontal strain respectively.

1001307-004-GEO-0002, Version 02, 26 November 2009, final
Deformations and damage to buildings adjacent to deep excavations in soft soils
47
Figure 3.35: Buildings and interfaces used in centrifuge tests (El Shafie, 2008)
Figure 3.36 Modification factors for deflection ratio from FEM and centrifuge tests (El Shafie, 2008)

1001307-004-GEO-0002, Version 02, 26 November 2009, final
Deformations and damage to buildings adjacent to deep excavations in soft soils
48
Figure 3.37 Modification factors for horizontal strain from FEM and centrifuge tests (El Shafie, 2008)
3.4.3 The response of piled foundations near deep excavations The behaviour and capacity of piles under loading is governed by complex mechanisms such as: • Installation effects which cause very high strain levels and plasticity • Skin friction, which can be both negative and positive and changing under external
loading • Bearing capacity and stress distribution around the pile tip. These effects lead to changes in stresses behind the deep excavation (see figure 3.38). Also due to these excavation-induced changes, the interface between the pile and the soil changes. For pile foundations behind excavations, it is important to understand the stress changes behind the excavation. Figure 3.38 Active zone behind the wall
Active zone
45 + /2

1001307-004-GEO-0002, Version 02, 26 November 2009, final
Deformations and damage to buildings adjacent to deep excavations in soft soils
49
Figure 3.39 Stress path in active zone of deep excavation with diaphragm wall (Puller, 2003) This means that the soil around the piles is subject to vertical settlements and horizontal displacements, similar to the ground surface. In stress terms the vertical and horizontal stresses around the pile decrease. Outside the active zone (see figure 3.38), the stresses are assumed to remain constant. For end bearing piles which settle less than the surrounding soil, negative skin friction may develop. In a case study by Brassinga & van Tol (1991) this mechanism is found in a piled high rise building next to a deep excavation in Rotterdam. They assumed that the wooden foundation piles would not resist horizontal ground movements. Vertical settlements occurred due to an increase in negative skin friction. The settlement of the piles followed the deformation of the soil at the neutral point along the pile shaft (where negative and positive skin friction meet). Since very few papers describe the response of pile foundations due to excavations, an overview is given of the developments in the field of the response of pile foundations to tunnelling in the following paragraph. The following similarities and differences between the effects due to tunnelling and those due to deep excavations are fundamental: • The general movement of the pile towards the tunnel or excavation and downwards is
similar • For piles with their tip below the mid height of the tunnel, the settlements reverse to
heave, which is not the case for deep excavations • The 3D effect for a passing TBM with grout pressures is not present at deep
excavations, but other 3D effects such as due to corners or the limited size of the building could still be significant.
• Installation effects of retaining walls present extra changes of stress in case of deep excavations (unloading in case of excavation for diaphragm wall or bored piles, loading due to concrete pressures or densification due to vibrations).

1001307-004-GEO-0002, Version 02, 26 November 2009, final
Deformations and damage to buildings adjacent to deep excavations in soft soils
50
These effects have to be taking into account when combining the knowledge of pile response to tunnelling and deep excavations.
3.4.4 The response of piled foundations due to tunnelling For piles subjected to tunnelling, Selemetas (2004) compared the results of a field test by Kaalberg et al. (2006) and centrifuge modelling by Jacobsz (2002) and Bezuijen and Van der Schrier (1994). By comparing the pile head settlement with the settlement of the ground level the Differential Pile Settlement (DPS) is found. From the tests by Jacobsz (2002) it is found that piles directly above the tunnel settle more than the surface, whereas piles just next to the tunnel (at an angle of maximum 45 degrees from mid-tunnel) settle about the same as the surface. Piles outside the line of 45 degrees from mid tunnel do not settle at all (or at least significantly less than the green field, see Kaalberg et al. (2005). The setting piles experience a reduction in base load and in some cases the shear stress and thus the shaft friction increases. This is due to larger horizontal stresses than at rest found besides the excavated tunnel, which cause an increase in shear stress and shaft capacity. Also the normal stresses increase due to the dilation of the soil-pile interface (Jacobsz, 2002).
Figure 3.40 Pile toe influence zones (Kaalberg et al., 2005) From centrifuge tests at GeoDelft (Deltares) (CUR, 1995) similar results have been found. The pile capacity has been reduced in the zones of influence (A and B). See figure 3.40. Kaalberg et al. (2005) describes the results of an extensive program in the Netherlands to find the influence of tunnelling on piles, for which measurements and a field test where performed at the Second Heinenoordtunnel. They showed that deformation of piles due to tunnelling consists of two phenomena, which have to be added together to find the final deformation: • Settlement of the soil layer around the pile toe and • Settlement caused by stress relief around the pile toe. 3D FEM analysis showed that stress relief would be negligible for piles within one diameter from the tunnel (confirmed in the field test) or even 0.25 D (based on FEM only). None of the piles in the first passage of the tunnel settled more than the green field, but during the second passage (with relatively smaller displacements in total) the piles close to the tunnel settled in excess of the ground displacements. CPT tests and static load tests performed before and after tunnelling showed no significant changes and pile capacities before and after match, which indicates that no significant stress relief occurs. Kaalberg et al. (2005) concludes that the zone of influence as described by Jacobsz (2002) to range from 0

1001307-004-GEO-0002, Version 02, 26 November 2009, final
Deformations and damage to buildings adjacent to deep excavations in soft soils
51
tot 45 degrees from mid tunnel, actually occurred only between 30 and 45 degrees from mid-tunnel. This difference is however not important when the results are translated for deep excavations, because the zones have to be redefined in those circumstances. Time depended settlements of the piles and surface are about 15% of the settlements immediately after passage of the TBM. Jacobsz et al. (2005) concludes, based on two other case studies, that a difference is found between end bearing and friction piles. End bearing piles follow the green field settlement at the pile base for small volume losses. Friction piles alter the green field subsurface displacements and follow more or less the surface settlements as a conservative approach. These conclusions are based on the results of three cases in the Channel Tunnel Rail Link project. At the Renwick Road bridge end bearing driven piles are located with their base above the tunnel. It was assumed that the pile displacements would be governed by the movement of the soil at base level. During the driving of the first tunnel, the surface settlement (at 2m offset of the tunnel-axis) was 5.5 mm. The bridge abutment settled 7 mm, which was equal to the green field settlement predicted at base level. During passage of the second tunnel the pier settlement (piles) was just a few millimetre less than the surface settlement.
Figure 3.41 Renwick Road bridge (left) and Ripple Road Flyover (right) At the Ripple Road Flyover the piles extended to 25 m below surface, which was only 1 m below the base of the deepest pile. To reinforce the piles, additional grouting took place, securing the foundation to carry on the top clay layer as well. The prediction as well as the measurements showed that the piles settled the same as the surface (but less than at base level!). At the third location, the A406 viaduct, 23.5m long friction piles support the viaduct while the tunnel is constructed 4 m below the pile base. It was predicted that the piles would act as slender elastic members with the soil. Vertical and horizontal movement along the shaft was calculated and converted to strains in the piles. The measurements showed that the piles settled about the same as the surface. Chen et al. (1999) calculated the pile response due to tunnels (see Figure 3.42) analytically using PALLAS and PIES, two programs developed in Australia. It separately discusses lateral and vertical effects. The lateral response of the pile is calculated by the PALLAS program, based on elastic soil and an elastic beam. Plastic behaviour can be simulated by a maximum pile-soil interaction stress. The axial response is calculated by the program PIES, based on the pile being simplified as an elastic column and the soil as elastic continuum. Slip at the interface pile-soil is possible.

1001307-004-GEO-0002, Version 02, 26 November 2009, final
Deformations and damage to buildings adjacent to deep excavations in soft soils
52
For piles extending below the tunnel depth the lateral deflection of the piles is similar to the soil displacement (Young’s modulus soil 24 Mpa, pile diameter 0.5 m, Young’s modulus pile 30 GPa, piles behave flexible). Significant bending moments occur just above the tunnel axis and the settlement of the piles is uniform along the shaft. Shorter piles experience less bending, but vertical head settlements of the piles do not change much with pile length.
Figure 3.42 Typical geometry of study (Chen et al. 1999 A coupled analysis is performed by Xu and Poulos (2001) using the GEPAN program. In this analysis, the soil is assumed to be an ideal homogeneous isotropic elastic weightless half space. The behaviour of the pile in axial and lateral loading are influenced by the ratio between pile and soil stiffness represented by the youngs moduli and the dimensionless ratio of (EpIp)/(Es/L4) respectively. Ep and Ip are the piles Youngs modulus and the moment of inertia of the pile, Es is the soil’s Youngs modulus and L is the length of the pile. The results seem to represent the 3D behaviour better than the uncoupled analysis, but no calculations of tunnels or excavations were given with this program. Three dimensional finite element modelling is becoming more common in literature. One example is from Mroueh & Sharour (2002), who compared their FEM results with simpler analytical models. The model used is a fully elasto –plastic (Mohr-Coulomb), with simulation of the initial pile loading and the tunnelling process by excavation and activation of the lining. The youngs modulus of the soil is 35 Mpa and for the pile it is 23.5 GPa with 1mx1m cross section. The pile deflection is slightly less than the lateral soil deformation in conditions without the piles present, see Figure 3.43. This means that there could be a stiffening effect, reducing the soil deformations when the piles are present or that the pile stiffness plays a role. The authors also studied the effect of a pile group as shown in Figure 3.44, resulting in a 60% reduction of the maximum axial force in the rear piles and 45% reduction in the bending moment compared to the single piles. The front row of piles experience 20% lower axial forces, but no benefit for the bending moment compared to the single pile. They did not find a difference between ‘free-headed’ or capped pile groups.

1001307-004-GEO-0002, Version 02, 26 November 2009, final
Deformations and damage to buildings adjacent to deep excavations in soft soils
53
Figure 3.43 Lateral displacement of pile compared to soil with depth (Mroueh & Sharour 2002)
Figure 3.44 Comparing single pile with pile group results (Mroueh & Sharour 2002) Several questions remain when studying the effect of tunnels on piled foundations, such as the effect of the installation of the piles and the three dimensional effects around the piles (most analyses are two-dimensional only). It is also not clear to what extent the presence of the piles will strengthen the soil. The results also need to be adapted for the effect of deep excavations on piled foundations.

1001307-004-GEO-0002, Version 02, 26 November 2009, final
Deformations and damage to buildings adjacent to deep excavations in soft soils
54
3.4.5 Damage assessment procedures Several authors emphasize the importance of a staged approach for damage assessment due to excavation and/or tunnelling. The main goal of these procedures is to work from simple, conservative approaches to more detailed and specific procedures, to limit the amount of analysis necessary. Two procedures are shown in this section, which can be altered and extended in several ways. Mair et al. (1996) describe the state of the art procedure for a damage assessment in the following steps, each relating to the methods described earlier in this study: 1) Preliminary assessment: In the preliminary assessment, the extent of contours of ground surface settlement induced by the tunnelling or excavation activities are drawn. All buildings outside these contours can be eliminated in this first stage. The contours are usually a maximum settlement of 10mm and a slope not exceeding 1:500 by (Rankin, 1988). 2) Second stage assessment: the limiting tensile strain induced in the building is calculated according to the following steps: project the green field ground displacements on the building (hogging, sagging) determine the strains in building, using an elastic beam model classify damage related to strain levels (negligible, very slight, slight, moderate, severe, very severe according to BRE (2005) This approach assumes that the building has no stiffness but conforms to the greenfield settlement profile, which is conservative as shown by Potts and Addenbrooke (1997). Buildings assessed to have negligible damage, very slight damage or slight damage are eliminated from the assessment at this stage. 3) Detailed evaluation: for buildings assessed being at risk (category 3 damage or greater), a detailed evaluation should be undertaken. This could include details of the construction method and structural aspects of the building and/or soil-structure interaction effects. If after this detailed evaluation the predicted damage is still not acceptable, protective measures will be needed. Son and Cording (2005) assume the same steps and put them in a scheme, as shown in Figure 3.45.
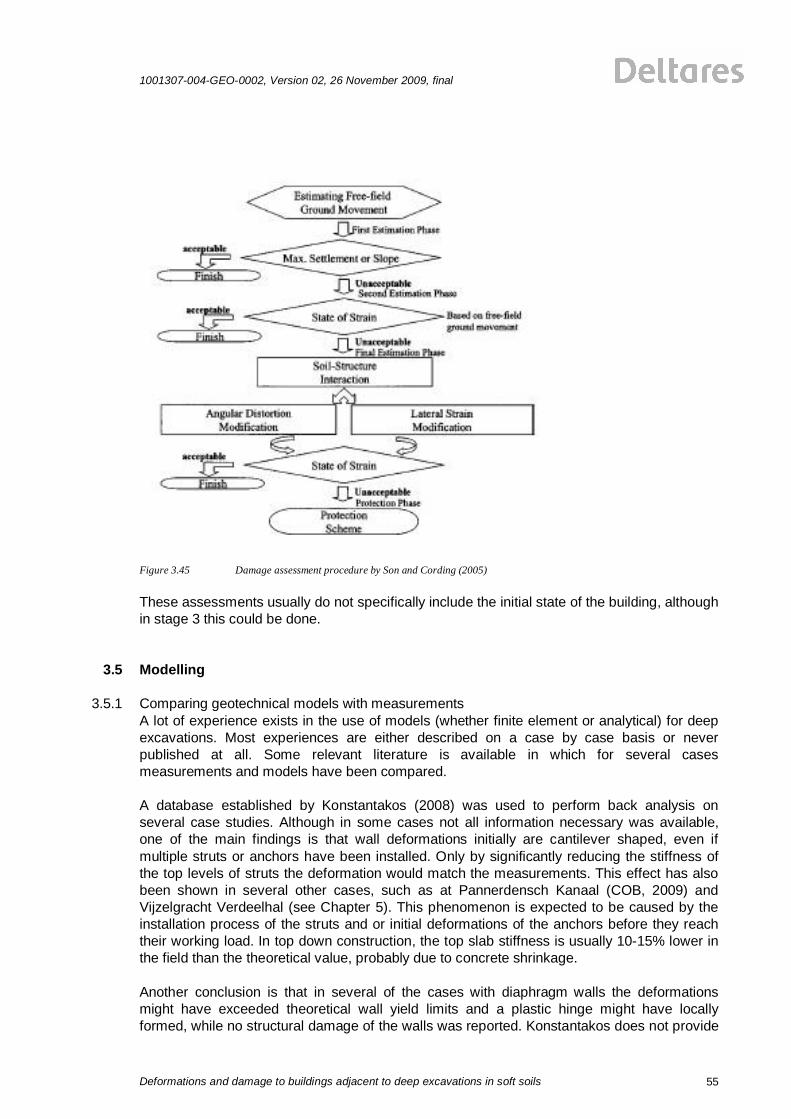
1001307-004-GEO-0002, Version 02, 26 November 2009, final
Deformations and damage to buildings adjacent to deep excavations in soft soils
55
Figure 3.45 Damage assessment procedure by Son and Cording (2005) These assessments usually do not specifically include the initial state of the building, although in stage 3 this could be done.
3.5 Modelling
3.5.1 Comparing geotechnical models with measurements A lot of experience exists in the use of models (whether finite element or analytical) for deep excavations. Most experiences are either described on a case by case basis or never published at all. Some relevant literature is available in which for several cases measurements and models have been compared. A database established by Konstantakos (2008) was used to perform back analysis on several case studies. Although in some cases not all information necessary was available, one of the main findings is that wall deformations initially are cantilever shaped, even if multiple struts or anchors have been installed. Only by significantly reducing the stiffness of the top levels of struts the deformation would match the measurements. This effect has also been shown in several other cases, such as at Pannerdensch Kanaal (COB, 2009) and Vijzelgracht Verdeelhal (see Chapter 5). This phenomenon is expected to be caused by the installation process of the struts and or initial deformations of the anchors before they reach their working load. In top down construction, the top slab stiffness is usually 10-15% lower in the field than the theoretical value, probably due to concrete shrinkage. Another conclusion is that in several of the cases with diaphragm walls the deformations might have exceeded theoretical wall yield limits and a plastic hinge might have locally formed, while no structural damage of the walls was reported. Konstantakos does not provide

1001307-004-GEO-0002, Version 02, 26 November 2009, final
Deformations and damage to buildings adjacent to deep excavations in soft soils
56
a possible explanation for it, but it might be that diaphragm walls after first hairline cracks are more flexible and capable of redistributing the moments. The French MOMIS database (Mestat et al., 2004) compares model results with measurements in order to estimate the performance of the models and generate recommendations for future applications. Its applications include embankments, underground structures and shallow foundations. For sheet pile walls a total number of 77 projects with wall deflections were available and 38 for settlements behind the wall at the time of publication. Projects were located in Europe (over 50%), followed by Asia, North America, Africa and then South America. Wall lengths range from 15-30 m and excavation depths from 5-20 m. Figure 3.46 shows the wall deflection measurements compared to the modelled ones and Figure 3.47 similar comparison for the displacements behind the wall.
Figure 3.46 Comparison of wall deflections from MOMIS (squares are Class A predictions) (Mestat et al., 2004)

1001307-004-GEO-0002, Version 02, 26 November 2009, final
Deformations and damage to buildings adjacent to deep excavations in soft soils
57
Figure 3.47 Comparison of ground displacements from MOMIS (squares are Class A predictions) (Mestat et al., 2004) Overall wall deflections measured fall within a margin of 25% from the calculated ones (for 54% of the total) or within 50% (for 75% of the total). Settlements behind the wall are usually underpredicted. Calculations have been made with several types of soil models. A large number (almost 30%) uses elastic or non-linear elastic models. Almost 50% uses elasto-plastic models without strain hardening and the remaining 20% including strain hardening. More in-depth analysis of these comparisons for the different types of models and/or soil types however have not been published. The cases with diaphragm wall deflections (98) give similar results, although the absolute values are smaller. Displacements behind the wall are generally more consistent with calculated ones than for sheet piles. This is shown in figures 3.48 and 3.49 from (Mestat et al., 2005).
Figure 3.48 Comparison of wall deflections from MOMIS for diaphragm walls (Mestat et al., 2005)

1001307-004-GEO-0002, Version 02, 26 November 2009, final
Deformations and damage to buildings adjacent to deep excavations in soft soils
58
Figure 3.49 Comparison of ground displacements from MOMIS for diaphragm walls (Mestat et al., 2005) The settlement behind the wall in general is smaller than the maximum deflection, but can also be much larger (up to a factor of 2 for sheet piles and 2.5 for diaphragm walls). See figure 3.50.
Figure 3.50 Comparison of maximum Settlement over Wall Deflection from MOMIS (Mestat et al., 2005)

1001307-004-GEO-0002, Version 02, 26 November 2009, final
Deformations and damage to buildings adjacent to deep excavations in soft soils
59
3.5.2 3D or corner effects Excavations are usually not perfectly plane strain and so three-dimensional effects can influence the amount and shape of the settlement curves behind the wall and numerous structural aspects such as strut loading as well. Three-dimensional effects usually focus on corners in the construction, which can be either outward facing (ordinary corner of a box) or inward (in irregularly shaped excavations). The shape of the excavation will affect the magnitude and distribution of ground movements around it. Corners in the excavation tend to restrict movement (if they are outside corners) or increase movements (inside corners). Some FEM analysis can be performed in 2D as well as 3D, giving insight to this problem. Since it is not common to perform a full 3D analysis including all construction activities and advanced soil models, several authors have developed ratios between 2D and 3D situations, which can be used for preliminary design. Linear elastic comparisons show horizontal movements can be reduced by about 50% in axi-symmetric calculations compared to a plain strain situation (St John, 1975). A case study in London (Richards et al., 1999) indicate a 40% reduction within one horizontal distance from the corner equal to the excavation depth compared to plain strain conditions. More recently several surveys have been done with 3DFEM, such as Ou et al. (1996) and Zdravkovic et al. (2005). Some authors have shown measurements in excavations with typical 3D effects. Finno (2007) describes one of those cases, which is reviewed in more detail in chapter 4. It is even more complicated relating corner effects to the settlement response of building adjacent to support walls. Although settlements can be derived from lateral wall movements, there are several complicating factors when applying the lateral deformation results directly to building responses at corners of excavations. These factors include building type and configuration, and building orientation with respect to the excavation, depth of excavation, and extent of excavation. Additional research that considers these factors is required.
3.5.3 Coupled models When predicting the reaction of buildings to excavation or tunnelling the analysis can be either coupled or uncoupled. In a coupled analysis the soil, the building and the excavation process are modelled in one continuous mechanical model. These kind of models however are still complicated in their use and limited in their capabilities to incorporate advanced material models for both soil and building. Usually only one of the two is advanced and the other is much more simplified. Several attempts have been made recently to expand the use of coupled analysis, such as by Boonpichetvong et al. (2004) and others. In geotechnical applications of coupled analysis, usually the building is schematized as a simple elastic beam. For masonry none or very little tensile strains are allowed and also for concrete maximum tensile strains are kept very small. Boonpichetvong et al. (2005) describes a coupled numerical analysis of a soil-foundation-building interaction for a tunnelling situation. The 2D model assumes linear elastic soil behaviour but non-linear building behaviour.

1001307-004-GEO-0002, Version 02, 26 November 2009, final
Deformations and damage to buildings adjacent to deep excavations in soft soils
60
3.6 Monitoring Geotechnical instrumentation during construction may provide large benefits in dealing with the uncertainties and risk related to it. Dunnicliff (1993) provides a detailed discussion on the reasons to perform certain monitoring tasks and the way to do it. His rational approach includes 12 steps to implement instrumentation, starting with definition of the project conditions and purpose of the instrumentation, via assignment of tasks and responsibilities to selection, preparation and installation of instruments. Marr (2001) updates the reasons given by Dunnicliff and extends the monitoring to the quantification of risks. His main conclusion is that monitoring without reason serves no purpose but a good instrumentation program may save lives, save money and reduce risk. The main reasons to perform monitoring described by Marr are: • Indicate impending failure • Provide a warning • Reveal unknowns • Evaluate critical design assumptions • Assess contractors’ means and methods • Minimize damage to adjacent structures • Control construction • Control operations • Provide data to help select remedial methods and fix problems • Document performance for assessing damages • Inform stakeholders • Satisfy regulators • Reduce litigation • Advance state-of-knowledge. Bles and Korff (2007) and Bles et al. (2009) describe a structured scheme to design an adequate monitoring plan based on risks from a risk analysis for deep excavations. The following steps are introduced to obtain an adequate monitoring plan: Step A scope; demarcation in space and time Step B objectives; see Marr (2001) and Dunnicliff (1993) Step C risk analysis; includes a go / no-go decision, is the risk to be monitored critical (big enough) and is monitoring the best option in order to manage the risk? Step D, parameters; combine risks with (sensitive) parameters Step E, demands; signal and limit values, locations, sensitivity, range and frequency Step F, instruments; types of instruments for specific goals Step G, monitoring strategy; what, why, where, when, how en how much is monitored for better understanding of the necessity of the measurements. Step H, influence from surroundings; assess possible disturbance of the measurements. Step I, planning of operations; zero measurements, timing, format, processing, end measurements etcetera Step J, planning maintenance; planning of necessary calibration and maintenance. Step K, measures; measures to be taken when signal and limit values are exceeded Step L, dismantling; when, who and how for dismantling of the monitoring system Step M, communication; maximum time span between measurement, processing and taking measures, responsibilities for all parties. In Step F the instruments are chosen fit for purpose. This also include the accuracy of the systems. Measurement techniques frequently used for tunnel or excavation induced deformation are given in Table 3.11 by Standing et al. (2001) with their practical accuracies.

1001307-004-GEO-0002, Version 02, 26 November 2009, final
Deformations and damage to buildings adjacent to deep excavations in soft soils
61
Instrument Resolution Precision Accuracy Precise level (NA 3003) 0.01 mm 0.1 mm 0.2 mm Total station (TC 2002) Vertical Horizontal Angular displacement
mm mm 0.1 arc sec
0.5 mm 1 mm 2 arc sec
0.5mm 1 mm 5 arc sec
Photogrammetry 1 mm 1 mm 2 mm Tape extensometer 0.01 mm 0.03 mm 0.2 mm Demec gauge 0.001 mm 0.01 mm 0.01 mm Rod extensometer 0.001 mm 0.01 mm 0.2 mm Electrolevel 2 arcsec 10 arcsec 10 arcsec Table 3.11 Measurement techniques and their accuracies For crack monitoring, Bonshor (1996) gives several options. The most accurate method involves three screws, positioned with a right angle over the crack, which are accurately measured with a precise calliper. Less accurate alternatives include: • Demec points (discs fixed on each side of the crack, limited range of movement) • Direct measurements with a steel rule or magnifier across the crack. • Glass tell tales (should be avoided, give little indication of movement and easily
vandalised) • Plastic tell tales (limited accuracy). • These measurements should be combined with measurements of the levels and
verticality to provide a full picture of the building distortion.
3.7 Conclusions The following conclusions are drawn from the literature survey related to the damage of buildings due to excavation-induced deformations.
3.7.1 Green field displacements Empirical methods have shown that the deformations to be expected depend very much on the soil type and the type of construction. No clear dependencies have been found however by most authors, because a complex combination of factors, such as workmanship, installation effects etc, can not be captured well in these general databases. For soft clays Moormann and Moormann (2002) show that little improvement has been made in the amount of settlements behind the wall compared to the early work of Peck (1969) and that displacements in the range of 1% of the excavation depth should be expected. From the present state of the art one should expect for a deep excavation in soft –stiff clay: • Wall deflection 0.5 – 1.0% (for an average system stiffness and sufficient basal stability) • Better results are possible (0.2-0.5%H) for diaphragm walls with good supports, as long
as the excavation effect is the main cause and installation and other effects are controlled sufficiently.
• Settlements behind the wall are about the same as wall deflections and may reach over a distance of 0.75H from the wall and decrease to 0 at 2-3H away from the wall.
• Settlements due to installation of diaphragm wall can be limited to 5-10 millimetres in case a high factor of safety for trench stability is assured.
• 50%-100% margins should be expected around the values presented.

1001307-004-GEO-0002, Version 02, 26 November 2009, final
Deformations and damage to buildings adjacent to deep excavations in soft soils
62
There is a lot of experience in modelling green field behaviour. Usually the wall deformations are predicted within 25-50% of the measured values. Settlements behind the wall are often under predicted. Deviations are usually related to the details of the construction process, such as the installation of struts and anchors and consolidation effects. Three-dimensional effects around deep excavations are present around corners, usually restricting movements of the wall and subsequent settlements behind the wall. Empirical work indicates effects of up to 40-50%, but only 3D FEmodels can provide some more detailed insight.
3.7.2 Building deformations and damage Damage in structures is not only related to construction, but also temperature, creep and shrinkage are major attributes. Deformations due to construction activities have to be separated from effects of self-weight, temperature, moisture content etcetera. The relationship between cracks or crack width and strains in a building depends on several aspects, such as material details, building dimensions and deformation modes. Usually low values of tensile strains (0-0.05%) are used as the onset of cracking. In general, buildings that experience more curvature, show more damage than buildings that rotate rather than bend or shear. Some buildings are more susceptible to damage than others: • Given the same vertical displacement, frame structures can accommodate differential
displacements by deformation of the beams, whereas load bearing walls need to bend, which leads to cracking more easily. This leads to a 20-25% lower tolerable relative rotation and settlement for load bearing walls.
• Buildings subjected to relatively fast deformations (construction activities usually occur rather fast, which is more damaging than slow deformations)
• Buildings with structural discontinuities • Building subject to hogging shaped deformations are usually more damaged than in
sagging shapes. • Buildings with deep foundations could be more sensitive to intolerable displacements
(deformations are considered intolerable at smaller values), because differential settlements might occur more localized than for shallow foundations. Tolerable relative rotations and settlements for deep foundations are about half those for shallow foundations according to Zhang and Ng (2007). This effect needs to be studied further.
Damage to buildings can be assessed by several damage criteria. The use of relative rotation and deflection ratio are both widespread, but also widely discussed. Relative rotation is favoured more for shear deformation and deflection ratio more for bending deformation. Some authors prefer one of the methods for simplicity of the calculation. It is important to be extremely clear on how rigid body rotation and overall translation have been incorporated in the calculation.
Rigid body rotation or building tilt, is a very important parameter when discussing excavation induced damage. Real rigid body rotation should be assessed in three dimensions and it should always be made clear exactly if and in what way tilt is considered.
Damage assessment procedures usually work from simple, conservative approaches to more detailed and specific procedures. The first step usually includes very simple damage criteria. In the second step strains are calculated, but without soil-structure interaction. Only if a third step is necessary, more detailed calculations are made including interaction and/or mitigating measures. This type of assessment is, although widely used in large projects, not typically used in this structured way in more ordinary projects.

1001307-004-GEO-0002, Version 02, 26 November 2009, final
Deformations and damage to buildings adjacent to deep excavations in soft soils
63
3.7.3 Soil-structure interaction Soil-structure interaction for excavation-induced deformations is a two-way effect. Firstly, the presence of the structure will modify the pattern of displacements. The building weight usually only has a minor influence on the deflection ratio, but more effect on transfer of the horizontal strains as shown by El Shafie (2008). Especially for large localised stresses such as for highly loaded deep foundations, this effect should be taken into account. Furthermore, the amount of displacement transferred to the building depends on the stiffness of the building in axial and bending modes and the interface between soil and foundation and between foundation and building.
The stiffer the building, the larger the difference between the ground displacement and the building deformation will be. Very flexible buildings do not alter, but follow, the green field displacements. The interface between the soil and the building depends on the foundation type. Rough interfaces transfer a little more of the soil strains and displacements to the building than smooth interfaces. This effect is expected to be clearer when different types of foundations will be studied in the second part of this study. The present state of the art for the effect of pile foundations is mainly derived for tunnelling. Close to the tunnel (not above it) the piles usually settle about the same as the ground level and deform laterally towards the tunnel (or excavation). Extra deformations due to stress relief proved to be small. Modelling soil and building in a combined calculation is still not well developed. So-called coupled models either have simple soil models or simple building models. Full non-linear coupled models are not likely available in the near future.
3.7.4 Future work analysing case histories Chapter 4 and 5 of this report include case histories to validate these conclusions for typical deep excavations in soft soil conditions. A much as possible the situation in Amsterdam is taken into account (soft clays, sand layers and masonry buildings with piled foundations). Case histories however are seldom fully documented, thereby reducing their value for further study. Often there is a lack of detail on the construction and operations. That is why in the second part of this study, a detailed look is taken into the NoordZuidlijn project, of which many details are available. The objective of the study is to validate the current models from this chapter with those data. A large number of data will be studied, as opposed to one building in detail.

1001307-004-GEO-0002, Version 02, 26 November 2009, final
Deformations and damage to buildings adjacent to deep excavations in soft soils
64

1001307-004-GEO-0002, Version 02, 26 November 2009, final
Deformations and damage to buildings adjacent to deep excavations in soft soils
65
4 Cases from literature
The cases in this chapter are selected for the insight they provide in the soil – structure interaction caused by deep excavations, tunnelling or subsidence. To determine the behaviour of buildings due to excavation-induced deformations the main aspects are related to the soil structure interaction. How does the building react to the soil displacements and/or how does the presence of the building itself influence the surrounding soil? To analyze this problem documented cases, in which both ground deformations and building deformations have been measured, are collected. These cases show aspects of the relationship between deformation of the building and damage occurring. All cases are from outside The Netherlands. One of the remaining activities of COB committee F531 is to collect local experience as well. This however is a separate activity not described in this study.
4.1 Chater Station, Hong Kong (Davies and Henkel, 1982)
4.1.1 Situation The construction of Chater Station, part of the Hong Kong Mass Transit Railway in the years 1976-1980 was performed in a congested urban area of reclaimed land. Old colonial buildings and new high rise blocks were nearby. Ground conditions are known as poor, with loose reclamation fill and marine deposits overlying a layer of silty sand. At about half way the excavation depth the top of a layer of decomposed granite is found. High water tables are present in the area. The excavation involved was 27 m deep, 400 m long and about 20 m wide. Diaphragm walls of 1.2 m thick were constructed, after which the roof was made. Buildings were situated at small distance (few meters) of the older buildings and even closer to the high-rise blocks. The Courts of Justice building is founded on timber piles under individual footings. Depth of the pile foundation is about 16 m. The Prince’s Building and the Mandarin hotel are founded a concrete slab with driven piles to 19 m. Swire House, 22 storeys high, is founded on small individual pile caps with 6 driven piles each reaching into the decomposed granite at 15-18 m below ground surface.
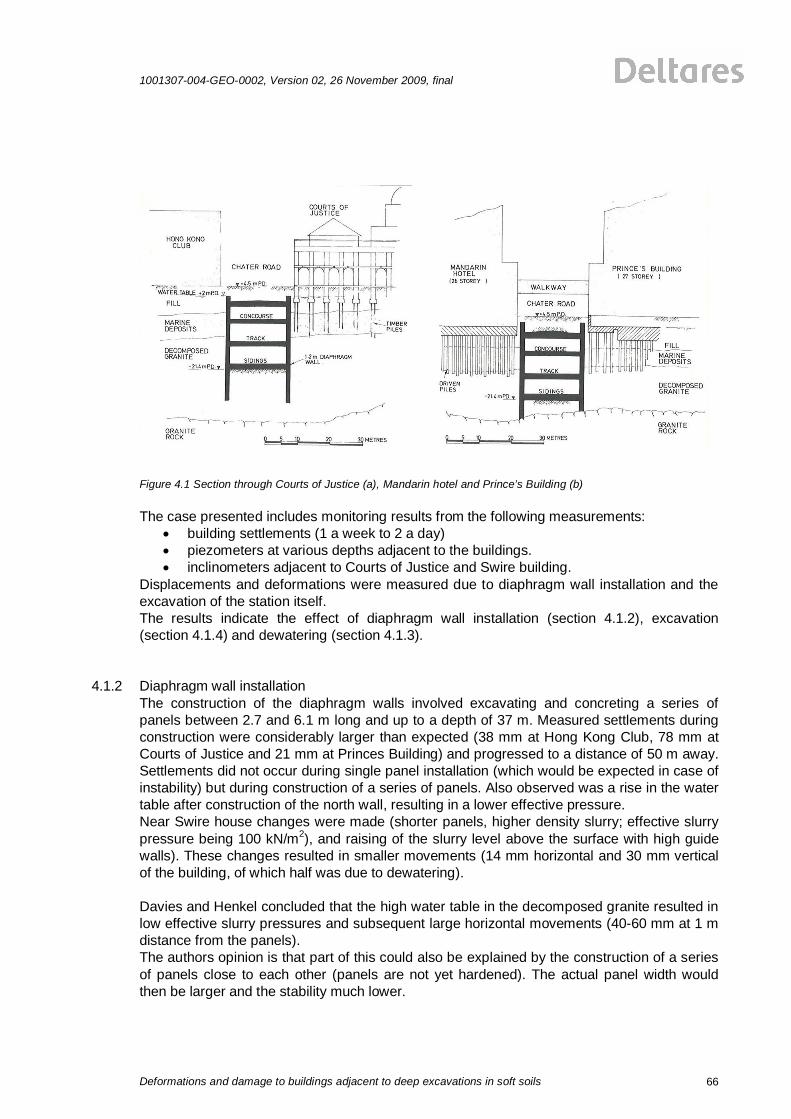
1001307-004-GEO-0002, Version 02, 26 November 2009, final
Deformations and damage to buildings adjacent to deep excavations in soft soils
66
Figure 4.1 Section through Courts of Justice (a), Mandarin hotel and Prince’s Building (b) The case presented includes monitoring results from the following measurements:
building settlements (1 a week to 2 a day) piezometers at various depths adjacent to the buildings. inclinometers adjacent to Courts of Justice and Swire building.
Displacements and deformations were measured due to diaphragm wall installation and the excavation of the station itself. The results indicate the effect of diaphragm wall installation (section 4.1.2), excavation (section 4.1.4) and dewatering (section 4.1.3).
4.1.2 Diaphragm wall installation The construction of the diaphragm walls involved excavating and concreting a series of panels between 2.7 and 6.1 m long and up to a depth of 37 m. Measured settlements during construction were considerably larger than expected (38 mm at Hong Kong Club, 78 mm at Courts of Justice and 21 mm at Princes Building) and progressed to a distance of 50 m away. Settlements did not occur during single panel installation (which would be expected in case of instability) but during construction of a series of panels. Also observed was a rise in the water table after construction of the north wall, resulting in a lower effective pressure. Near Swire house changes were made (shorter panels, higher density slurry; effective slurry pressure being 100 kN/m2), and raising of the slurry level above the surface with high guide walls). These changes resulted in smaller movements (14 mm horizontal and 30 mm vertical of the building, of which half was due to dewatering). Davies and Henkel concluded that the high water table in the decomposed granite resulted in low effective slurry pressures and subsequent large horizontal movements (40-60 mm at 1 m distance from the panels). The authors opinion is that part of this could also be explained by the construction of a series of panels close to each other (panels are not yet hardened). The actual panel width would then be larger and the stability much lower.

1001307-004-GEO-0002, Version 02, 26 November 2009, final
Deformations and damage to buildings adjacent to deep excavations in soft soils
67
4.1.3 Dewatering Lowering of the ground water table causes settlements and several variations in drawdown have been calculated for this case. The results show large settlements in some unfavourable conditions. A marked variation of ground-water lowering outside the excavation was found. The settlements were linearly related to the amount of drawdown, see Figure 4.2. A groundwater recharge system was installed at the Courts of Justice and the Hong Kong Club, which reduced the settlements to 60% of the values without recharge.
Figure 4.2 Settlement of high-rise buildings due to dewatering The settlement due to dewatering caused negative skin friction at the pile shafts, especially in the end bearing piles with shallow penetration into the bearing stratum. This explains the relatively large settlements of the buildings.
4.1.4 Excavation Expected settlements due to excavation were 0.15-0.2% of the depth (27 m; resulting in 40 mm - 50 mm) with an influence zone of at least the 27m away from the excavation. The observed displacements were maximum 40 mm horizontal and 60 mm vertical, see Figure 4.3.

1001307-004-GEO-0002, Version 02, 26 November 2009, final
Deformations and damage to buildings adjacent to deep excavations in soft soils
68
Figure 4.3 Horizontal and vertical deformations during excavation (West façade) The wall deflection is thus 0.15% of the excavation depth. The settlement is 1.5 times the wall deflection (during excavation only).
4.1.5 Final deformations Final deformations for the Courts of Justice building are presented in Figure 4.4. The final settlement of the building is 4.5 times the wall deflection and 0.7% of the excavation depth. These high values relate to the drawndown and diaphragm wall installation rather than the excavation itself.
Figure 4.4 Building deformations (final stage, East and West perpendicular to excavation) Based on the information given in the paper by (Davies and Henkel 1982) it was not possible to find the influence of the pile foundation to the results, because no measurements of the ground displacements were given. It is however clear that the piles experienced serious settlements due to negative skin friction caused by the lowering of the water table. Since the settlement of the building behind the wall during excavation were already 1.5 times the

1001307-004-GEO-0002, Version 02, 26 November 2009, final
Deformations and damage to buildings adjacent to deep excavations in soft soils
69
deflection of the wall, it seems that the piles might have followed the green field rather than the pile tip level, but this can not be verified. It was also not possible to find modification factors by comparing building deformations to green field values. As seen in Figure 4.4 it seems that the building behaved as two rather stiff units.
4.1.6 Damage Most buildings exhibited overall settlements and a slight tilt towards the excavation. Measured distortions were relatively small and very little damage occurred. One exception was the Courts of Justice building, at which 50 m from the retaining wall a hinge occurred between two sections of the building, resulting in large cracks (the size was not described by the authors). The damage indicators for this building are recalculated according to Son and Cording (2005) in order to compare the damage to the damage indicators. If rigid body tilt and horizontal strains are excluded (because the latter have not been given in the paper), the relative rotation will be equal to the slope of the deformations. In this case the maximum slope = = 1:338, and the principal strain p = 0.15%. Accordingly, the damage expected is in the category “slight”. If rigid body tilt is included based on the line between the outermost parts of the building, the relative rotation will become equal to 1:908 (close to the excavation) and 1:2022 (at the rear) and the damage expected is very slight or negligible with p = 0.055% and 0.025% respectively. When using Burland and Wroth (1974) and Mair et al. (1996), the deflection ratio /L is 0.035% and the damage expected is very slight. The ratio of over /L is 8.4, which is much higher than would be expected according to Boscardin and Cording (1989) and Burland (2004). Using Boone (2001) to calculate crack width directly, a total crack width of 6 mm is found (using c = 0.0%) which would indicate slight damage.
Figure 4.5 Deformation and deflection of Courts of Justice building
Courts of Justice
-200-180-160-140-120-100-80-60-40-20
00 20000 40000 60000 80000
Distance to excavation (mm)
settl
emen
t (m
m)
= 25 mm

1001307-004-GEO-0002, Version 02, 26 November 2009, final
Deformations and damage to buildings adjacent to deep excavations in soft soils
70
Since there was damage to the building, two more options have been analyzed: 1. horizontal strain estimated from wall deformation 2. rigid body rotation in two building units. 1) If horizontal strain is included, an estimate of the amount of horizontal deformation of the wall (40 mm at a depth of 25 m) that is transferred to the building is needed. Horizontal
displacement front facade
Horizontal displacement hinge (50m)
Principal strain (maximum of 1 and 2)
Damage category
Worst case 100% 0% Excl tilt 0.0019 Incl tilt 0.0011
Moderate Slight
Average case 50% 0% Excl tilt 0.0017 Incl tilt 0.0008
Moderate Slight
Low estimate, slip 10% 0% Excl tilt 0.0015 Incl tilt 0.0006
Slight Very slight
Table 4.1 Expected damage category including horizontal strains If reasonably large percentages of horizontal displacement are transferred to the building, this could possibly explain the amount of damage. Combining the deflection ratio with the horizontal strain (average over whole building) leads with /L = 0.035%, E/G = 2.6 for masonry and h = 0.06% (40mm) to damage category slight
p = 0.0011). Using E/G = 0.5 results in 25% higher strain, but the category does not change. The new ratio of over /L is 3.1, which would be expected according to Boscardin and Cording (1989) and Burland (2004). Boone’s method including horizontal strains (Boone, 2001) will give a total crack width of 10 mm (10% horizontal displacement), 27 mm (50% horizontal displacement) or 56 mm (100% horizontal displacement). This would indicate moderate (10%) or severe damage (50% and 100%). It can be concluded that horizontal deformations (assuming at least 20 mm differential horizontal displacement is present in the building) can explain the damage experienced in the Courts of Justice building only if one assumes that the building does not tilt. 2) On the other hand, based on the construction details, it is clear that the building is not a homogenous beam, but is rather formed by two (or even possibly even three) connected parts. The two rigid body units are connected through a hinge at about 50 m from the façade (at the corridor). Since damage was concentrated in the joint, it is possible to calculate the crack occurring if the two units behave independently. Assumed that the building height is about 15m at the corridors, the crack that would occur between the two units will be 0 mm at the bottom and 25 mm at the top. This would be considered a large crack and matches the damage description. The individual building parts will experience hardly any bending and an unknown amount of horizontal strain. Both relative rotation and deflection ratio are capable of showing the right amount of damage per building unit. Boone’s method tends to overestimate the amount of damage.

1001307-004-GEO-0002, Version 02, 26 November 2009, final
Deformations and damage to buildings adjacent to deep excavations in soft soils
71
Figure 4.6 Rigid body rotation and resulting crack width
4.1.7 Conclusion from this case study Settlements due to diaphragm wall installation are significantly influenced by the stability of the trench. Installation of several panels close to each other in a short time and/or high ground water pressures during construction will increase the ground displacements behind the wall. All of the buildings settled a fairly large amount, mostly in the form of an overall settlement and slight tilt towards the excavation. The distortion in the buildings was small, with the exception of the Courts of Justice, where a large crack occurred between to building parts. This damage cannot be explained by the curvature of the building, but can if rigid body tilt is taken into account. Considering the methods for damage assessment, it is clear that it is very significant to understand whether a building will rotate like a rigid body or deform by bending and shearing. The difference will be that tilting will not cause damage within a unit, but gaps might occur between building units. Bending and shearing will have a more traditional type of damage such as shear and bending cracks, but these could also concentrate in weak areas. This case study shows the importance of the rigid body tilt if two or more stiff units are connected through a flexible joint. Because no information is presented on the ground displacements, they can not be compared to the building deformations. The effect of the pile foundation could for the same reason also not be found.
Gap = 25 mm H = 15m

1001307-004-GEO-0002, Version 02, 26 November 2009, final
Deformations and damage to buildings adjacent to deep excavations in soft soils
72
4.2 Subsidence in Sarno, Italy (Cascini et al., 2007) The paper presents satellite monitoring data to investigate the urban area of Sarno town (Campania Region, Italy), which is severely affected by subsidence due to ground water lowering in the area. The paper correlates ground displacement gradient vectors with damages characteristics, such as the direction of building rotation axes. One building, a town hall connected to a church, has been analysed in respect to the ground displacements and its fit with damage criteria. The building considered is a masonry structure composed by two attached blocks (a Church and the Town Hall) and was built before 1900. The Town Hall has four floors and is 20 m high. The structure has shallow foundations, which are not horizontal due to the difference in depth to the calcareous bedrock they are founded on. The paper by Cascini and co-authors describes the present damage to the building, which is partly caused by an earthquake in 1980. During the period of measurements, there was no subsequent damage noticed in the building. In fact, existing damage had not worsened since 14 years after the earthquake.
Figure 4.7 Overview of Church (on the left side) and Town Hall (right)
4.2.1 Subsidence due to groundwater withdrawal. The building deformations are obtained by satellite measurements, in this case using DInSAR algorithms. This is a promising method for large scale settlement analysis, but in this report the method of derivation is not the main concern. The current analysis focuses on the relationship between the settlements and the damage of the buildings. One aspect to take into account when using these data is that groundwater withdrawal is a slow effect compared to tunnelling or deep excavation construction, this means that faster settlements would result in more damage, so the damage presented is an optimistic approach.
4.2.2 Town hall and church Movements in order of 20-60 mm in about 10 years time have been recorded on a 5x5 m grid by the DInSAR data. Key assumptions made in the analysis are firstly a pure shear mode of

1001307-004-GEO-0002, Version 02, 26 November 2009, final
Deformations and damage to buildings adjacent to deep excavations in soft soils
73
deformation, which means no strain in vertical direction is expected. Even so no horizontal movements have been taken into account.
Figure 4.8 Settlement computed along longitudinal profile (1) nearest to the principle façade of the building
Figure 4.9 Settlement computed along longitudinal profile (2) farthest to the principle façade of the building For these settlements, both relative rotation and deflection ratio have been calculated using the full resolution settlement data. The profile of both indicators along the facade has been plot for two longitudinal profiles.
Figure 4.10 Relative rotations parallel to building façade (Cascini et al 2007)

1001307-004-GEO-0002, Version 02, 26 November 2009, final
Deformations and damage to buildings adjacent to deep excavations in soft soils
74
Figure 4.11 Deflection ratio parallel to building façade (Cascini et al 2007) The authors concluded: • The relative rotation max for both profiles is 1/588, the maximum is found at the point of
inflection. This would corresponds to the fact that no additional damage was recorded. • The maximum deflection ratio is 0.067%, found in the sagging zone at the location
where the maximum curvature is present. Damage expected based on deflection ratio would be category 2 (moderate)* for the sagging part and category 0 (very slight)* for the hogging part, assuming the building initially undamaged.
* Note: the categories are not interpreted correctly; these deflections would mean “slight” damage (sagging) and “negligible” (hogging) damage, based on statements and figures in the original paper. The authors concluded that the use of relative rotation is less conservative than using deflection ratio in case of sagging. Horizontal deformations were not recorded by the satellite measurements, so these could not be included in the survey. Due to the nature of the subsidence problem, these deformations are however expected to be small. Based on these figures, there seems to be a large difference between the two methods, but if we analyse in more detail this is mainly due to the following aspects: • The relative rotation has been calculated not taking into account the rigid body rotation,
so it actually is the slope of the building. Including rigid body tilt would lead to an even smaller value of .
• The slope calculated from the profiles has been given an all-negative sign, although the building deformations show both hogging and sagging. This however does not influence the maximum values.
• The deflection ratio is calculated taking 4 measurement points as a “stiff” building unit (14.4 m). This roughly coincides with the points of inflection, separating the hogging and sagging building parts. The result depends on this unit length, since tilt is taken into account over these units. For this case, taking more precise lengths for hogging and sagging would have made no difference (<5%)

1001307-004-GEO-0002, Version 02, 26 November 2009, final
Deformations and damage to buildings adjacent to deep excavations in soft soils
75
Figure 4.12 Building parts in hogging and sagging according to (Cascini et al., 2007) compared with tilt over
Church and Town Hall Recalculating deflection ratio and relative rotation for profile 1 results in Figure 4.13, which proves very similar to Figure 4.11 from (Cascini et al., 2007).
Figure 4.13 Recalculation of deflection ratio and relative rotation If in this calculation the rigid body tilt is taken into account the following Figure 4.15 is the result. Relative rotation for this graph has been calculated according to the definition in Figure 4.14. In this case 2 and 3 are no real relative rotations, but would be better classified as angular strain Burland and Wroth (1974). Usually the relative rotation at the start and end (positions 1 and 4) would be dominant.

1001307-004-GEO-0002, Version 02, 26 November 2009, final
Deformations and damage to buildings adjacent to deep excavations in soft soils
76
Figure 4.14 Definition of relative rotation
Figure 4.15 Deflection ratio and relative rotation, including tilt Relative rotation and deflection ratio now follow the same pattern, as would be expected since they both indicate the amount of curvature in the building. The absolute values do not change very much, because the overall building settlement was almost horizontal.
1
2
4
1
2 3
4
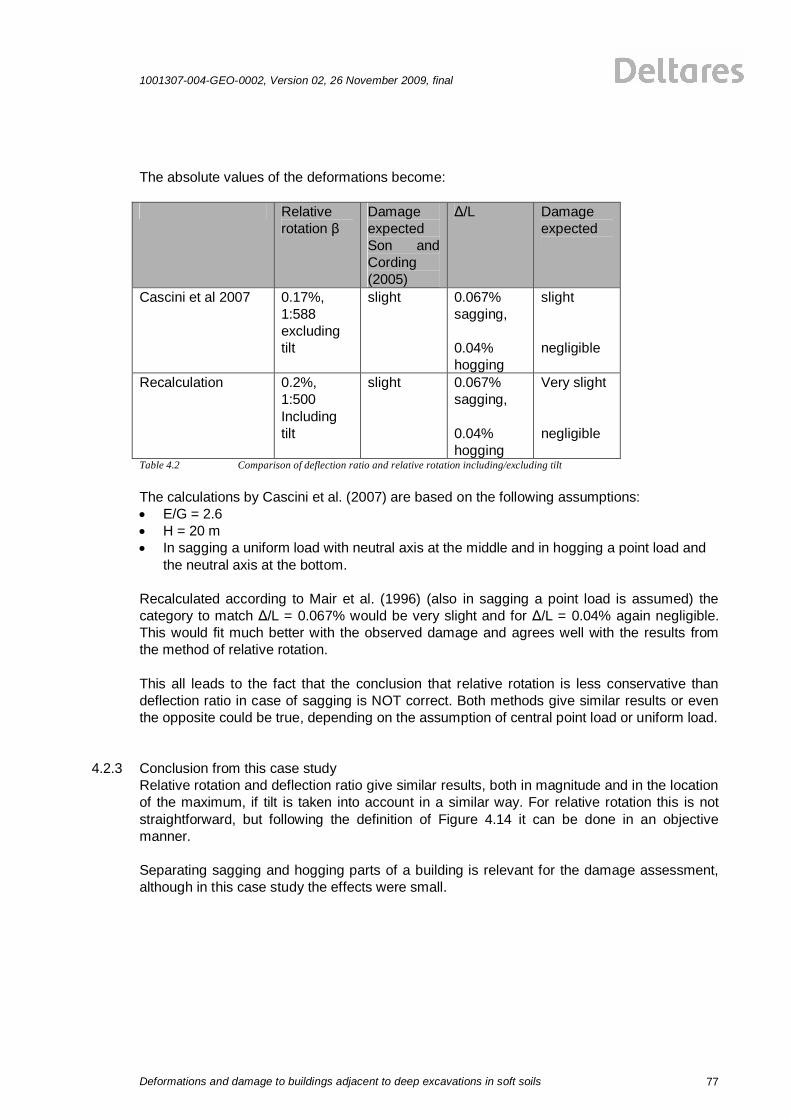
1001307-004-GEO-0002, Version 02, 26 November 2009, final
Deformations and damage to buildings adjacent to deep excavations in soft soils
77
The absolute values of the deformations become: Relative
rotation Damage expected Son and Cording (2005)
/L Damage expected
Cascini et al 2007 0.17%, 1:588 excluding tilt
slight 0.067% sagging, 0.04% hogging
slight negligible
Recalculation 0.2%, 1:500 Including tilt
slight 0.067% sagging, 0.04% hogging
Very slight negligible
Table 4.2 Comparison of deflection ratio and relative rotation including/excluding tilt The calculations by Cascini et al. (2007) are based on the following assumptions: E/G = 2.6 H = 20 m In sagging a uniform load with neutral axis at the middle and in hogging a point load and
the neutral axis at the bottom. Recalculated according to Mair et al. (1996) (also in sagging a point load is assumed) the category to match /L = 0.067% would be very slight and for /L = 0.04% again negligible. This would fit much better with the observed damage and agrees well with the results from the method of relative rotation. This all leads to the fact that the conclusion that relative rotation is less conservative than deflection ratio in case of sagging is NOT correct. Both methods give similar results or even the opposite could be true, depending on the assumption of central point load or uniform load.
4.2.3 Conclusion from this case study Relative rotation and deflection ratio give similar results, both in magnitude and in the location of the maximum, if tilt is taken into account in a similar way. For relative rotation this is not straightforward, but following the definition of Figure 4.14 it can be done in an objective manner. Separating sagging and hogging parts of a building is relevant for the damage assessment, although in this case study the effects were small.

1001307-004-GEO-0002, Version 02, 26 November 2009, final
Deformations and damage to buildings adjacent to deep excavations in soft soils
78
4.3 Influence of Jubilee Line Extension on Ritz building, London This case study shows the effect of the soil-structure interaction for an old building in London due to tunnelling. The main objective of the study is to compare the deformations and damage criteria calculated based on the actual damage and deformations. The case is extensively described in the CIRIA Special publication 201, evaluating the Jubilee Line Extension (JLE) project Burland et al. (2001) and Burland et al. (2004).
4.3.1 Situation overview The Ritz Hotel was constructed in 1906, with dimensions of 71 m by 35 m in plan. The building has a 7m deep basement supported by concrete pad grillage foundations that vary in size up to 5 by 5 m. The construction is built from brickwork, clad with granite and Portland stone. The building above ground level consists of 1 double storey ground floor, 5 ordinary floors and 2 floors under the sloping roof. During construction of the JLE project the building was extensively monitored by total stations, with three rows of six retro-reflective targets along the façade transverse of the tunnelling works. The data have been analysed to obtain vertical and horizontal deformations in-plane and out-of-plane of the façade (Burland et al., 2004).
Figure 4.16 Ritz Hotel with façade monitoring points (Standing, 2001)

1001307-004-GEO-0002, Version 02, 26 November 2009, final
Deformations and damage to buildings adjacent to deep excavations in soft soils
79
Figure 4.17 Vertical and horizontal deformations along façade measured at three levels (Burland et al., 2004) The building is influenced by the construction of the tunnels. The relationship between the construction works and the deformations is not part of this investigation. In the next sections only the observed deformations are analysed in view of the different damage criteria.
4.3.2 Damage criteria In Burland et al. (2004) the building deformations have been analysed to obtain the resulting damage indicators. Both deflection ratio and relative rotation have been calculated. The results are shown in a newly constructed combined graph (Figure 4.18), with exactly the same values as found in the original paper.
Figure 4.18 Vertical deformations and building damage indicators according to (Burland, Mair et al. 2004)

1001307-004-GEO-0002, Version 02, 26 November 2009, final
Deformations and damage to buildings adjacent to deep excavations in soft soils
80
It is shown that the building experiences a traditional Gaussian shaped vertical deformation, with both sagging and hogging along the building. Horizontal deformations were very small as shown in the original paper. They are not discussed in this case study. The relative rotation in Figure 4.18 is calculated assuming no rigid-body rotation of the building. This means that its value is equivalent to the slope of the Gaussian curve. Based on this result Burland et al. (2004) concluded that: • Maximum deflection ratio is about 0.006% in sagging and hogging, and located near the
maximum curvature of the Gaussian graph. • Maximum relative rotation is 0.0004 and coincides with the point of inflection, as would
be expected given the calculation method. • The ratio of over /L is 6.7, which is about twice the amount suggested by Boscardin
and Cording (1989). • Interpretation of settlement data in terms of deflection ratio is less ambiguous and more
closely related to tensile strains in the building than it is the case with relative rotation. • The use of relative rotation should be reserved for buildings experiencing pure vertical
shear distortion. The picture would however have looked different if tilt would have been taken into account and if sagging and hogging building parts would have been separated.
/Lmax (%) begin end / /L
max
/ /L
min Sagging 0.006% 7.7 Original
calculation Excluding tilt
Hogging 0.0065% 0.00044 (1:2300)
6.7
Sagging 0-18 m
0.006% 0.00028 (1:3500)
0.00015 (1:6600)
4.7 2.7
Hogging 18-70 m
0.0063% 0.00029 (1:3500)
0.00015 (1:6600)
4.6 2.4
Separating sagging/ hogging Excluding tilt
Hogging* 0.0065% 0.00029 (1:3500)
0.0002 (1:5000)
4.5 3.0
Table 4.3 Damage indicators with sagging and hogging parts separated *) For both end and deflection ratio, after separating hogging and sagging, a higher value would have been found if the hogging part was stopped before the ‘horizontal tale’ at the end (at 49 m and 62 m respectively). This was also the case for the original calculation of the deflection ratio. However, this difference will be outweighed by the higher L/H factor and resulting higher tensile strains as was shown by Netzel (2005). Because Burland et al. (2004) did not separate the hogging and sagging building parts, the relative rotation they found is equal to the slope of the deformation. The magnitude of relative rotation is 35-65% smaller in case the parts are separated and conform better to expected /
/L values. There is a significant difference between the relative rotations calculated at the beginning and end of the building parts, a factor of about 1.8-1.9 is found between them. This is in accordance with calculations by Netzel (2005), who stated that only min and /L should be

1001307-004-GEO-0002, Version 02, 26 November 2009, final
Deformations and damage to buildings adjacent to deep excavations in soft soils
81
used as damage indicators, otherwise the damage will be overestimated compared to more detailed deformation analysis. The range of min/ /Lmax will then also be within the values expected by Boscardin and Cording (1989). The conclusion of Burland et al. (2004) would also have changed if rigid body tilt would have been taken into account. Their article already indicates two possible reasons to include rigid body tilt; at about 60 m away from the excavation some upward flexure is found (about 2 mm) and the difference in horizontal deformations at the different heights above ground level (about 2 mm over 15 m). Tilt could thus be in the order of 0.01% and be responsible for about half of the maximum settlement. Absolute values for deflection ratio and relative rotation would reduce with the same amount. Since including tilt will affect both relative rotation and deflection ratio (according the method of Skempton and MacDonald (1956) this will not change the conclusions above.
4.3.3 Conclusions for this case study The shape of the damage indicators from the Ritz hotel presented by Burland et al. (2004) does not have a real meaning, but the maximum values are correct in case the building is considered as a homogeneous beam. Burland et al. (2004) state that deflection ratio shows a better link to expected building damage, because the maximum is found at the location of the largest curvature. This conclusion is not true if hogging and sagging building parts are separated before the calculation of the relative rotation (as well as for the deflection ratio) and relative rotations are determined accordingly. The difference in using relative rotation and deflection ratio is smaller than indicated by Burland et al. (2004). The importance of rigid body tilt and the length of the building considered is larger than is usually found in literature.

1001307-004-GEO-0002, Version 02, 26 November 2009, final
Deformations and damage to buildings adjacent to deep excavations in soft soils
82
4.4 KPE Singapore (Lee et al., 2007)
4.4.1 Introduction This case study describes the result of a building damage assessment for a Multi-propped excavation in Singapore for the Construction of Kallang Paya Lebar Expressway (KPE). Special attention is given to the soil-structure interaction for a building with a piled foundation. Figure 4.19 shows the plan view of the excavation and the construction (block 122), whereas Figure 4.20 shows the cross section with the geological profile.
Figure 4.19 Plan view of the excavation and the construction
Figure 4.20 Cross section with the geological profile.
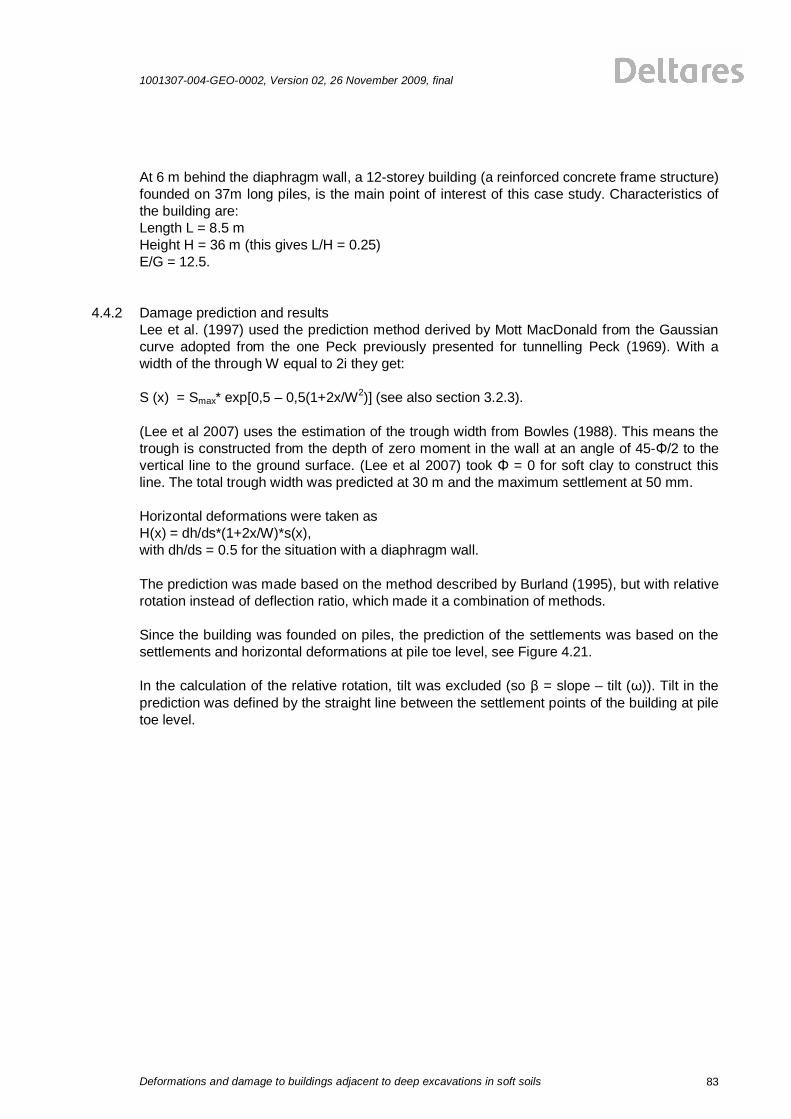
1001307-004-GEO-0002, Version 02, 26 November 2009, final
Deformations and damage to buildings adjacent to deep excavations in soft soils
83
At 6 m behind the diaphragm wall, a 12-storey building (a reinforced concrete frame structure) founded on 37m long piles, is the main point of interest of this case study. Characteristics of the building are: Length L = 8.5 m Height H = 36 m (this gives L/H = 0.25) E/G = 12.5.
4.4.2 Damage prediction and results Lee et al. (1997) used the prediction method derived by Mott MacDonald from the Gaussian curve adopted from the one Peck previously presented for tunnelling Peck (1969). With a width of the through W equal to 2i they get: S (x) = Smax* exp[0,5 – 0,5(1+2x/W2)] (see also section 3.2.3). (Lee et al 2007) uses the estimation of the trough width from Bowles (1988). This means the trough is constructed from the depth of zero moment in the wall at an angle of 45- /2 to the vertical line to the ground surface. (Lee et al 2007) took = 0 for soft clay to construct this line. The total trough width was predicted at 30 m and the maximum settlement at 50 mm. Horizontal deformations were taken as H(x) = dh/ds*(1+2x/W)*s(x), with dh/ds = 0.5 for the situation with a diaphragm wall. The prediction was made based on the method described by Burland (1995), but with relative rotation instead of deflection ratio, which made it a combination of methods. Since the building was founded on piles, the prediction of the settlements was based on the settlements and horizontal deformations at pile toe level, see Figure 4.21. In the calculation of the relative rotation, tilt was excluded (so = slope – tilt ( )). Tilt in the prediction was defined by the straight line between the settlement points of the building at pile toe level.

1001307-004-GEO-0002, Version 02, 26 November 2009, final
Deformations and damage to buildings adjacent to deep excavations in soft soils
84
Figure 4.21 Predicted (above) and Measured (below) deformations (Lee et al., 2007) Both building and ground deformations were measured, inclinometers installed and tape extensometers used to check the relative horizontal building movements. Slope measurements were installed to monitor overall movement in parallel and perpendicular to the wall of the excavation. The results showed (Figure 4.22b) that the actual wall deformation was very close to the predicted one. The settlement behind the wall was somewhat (about 10 mm) higher than predicted and more gradual (it extended further from the wall). Characteristic numbers derived for this case study: • Deflection wall/excavation depth = 16mm/16.5 m = 0.1% • Settlement behind the wall / deflection wall = 30mm/16 mm = 1.9
100 85 60
El T
OD
(m)
0
-10
-20
-30
-40
-50
Distance from the wall (m)
Settl
emen
t (m
m)

1001307-004-GEO-0002, Version 02, 26 November 2009, final
Deformations and damage to buildings adjacent to deep excavations in soft soils
85
Results of the prediction Results of the measurements
h,ground = 0.0835% and ground = 0.0354%
n.a. (Burland, 1995), with instead of /L
h,toe = 0.0835% and toe = 0.0462%
h,building 0.075% and building 0.05%, all < 0.1%
(Burland and Wroth, 1974) bmax 0.08% and dmax 0.08%
Table 4.4 Comparison of prediction with measurements This clearly shows that the horizontal strain is the most important factor causing the prediction to assess a category “slight” amount of damage. Due to the small L/H factor in this direction (perpendicular to the deep excavation), the building behaves relatively stiff.
4.4.3 Conclusion from this case study Monitoring results were in general 80-100% of the prediction in green field conditions. The soil displacements and wall deflections were within the band widths of Clough and O’Rourke (1990). The effect of horizontal strain was particularly present in the measurements of the building and in the derivation of the damage indicators. The differential horizontal deformation is 0.075%*8500mm = 0.6 mm. Differential horizontal green field deformations are about 3.0 mm equivalent. This indicates that, 0.6/3.0 = 20% of the horizontal ground strain was transferred to the building. The assumption that the building follows the deformations of the pile toe level worked well in this case, although due to the length of the piles this will in reality probably be different and due to the small deformations and no direct measurements at depth this can not be confirmed.

1001307-004-GEO-0002, Version 02, 26 November 2009, final
Deformations and damage to buildings adjacent to deep excavations in soft soils
86
4.5 Excavation next to Xavier Warde School, Chicago (Finno et al., 2002)
4.5.1 Situation Finno et al. (2002) describe observations made during the excavation and construction of the Chicago Avenue and State Street Subway renovation project in Chicago. One of the main interesting aspects of this case is the three dimensional effect due to the shape of the excavation. Figure 4.22 shows a top view of the location, the deep excavation and the adjacent Warde School with the instrumentation.
Figure 4.22 Top view of Chicago Avenue and State Street Subway renovation project The school was built in the late 19-sixties and is a 3-storey reinforced concrete frame structure. An approximately 1.2 m wide continuous footing supports the basement wall. The interior columns are supported by reinforced concrete spread footings. The average depth of the footings is approximately 3.7 m below ground surface. The school is located approximately 2 m from the excavation. The excavation was supported by a secant pile wall, approximately 18.3 m deep, with three levels of support. The wall consisted of overlapping 915-mm-diameter drilled shafts, overlapped adjacent shafts by 150 mm and reinforced by a steel W24x55 section in alternating shafts. The top level of the supports consisted of cross-lot pipe struts, with a

1001307-004-GEO-0002, Version 02, 26 November 2009, final
Deformations and damage to buildings adjacent to deep excavations in soft soils
87
diameter of 610 mm and a center-to-center spacing between the struts of approximately 6.1 m horizontally. Tieback anchors were used for the second and third levels of support. The excavation along State Street was approximately 40 m long, 24 m wide and reached an average final depth of 12.2 m. The excavation along Chicago Avenue was approximately 24 m long and 7 m wide and was advanced to a depth of 8.2 m. The soils found at the site are primarily lightly overconsolidated glacial clays. The clay layers are distinguished by water content and undrained shear strength, with the strata becoming stiffer and stronger as depth increases.
Figure 4.23 Soil profile
4.5.2 Construction activities, measurements and building damage The excavation activities along the east side of State Street occurred between Day 28 and Day 163. A profile of the east wall excavation face is given in Figure 4.24.

1001307-004-GEO-0002, Version 02, 26 November 2009, final
Deformations and damage to buildings adjacent to deep excavations in soft soils
88
Figure 4.24 Construction process along east wall in State Street The construction at the site was separated into three stages; wall installation, support system installation and excavation, and station renovation and backfill. Displacements of the retaining wall, ground level and the Warde school building are analysed per construction phase. Wall installation: Lateral soil movements and settlements of the school reach a maximum of 9 mm. They extend to a distance from the wall equal to the depth of the secant pile wall. Excavation and support: Lateral wall movements in this phase are on average about one half of the total movement over all phases. Maximum lateral movement and settlement of the school in this phase is 28 mm. The three-dimensional effect of the excavation is most clearly observed in the northwest corner at inclinometer 5. The resultant of the two components of the inclinometer (parallel and perpendicular to the wall) is about equal to the surface settlement and thus bigger than either of the individual components (North-South deformation wall is 19 mm, East-West is 28 mm and resultant is 34 mm while settlement is 35 mm at the location of inclinometer 5 and settlement point W12). The Warde School settled as much as the soil displaced laterally, with the settlement extending as far behind the excavation as the secant pile wall extended below the bottom of the school’s foundation. The adjacent settlements were virtually identical to the lateral movements within the soft clay. The agreement between the inclinometer and settlement data suggests that settlement behind the support wall can be reliably estimated from inclinometer data when considering excavations in saturated clay.
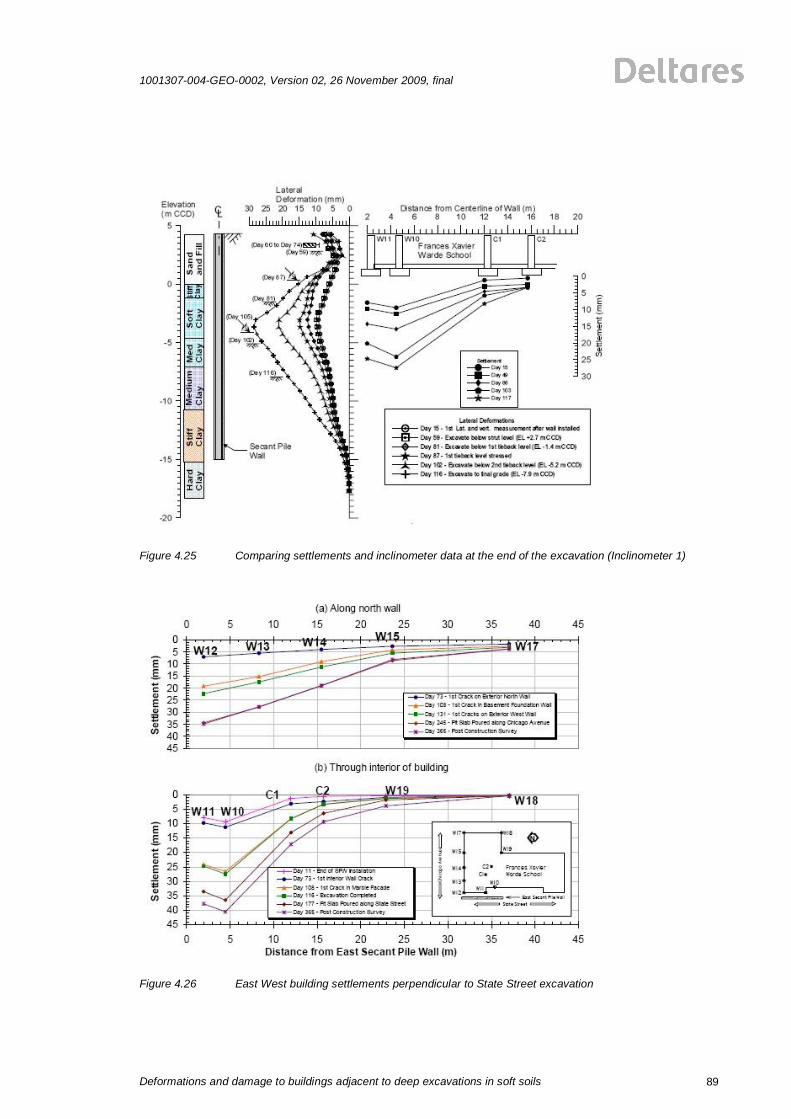
1001307-004-GEO-0002, Version 02, 26 November 2009, final
Deformations and damage to buildings adjacent to deep excavations in soft soils
89
Figure 4.25 Comparing settlements and inclinometer data at the end of the excavation (Inclinometer 1)
Figure 4.26 East West building settlements perpendicular to State Street excavation

1001307-004-GEO-0002, Version 02, 26 November 2009, final
Deformations and damage to buildings adjacent to deep excavations in soft soils
90
Figure 4.27 North South building settlements perpendicular to Chicago Avenue excavation Finno et al. (2002) also calculated the deflection ratio and relative rotations with time.
is computed from both the settlement data and the lateral deformations of the wall (after it was ‘rotated’ horizontal along the building). Those will only be similar for undrained behaviour, no volume changes and/or consolidation. The rigid body tilt of the building was 1:15000 on Day 116 (final excavation depth reached) and 1:3900 by the end of the project. These values are small and therefore neglected in the calculation of the relative rotations (and deflection ratio’s). The relative rotations are calculated as the differential settlement between two points, divided by the distance between the points. The damage observed in the Warde School can be characterized as “negligible” to “slight” according to the damage severity classification presented by Burland et al. (1977). This was the case for both the calculated and observed damage. Finno et al. (2002) also calculated the deflection ratio’s in sagging and hogging and found that they were a maximum of 0.08% in East-West direction and 0.03% in North South direction in sagging and in hogging even smaller (EW = 0.03%, NS = 0.007%). Based on the calculated deflection ratio’s the damage category would have been ‘negligible’. Boscardin and Cording (1989) found that relative rotations were typically 2 to 3 times the deflection ratios. The data given for the sagging zone indicate that this ratio varies between 2 and 4, while the data in the hogging zone shows that the relative rotations were approximately 3 to 7 times the deflection ratios.

1001307-004-GEO-0002, Version 02, 26 November 2009, final
Deformations and damage to buildings adjacent to deep excavations in soft soils
91
Horizontal deformations Finno et al. (2002) did not include horizontal strains in the damage estimation. If we assume that the horizontal deformations in the building are equal to the vertical deformations, the damage category would have been ‘very slight’ for most building parts, but ‘moderate’ for the sagging zone in the East West direction. By including all of these horizontal strains in the building, the damage category would have been overestimated. It is more likely that only a portion of the horizontal deformations was transferred to the building.
Figure 4.28 Distortions and cracks along west side Cracking was first observed along the west side of the school on all three floors. The initial damage mostly consisted of diagonal hairline cracks about 300 to 500 mm long in non-load bearing walls. the cracks were greater on the second and third levels than on the first level. As the excavation increased to a depth of 12 m on Day 108 and the maximum lateral movement increased to 22 mm, cracks developed in the marble façade in the entranceway foyer on State Street. Also, hairline cracks were observed in the basement, along the west end of the north foundation wall. The general excavation along the west side of the school was completed on Day 116. At this time, previously observed cracks had widened and extended on all levels. During station renovation and backfill, only a few instances of new damage were observed; existing cracks generally became larger during this time. Cracks were observed in the mortar of the south and north segments of the exterior west wall on Days 127 and 129, respectively.

1001307-004-GEO-0002, Version 02, 26 November 2009, final
Deformations and damage to buildings adjacent to deep excavations in soft soils
92
Figure 4.29 Distortions and crack opening along west wall Most of the damage occurred along the west side of the school in the area where distortions were largest, and when the maximum distortions increased from 1/1000 at the end of wall installation to 1/400 at the end of excavation. Further increases in distortion to 1/315 during station renovation and backfill caused little new damage. No damage to structural elements of the school was observed throughout the project.

1001307-004-GEO-0002, Version 02, 26 November 2009, final
Deformations and damage to buildings adjacent to deep excavations in soft soils
93
Sagging zone Hogging zones Stage Day
(1) Comment (2) (3) Comment 1 11 1/1000 No damage 1/6050 1/23590
73 1/920 First interior cracks
1/5000 1/4720
78 1/870 1/5000 1/4100 Crack through mortar and stone of north wall
108 1/500 Crack in marble façade of entranceway foyer
1/1500 1/3370 Cracks in west corner of north foundation wall
2
116 1/400 Cracks extend and widen on all levels
1/1600 1/3370
127 1/390 1/1600 1/2400 Step crack in mortar along south segment of west wall
129 1/380 1/1690 1/2360 Step crack in mortar along north segment of west wall
151 1/335 “Trigger” deformation limit exceeded
1/1700 1/1970
3
310 1/315 Movement completed
1/3000 1/1310
(1) computed in interior of school between survey points W10 and C1 (2) computed along north segment of west wall at Tiltmeter T6 (3) computed in interior of school between survey points C2 and W19 Table 4.5 Overview of damage during construction
4.5.3 Conclusion from this case study This case study showed the amount of deformations and damage a three-dimensional excavation caused to a frame building with basement, founded on spread footings. Deep excavation effects Some characteristic numbers for wall deflection over excavation depth are derived for this case study: • State street (12.2 m deep), excavation phase = 28 mm/12.2 m = 0.23% • State street (12.2 m deep), total deformation = 41 mm/12.2 m = 0.34%
Note: lateral displacement from inclinometer 1. • Chicago Avenue (8.2 m deep), excavation phase = 14 mm/ 8.2 m = 0.17% • Chicago Avenue (8.2 m deep), total deformation = 34 mm/ 8.2 m = 0.41%
Note: lateral displacement from inclinometer 5, resultant deformation The wall deflection over settlement behind the wall for this case is generally about 1.0 for all phases of the construction. The settlement trough width (measured by the deformation of the building) reached to about the same distance as the depth of the piles below the excavation. This value seemed not to be affected by the depth of the excavation. The through width was about 1.6 times the deepest excavation depth.
1001307-004-GEO-0002, Version 02, 26 November 2009, final
Deformations and damage to buildings adjacent to deep excavations in soft soils
94
It is concluded that this deep excavation follows the patterns and indicative values suggested in the literature by Clough and O’Rourke (1990). The three-dimensional behaviour of the excavation and the building resulted in smaller deformations close to the corners (even at the inward corner) of the excavation. Damage to the building Finno et al (2002) concluded that the ratio of /L versus was larger than the range of Boscardin and Cording (1989). Even by including rigid body tilt these results would not have changed much. Depending on the amount of horizontal strain in the building, the damage category expected based on the measurements would have been underpredicted (using deflection ratio without horizontal strain) or overpredicted (using deflection ratio and horizontal deformations equal to vertical deformations). Using relative rotation without rigid body tilt or horizontal strain resulted in values comparable to the damage experienced. If horizontal strain (>80% of vertical deformations) would have been included, the damage would also have been overestimated. Due to the lack of horizontal measurements, it will not be possible to state which of the damage indicators gives the most appropriate results. Soil-structure interaction Since no ground deformations were presented it was not possible to find the modification factors of the building depending on its stiffness. Also no piles were present under the building to analyse the effect of those.

1001307-004-GEO-0002, Version 02, 26 November 2009, final
Deformations and damage to buildings adjacent to deep excavations in soft soils
95
4.6 Nicoll Highway collapse, Singapore The Nicoll Highway collapse was a severe construction accident that occurred on April, 20 2004 in Singapore when a deep excavation under construction collapsed. The tunnel was part of the construction of the underground Circle MRT Line, near the Nicoll Highway MRT Station. The supporting structure for the deep excavation work failed. The collapse killed four people and injured three. The accident left a collapse zone of 150 m wide, 100 m long, and 30 m deep. Simpson et al. (2008).
Figure 4.30 Overview of the collapse of Nicoll Highway (Asianews) This accident was studied in some more detail to investigate the possible causes of damage related to deep excavations. More specifically, the causes studied provide lessons for future design of deep excavations and of project guidance and monitoring survey. Three extensive papers about the accident were studied Davies et al. (2006), Yong and Teh (2006), Simpson et al. (2008) to give an overview of the different causes and opinions about the accident. First some general background of the incident is given.
4.6.1 Description of the project The excavation was being carried out within a diaphragm wall supported by steel struts and jet grout slabs. The width of excavation is about 19.85m and the depth about 33.5m. The excavation was situated in an area of reclaimed land with over 40 m of soft marine clay present and a ground water table only 0.2 m below the surface. The structural system at this section of the cut and cover tunnel included a diaphragm wall of about 43 m deep and 800mm wall thickness. According to the design was supposed to be extended 3 m into the Old Alluvium stratum. The excavation was kept open by 10 levels of conventional steel struts, supported by steel king posts at mid span and connected to the wall by walers. The struts are spaced at vertical distances of 3.0-3.5m and horizontal distances of 3.8-4.0m. Two layers of jet grout (one of which was sacrificial) were installed to minimise deflection and ground movement during the excavation work. The first layer (1.5m thick) of jet
1001307-004-GEO-0002, Version 02, 26 November 2009, final
Deformations and damage to buildings adjacent to deep excavations in soft soils
96
grout has been placed at about 28m below ground level and the second layer (2.6 thick) was installed 33.5m below the final formation level. Inclinometers were installed in the diaphragm wall on the North side and just behind the wall on the South side. Strut loads were recorded. In addition, settlements in the area and piezometers were monitored.
4.6.2 Description of the failure The failure was initiated at the strut/waler joint at level 9, located just above the sacrificial jet grout strut which was being excavated. Level 10 struts were not effective at the time of failure. The strut measurements showed that a brittle collapse occurred when load was transferred from the 9th to the 8th strut level after failure of the waling beams at the 9th level on the north side, after earlier signs of buckling had been noticed here. The inclinometers showed that a plastic hinge had occurred in the diaphragm wall as well, showing horizontal wall deformations of 350 mm maximum three days before the incident and 440 mm maximum on the day of the incident (Davies et al 2006).
4.6.3 Shortcomings Yong and Teh (2006) describe the shortcomings in the design and construction of the project, mainly based on the study of the Engineering Advisory Panel of the LTA. The main short comings they report are: • No sufficient soil investigation data was available. Only Standard Penetration tests were
conducted. No CPTs were performed or undisturbed samples taken. The level of the Old Alluvium varied significantly over the site. The diaphragm wall was not embedded the desired 3 m into the Old Alluvium on the location of the collapse.
• No variation in soil profile was taken into account in the design, while the soil profile considerably varied along the length of the tunnel and the two opposite sides of the walls (north/south). Also the curvature of the excavation was not accounted for.
• The design was not correct in using effective stress parameters (c’ and phi’) to simulate undrained behaviour. This overestimated the undrained shear strength of the clay. This overestimation leads to an underestimation of the wall deflection and bending moment by a factor of 2 and strut load by a factor of 1.1.
• The design and construction of the struts was not sufficiently robust. The walers were not continuous and single stiffener plates were used on some locations where double plates were designed. From strut level 7 and downwards another type of stiffener was used, the C-channel, which proved more sensitive to buckling, which was thought to have been the initiator of the collapse.
• Back analysis during construction because of the much higher wall deflections was performed based on the design calculations, so no changes have been made in soil profile or actual strutting etc. In the back analysis it was wrongly assumed that the soil stiffness was overestimated instead of the soil strength due to the wrong calculation method.
• The design was not performed by sufficiently qualified engineers and not reviewed properly as well.
Davies adds that the monitoring system, with strain gauges measuring the strut loads, could not be relied on in absolute sense.

1001307-004-GEO-0002, Version 02, 26 November 2009, final
Deformations and damage to buildings adjacent to deep excavations in soft soils
97
4.6.4 Cause of the collapse The official report (COI, 2005) concluded that the collapse occurred as a result of two primary errors: • The under-estimation of the soil loads applied to the diaphragm wall (which had been
calculated using what was known as ‘Method A’-see below) • The under-design by a factor of 2 of the waler/strut connection at level 9, and the
inability of the overall system to redistribute loads after its failure. The under-design was independent of the under-estimation of soil loads (it arose from the omission of assumed splayed ends to the struts and a misinterpretation of BS5950) but had the effect of eliminating any spare capacity.
There were also a number of significant contributory factors, most extensively explained by Simpson et al. (2008): • Failures in data collection, such as the fact that the wall penetration into the Old
Alluvium was 1.5 m instead of the designed 3 m. An important piezometer was not replaced after it was broken and no-one checked the strain level in the Jet Grout Struts although it exceeded the design limit.
• There was a lack of design reviews to modify or verify the design as was necessary. This is shown by the fact that the safety factor on the strut load was too low, the design did not incorporate the loss of function of a single strut and the two main causes stated above.
• The back analysis process was inadequate; it did not use the right modelling (see method A/B discussion) and the wall’s toe stability was not checked properly.
• Triggers levels were not set for each phase but for the maximum overall and work progressed even though trigger levels were exceeded. The brittle behaviour of the structural elements was not recognized.
Other contributory factors were the 25% increase in strut load because more than 4 bays of struts were open (double the designed length was unsupported) and possible lift of the soldier piles at mid span of the struts.
4.6.5 Method A versus Method B The investigations (Magnus et al., 2005) reported that the Finite Element Analysis (FEA) made for the design of Nicoll Highway was incorrect. Method A was used instead of method B, which leads to an overestimation of the undrained shear strength. This section describes the background and differences of both methods. In the case of Nicoll Highway the soil in the FEA was modelled as elastic-plastic with the shear strength defined by the Mohr Coulomb criterion and the soil was treated as ‘undrained’. Method A refers to the soil behaviour being described with effective stress parameters (c’ = 0 kPa and ’ is a certain value). In method B the undrained shear strength used is taken directly as c = cu in kPa and ’=0 degrees). How does Plaxis handle method A? According to the Plaxis manual (Plaxis, 2009) the effective parameters G and ' are transferred into undrained parameters Eu and u according to:
)2G(1 E uu with )'1(21)'1('
u

1001307-004-GEO-0002, Version 02, 26 November 2009, final
Deformations and damage to buildings adjacent to deep excavations in soft soils
98
K'
K *
3n1 µ w with
)'2-3(1E' K'
where u stands for undrained and n is the porosity. Kw is the bulk modulus of water, which is automatically added to the stiffness matrix of the soil element. In the FEA for Nicoll Highway the mobilized undrained strength was higher than in reality, because an undrained stress path was followed, see Figure 4.31.
Figure 4.31 Effective stress path undrained analysis method A versus reality (Plaxis, 2009) Even if a more advanced model was chosen (which would have been more appropriate, such as the Plaxis HS model) a stress path between reality (2) and MC model (1) would have been found, with a potential for unrealistic shear strengths. As a consequence, the ratio of cu/ ’v in the FEA was 40% higher in method A than it would have been if method B was used, leading to an underestimated wall deformations, moments and strut loads. See Figure 4.32.

1001307-004-GEO-0002, Version 02, 26 November 2009, final
Deformations and damage to buildings adjacent to deep excavations in soft soils
99
Figure 4.32 Consequences of method A versus B (Simpson et al., 2008)
4.6.6 Lessons learned The key lessons to be learned from this event are (COI, 2005): • Trends during critical periods must be capable of being monitored. • Those interpreting the outputs must be competent to do so. The dangers of drawing
conclusions from past behaviour, without careful consideration of the actual conditions, must be recognised.
• The management of uncertainty must be robust. There must be approved and tested contingency plans.
• Those involved must be competent at both organisational level and individual level • The project must operate within a safety culture conducive to safe working. This means,
inter alia, • a ‘stop work’ procedure to be in place, clearly understood by all, and supported by
management • Clarity in the chain of command and in responsibilities Yong and Teh (2006) and Simpson et al. (2008) recommended the following to be implemented in the practice of civil engineering projects: • design reviews should be performed by experienced engineers • elements that perform outside limits are unsafe unless carefully reviewed • impose on design requirements and check design conditions/assumptions are met • robust design of the system, with margins for information that is not complete • back analysis should take all information into account • monitoring and trigger levels should be set per stage and regular readings according to
the specifications should be taken at all times • plan for emergency.

1001307-004-GEO-0002, Version 02, 26 November 2009, final
Deformations and damage to buildings adjacent to deep excavations in soft soils
100
4.7 Conclusions from case studies This collection of case studies shows that the topic of soil-construction interaction in case of deep excavations in soft soils needs improvements in the way damage indicators are handled and in the analysis of measurements of soil-construction interaction. Deep excavation effects Settlements due to diaphragm wall installation are significantly influenced by the stability of the trench. Installation of several panels close to each other in a short time and/or high ground water pressures during construction will increase the ground displacements behind the wall. Deep excavations and the adjacent buildings are never two dimensional. The three-dimensional behaviour may cause a reduction in deformations (if a stiff corner and support system is in place) or an increase (see Chapter 5) and certainly a larger differential settlement. The case studies presented confirm the general trends presented in Chapter 3 that for stiff clays, residual soils and sands Clough and O’Rourke (1990) suggest a maximum horizontal wall deflection of about 0.2% H and for soft clays up to 1-2% H, reaching to a distance of 2 times the excavation depth. Warde School, Chicago: wall deflection is 0.23% H (excavation only) and 0.41% H after
total construction Chater station, Hong Kong: wall deflection is 0.15% H (excavation only), building
settlements are 0.7% after total construction KPE, Singapore: wall deflection is 0.1%H (excavation only), ground settlements behind
the wall are 0.2%H after total construction. The failure of Nicoll Highway proved that deformations exceeding 1% are potentially dangerous. The ratio between the wall deflection and the settlement behind the wall in these cases falls within the general band of 0.5-1.5. In special circumstances (such as extreme ground-water lowering outside the excavation) this ratio might increase. The settlement trough of these cases extends to 1-2 times the excavation depth from the wall. The Chicago case showed that based on building deformations the settlement through width remained constant at about the length of the retaining wall. This effect was not found in the other cases. The cases proved that actual green field displacements were in general larger than the predicted ones, mainly caused by installation effects, ground-water lowering or other effects not accounted for. The effect of the excavation itself is generally predicted rather well (again except Nicoll Highway). The three-dimensional behaviour of the excavation and the building resulted in smaller deformations close to the corners (even at the inward corner) of the excavation. Damage to the building Most damage to buildings can be explained by the curvature of the building, but if several stiff building units or parts are flexibly connected rigid body tilt can cause substantial damage as

1001307-004-GEO-0002, Version 02, 26 November 2009, final
Deformations and damage to buildings adjacent to deep excavations in soft soils
101
well. If buildings are homogeneous taking into account rigid body tilt may limit the damage expected. Relative rotation and deflection ratio give similar results as indicators for damage if they are calculated in a similar way. This means that hogging and sagging parts of a building should be separated and tilt included if this is present. For relative rotation this is not straightforward, but can be done in an objective manner. Presentation of a continuous value of damage indicators along a building does not mean much and should be avoided. The difference in using relative rotation and deflection ratio is smaller than indicated by most authors. The importance of rigid body tilt and the length of the building considered are on the other hand larger than is usually found in literature. The ratio of /L versus is often larger than the range of Boscardin and Cording (1989). Sometimes this can be explained by incomparable calculation assumptions, but this is not always the case. Soil-structure interaction There are very few cases available with both green field and building deformations, especially for buildings founded on piles. The limited evidence available shows that the assumption that the building follows the deformations of the pile toe level worked well. There is an even greater lack of case histories with sufficient data on horizontal deformations of the building compared to green field and subsoil deformations. Depending on the amount of horizontal strain in the building, the damage category expected may vary over more than one category. This collection of case studies shows that the topic of soil-construction interaction in case of deep excavations in soft soils needs improvements in the way damage indicators are handled and in the analysis of measurement of soil-construction interaction. Improvement in the way the damage indicators are handled might be possible if the following method is used when assessing building damage: 1 Determine deformation mode of the building. This includes the assessment of rigid body
tilt. If the end of the building remains horizontal as can be the case for long buildings, tilt is usually small. In all other cases, tilt reduces the curvature of the building.
2 Separate the building in hogging and sagging parts 3 Determine damage indicator per building part (not continuous):
For deflection ratio: see Burland and Wroth (1974) or section 3.3.7 For relative rotation: determine at beginning and end of building part; if
deformation shape is irregular, use Figure 4.14. Note: the use of the minimum value of relative rotation as suggested by Netzel (2005) should be limited to smooth or Gaussian shaped deformations.
4 Calculate tensile strains from Mair et al. (1996) or Son and Cording (2005) 5 Determine damage category. From the failure at Nicoll Highway a lot can be learned for design and monitoring of deep excavations. The lessons include the importance of interpretation of monitoring data, the need for competent design review teams, robustness in the construction ánd management process and complete clarity in responsibilities. Above all it is necessary to have a procedure in place, understood and supported by all, to stop work if necessary.

1001307-004-GEO-0002, Version 02, 26 November 2009, final
Deformations and damage to buildings adjacent to deep excavations in soft soils
102
The use of the undrained analysis with effective stress parameters should be avoided in future designs, or at least the mobilized shear strength should be checked against the values taken from the field and laboratory tests. More in general, it is important to understand the limitations and procedures in software used for design practices. With increasing complexity in design as well as in the possibilities of supporting software tools, this is not easy to be solved. Review teams therefore should include experts with experience in these fields.

1001307-004-GEO-0002, Version 02, 26 November 2009, final
Deformations and damage to buildings adjacent to deep excavations in soft soils
103
5 Building damage assessment procedures
5.1 State of the art To assess the amount of damage expected in adjacent buildings the step wise approach after Mair et al. (1996) can be followed. Step 1: => determine green field ground movements, both vertical and horizontal Step 2: => determine potential damage, assuming no interaction and full transfer of deformations to the buildings. => If the expected damage does not exceed the numbers given by Rankin (1988), being a rotation of the building of not more than 1:500 and/or absolute settlement of 10 mm, negligible damage is to be expected. If the expected damage exceeds these values, proceed to step 3. Step 3: Interaction calculation => In a more detailed assessment the damage can be predicted either directly with more advanced damage indicators (such as described in section 3.4.2), or by including the interaction of the building with the soil. This will include the following sub steps:
- project green field ground movements on to the building - determine strains in building, using fictitious beam model - optional: account for current initial state of building, foundation - optional: include the effect of building stiffness and project the resulting
deformations on the building. - classify damage related to strain levels (negligible, very slight, slight,
moderate, severe, very severe) => Check whether the damage level is acceptable by using damage criteria according to Burland et al (1977). If the predicted level is not acceptable, the calculation can be repeated including mitigative measures either in the soil or at the building, change of construction methods, and/or a more detailed analysis.
5.2 Dutch practice Dutch code NEN6740 (NEN, 2006) gives recommendations for the construction of new buildings based on relative rotations and tilt. Both are not allowed to be larger than 1:300 for serviceability reasons (previous norms also included values for structural damage to be not smaller than 1:100). Horizontal displacements should not be more than about 0.05 m. These values are recommendations and can be altered by the structural engineer in case this is necessary. For piled foundations differential settlements of at least 33% of the average total settlement should be expected, unless an interaction calculation proofs smaller differences or in case of stiff buildings. For shallow foundations at least 50% of the average settlement calculated should be expected between two elements of the foundation. No distinction is made between frame buildings and load bearing walls.

1001307-004-GEO-0002, Version 02, 26 November 2009, final
Deformations and damage to buildings adjacent to deep excavations in soft soils
104
Figure 5.1 Definitions of relative rotation and tilt from NEN6740 For damage due to lowering of ground water more extensive assessments are recommended in the guideline from SBR (2007). Current practice is that usually no structural damage would be allowed during lowering of the ground water table, this means that some architectural damage could be experienced in case this could not have been foreseen. No normative values are presented. As a damage indicator the relative rotation is used in combination with maximum settlement difference and tilt. See for definitions Figure 5.2.

1001307-004-GEO-0002, Version 02, 26 November 2009, final
Deformations and damage to buildings adjacent to deep excavations in soft soils
105
Figure 5.2 Definitions used in Dutch guideline for damage related to ground water lowering (SBR 2007) Recommended maximum values include relative rotations according to Skempton and MacDonald (1956) noted as ( /l)max. Also deflection ratio /L can be used. For frame buildings with infill walls the following values are recommended:
/l)max. = 1:150 for structural damage /l)max. = 1:300 for architectural damage /l)max. = 1:500 safer limit for architectural damage
These values should be used in case L/H 3 and bending is the most important mode of deformation. For L/H < 3 and shear deformation stricter values should be used in the order of
/L = 1/1200 or ( /l) = = 1/600. For load bearing walls the following values are recommended for architectural damage, since the 1:300 value of Skempton and MacDonald (1956) is not considered safe enough.
/l)max. = 1:750 for sagging /l)max. = 1:1000 for hogging
Maximum settlement and settlement differences taken from Skempton en MacDonald (1956) for new buildings, mostly frames, are: Limit for architectural damage
Piles and elements Piles and strips
sand Clay Sand clay max. settlement max [mm]
50 75 50-75 75-125
max. diff. Settl. max [mm]
30 45 30 45
Table 5.1 Maximum settlements from Skempton en MacDonald (1956) Burland’s table of criteria is used in this guideline to distinguish between the different categories of damage (Burland et al 1977). Several factors may influence the sensitivity of a building to deformations.

1001307-004-GEO-0002, Version 02, 26 November 2009, final
Deformations and damage to buildings adjacent to deep excavations in soft soils
106
- Since existing buildings are more flexible than new building, they are less able to redistribute stresses. The current state of the building should also be considered. If the current state is already badly damaged, criteria should be 25% more strict. The criteria do not need adjustment for reasonable states and could be relaxed by 40% for good current conditions.
- Deep ground displacement (such as caused by lowering of ground water in deep acquifers) will cause more gradual deformations. For the same surface settlement, the damage expected for deep influences will be about 2/3 of the shallow influences.
- Quick deformations are more likely to cause damage than slow deformations, because creep of the building material can not occur. For fast settlements (over 70% of settlements in first year) damage criteria should be decreased by 20%. For slow settlements (only 10-15% in first year) criteria can be relaxed by 35%.
It is clear that current Dutch guidelines and norms give fairly simple criteria for damage related to deformations and are not specific for deep excavations. These guidelines could be improved by taking into account the horizontal deformations, the tilt of the buildings and the length/height of the buildings.
5.3 Important factors for damage assessment procedures Based on the literature of Chapter 3 and the damage assessment procedures from this Chapter, an overview has been made of these procedures and their sub steps. The proposed scheme intends to integrate all different aspects of damage assessment procedures and present the different option available for the assessment. Furthermore it makes it clear that the total procedure may be iterative until the required maximum damage level is found that would still be acceptable.

1001307-004-GEO-0002, Version 02, 26 November 2009, final
Deformations and damage to buildings adjacent to deep excavations in soft soils
107
Figure 5.3 Overview of damage assessment procedure aspects and parameters The scheme is used as a basis to further study the parameters that govern the outcome of all the steps in the damage assessment procedure. The scheme, presented in Figure 5.3 forms the basis for further research as described in Chapter 7.

1001307-004-GEO-0002, Version 02, 26 November 2009, final
Deformations and damage to buildings adjacent to deep excavations in soft soils
108
6 Data set collection
6.1 NoordZuidlijn project In Amsterdam a 9.5 km long new metro line is under construction, of which 3.8 km is built underground by two bored tunnels with three large cut and cover stations in the historic centre, the Noord/Zuid Metroline.
Figure 6.1 Overview of the Noord/Zuidlijn and its stations (Picture Projectbureau NoordZuidlijn)

1001307-004-GEO-0002, Version 02, 26 November 2009, final
Deformations and damage to buildings adjacent to deep excavations in soft soils
109
6.1.1 Rokin Station Rokin Station is the first of the Deep Stations for the North South metro Line in Amsterdam, coming south from Central Station. The station is 24.5 m wide and reaches a maximum depth of NAP -26 m. It is built by means of a top down construction, with 1.2m thick diaphragm walls extending to a depth of NAP -39 m. Adjacent buildings are found at 3.0m from the diaphragm wall or further away.
Figure 6.2 Cross section of Rokin Station (Driesse et al 2008)

1001307-004-GEO-0002, Version 02, 26 November 2009, final
Deformations and damage to buildings adjacent to deep excavations in soft soils
110
Fill Holocene 1st sand layer Allerod 2nd sand layer Eem clay
Sand layer Glacial clay
6.1.2 Vijzelgracht Station Vijzelgracht Station is the second of the Deep Stations for the North South metro Line in Amsterdam. The station is 250 m long, 22 m wide and reaches a maximum depth of NAP -29.5 m. It is built by means of a top down construction, with 1.2m thick diaphragm walls extending to a depth of NAP -44.5 m. Adjacent buildings are found at 3.2m from the diaphragm wall or further away.
Figure 6.3 Cross section of station Vijzelgracht (Projectbureau NoordZuidlijn)

1001307-004-GEO-0002, Version 02, 26 November 2009, final
Deformations and damage to buildings adjacent to deep excavations in soft soils
111
6.1.3 Ceintuurbaan Station Ceintuurbaan station is the third deep station (starting from Central Station), it is 220 m long and is the narrowest station of only 10.5 to 11.5m wide. The maximum excavation depth is NAP-31,1m to -31,4m.
Figure 6.4 Cross section of station Ceintuurbaan (Projectbureau NoordZuidlijn)
6.2 Typical Dutch and Amsterdam Soil conditions Subsoil conditions in The Netherlands can be characterised as soft soils. The Western part of the country consists mainly of soft clays and peat for up to 15 to 20 m, overlaying Pleistocene sand and clay deposits. The Eastern part of the country and some river and estuarine areas consist of fine to coarse, often silty sands. Typical for Amsterdam are the alternating clay and sand layers, starting with a man-made top layer, followed by Holocene clay and peat to a level of about NAP –12.5m (ground level around NAP +1.5m). Then the “first sand layer”, as it is called is found, from NAP – 12.5m to NAP – 14/ -15m, beneath which lies a 2.5m thick sandy silt stratum (the Allerod). The 2nd sand layer is found at about NAP –17/-18m, extending to NAP –25.5m. Below the 2nd sand layer a stiff clay layer of around 15m thickness (the Eem clay) is found. The water table is approximately 0.5m to 1.5m below ground level in the Western part of the country in general. In Amsterdam the phreatic level is NAP-0.5m. The first and second sand
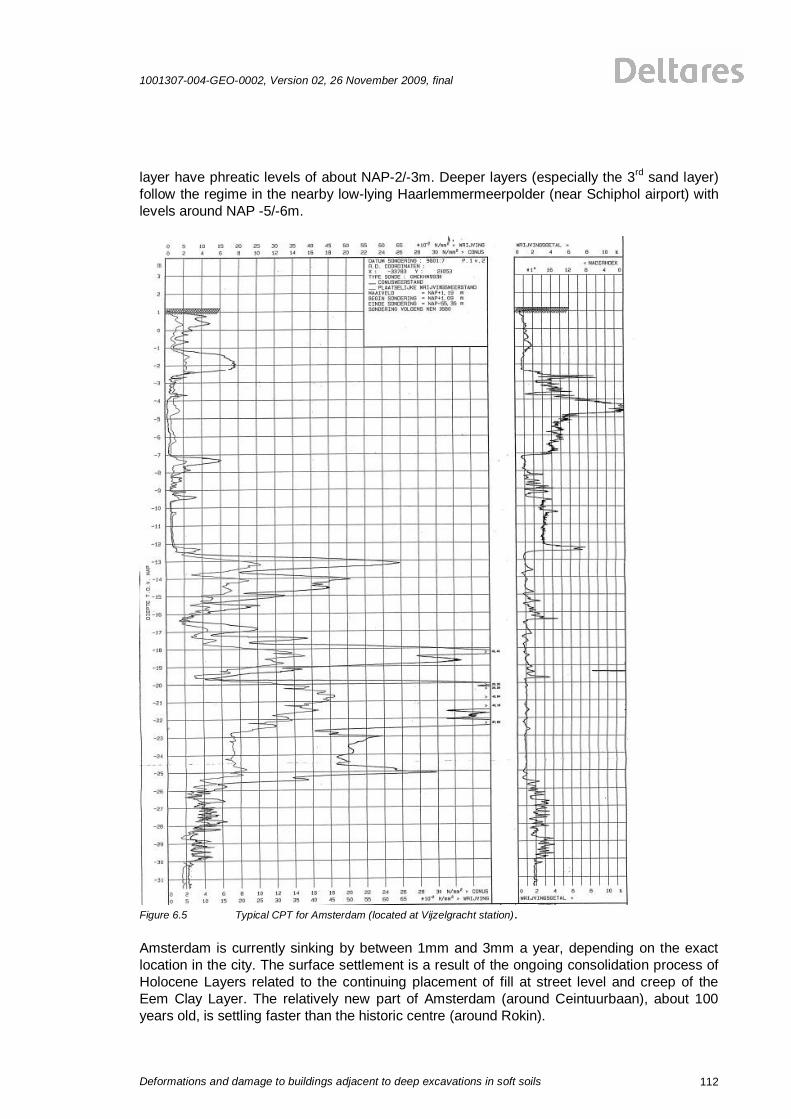
1001307-004-GEO-0002, Version 02, 26 November 2009, final
Deformations and damage to buildings adjacent to deep excavations in soft soils
112
layer have phreatic levels of about NAP-2/-3m. Deeper layers (especially the 3rd sand layer) follow the regime in the nearby low-lying Haarlemmermeerpolder (near Schiphol airport) with levels around NAP -5/-6m.
Figure 6.5 Typical CPT for Amsterdam (located at Vijzelgracht station). Amsterdam is currently sinking by between 1mm and 3mm a year, depending on the exact location in the city. The surface settlement is a result of the ongoing consolidation process of Holocene Layers related to the continuing placement of fill at street level and creep of the Eem Clay Layer. The relatively new part of Amsterdam (around Ceintuurbaan), about 100 years old, is settling faster than the historic centre (around Rokin).

1001307-004-GEO-0002, Version 02, 26 November 2009, final
Deformations and damage to buildings adjacent to deep excavations in soft soils
113
6.3 Typical Dutch buildings and foundation types Most buildings in The Netherlands are built from masonry and/or concrete. Three types of constructions are common:
- old building (from 1600-1900) with masonry walls, wooden floors and timber pile foundations. This type of building is common in the older inner cities, such as Amsterdam and Rotterdam.
- recent building for 1-4 storey houses, made of concrete walls and floors, prefabricated concrete or steel piles and usually a roof that is a little lighter, for example made of wood and tiles.
- recent building (more than 3 storeys), made of concrete or steel frames with infill walls and usually prefabricated concrete floors. Foundations are usually deeper than in the other cases.
Figure 6.6 Typical historic buildings in Amsterdam Historic buildings in Amsterdam usually have a foundation of timber piles to the First Sand Layer (Eerste Zandlaag). Before the 16th century, foundations were made with shorter wooden piles, either just 1-5 meter (friction piles) or about 8 m long reaching in a thin sand layer called the “farmers’ sand”. No known foundations of this type have been found along the Stations Vijzelgracht and Ceintuurbaan.

1001307-004-GEO-0002, Version 02, 26 November 2009, final
Deformations and damage to buildings adjacent to deep excavations in soft soils
114
Figure 6.7 Traditional Foundation before 16th century in Amsterdam The wooden piles are installed in pairs with 0,8m between the pairs. Average diameter of the piles is 180 mm or according to a historic source (Zantkuyl, 1993) not less than 200 mm at the thicker end or 85 mm at the thin end”. Over each pair a cross beam is laid with a thickness of about 3 ‘thumbs’ (old Dutch measure, equivalent of an inch, about 0.025 m). Cross beams have been used since the second halve of the 17th century. Over these cross beams foundation planks of 4 thumbs thick are installed to spread the weight of the wall over the piles. Since the 18th century a piece of quartersawn timber was used to prevent shifting of the masonry wall (see Figure 6.8)
Figure 6.8 Typical Amsterdam piles system Buildings built between 1860 and 1925 usually have a so-called Amsterdam foundation with the double row of piles as shown in Figure 7.8. Buildings between 1920 and 1940 usually have a single row of piles with a reinforced concrete beam on top. Based on several pile load tests in the historic centre it is known that the wooden pile foundations have low factors of safety of around 1.0, mainly due to negative skin friction.

1001307-004-GEO-0002, Version 02, 26 November 2009, final
Deformations and damage to buildings adjacent to deep excavations in soft soils
115
As piling technology developed the more recent structures tend to have concrete or steel piles which are installed to the deeper, more stable 2nd sand layer. Some major structures even have deeper piles founded on the 3rd sand layer. All buildings in the influence zone of the NoordZuidlijn have been surveyed and categorized in four different quality classes based on the state of the foundation. Quality class Criterium Class I Casco-foundation good;
Time to renewel at least 40 year. Class II Casco-foundation good or reasonable;
Time to renewel at least 25 year. Class III Casco-foundation moderate;
Time to renewel at least 15 year. Class IV Casco-foundation in bad condition;
Unacceptable settlements may occur any time. No advised time to renewel. No immediate need to demolish unless stated.
Table 6.1: Quality class for Amsterdam foundations (from city of Amsterdam) Due to the constant sinking of Amsterdam as a whole, buildings will settle even without construction effects. This effect is called the ‘background settlement’ and is a result of two separate phenomena:
- Settlement of the foundation layer, usually the First Sand Layer, a result of creep of the Eem Clay Layer.
- Piles subjected to negative skin friction related to the constant compression of the Holocene Layer.
This effect is important while studying deformations due to construction activities.
6.4 Monitoring system NoordZuidlijn
6.4.1 Overview In order to determine the displacement of the historic structures along the deep stations an extensive, mostly automatic monitoring system is installed in the city centre. Robotic total stations measure prisms attached to the façades in the influence zone. The displacement of the prisms is measured in three directions (x, y and z). In order to handle the large amount of monitoring data software applications have been developed by the client. The applications use the Geographical Information System (GIS) as user interface. The GIS has been developed to store, analyse, structure and visualise the data used in settlement risk management. From each building within the influence zone numerous facts are stored, such as state of the foundation, photograph of the original state with prism locations, owner details and details of its use. General data stored in the system include settlement predictions, settlement risk assessment studies, defect studies and site investigations.
6.4.2 Monitoring of adjacent structures An automatic or primary monitoring system follows the buildings in the influence zone of the project. Each robotic total station monitors about 50 to 100 prisms. Each building has at least 4 prisms attached to it. Besides the monitoring of the structures four arrays of underground instrumentation are installed around each deep station. This instrumentation consists of

1001307-004-GEO-0002, Version 02, 26 November 2009, final
Deformations and damage to buildings adjacent to deep excavations in soft soils
116
automatic extensometers and inclinometers as well as piezometers. The robotic total stations are attached to the front and side facades of the buildings. These buildings are selected for their good quality foundation, but are in the influenced zone, and are therefore related to stable prisms outside the construction area as reference targets. The required accuracy of the measurements in the contract is 0.5mm over 75m distance. Each prism is measured by at least 2 total stations. Primary Instrumentation comprises in total:
- 74 Robotic total stations (RTS) installed on key building facades, which take readings from 7500 prisms on over 1200 buildings, bridges and quay walls.
- Levelling of ground monitoring points, over 2000, along the tunnel trace. - Remotely monitored sub-surface instruments (inclinometers, extensometers and - Piezometers) up to a depth of 75m maximum to reach the 3rd sand layer.
Measurements made with the RTS are related to stable reference points outside the zone of influence, with their foundations either in the second or third sand layer.
Figure 6.9 Robotic Total Station Secondary instrumentation comprises of precise levelling points installed on structures being monitored primarily by robotic total stations. Precise levelling is made to deep datums in the Third Sand Layer outside the zone of influence, extensometer heads, building leveling points and common prisms/levelling points. At the start of the project there have been some problems with the accuracy of the manual leveling points, which contractually should be 1.0mm maximum. The secondary system is mainly used as a backup system and not measured regularly. Prisms are located on the fronts and the sides of the buildings, usually a minimum of 4 per building.
6.4.3 Subsurface measurements For each station four measurement arrays are installed with sub surface monitoring by means of extensometers and inclinometers. The extensometers (see Figure 6.10) have packers fixed at several depths. The displacement of the packers is monitored precisely relating fiberglass

1001307-004-GEO-0002, Version 02, 26 November 2009, final
Deformations and damage to buildings adjacent to deep excavations in soft soils
117
sticks leading freely to the top of the instrument with a reference block. This reference point itself is regularly checked against the deepest anchor to obtain absolute displacements.
Figure 6.10 Extensometer (left) and illustration of measurement system (right) Automatic inclinometers are placed along the same locations and depths of the extensometers.
Figure 6.11 Location of inclinometers and extensometers at array 13440 at Station Vijzelgracht
6.4.4 Example of monitoring results For the first stages of the construction activities around Ceintuurbaan station, green field and building deformations have been compared. This analysis is mainly performed to judge whether the monitoring data is sufficient to perform further analysis in the future. The construction activities at the location consisted of preparing the terrain (raising it by 1m) and construction of the diaphragm wall panels. Green field deformations are measured in the middle of some narrow side streets, while building deformations are measured by the total stations along the building facades.

1001307-004-GEO-0002, Version 02, 26 November 2009, final
Deformations and damage to buildings adjacent to deep excavations in soft soils
118
Figure 6.12 Location of arrays 13440 and 13110 at Ceintuurbaan Station
CB13044 W verticalFB90/92
-70
-60
-50
-40
-30
-20
-10
0
1005101520253035
distance from excavation m
Veric
al d
ispl
acem
ents
mm
north facade z (III,II)south facade z(II,III)extenso surfaceextenso 1st sand layersurface manual 08/06surface manual 04/07
Figure 6.13 Example of comparing green field and building deformations for array 13440 at Ceintuurbaan Station
(north/south) West of the Station.
13440
13110

1001307-004-GEO-0002, Version 02, 26 November 2009, final
Deformations and damage to buildings adjacent to deep excavations in soft soils
119
CB13044 E verticalFB69/71
-70
-60
-50
-40
-30
-20
-10
0
10
0 5 10 15 20 25 30 35
distance from excavation m
Veric
al d
ispl
acem
ents
mm
north facade z (R,III,II)south facade z (II,III)extenso surfaceextenso 1st sand layersurface manual 08/06surface manual 04/07
Figure 6.14 Example of comparing green field and building deformations for array 13440 at Ceintuurbaan Station
(north/south) East of the Station.
CB13110 W verticalFB118/120
-70
-60
-50
-40
-30
-20
-10
0
10
05101520253035
distance from excavation m
Ver
ical
dis
plac
emen
ts m
m
north facade z (R)south facade z (R, II)extenso surfaceextenso 1st sand layersurface manual 08/06surface manual 04/07
Figure 6.15 Example of comparing green field and building deformations for array 13110 at Ceintuurbaan Station
(north/south) West of the Station.

1001307-004-GEO-0002, Version 02, 26 November 2009, final
Deformations and damage to buildings adjacent to deep excavations in soft soils
120
CB13110 E verticalFB93/95
-70
-60
-50
-40
-30
-20
-10
0
10
0 5 10 15 20 25 30 35 40 45
distance from excavation m
Veric
al d
ispl
acem
ents
mm
north facade z (II,IV)south facade z (III,II)extenso surfaceextenso 1st sand layersurface manual 08/06surface manual 04/07
Figure 6.16 Example of comparing green field and building deformations for array 13110 at Ceintuurbaan Station
(north/south) East of the Station. Conclusions from the above figures are:
- It is possible to relate the building deformation to the green field deformation at various depths
- The buildings do not follow the green field deformation, so they are not completely rigid
- The buildings settle more than the foundation layer (1st sand layer), but less than the surface.
- Each house of about 5 m wide has just 2 settlement points, this is not enough to calculate bending within a building, but since the houses are built in a row, curvature of the whole row can be derived.

1001307-004-GEO-0002, Version 02, 26 November 2009, final
Deformations and damage to buildings adjacent to deep excavations in soft soils
121

1001307-004-GEO-0002, Version 02, 26 November 2009, final
Deformations and damage to buildings adjacent to deep excavations in soft soils
122
7 Plan for future research
7.1 Conclusions from literature survey and cases In summary of Chapters 3 and 4, the following conclusions are drawn from the literature survey and cases presented, relating to the damage of buildings due to excavation-induced deformations.
7.1.1 Green field displacements Several, mostly empirical, relationships are available for predicting green field displacements. The shape of the settlement trough is most clearly related to the shape of the deformed wall and the soil type. Other important aspects are the relative flexibility or stiffness of the system (wall and supports) compared to the soil stiffness and the safety against basal heave. From the present state of the art one should expect for a deep excavation in soft –stiff clay: • Wall deflection 0.5 – 1.0% (for an average system stiffness and sufficient basal stability) • Better results are possible (0.2-0.5%H) for diaphragm walls with good supports, as long
as the excavation effect is the main cause and installation and other effects are controlled sufficiently.
• Settlements behind the wall are about the same as wall deflections and may reach over a distance of 0.75H from the wall and decrease to 0 at 2-3H away from the wall.
• 50%-100% margins should be expected around the values presented. • Displacements are usually mainly of the hogging type, although for multi-propped
excavations the spandrel deformation leads to a sagging zone close to the wall. Usually the actual wall deformations are predicted within 25-50% of the measured values. The effect of the excavation itself is generally predicted rather well, deviations are usually related to the details of the construction process, such as the installation of struts and anchors. Settlements behind the wall are often under predicted, mainly caused by larger installation effects, ground-water lowering or other effects not accounted for. Due to empirical nature of the relationships, a large variation in wall type, excavation depth, soil type, workmanship, and other conditions only wide ranges of settlements can be derived for design purposes. Empirical methods have shown that the deformations to be expected depend very much on the soil type and the type of construction. For soft clays Moormann and Moormann (2002) show that little improvement has been made in the amount of settlements behind the wall compared to the early work of Peck (1969) and that displacements in the range of 1% of the excavation depth should be expected. Displacements due to the installation of diaphragm wall can be limited to 5-10 mm for high factors of safety against trench instability, but increase significantly for lower stability factors. Installation of several panels close to each other in a short time and/or high ground water pressures during construction will increase the ground displacements behind the wall. Deep excavations and the adjacent buildings are never two-dimensional. The three-dimensional behaviour may cause a reduction in deformations (if a stiff corner and support system is in place) or an increase and certainly a larger differential settlement. Empirical work indicates effects of up to 40-50%, but only 3D FE-models can provide some more detailed insight.

1001307-004-GEO-0002, Version 02, 26 November 2009, final
Deformations and damage to buildings adjacent to deep excavations in soft soils
123
7.1.2 Building deformations and damage Damage in structures is not only related to construction, also temperature, creep and shrinkage are major attributes. Deformations due to construction activities have to be separated from effects of self-weight, temperature, moisture content etcetera.
The relationship between cracks or crack width and strains in a building depends on several aspects, such as material details, building dimensions and deformation modes. Usually low values of tensile strains (0-0.05%) are used as the onset of cracking. Most damage to buildings can be explained by the curvature of the building. Buildings that rotate rather than bend or shear experience less damage, except if several stiff building units or parts are flexibly connected and separated due to the rigid body tilt. If buildings are homogeneous taking into account rigid body tilt may limit the damage expected. This makes tilt an important parameter when discussing excavation induced damage and it should always be made clear exactly in what way tilt is considered. Even with equal deformations, some buildings are more susceptible to damage than others:
- Buildings with deep foundations are more sensitive to intolerable displacements Tolerable relative rotations and settlements for deep foundations are about half those for shallow foundations.
- Frame structures can accommodate differential displacements by deformation of the beams, whereas load bearing walls need to bend, which leads to a 20-25% lower tolerable relative rotation and settlement for load bearing walls.
- Buildings subjected to relatively fast deformations such as construction activities are more susceptible to damage than in case of slow deformations
- Buildings with structural discontinuities - Building subject to hogging shaped deformations are usually more damaged than in
sagging shapes. Damage can be assessed by using several damage criteria. The use of relative rotation and deflection ratio are both widespread, but also widely discussed. Relative rotation is favoured more for shear deformation and deflection ratio more for bending deformation. Some authors prefer one of the methods for simplicity of the calculation. Relative rotation and deflection ratio give similar results as indicators for damage if they are calculated in a similar way. This means that hogging and sagging parts of a building should be separated and tilt included if this is present. For relative rotation this is not straightforward, but can be done in an objective manner. Presentation of a continuous value of damage indicators along a building does not mean much and should be avoided. The adverse effects caused by rigid body tilt are often neglected, but can be significant. The ratio of /L versus is often larger than the range of Boscardin and Cording (1989). Sometimes this can be explained by incomparable calculation assumptions, but this is not always the case.
7.1.3 Soil-structure interaction Soil-structure interaction for excavation-induced deformations means that depending on the relative stiffness of the building and the interface between soil and building, the deformations will be modified from the green field conditions. Modelling this effect with both soil and building in a combined calculation is still not well developed. So-called coupled models either have simple soil models or simple building models. Full non-linear coupled models are not expected in short notice.

1001307-004-GEO-0002, Version 02, 26 November 2009, final
Deformations and damage to buildings adjacent to deep excavations in soft soils
124
Not much is known about the influence of the foundation in this respect. The interface between the soil and the building depends on the foundation type. The working hypothesis for predictions made with piles next to tunnelling or deep excavations can be summarized as:
- Piles tend to follow the lateral soil deformations with only limited effect of the lateral stiffness.
- Piles in groups tend to move less laterally than single piles, even if they are not connected at the pile head.
- Horizontal building movements will follow the movement at the pile head, but may be restricted due to interface friction between the foundation slabs/floors and the soil. Rough interfaces transfer a larger amount of soil strains and displacements to the building than smooth interfaces.
- Vertical settlements for end-bearing piles generally follow the deformation of the foundation layer, if they have enough capacity to take any additional negative skin friction that may develop.
- If the end-bearing piles do not have enough capacity, any additional negative skin friction will cause settlement of the pile in addition to the settlement of the foundation layer. The pile will follow the soil deformation at the depth relating to the neutral point along the shaft (where negative and positive skin friction meet).
- Vertical settlements for friction piles are usually equal to the soil settlements. These can differ from true green field conditions caused by a stiffening effect due to the presence of the pile.
7.2 Research questions from literature survey and cases Based on the conclusions from section 7.1 a selection is made for the questions that will be studied in the second part of the study. The objective is to find a general method to assess excavation induced building damage for soft soil conditions. The main question is: What kind of modelling and/or measurements do we need to predict the behaviour of one or more buildings when a deep excavation will be constructed? Sub questions to be answered in the study are:
- What is the difference between the predicted and measured influence of deep excavations on soil surface, deeper soil levels and buildings? This must be related to the different construction phases.
- Which assessment method fits best with the measured deformations of the surface and the building?
- What is the effect of the type of the foundation on the amount of soil displacements transferred from soil to building?
- Can the building movements be determined by the level of the neutral point and if so, how can this point be determined?
- Which monitoring is suitable for the specific aims of following the behaviour of soil and construction in and outside the deep excavation?
- How and to what extent does the monitoring contribute to decision-making processes for mitigating measures during the construction process?

1001307-004-GEO-0002, Version 02, 26 November 2009, final
Deformations and damage to buildings adjacent to deep excavations in soft soils
125
Specific research questions for Amsterdam NoordZuidlijn project include: - How do the deformations and ground displacements around Ceintuurbaan and
Vijzelgracht station relate to the literature? Do they confirm trends given in this report? - Which factors determine the damage susceptibility in case of deformations due to
deep excavations based on a large number of influenced buildings in Amsterdam? - Which damage indicator fits the data of a large number of typical buildings in
Amsterdam best? Effects that will not be addressed in the future study are amongst others the effect of trench stability on diaphragm wall installation deformations, 3D effect at corners, damage to buildings due to other causes than deep excavations. Also coupled FEM models are not part of the study.
7.3 Analysis methods This report shows that the topic of soil-construction interaction in case of deep excavations in soft soils needs improvements in the way damage indicators are handled and in the analysis of measurements of soil-construction interaction. There is a need for good cases with monitoring data to compare green field and building deformations to study the soil-structure interaction effect. However, there are very few cases available with both green field and building deformations, especially for buildings founded on piles. There is an even greater lack of case histories with sufficient data on horizontal deformations of the building compared to green field and subsoil deformations. A detailed look is taken into the NoordZuidlijn project to obtain a full record of a case study of which many details will be available. In this case study a number of effects seen in the examples of Chapter 5 will be taken into account, such as the influence of movement of the reference prisms due to overall settlement, availability of monitoring prisms and bolts and ground displacements at several levels, including pile toe level and green field. The objective of the study is to validate the current models from this report using the monitoring data of the NoordZuidlijn project. A large number of buildings will be studied, as opposed to one building in detail. The data from the project will be compared to numerical analysis of the effects caused by deep excavations and analytical studies to the interaction between the soil, pile and building. Examples are shown in Chapters 5 and 6. The final part of the research will be into the aspects of the process surrounding the design and monitoring of deep excavations. This will be studied by reviewing the activities of the project itself, based on the observational method-like working method.
7.4 Activities for future research The rest of the research project is broken down into the following phases: • Data collection:
- Collect relevant monitoring data from Vijzelgracht and Ceintuurbaan • Numerical analysis:
- Describe Plaxis HS, Plaxis HS small and compare with other methods - Numerical prediction for Vijzelgracht/Ceintuurbaan Greenfield (Plaxis, 2D,
symmetric, HS small, model piles) - Prediction for Vijzelgracht/Ceintuurbaan for building damage

1001307-004-GEO-0002, Version 02, 26 November 2009, final
Deformations and damage to buildings adjacent to deep excavations in soft soils
126
- Make prediction for Amsterdam situation including building stiffness • Data analysis:
- Temperature effect on buildings for horizontal strains - Inverse modelling results - Include/extract time-dependent behaviour - deformations behind the wall - Effect of foundation type and quality
• Monitoring and process analysis: - Investigate and describe different types of monitoring - Define data needs - Analyse monitoring interpretation during construction - Describe possible improvements of monitoring at deep excavations
• Describe general method for deep excavation-soil-pile-building interaction: - Validation of existing models. - improvements based on Amsterdam situation for modelling - Comments on findings + recommendations. - Answer the proposed questions in chapter 2.2

1001307-004-GEO-0002, Version 02, 26 November 2009, final
Deformations and damage to buildings adjacent to deep excavations in soft soils
127

1001307-004-GEO-0002, Version 02, 26 November 2009, final
Deformations and damage to buildings adjacent to deep excavations in soft soils
128
8 List of references
Addenbrooke, T. I., Potts, D. M., Dabee, B. (2000). Displacement flexibility number for multipropped retaining wall design. Journal of Geotechnical and Environmental Engineering(8, August): 718-726. Augarde, C.E., Burd, H.J., Houlsby, G.T. (2005). The influence of building weight on tunnelling-induced ground and building deformation. Soils and Foundations 45(4): 166-167. Bentler, D.J. (1998). Finite Element Analysis of Deep Excavations. PhD thesis, Virginia Polytechnic Institute and State University. Bezuijen, A and Van der Schrier, J (1994). The Influence of a bored tunnel on pile foundations, Proc. Of Centrifuge 94; 681-686. Bjerrum, L. (1963). Allowable settlement of structures. Proceedings of the European Conference on Soil Mechanics and Foundation Engineering Wiesbaden, Deutsche Gesellschaft für Erd und Grundbau. Bles, T. J. and M. Korff (2007). Minder risico's met monitoring (Reducing Risk with Monitoring) (in Dutch). Cement 6(Year 59): 14-16. Bles, T. J.; Verweij, A.; Salemans, J. ;Korff, M. et al (2009). Guideline for monitoring and quality control at deep excavations. International Conference on Safety and Risk. Japan, to be published. BMA Amsterdam (2008). Weaver buildings. www.bma.amsterdam.nl Bolton, M.D.; Lam, S.Y. and Osman, A.S. (2008) Supporting excavations in clay – from analysis to decision –making. TC 28 Conference Geotechnical Aspects of Underground Construction in Soft Ground, Shanghai. Bonshor, R. B. and Bonshor, L.L. (1996). Cracking in buildings, Construction Research Communications Ltd. Boone, S. J. (1996). Ground-Movement-Related Building Damage. Journal of Geotechnical and Environmental Engineering 122(11): 11. Boone, S. J. (2001). Assessing construction and settlement-induced building damage: a return to fundamental principles. Underground Construction. London. Boone, S. J.; Westland, J. ; Nusink, R. (1999). Comparative evaluation of building responses to an adjacent braced excavation. Canadian Geotechnical Journal 36(2): 210-223. Boonpichetvong, M.; Rots, J. G., Netzel, H. (2003). On modelling of masonry buildings response in Dutch soft-ground tunnelling. ITA World Tunnelling Congress Amsterdam, April 2003, Lisse, Balkema.

1001307-004-GEO-0002, Version 02, 26 November 2009, final
Deformations and damage to buildings adjacent to deep excavations in soft soils
129
Boonpichetvong, M. and Rots, J.G. (2004). Numerical analyses of size effect in settlement damage prediction. 5th Int. PhD Symp. Civ. Eng. . Delft, , Leiden, Balkema, Vol.2, pp.1337-1345 Bormans R.M.M.J., Borst T.C., Salet Th.A.M., (2004), Diepe Stations in historische binnenstad grote uitdaging (Deep Stations in Historic city centre big challenge, in Dutch), Cement Vol. 56 No. 2. Boscardin, M. D. and E. J. Cording (1989). Building response to excavation-induced settlement. Journal of Geotechnical Engineering 115(1, Jan): 1-21. Bowles, J. E. (1988). Foundation Analysis and Design, McGraw-Hill Inc. BRE (1995). Assessment of damage in low-rise buildings. BRE Digest Concise reviews of building technology, BRE. Burland, J. B., Mair, R. J., Standing, J.R. (2004). Ground performance and building response due to tunnelling. Advances in Geotechnical Engineering - the Skempton conference. London, ICE. Burland, J. B., Standing, J. R., Jardine, F.M. (2001). Building response to tunneling - case studies from construction of the Jubilee Line Extension, London. CIRIA Special Publication 200, CIRIA. Burland, J.B., Broms, B.B., De Mello, V.F.B. (1977). Behaviour of Foundations and Structures. Ninth International Conference on Soil Mechanics and Foundation Engineering, Tokyo, Japan, pages 495-546 Burland, J. B. and Hancock, R.J.R. (1977). Underground car park at the House of Commons, London: Geotechnical aspects. The structural engineer 55(2): 87-100. Burland, J. B. and Wroth, C.P. (1974). Settlement of buildings and associated damage. SOA review. Conference on settlement of structures, Cambridge. Cascini, L.; Ferlisi, S; Peduto, D; Fornaro, G and Manunta, M. (2007). Analysis of a subsidence phenomenon via DInSAR data and geotechnical criteria. Rivista Italiana Di Geotechnica 4/2007: 17. Caspe, M. S. (1966). Surface settlement adjacent to braced open cuts. Journal of Soil Mechanics and Foundations division, ASCE 92(SM4): 51-59. Chen, L.T., Poulos, H.G., Loganathan, N. (1999). Pile responses caused by Tunneling. Journal of Geotechnical en Geoenvironmental Engineering; 207-215 Clough, G. W. and O. Rourke, T.D. (1990). Construction induced movements of insitu walls. ASCE specialty Conference, ASCE Special Publication 25. COB (2009) Eindrapport Bouwputten Tunnel Pannerdensch Kanaal, F501.

1001307-004-GEO-0002, Version 02, 26 November 2009, final
Deformations and damage to buildings adjacent to deep excavations in soft soils
130
Cook, D.; de Nijs, R. and Frankenmolen, S (2007), Amsterdam Noord/Zuidlijn: Use of Background Monitoring Data Prior to Construction Commencement; FMGM2007, Seventh International Symposium on field Measurements in Geomechanics Boston, USA, ASCE. CUR (1995). Tunneling close to foundation piles (in Dutch) Gouda, Stichting CUR. Davies, R. V.; Fok, P.; Norrish, A; Poh, S.T. (1996). The Nicoll Highway Collapse: Field Measurements and Observations. International Conference on Deep Excavations. Singapore. Davies, R.V. and Henkel, D. (1982). Geotechnical problems associated with the construction of Chater Station, Hong Kong. The Arup Journal 17(1): 4-10. Dijk, van, D.J.J. (2003). Voorspellen van wandverplaatsingen en maaiveldzettingen ontstaan door ontgravingen (Prediction of wall displacements and surface settlements caused by excavations) (in Dutch). Civil Engineering, section Waterbouwkunde and Geotechnics. Delft, University of Technology. MSc: 44. Dimmock, P. S. and Mair, R.J. (2008). Effect of building stiffness on tunnelling-induced ground movement. Tunnelling and Underground Space Technology 23: 438–450. Driesse, A. Van ’t Verlaat, J., Essler, R.D., Salet, T.A.M. (2008). Grout struts for deep station boxes North-South Line Amsterdam, Design. Proc. BGA international conference on Foundations, Dundee, Scotland. HIS BRE Press. Dunnicliff, J. (1993). Geotechnical instrumentation for monitoring field performance. John Wiley &Sons, inc. Elshafie, M. Z. E. B. (2008). Effect of building stiffness on excavation induced displacements. Geotechnical Department. Cambridge, University of Cambridge. PhD. Engineers, I. o. S. (1989). Soil-structure interaction - The real behaviour of structures, Institution of Structural Engineers. Finno, R. J. (2007). Use of Monitoring Data to Update Performance Predictions of Supported Excavations. FMGM. Boston, USA. Finno, R. J. and M. Calvello (2005). Supported excavations: the observational method and inverse modelling. Journal of Geotechnical and Environmental Engineering(ASCE, 131 (7).). Finno, R. J.; Calvello, M., Bryson, S.L. (2002). Analysis and Performance of the Excavation for the Chicago-State Subway Renovation Project and its Effects on Adjacent Structures, Department of Civil and Environmental Engineering, Northwestern University Evanston, IL 60208: 347. Finno, R. J., M. Langousis et al. (2007). Real Time Monitoring at the Olive 8 Excavation. FMGM. Boston, USA. Frankenmolen, S.F. (2006), Analyse Noord/Zuidlijn monitoringsdata (Analysis of Noord/Zuidlijn monitoringdata, in Dutch), MSc thesis, Delft University of Technology.

1001307-004-GEO-0002, Version 02, 26 November 2009, final
Deformations and damage to buildings adjacent to deep excavations in soft soils
131
Franzius, J. N. and D. M. Potts (2006). The influence of the soil-structure interface on tunnel induced building deformation. Numerical Methods in Geotechnical Engineering: 291-297. Franzius, J. N., Potts, D. M. et al. (2004). The influence of building weight on tunnelling-induced ground and building deformation. Soils and Foundations 44(1): 25-38. Franzius, J. N., Potts, D. M. et al. (2005). The influence of building weight on tunnelling-induced ground and building deformation. Soils and Foundations 45(4): 168-169. Franzius, J. N., Potts, D. M. et al. (2006). The response of surface structures to tunnel construction. Proc. Inst. Civ, Engrs Geotech. Eng. 159(1): 3-17. Franzius, J. N. and Addenbrooke, T.I. (2002). The influence of building weight on the relative stiffness method of predicting tunnelling-induced building deformation. Proc. 3rd Int. Symp. Geotech. Aspects Underground Constr. Soft Ground. Toulouse, Oct. 2002, Specifique, Lyon. Franzius, J. N.; Potts, D.M.; Burland, J.B. (2005). Twist behaviour of buildings due to tunnel induced ground movement. Geotechnical Aspects of Underground Construction in Soft Ground, Amsterdam, Taylor&Francis Group, London. Gaba, A. R., B. Simpson, et al. (2003). Embedded retaining walls – guidance for economic design. London, CIRIA. GeoDelft (2006) Verdeelhal Zuid - Station Vijzelgracht / Zakking panden Vijzelstraat 1 t/m 7 (South Entrance – Vijzelgracht Station / Settlements of buildings Vijzelstraat 1 to 7; In Dutch) CO-364732-0367 v01, April 2006, version 01 Final. Goh, K. H. (August 2008). Ground and building response under the influence of excavation and tunnelling activities, University of Cambridge; Department of Engineering; Geotechnical and Environmental Research Group. Goldberg, D. T.; Jaworsky, W.E.; Gordon, M.D. (1976). Lateral Support Systems and Underpinning, volume 1-3, Federal Highway Administration. Grant, R.; Christian, J. T.; Vanmarcke, E. H. (1974). Differential Settlement of Buildings. ASCE, Journal of Geotechnical Engineering Division 100(GT 9): 973-991. Henkel, R. and Davies, D. (1980, 05). Geotechnical problems associated with the construction of Chater Staton, Hong Kong. Arup Journal(17): 7. Hsieh, P. G. and Ou, C. Y. (1998) Shape of ground surface settlement profiles caused by excavation, Canadian Geotechnical Journal, Vol. 35, pp. 1004-1017. Jacobsz, S. W. (2002). The effects of tunnelling on piled foundations. Geotechnical Department. Cambridge, University of Cambridge. Doctor of Philosophy. Jacobsz, S. W.; Bowers, K.H.; Moss, N.A.; Zanardo, G. (2005). The effects of tunnelling on piled structures on the CTRL. Geotechnical Aspects of Underground Construction in Soft Ground, Amsterdam, Taylor&Francis Group, London.

1001307-004-GEO-0002, Version 02, 26 November 2009, final
Deformations and damage to buildings adjacent to deep excavations in soft soils
132
Jardine, R.J., Potts, D.M., Fourie, A.B., Burland, J.B. (1986). Studies of the influence of non linear stress-strain characteristics in soil-structure interaction. Geotechnique, 36. No 3. 377-396 Jardine, F. M. (2001). Response of buidings to excavation induced ground movements. International Conference on Response of buidings to excavation induced ground movements, Imperial College London, UK, CIRIA. Kaalberg, F. J.; Teunissen, E.A.H.; Tol van, A.F.; Bosch, J.W. (2005). Dutch research on the impact of shield tunnelling on pile foundations. Geotechnical Aspects of Underground Construction in Soft Ground, Amsterdam, Taylor&Francis Group, London. Kempfert, H. G. G., B. (2006). Excavations and foundations in soft soils. Berlin, Springer. Kerisel, J. (1975). Old structures in relation to soil conditions. Geotechnique 25(No 3): 433-483. Konstantakos, D. C. (2008). Online database of deep excavation performance and prediction. 6th international conference on case histories and geotechnical engineering. Arlington, paper 5.16 (1-12). . Lee, S. J.; Song, T.W. (et al.) (2007). A case study of building damage risk assessment due to the multi-propped deep excavation in deep soft soil. 4th Int. Conf. Soft Soil Eng. Vancouver, London, Taylor Francis. Leonards, G. A. (1975). Discussion on Differential Settlement of Buildings. ASCE, Journal of Geotechnical Engineering Division(GT 7): 700-702. Leung, E. H. and Ng, C.W. (2007). Wall and ground movements associated with deep excavations supported by cast in situ wall in mixed ground conditions. Journal of Geotechnical and Geoenvironmental Engineering 133(2): 129-143. Long, M. (2001). Database for retaining wall and ground movements due to deep excavations. Journal of Geotechnical and Environmental Engineering 127(3): 203-224. Magnus, R.; Teh, Cl; Lau, J.M. (2005). Report on the incident at the MRT circle line worksite that led to the collapse of the Nicoll Highway on 20 april 2004 (summary taken from www.SCOSS.org.uk). Singapore. Marr, A.W. (2001). Why monitor geotechnical performance? 49th Geotechnical conference in Minnesota. Mair, R. J. and Taylor, R. N. (2001) Settlement predictions for Neptune, Murdoch and Clegg Houses and adjacent masonry walls. Building Response to tunnelling - Case studies from construction of the Jubilee Line Extension, London. Vol. 1: Projects and Methods, Burland J B, Standing J R, and Jardine F M, (eds) CIRIA SP200, pp 217-228 (CIRIA and Thomas Telford, 2001). Mair, R. J. (2003). Research on tunnel-induced ground movements and their effect on buildings - lessons learned from the Jubilee Line Extension. Response of buildings to

1001307-004-GEO-0002, Version 02, 26 November 2009, final
Deformations and damage to buildings adjacent to deep excavations in soft soils
133
excavation-induced ground movements. F. M. e. Jardine. London, CIRIA, Special publication 201. Mair, R. J. ; Taylor, R. N. et al. (1996). Prediction of ground movements and assessment of risk of building damage due to bored tunnelling. Int. Symp. Geotech. Aspects Underground Constr. Soft Ground. e. Mair&Taylor. London, April 1996, Rotterdam, Balkema. Mestat, P. B., Emmanuel; Riou, Yvon (2004). MOMIS: A database devoted to comparing numerical model results with in situ measurement: Applications to sheet piling. Bulletin de Laboratoires des Ponts et Chaussées. 252-253: 49-76. Meyerhof, G. G. (1953). Some recent foundation research and its application to design. . The structural Engineer 31(June): 151-167. Moormann, C. and Moormann, H.R. (2002). Study of wall and ground movements due to deep excavation in soft soil based on worldwide experiences. Geotechnical Aspects of Underground Construction in Soft Ground, Toulouse, Spécifique, Lyon. Mroueh, H. and Shahrour, I. (2002). Three dimensional finite element analysis of the interaction between tunnelling and pile fondations. International journal for numerical and analytical geomechanics, vol 26, pp217-230. NEN (2006). NEN 6740 Geotechnics - TGB 1990 - Basic requirements and loads. NEN. Netzel, H., Kaalberg F.J., (2001), Monitoring of the North–South Metro line in Amsterdam, Response of buildings to excavation induced ground movements, Proceedings of the international conference held at Imperial College, London, UK, on 17–18 July 2001, CIRIA Special Publication 199. Netzel, H. D. (2005). Review of the limiting tensile strain method for predicting settlement induced building damage. Geotechnical Aspects of Underground Construction in Soft Ground, Amsterdam, Taylor&Francis Group, London. Osman, A.S. and Bolton, M.D. (2007) Back analysis of three case histories of braced excavations in Boston Blue Clay using MSD method. 4th Int. Conf. Soft Soil Eng. Vancouver, London, Taylor Francis, pp 755-764. O’Rourke, T.D. (1993) Base stability and ground movement prediction for excavations in soft clay. Retaining Structures, Thomas Telford, London, 131-139. O'Rourke, T. D.; Cording, E.J.; Boscardin, M (1976). The ground movements related to braced excavation and their influence on adjacent buildings. U. D. o. Transportation. Washington, University of Illinois. Ou, C.Y.; Chiou, D.C. and Wu, T.S. (1996) Three dimensional finite element analysis of deep excavation. Journal of Geotechnical Engineering, May 1996, p337-345 Peck, R. B. (1969). Deep excavations and tunneling in soft ground, . 7th Int.Conf. Soil Mech. Fdn. Engrg, . Mexico City, Sociedad Mexicana de Mecanica de Suelos, A.C.

1001307-004-GEO-0002, Version 02, 26 November 2009, final
Deformations and damage to buildings adjacent to deep excavations in soft soils
134
Plaxis (2009). Material Models Manual Delft. van der Poel, J.T., Gastine, E., Kaalberg, E.J. (2005). Monitoring for Construction of the North/South metro line in Amsterdam, The Netherlands, 5th International conference on Geotechnical Aspects of Underground Construction in Soft Ground, Balkema Amsterdam, 745-749 Polshin, D. E. and Tokar, R.A. (1957). Maximum allowable non-uniform settlement of structures. Proceedings 4th Int. Conference On Soil Mechanics and Foundation Engineering. London, UK, vol.1, Butterworth’s scientific. Potts, D. M. and T. I. Addenbrooke (1996). The influence of an existing structure on the ground movements due to tunnelling. Geotechnical Aspects of Underground Construction in Soft Ground, London. Potts, D. M. and T. I. Addenbrooke (1997). A structure's influence on tunnelling-induced ground movements. Proc. Inst. Civ, Engrs Geotech. Eng. 125(2): 109-125. Potts, D. M.; Standing, J.R., Addenbrooke, T.I. (1998). Interaction between tunnelling and nearby structures. Int. Conf. Soil-Structure Interaction In Urban Civil Engineering. Darmstadt, Darmstadt Geotechnics, No. 4, 1998. Puller, M. (2003). Deep excavations - A practical manual, Thomas Telford. Rankin, W. J., Ed. (1988). Ground movements resulting from urban tunnelling: predictions and effects. Engineering Geology of Underground Movements, Geological Society Engineering Geology Special Publication No. 5. Rankin, W.J. (1988). Ground movements resulting from urban tunnelling; predictions and effects, Engineering Geology Special publication No. 5, Geological Society; 79-92 Richards, D.J., Holmes, P., Breadman, D.R. (1999). Measurement of temporary prop loads during the construction of the Mayfair underground car park. Proceedings on the institution of Civil Engineers, Geotechnical Engineering, 137, 165-174. SBR (2007). Handbook Foundations - part A (In Dutch). Rotterdam, Stichting Bouw Research (SBR). Selemetas, D. (2004) On the assessment of pile settlement due to tunnelling: some lessons learned from a full-scale trial, Proc. 16the European Young Geotechnical Engineers’ Conference, Vienna, Austria, pages 333-342. Simpson, B. N., D.; Banfi, M.; Grose, B.; Davies, R. (2008). Collapse of the Nicoll Highway Excavation, Singapore. 4th International Conference on Forensic Engineering. London, UK, ICE. Skempton, A. W. and McDonald, D.H. (1956). The allowable settlements of buildings. Proceedings Institution of Civil Engineers part III, volume 5(No. 50): 727-768. Son, M.; Cording, E.J. Tunneling, building response and damage estimation. Tunnelling Underground Space Technology(21): 6.

1001307-004-GEO-0002, Version 02, 26 November 2009, final
Deformations and damage to buildings adjacent to deep excavations in soft soils
135
Son, M.; Cording, E.J. (2005). Estimation of building damage due to excavation-induced ground movements. Journal of Geotechnical and Geoenvironmental Engineering(131): 162-177. Son, M.; Cording, E.J. (2007). Evaluation of building stiffness for building response analysis to excavation-induced ground movements.. Journal of Geotechnical and Geoenvironmental Engineering(133): 995-1002. Standing, J.R., Withers, A.D., Nyren, R.J. (2001). Measuring techniques and their accuracy. Building response to tunnelling, case studies from construction of the JLE, London. Vol. 1 Projects and methods. Ciria special publication 200. Thomas Telford, London. 273-299 St John, H.D. (1975). Field and theoretical studies of the behaviour of ground around deep excavations in London clay. PhD thesis, Cambridge University, U.K. Ter Linde (1999) Zakkingen van belendingen ten gevolge van het vervaardigen van diepwanden (Building settlements due to diaphragm wall installation, in Dutch), MSc Thesis Delft University of Technology. Timoshenko, S. P. (1957). Strength of Materials. London, D. van Nostrand Company. Timoshenko, S. P. and Gere, J.M. (1972). Mechanics of Materials, D. van Nostrand ReinholdCompany. Van Staveren, M. (2006). Uncertainty and Groud Conditions: A Risk Management Approach. Elsevier Ltd. van Tol, A. F. (2007). Schadegevallen bij bouwputten (Damage caused by Deep Excavations) (in Dutch). Cement 6(Year 59): 6-13. Wahls, H. E. (1981). Tolerable Settlement of Buildings. ASCE, Journal of Geotechnical Engineering Division 107(GT 11): 14891505. Wahls, H. E. (1994). Tolerable Deformations. Vertical and Horizontal Deformations of Foundations and Embankments, Texas, ASCE. Ward, W.H. (1956). Discussion on paper by Skempton and MacDonald “ The allowable settlement of buildigngs”. Proceedings Institution of Civil Engineers part III, volume 5(No. 50): 782. Xu, K.J. & Poulos, H.G. (2001) 3-D elastic analysis of vertical piles subjected to “passive” loadings. Computers and Geotechnics 28. 349-375 Yong, K. Y. and Leh, S.L. (2007). Collapse of Nicoll Highway - a global failure at the curved section of a cut-and-cover tunnel construction. Journal of Southeast Asian Geotechnical Society(2007): 139-153. Zantkuijl, H. J. (1993). Bouwen in Amsterdam - Het woonhuis in de stad (Building in Amsterdam). Amsterdam, Architectura & Natura.

1001307-004-GEO-0002, Version 02, 26 November 2009, final
Deformations and damage to buildings adjacent to deep excavations in soft soils
136
Zhang, L. M. and Ng,A. M. Y. (2005). Probabilistic limiting tolerable displacements for serviceability limit state design of foundations. Geotechnique 55(2): 151-161. Zhang, L. M. and Ng, A. M. Y. (2007). Limiting tolerable settlement ad angular distortion for building foundations. GSP 170 Probabilistic Applications in Geotechnical Engineering, GeoDenver. Zdravkovic et al. (2005) FE analysis of 3D excavation. Geotechnique 55, pp 497-513


![Marginal quality of ceramic inlays after three different ... · especially in the enamel [1]; and iatrogenic damage to adjacent teeth [11–13], may occur. This mechanical damage](https://static.fdocuments.us/doc/165x107/5f238c86189dba68bb57aa52/marginal-quality-of-ceramic-inlays-after-three-different-especially-in-the-enamel.jpg)