Definition: GIS is a System of computer software, hardware and data, and personnel to help...
25
Definition: GIS is a System of computer software, hardware and data, and personnel to help manipulate, analyze and present information that is tied to a spatial location – • spatial location – usually a geographic location • information – visualization of analysis of data • system – linking software, hardware, data • personnel – the most critical key to the successful use of a GIS
-
Upload
alvin-hensley -
Category
Documents
-
view
220 -
download
2
Transcript of Definition: GIS is a System of computer software, hardware and data, and personnel to help...

Definition: GIS is a System of computer software, hardware and data, and personnel to help manipulate, analyze and present information that is tied to a spatial location –
• spatial location – usually a geographic location
• information – visualization of analysis of data
• system – linking software, hardware, data
• personnel – the most critical key to the successful use of a GIS
http://www.gis.com/

• Cadastral information
• Images
• Land Uses
• Inventory of Natural Resources
• Market Analysis and Trends
• Planning Schemes
• Risk Analyses
• Analytical Models and Simulations
Types of data that can be included in a GIS
In summary if the information has any spatial component it can be presented within a GIS.

• 1960s – Restricted to paper-based systems “Maps”
• 1970s – First Digital Mapping
• Early 1980s – first Computer Aided Design or CAD packages
• Mid 1980s – First GIS using Workstations
• Late 1980s – Desktop Mapping, Integration of CAD with Databases, birth of PC-based systems
• Early 1990s – Desktop GIS with full integration of data
• Mid 1990s – GIS became more accessible with Windows based destop GIS
• Late 1990s – GIS became functional over the Internet
• Early 2000s – full integration of GIS into applications e.g. In Vehicle Navigation Systems
History of GIS

• Computer-aid design (CAD), computer cartography, database management and remote-sensing were all important in the development of GIS, however,
• AA GIS allows information to be linked to an object, such as point, line or polygons. Consequently information can be calculated from the topography of the object or information can be attached to the object and stored in a separate table.
• A GIS has the ability to shade various land parcels (districts) according to ranges of specified variables. This makes identification of spatial relations within the data set easy to identify.
How does GIS vary from other Graphics Programs ?

• Maps have to be printed and in relatively large formats
• Although maps can be compiled into an Atlas, they are not seamless and you have to compare one page with another
• Maps have to be printed at fixed scales
• Maps cannot provide all the annotation you might require with respect to shading and place names
• Although Maps should always include a scale bar it is still not easy to calculate the lengths of features represented on the map and is almost impossible to determine areas with any reasonable accuracy.
DIFFERENCE BETWEEN A GIS AND MAPS/ATLASES

• With a GIS you can combine information that you wish to use and ignore information that is redundant to your needs
• Each feature of a Map is stored in a GIS as a series of files that collectively are referred to as a “layer” or “coverage”. You can add different coverages onto each other
• A GIS allows the different representation and colour of points, the colour and style of lines, the colour and shading properties of polygons, the colour, font, size and orientation of labels to be changed
• One of the most important aspects of a GIS is the displaying of information attached to the coverage which can also be represent by colour gradients or by unique colours according to attributes with a linked table of information
GIS Maps are Customizable
• Any of the data whether it be within the associated table or be a measurement of the object and whether it’s numerical or text can be searched and identified.
• Searches can be simple such as find all estuaries which are always open to compound searches such as find all estuaries that are always open and have a mangrove population.
• Searches can be based on features based on the parameters of map features - e.g. the length of sandy beaches along a coastline that are longer than 5km
GIS Maps are Searchable
• Since the information is stored electronically information is easily updated without require republishing.
• This information ca be writen to CD and can dispatched to offices or made available via a network
• More recently advance in GIS applications allow information to be updated and available to the entire users of the World Wide Web.
• Consequently information can be maintained in its most current form and optimizes decision-making.
GIS Maps are Updatable

• A typical GIS is fairly complex and the databases and images are usually large - they consequently take up considerable disk space.
• Needing to handle so much data requires a fair amount of memory and processing power.
• Backups of data can be undertaken using tapes or re-writable CDs
• Often GIS software is graded into being able to view data, to minor alterations, to full customizing and programming (usually BASIC) and finally through to a full centrally managing large or “corporate” application.
What Computers Would You Need To Run A GIS?

Getting Maps and Data into a GIS
• Geocoding one Table against an already existing GIS table and feature list
• Using a Digitizing Board
• Scan a pre-existing map and then geo-reference it within the GIS
• Using a GPS to field map features
• Purchase data from government and commercial vendors.
• Data supplied via internet services, or via online viewing and downloading of files, e.g. Western Cape Nature Conservation Board is starting this.
• Meta databases – which can be maps which provide information on suppliers of spatial information.
• With high bandwidths you can even log into different servers and mix data from different sources, and first system now exists where you can can upload your data to a map service for distribution via the world-wide web.
Where Can You Get Data?

• North America - USGS provide togographical maps, satellite imagery, correct orthophotos, scanned copies of paper maps, etc.
• South Africa – Chief Directorate Surveys and Mapping provide the above products and charge only the cost of CD cutting.
• Increasingly in South Africa, private companies are providing more of the data. Consequently Computamaps in Cape Town has developed and markets very high resolution (20m) Digital Terrain Model for SouthAfrica that are extensively used in the mobile telecommunications industry. The Knowledge Factor has map of all land parcels in South Africa and records of ownership as reflected in the Deeds Office.
Who Produces Digital Maps?
• The USGS develops from aerial photography, digital, geo-corrected orthophotographs of pan imagery at 1 metre resolution for the entire country every 5 years.
• In South Africa many parts have never had any orthophotographs prepared. The most accurate digital elevation model which records height data was for a resolution of 200 metre raster grid cells from the Surveyor General for South Africa.
• More Accurate Digital Terrain Information can be acquired using the LIDAR (look this up) and Digital Elevation Models with centimeter resolution for small areas are being prepared.
• Virtually all new maps being prepared nowadays are done through a GIS and hand drawing is very much a thing of the past.
Obtaining New Data

Types Of GIS
• There are two types of GIS which store the information in very different format. These are known as vector-based and raster-based.
• Originally there was little cross functionality between the two systems, however, most current software has the ability to present both systems
• Some software such as TNT Mips has extensive functionality in both systems.

Raster: Grids
Uses “pixels” for location and value attributes and includes satellite-images and digital aerial photos are already in this format.
Each grid will have a value that corresponds to some feature, for example water might have a value of 6 and there fore all grids which have a value of 6 represents water. Raster-based GIS systems are not strong on the data-base functionality, but are good for spatial analysis, modeling and visualizations.

Vector GIS use points, lines and polygons to represent features.
Since such features are precisely define by geographical co-ordinates, they are useful for accurate calculation of measurements and are easily attached to tabulated data for querying.
Vector-based GIS are used extensively for management such as municipal offices would require
Vector – Linear: Points, Lines & Polygons
Application of GIS to Pollution Management
• For pollution control you will normally use Environmental Sensitivity Index Maps developed by NOAA. These are used by coastal managers for all forms of oil/chemical pollution and contain three types of information, namely:-
• Coastline Information
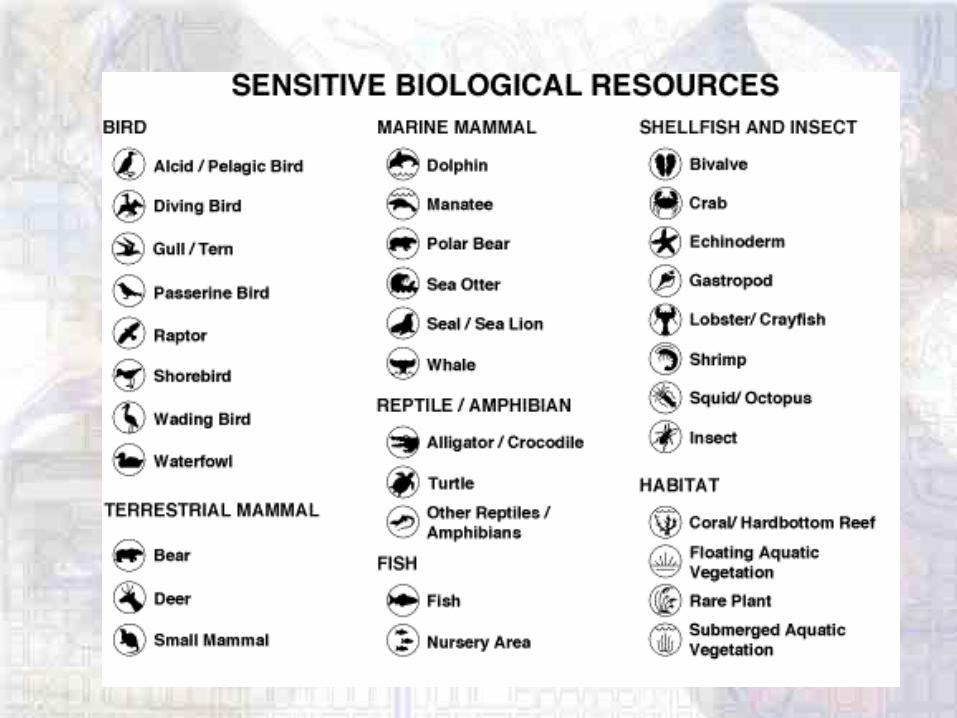
• Sensitive Biological Resources
• Human Use Features
Coastline Information that is colour coded with respect to either type of coastal and/or its vulnerability to pollution which ranges from Exposed Rocky Headlands which are the least vulnerable and will be coloured with cold colours such blue/green to estuarine environment (marshes and mangroves) which are the most vulnerable to the effects of pollution and are coloured warm colours such as red/orange.
Thematic Mapping - for Sensitivity Atlases

Intertidal• Exposed Rocky Shores • Exposed, Solid Man-Made
Structures • Exposed, Wave-Cut Platforms • Sandy Beaches • Mixed Sand and Gravel
Beaches • Gravel Beaches • Exposed Tidal Flats • Sheltered Rocky Shores and
Scarps • Sheltered, Solid Man-Made
Structures • Peat Shores • Sheltered Tidal Flats• Salt to Brackish Marshes • Mangroves Inundated
Subtidal
• Coral Reefs• Seagrasses• Kelp• Soft Bottom• Mixed Hard Bottom
On-Water
• Off shore• Bays and Estuaries
IntertidalSubtidal
On-Water

• Marine: Mammal, Dolphin, Manatee, Seals, Otters, Whale, • Terrestrial Mammal: Primate, Canine, Feline, • Small Mammal: Hyrax and threatened, endangered, or
rare species.• Bird: Diving Bird, Gull/Tern, Pelagic, Raptor, Shorebird,
Wading Bird, Waterfowl • Reptile/Amphibian: Alligator/Crocodile, Turtle, other rare
species, especially aquatic/wetland concentration areas.• Fish: Diadromous, Nursery Estuarine Fish, Resident
Estuarine Fish, Freshwater Fish, Benthic Marine Fish, Pelagic Marine Fish.
• Shellfish/Insect: Bivalve, Cephalopod, Crab, Echinoderm, Gastropod, Lobster/Crayfish, Shrimp, Insect
• Habitat/Rare Plant: Coral Reef, Floating Aquatic Vegetation, Hardbottom Reef, Kelp Bed, Rare, Submerged Aquatic Vegetation, Worm Bed
Sensitive Biological Featuresused in USA (NOAA)
• Protected marine sites (reserves/sanctuaries), • Recreational sites including swimming beaches,
angling spots, mariculture sites• Commercial and subsistance gathering of marine
resources (mussels, bait, crayfish), coastal developments such as harbours and marinas, power plants including nuclear, mining and marine intakes and discharges (e.g. a fish factor will take in clean water for processing and discharge this water with discharges of fish oil which are potential pollutants).
Sensitive Human Resources
Human Use Resources that are depicted as both shading and symbols

Recreation/Access: Access - Vehicular access to the shoreline, Beach - High-use recreational beaches, Boat Ramp, Diving Site, High-use recreational areas, Marina, Recreational Fishing, High-use recreational areas
Management Areas: Reservation, Marine Sanctuary, National Park, Park - State and regional parks, Special Management Areas - Usually water-associated,Wildlife Refuge, Preserve, Reserve
Resource Extraction Site: Aquaculture Site - Hatcheries, ponds, and pens, Commercial Fishery, Log Storage Area, Mining - Intertidal/subtidal mining leases, Subsistence - Designated harvest sites, Water Intake - Industrial; drinking water; cooling water, aquaculture
Cultural Resource: Archaeological Site - Water-, coastal-, or wetland-associated, Historical Site - Water-, coastal-, or wetland-associated
Sensitive Human Resources - continued


All of these features are put onto maps using an ICON-based