
Defining the Availability of Contaminants in Sediments Danny D. Reible, PhD, PE, DEE, NAE University...
50
Defining the Availability Defining the Availability of Contaminants in of Contaminants in Sediments Sediments Danny D. Reible, PhD, PE, DEE, NAE University of Texas Acknowledgements: Nate Johnson, XiaoXia Lu, Dave Lampert, Brian Drake, Alison Skwarski
-
Upload
aidan-brookens -
Category
Documents
-
view
217 -
download
3
Transcript of Defining the Availability of Contaminants in Sediments Danny D. Reible, PhD, PE, DEE, NAE University...
Defining the Availability of Defining the Availability of Contaminants in SedimentsContaminants in Sediments
Danny D. Reible, PhD, PE, DEE, NAE University of Texas
Acknowledgements: Nate Johnson, XiaoXia Lu, Dave Lampert, Brian Drake, Alison Skwarski

Linking Sediment Exposure and Linking Sediment Exposure and RiskRisk
Relevance of bulk sediment concentrationErosive sediments if complete desorption possibleSurficial sediments if complete desorption possible or if organisms can access all of contaminant
Relevance of pore water concentrationMobile fraction of buried stable sedimentsIndicator of bioavailability of surficial or erodible sediments ?

A Tale of Two ContaminantsA Tale of Two Contaminants
Hydrophobic Organic ContaminantsPAHsPCBs
Mercury

Hydrophobic Organic Hydrophobic Organic CompoundsCompounds
Does pore water concentration define exposure and risk?

Bulk Sediment Concentration Bulk Sediment Concentration Correlates only Weakly with PAH Correlates only Weakly with PAH Toxic EndpointsToxic Endpoints
0
20
40
60
80
100
1 10 100 1000 10000
Su
rviv
al (
%)
Sediment Total PAH16 Conc. (mg/kg)
H. azteca 28-day chronic toxicity test
PEC22.8 ppm
TEC1.6 ppm
Dave Nakles, RETEC

Porewater Concentration Better Porewater Concentration Better Correlates with SurvivalCorrelates with Survival
Dave Nakles, RETEC
Su
rviv
al (
%)
0
20
40
60
80
100
0.001 0.01 0.1 1 10 100 1000
EPA H. azteca 28-day test
Sediment Porewater PAH34 Conc. (Toxic Units)

Bioavailability StudiesBioavailability Studies
Test organismDeposit-feeding freshwater tubificide oligochaeteIlyodrilus templetoni
Ease to cultureHigh tolerance to contaminants and handling stressIntense sediment processing environment (overcome MT resistances?)
Measure of bioavailability= steady state BSAF
WhereCt is contaminant concentration accumulated in organisms’ tissue (g/g ) flip is organisms’ lipid content (g lipid/g dry worm) Cs is the sediment concentration (g/g dry sediment) foc is total organic carbon content of the sediment (g TOC/g dry sediment).
/
/t lip
s oc
C fBSAF
C f

Normalized Accumulation as Normalized Accumulation as Indicator of BioavailabilityIndicator of Bioavailability
BSAF of O(1) for reversibly sorbed non-metabolizing contaminants in directly exposed organisms at steady state ( e.g. benthic deposit feeders)If accumulation indicated (not necessarily caused) by porewater concentration
,
,
lipid porewater observedpredicted
oc porewater reversible
K CBSAF
K C

Does it predict uptake of PAHs ?Does it predict uptake of PAHs ?

Uptake of benzo[Uptake of benzo[aa]pyrene from water]pyrene from water
0.0
500.0
1000.0
1500.0
2000.0
2500.0
3000.0
3500.0
4000.0
4500.0
0.0 200.0 400.0 600.0 800.0 1000.0
Time(hours)
Tiss
ue c
once
ntra
tion
of B
aP(d
pm/m
g dr
y w
orm
)
Predicted uptake from pore w ater
Observed total uptake from sediment

Contribution of ingestion to the Contribution of ingestion to the uptake of benzo[uptake of benzo[aa]pyrene]pyrene
0.0
500.0
1000.0
1500.0
2000.0
2500.0
3000.0
3500.0
4000.0
4500.0
5000.0
0.0 200.0 400.0 600.0 800.0 1000.0
Time(hours)
Tis
sue c
oncentr
atio
n o
f B
aP
(dpm
/mg d
ry w
orm
)
observed total uptake from sediment
predicted uptake via sediment ingestion
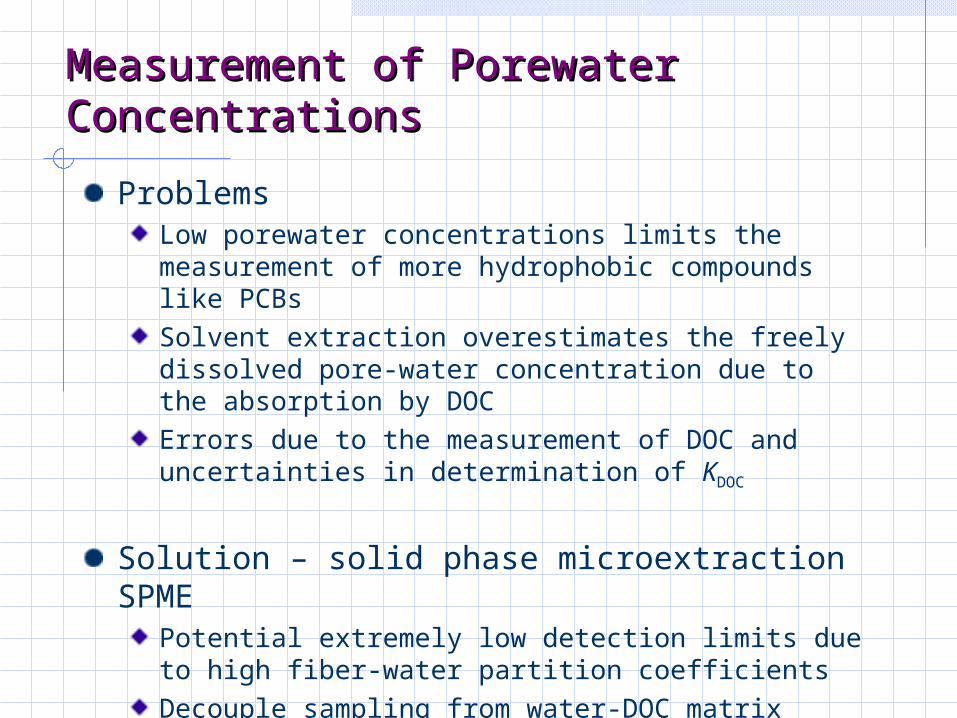
Measurement of Porewater Measurement of Porewater ConcentrationsConcentrations
ProblemsLow porewater concentrations limits the measurement of more hydrophobic compounds like PCBs Solvent extraction overestimates the freely dissolved pore-water concentration due to the absorption by DOCErrors due to the measurement of DOC and uncertainties in determination of KDOC
Solution – solid phase microextraction SPMEPotential extremely low detection limits due to high fiber-water partition coefficients Decouple sampling from water-DOC matrix effectsHigh spatial resolution, rapid dynamicsEmployed ex-situ by National Grid/RETEC (Nakles)

Other Porewater Measurement Other Porewater Measurement ApproachesApproaches
Ex-situ SPMEProving to be valid approachMaintenance of profiles?Maintenance of sample integrity?
Semi-permeable membrane devicesDynamics?Spatial resolution?
Passive Polyethylene Samplers Currently under development (P. Gschwend)

Objectives of ESTCP effortObjectives of ESTCP effort
Demonstrate solid-phase micro extraction (SPME) for the in-situ assessment of bioavailability Demonstrate viable deployment approachDemonstrate relationship’ to sediment pore water concentrationsDemonstrate relationship to benthic organism body burdens
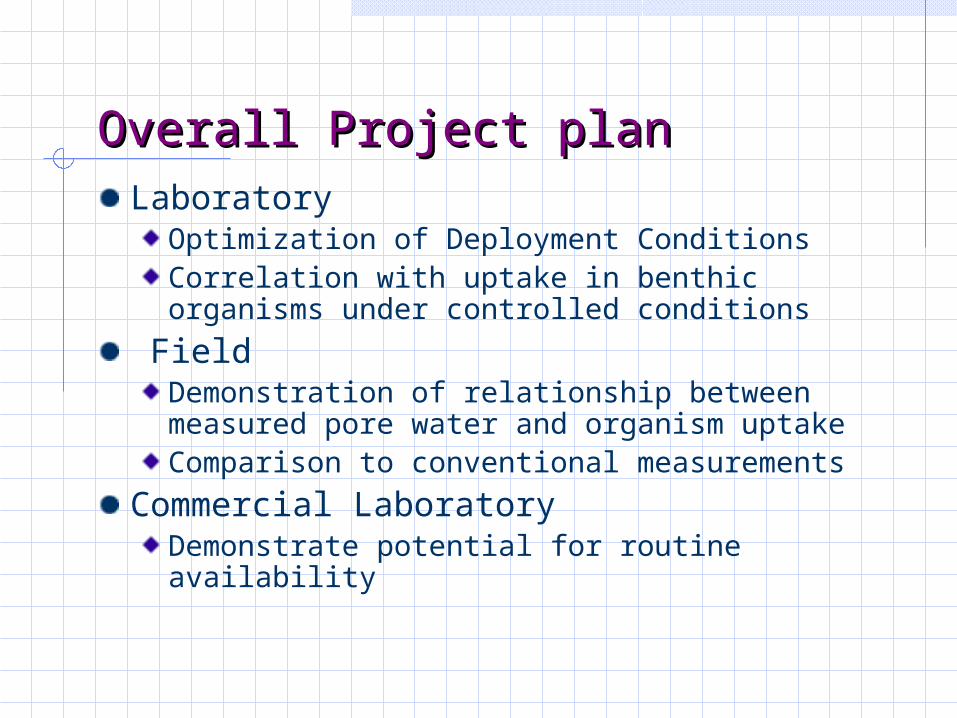
Overall Project planOverall Project planLaboratory
Optimization of Deployment ConditionsCorrelation with uptake in benthic organisms under controlled conditions
FieldDemonstration of relationship between measured pore water and organism uptakeComparison to conventional measurements
Commercial LaboratoryDemonstrate potential for routine availability
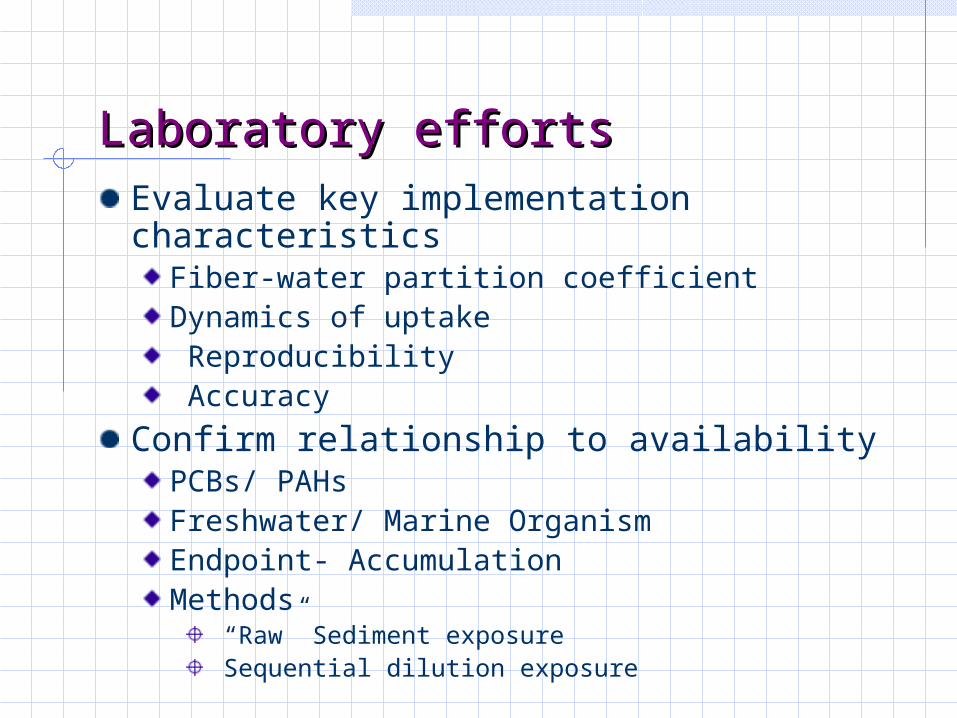
Laboratory effortsLaboratory effortsEvaluate key implementation characteristics
Fiber-water partition coefficientDynamics of uptake Reproducibility Accuracy
Confirm relationship to availability PCBs/ PAHsFreshwater/ Marine OrganismEndpoint- AccumulationMethods
“Raw” Sediment exposure Sequential dilution exposure
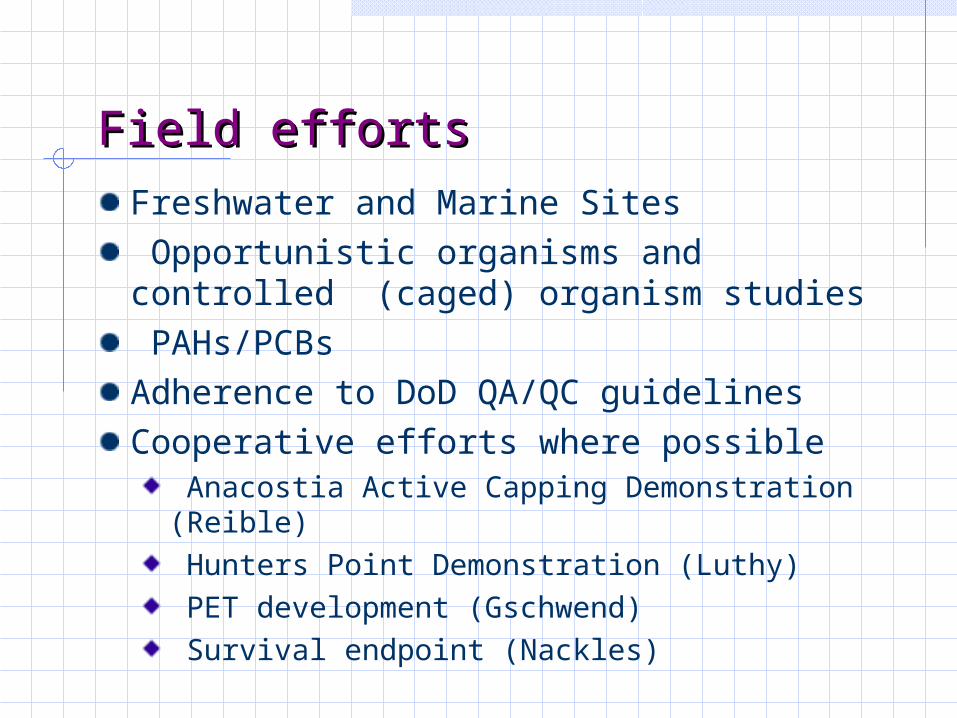
Field effortsField efforts
Freshwater and Marine Sites Opportunistic organisms and controlled (caged) organism studies PAHs/PCBsAdherence to DoD QA/QC guidelinesCooperative efforts where possible
Anacostia Active Capping Demonstration (Reible) Hunters Point Demonstration (Luthy) PET development (Gschwend) Survival endpoint (Nackles)

Solid Phase MicroExtractionSolid Phase MicroExtractionSorbent PolymerSorbent Polymer
PDMS (poly-dimethylsiloxane) Thickness of glass core: 114-108 µm Thickness of PDMS coating: 30-31 µmVolume of coating: 13.55 (±0.02) µL PDMS per meter of fibre
x

Using SPME to Measure Porewater Using SPME to Measure Porewater ConcentrationConcentration
Matrix-SPME ---A nondepletive, equilibrium extraction
“nondepletive” refers to an extraction that is limited to a minor part of the analyte and which does not deplete the analyte concentration “equilibrium” refers to extraction times are sufficiently long to bring the sampling phase into its thermodynamic equilibrium with the surrounding matrix.
At equilibrium,
Cfiber=mass of contaminant absorbed by fiber/fiber volume (volume of PDMS)
Kfiber-water is fiber-water partition coefficient
waterfiberfiberporewater KCC /

Expected detection limit PDMS fiberExpected detection limit PDMS fiber
Compounds Log KPDMS,
water
Method detection limit
Cdet,water
(1 cm fiber) Cdet,water (5cm fiber)
Phenanthrene 3.71 1.14 μg/L 164.6 32.9 ng/L pyrene 4.25 3.44 143.3 28.7 chrysene 4.66 0.79 12.8 2.56 B[b]F 5.0 0.32 2.37 0.47 B[k]F 4.77 0.15 1.89 0.38 Benzo[a]pyrene 4.87 0.17 1.70 0.34 PCB 28 5.06 0.5 3.22 0.645 PCB 52 5.38 0.5 1.54 0.31 PCB 153 6.15 0.2 0.11 0.021 PCB 138 6.20 0.2 0.0935 0.019 PCB 180 6.40 0.2 0.059 0.012

Uptake of PAHs in PDMS fiber Uptake of PAHs in PDMS fiber (Sediment)(Sediment)
0
200
400
600
800
1000
1200
0 5 10 15 20 25 30 35
Time (d)
Fib
er c
once
ntra
tion
(ug/
L)
phenanthrene chrysene B[b]F B[k]F B[a]P
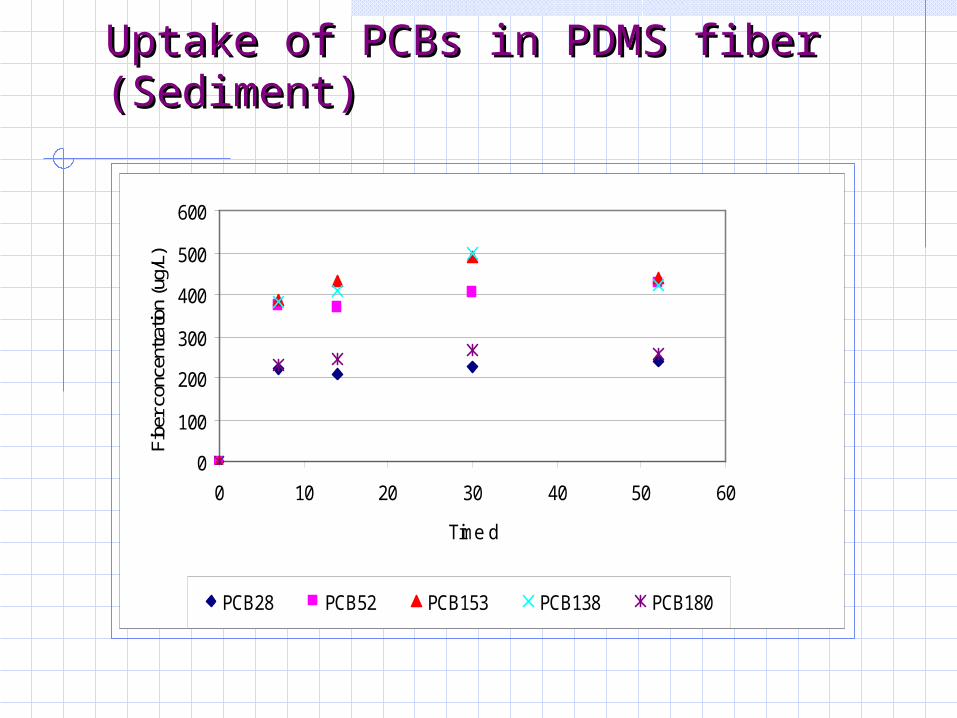
Uptake of PCBs in PDMS fiber Uptake of PCBs in PDMS fiber (Sediment)(Sediment)
0
100
200
300
400
500
600
0 10 20 30 40 50 60
Time d
Fibe
r con
cent
ratio
n (u
g/L)
PCB28 PCB52 PCB153 PCB138 PCB180
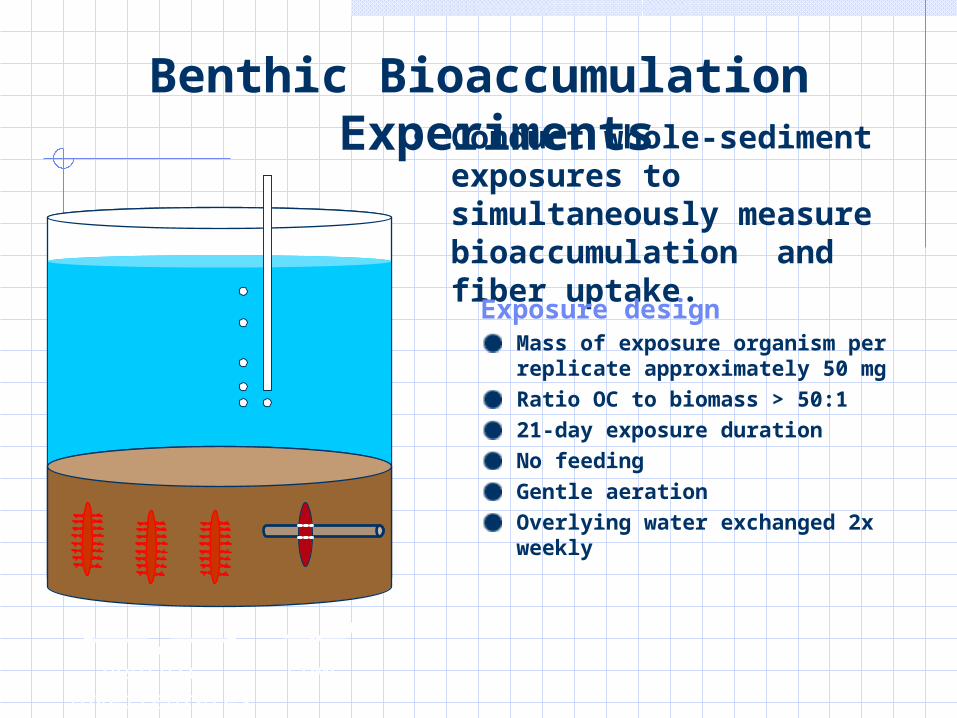
• Conduct whole-sediment exposures to simultaneously measure bioaccumulation and fiber uptake.
Benthic Bioaccumulation Experiments
Exposure designMass of exposure organism per replicate approximately 50 mgRatio OC to biomass > 50:121-day exposure durationNo feedingGentle aerationOverlying water exchanged 2x weekly
benthic invertebrates
SPME
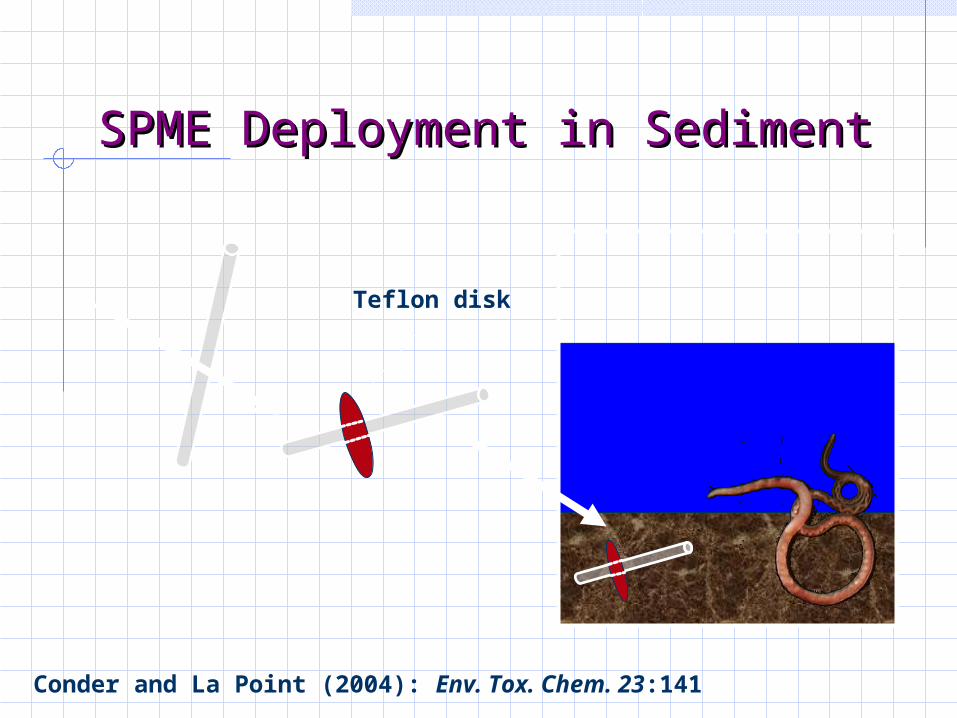
SPME Deployment in SedimentSPME Deployment in Sediment
Conder and La Point (2004): Env. Tox. Chem. 23:141
Teflon disk
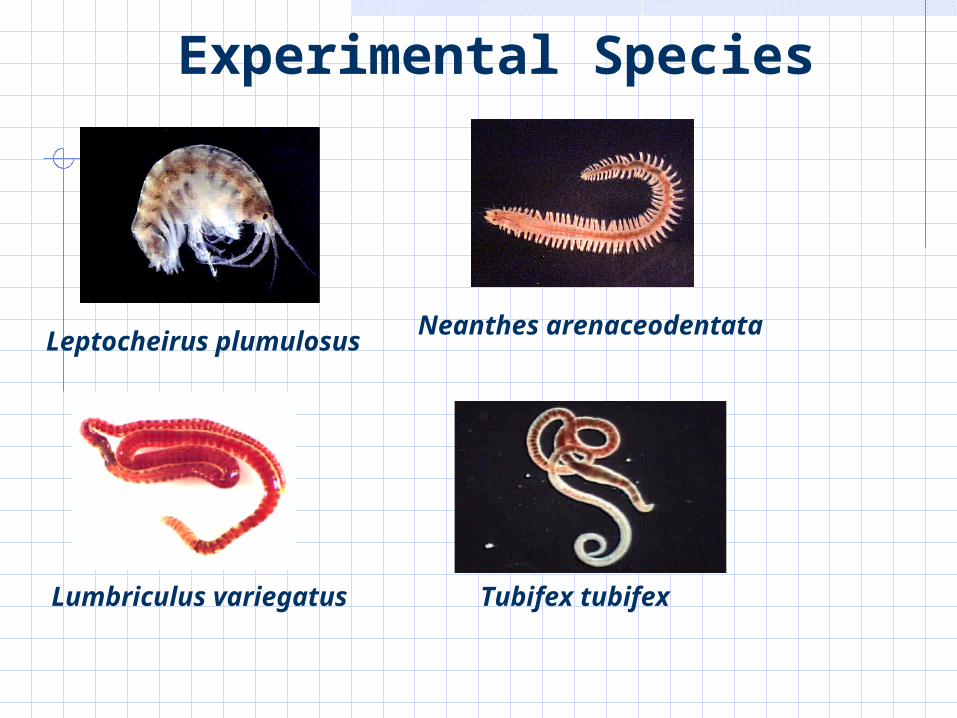
Experimental Species
Leptocheirus plumulosusNeanthes arenaceodentata
Lumbriculus variegatus Tubifex tubifex

Field Deployment SystemField Deployment System
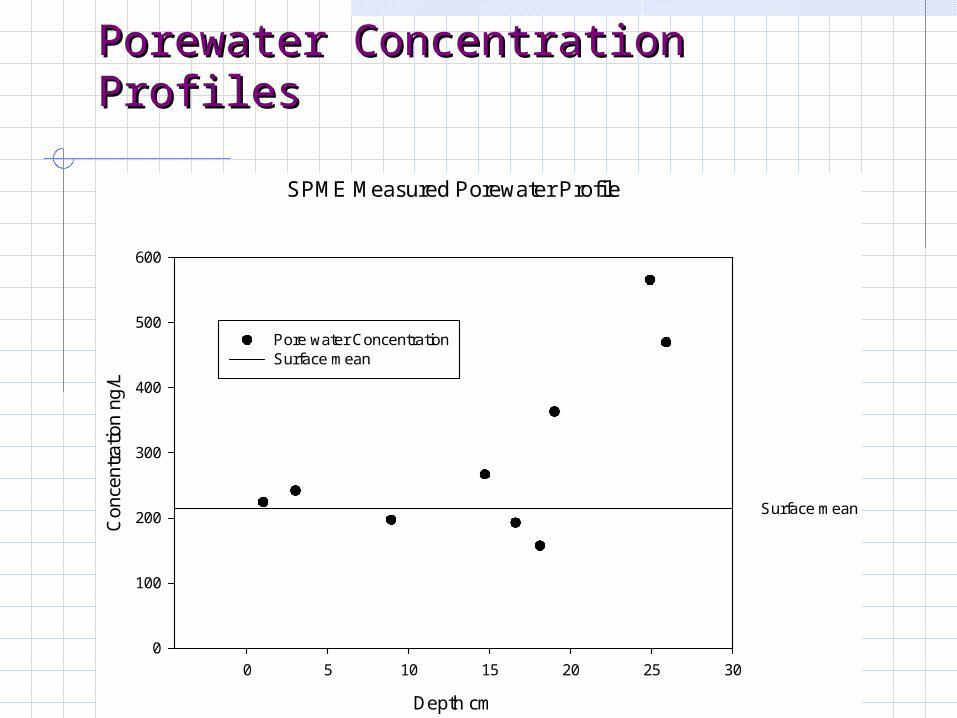
Porewater Concentration ProfilesPorewater Concentration Profiles
SPME Measured Porewater Profile
Depth cm
0 5 10 15 20 25 30
Con
cent
ratio
n n
g/L
0
100
200
300
400
500
600
Surface mean
Pore water ConcentrationSurface mean

Anacostia Sediment Porewater Anacostia Sediment Porewater ConcentrationConcentration
PAH Measured
SPME
Measured
by LLE
If
Reversibly
Sorbed
Phenanthrene 210 370 1810
pyrene 610 730 990
chrysene 7.1 7.8 83
B[b]F 2.1 5.3 70
B[k]F 1.8 2 55
B[a]P 1.9 2 68

PAHs correlated with:PAHs correlated with:
R2 = 0.49
0
2000
4000
6000
8000
10000
12000
0.00E+00 5.00E+09 1.00E+10 1.50E+10 2.00E+10 2.50E+10 3.00E+10 3.50E+10
Koc*Csed/foc
Ct/
flip
Bulk Sediment

PAHs correlated with:PAHs correlated with:
R2 = 0.82
0
2000
4000
6000
8000
10000
12000
0.00E+00 1.00E+03 2.00E+03 3.00E+03 4.00E+03 5.00E+03 6.00E+03
Koc*Cpw
Ct/
flip
Pore water

PCBs correlated with:PCBs correlated with:
R2 = 0.38
0
500
1000
1500
2000
2500
3000
3500
0.0E+00 2.0E+02 4.0E+02 6.0E+02 8.0E+02 1.0E+03 1.2E+03 1.4E+03 1.6E+03 1.8E+03
Koc*Cpw
Ct/
flip
R2 = 0.03
0
500
1000
1500
2000
2500
3000
3500
0.0E+00 5.0E+09 1.0E+10 1.5E+10 2.0E+10 2.5E+10 3.0E+10
Koc*Csed/focC
t/fl
ip
Pore water Bulk Sediment
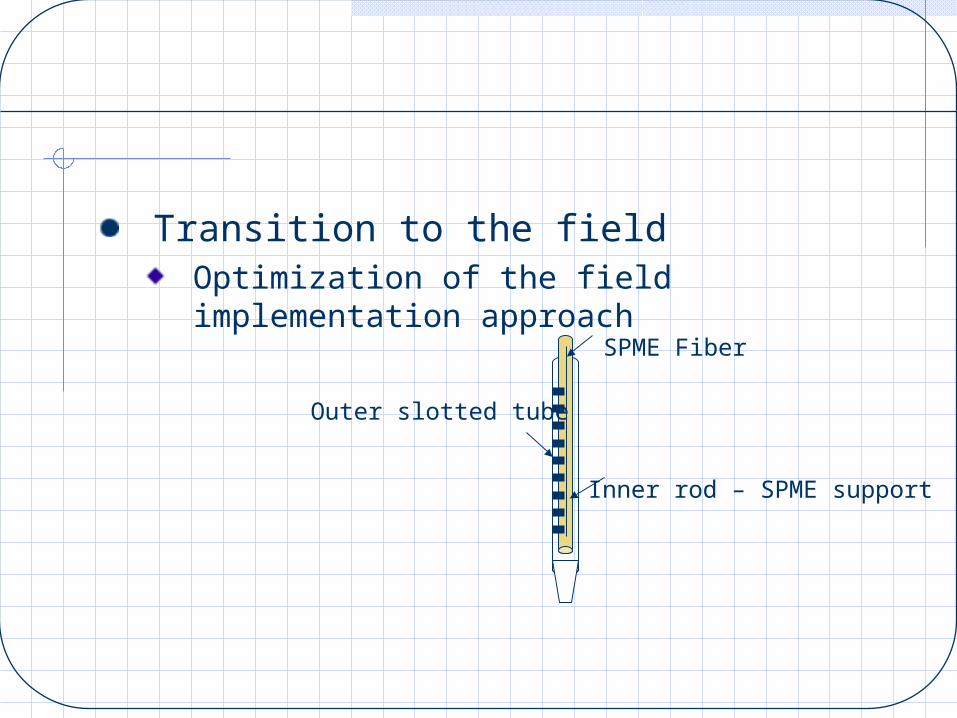
Transition to the fieldOptimization of the field implementation approach
SPME Fiber
Outer slotted tube
Inner rod – SPME support
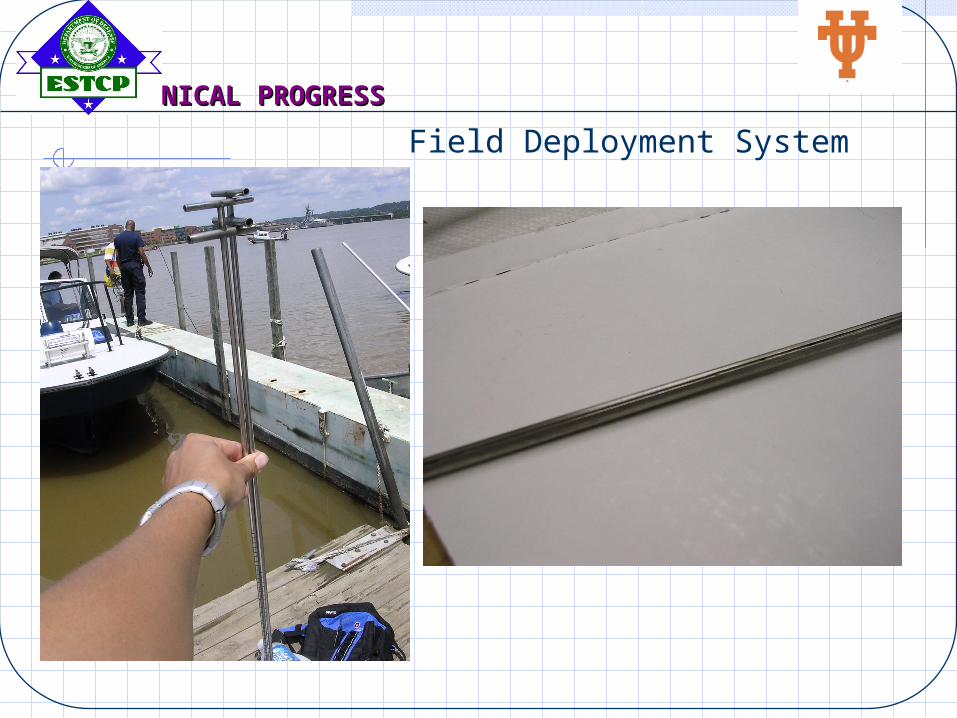
TECHNICAL PROGRESSTECHNICAL PROGRESS
Field Deployment System
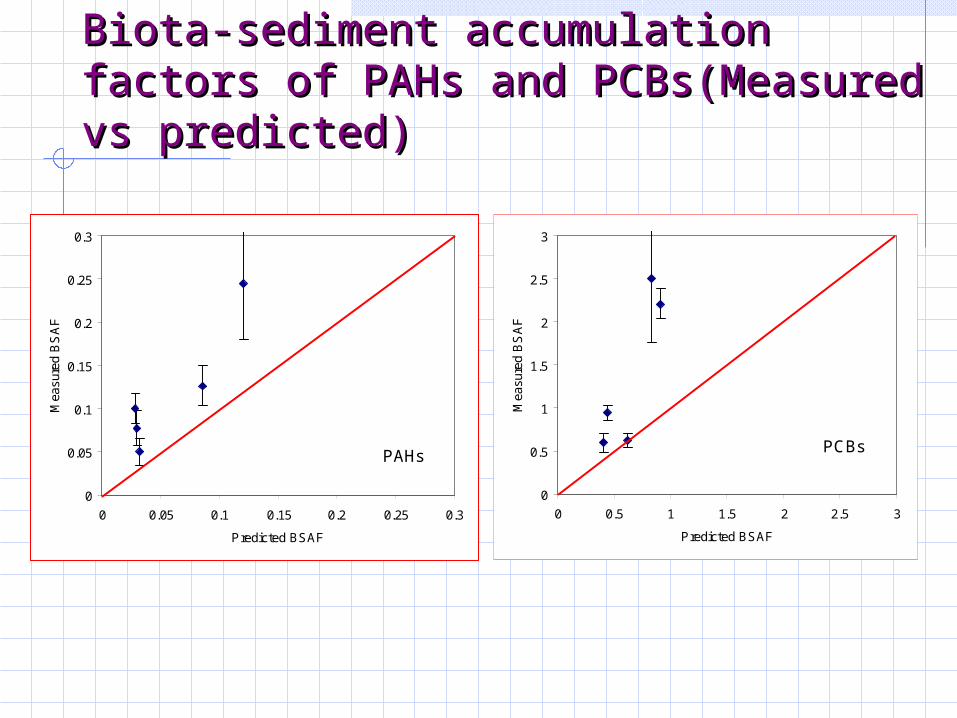
Biota-sediment accumulation factors of Biota-sediment accumulation factors of PAHs and PCBs(Measured vs predicted)PAHs and PCBs(Measured vs predicted)
0
0.05
0.1
0.15
0.2
0.25
0.3
0 0.05 0.1 0.15 0.2 0.25 0.3
Predicted BSAF
Mea
sure
d B
SA
F
PAHs
0
0.5
1
1.5
2
2.5
3
0 0.5 1 1.5 2 2.5 3
Predicted BSAF
Mea
sure
d B
SA
F
PCBs

Preliminary ConclusionsPreliminary Conclusions
Good correlation of porewater concentration with uptake for all compoundsSPME provides excellent indication of porewater concentration and uptake (within a factor of two in this preliminary assessment)Measured BSAF for both PAHs and PCBs were greater than predictedIndicates Klipid/Koc > 1
PAH - Klipid/Koc~ 1.25 - 2PCB - Klipid/Koc ~ 1-3PAHs – BSAF<<1 indicates desorption resistance in complex field-contaminated sediment

MercuryMercury
Do soluble species define exposure and risk?

Benoit et al.
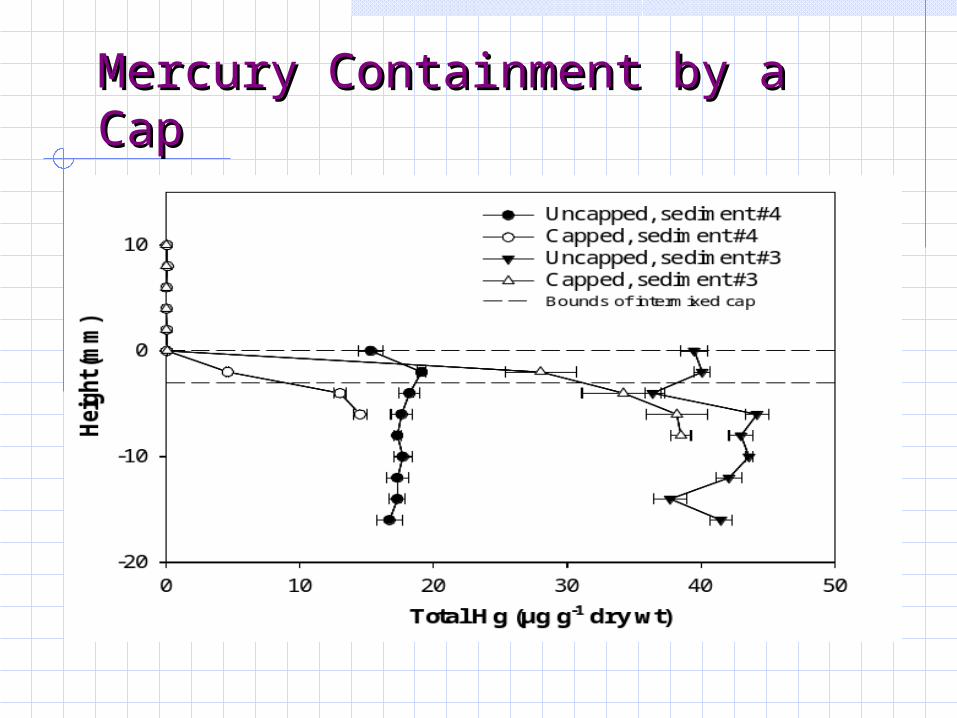
Mercury Containment by a CapMercury Containment by a Cap

Methylmercury Containment by a Methylmercury Containment by a CapCap

Methylmercury ProductionMethylmercury Production


MotivationMotivation
• Nutrient Cycling in
Sediments
• Nutrient gradients governed
by bacterial activity.
• Mercury methylation mediated
by Sulfate Reducing Bacteria.
• Mercury Methylation tied to
Sulfate Reduction
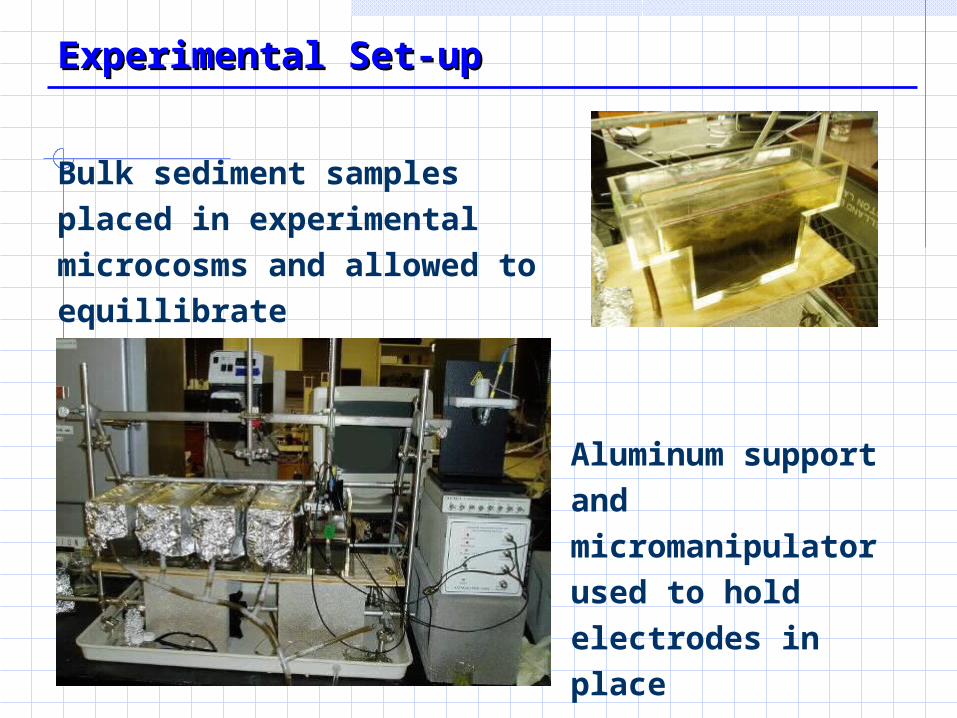
Experimental Set-upExperimental Set-up
Bulk sediment samples placed in
experimental microcosms and
allowed to equillibrate
Aluminum support and
micromanipulator used
to hold electrodes in
place
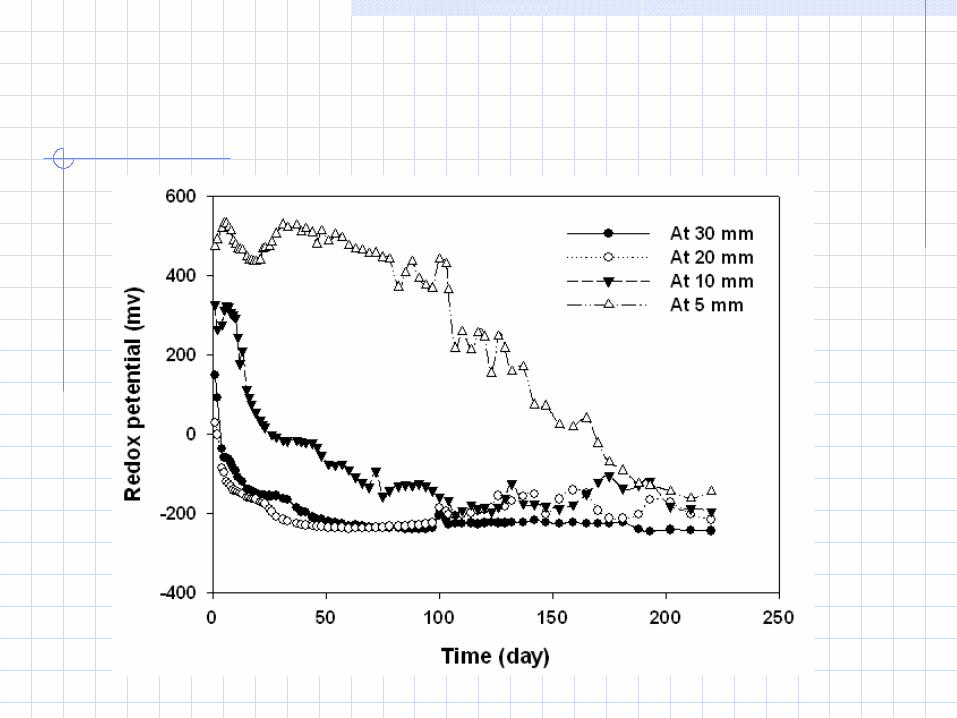

Voltammetric MicroelectrodesVoltammetric Microelectrodes
• Theory
• Apply sweeping electric potential to electrode
• Electroactive species in porewater are oxidized/reduced at characteristic potentials
• Capabilities
• Gold-Mercury amalgam microelectrode (ideally <1mm) measures O2, Fe2+, Mn2+, HS-, and FeS(aq), all environmentally important for redox cycling in sediments
Oxygen: -0.3; -1.3V Sulfide: -0.7V
Fe2+: -1.4V
Mn2+: -1.55V

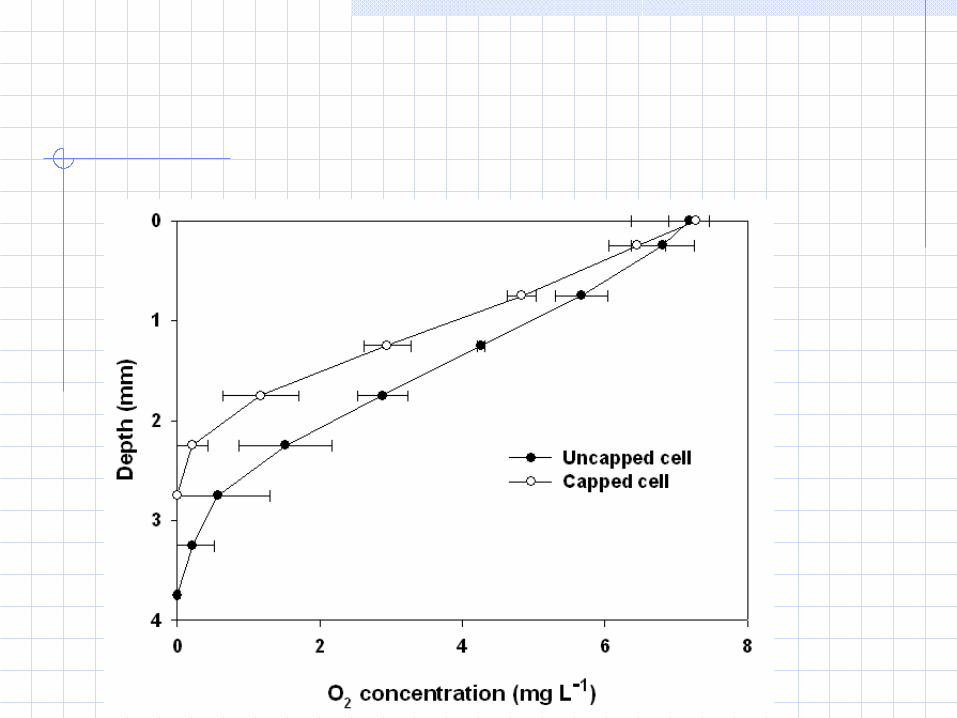
Preliminary FindingsPreliminary Findings
-18
-16
-14
-12
-10
-8
-6
-4
-2
0
2
4
0 50 100 150 200 250 300 350
Concentration [uM]
Dep
th [
mm
]
O2 [uM] Mn2+ [uM]
• Preliminary Profiles
• Oxygen disappears in first 2-3 mm in sediment
• Increasing amounts of Mn2+ (>200 uM) and Fe2+ observed
• No sulfide observed, but evidence of FeS(aq)
complex
• Probing dynamics
• Size of electrode used for profiling important
• Should be <1mm for reasonable time to equilibrium
Future PlansFuture Plans
• Capping Simulation
• Install electrodes at depths in and above sediment
• Monitor to observe steady behavior
• Place 1-2cm cap and monitor dynamics of changes in O2, Mn2+, Fe2+ due to cap placement.
• Mercury Implications
• Before and after capping simulation, core column and measure total and methyl mercury.
• Geochemical Modeling
• Calibrate geochemical model with results of experimental observations
• Link mercury methylation to sulfate reduction in model
ConclusionsConclusionsHydrophobic organic uptake controlled by pore water concentrationSPME promising method for determining pore water concentrations in-situMercury risk controlled by methyl mercury formation which is a strong function of sediment biogeochemistry and soluble species in pore waterCapping appears to reduce methylation and effectively contains all mercury speciesVoltametry promising characterization method