Defend · Web view30 April 2013For professional investors only 30 April 2013 For professional...
21
Issued in April 2013 by Schroder Investment Management Limited. 31 Gresham Street, London EC2V 7QA. Registered No. 1893220 England. Authorised and regulated by the Financial Conduct Authority. 30 April 2013 For professional investors only Schroders Economic and Strategy Viewpoint Keith Wade Chief Economist and Strategist Azad Zangana European Economist James Bilson Economist Another year of “sell in May”? Evidence is building of a slowdown in global growth, repeating the pattern seen in recent years where a strong start to the year fades in the spring. We would see the current downshift as a consequence of the inventory cycle and tighter fiscal policy in the US against an on-going backdrop of fiscal austerity and bank de-leveraging in Europe. Equity markets have reacted negatively to the slowdown in previous years. They may do so again this year, however much of the rally has been driven by defensive rather than cyclical growth sensitive stocks. Central bank money printing has played a key role in driving investors into bond-like equities with recent action by the Bank of Japan accelerating the trend. If weaker growth brings expectations of more central bank action, 2013 could see the market avoid another “sell in May”. Europe needs the ECB to act First quarter data show industrial production stabilising, however, leading indicators suggest that the pace of economic contraction may be about to worsen. Meanwhile, inflation is falling quickly, and when tax increases are excluded, some countries appear dangerously close to deflation. We expect the ECB to react by cutting interest rates in May, although we argue that more is needed to lift the economy. Unfortunately, the use of quantitative easing still seems to be some way away. Is the Chinese economy rebalancing? The recent fall in Chinese growth was caused by a reduced contribution from investment, consistent with the story of rebalancing towards consumption and away from investment. Rebalancing is likely to be a long process, however, with China still facing substantial investment requirements. Chart: Global equity and bond markets
-
Upload
truongnguyet -
Category
Documents
-
view
217 -
download
3
Transcript of Defend · Web view30 April 2013For professional investors only 30 April 2013 For professional...

Issued in April 2013 by Schroder Investment Management Limited.31 Gresham Street, London EC2V 7QA. Registered No. 1893220 England.
Authorised and regulated by the Financial Conduct Authority.
30 April 2013 For professional investors only
SchrodersEconomic and Strategy ViewpointKeith WadeChief Economist and Strategist
Azad ZanganaEuropean Economist
James BilsonEconomist
Another year of “sell in May”? Evidence is building of a slowdown in global growth, repeating the pattern
seen in recent years where a strong start to the year fades in the spring. We would see the current downshift as a consequence of the inventory cycle and tighter fiscal policy in the US against an on-going backdrop of fiscal austerity and bank de-leveraging in Europe.
Equity markets have reacted negatively to the slowdown in previous years. They may do so again this year, however much of the rally has been driven by defensive rather than cyclical growth sensitive stocks. Central bank money printing has played a key role in driving investors into bond-like equities with recent action by the Bank of Japan accelerating the trend. If weaker growth brings expectations of more central bank action, 2013 could see the market avoid another “sell in May”.
Europe needs the ECB to act First quarter data show industrial production stabilising, however, leading
indicators suggest that the pace of economic contraction may be about to worsen. Meanwhile, inflation is falling quickly, and when tax increases are excluded, some countries appear dangerously close to deflation.
We expect the ECB to react by cutting interest rates in May, although we argue that more is needed to lift the economy. Unfortunately, the use of quantitative easing still seems to be some way away.
Is the Chinese economy rebalancing? The recent fall in Chinese growth was caused by a reduced contribution
from investment, consistent with the story of rebalancing towards consumption and away from investment. Rebalancing is likely to be a long process, however, with China still facing substantial investment requirements.
Chart: Global equity and bond markets
0.5
1.0
1.5
2.0
2.5
3.0
3.5
4.0
4.5
5.0
600
800
1000
1200
1400
1600
1800
03 04 05 06 07 08 09 10 11 12 13Month of MayMSCI World price index (USD)Merrill Lynch G7 government bond yields, rhs
Index %
Source: Thomson Datastream, Schroders. 26 April 2013

30 April 2013 For professional investors only
After a strong start to the year the world economy is losing momentum
Another year of “sell in May”?There is a sense of déjà vu hanging over investors at present. For the past three years, equity markets have started the year strongly on the back of increased optimism about the world economy, only to lose faith in the spring and fall back. The “sell in May and go away” strategy has worked well.
Recent figures suggest that 2013 is following a similar pattern. The latest Purchasing Manager’s Indices’ (PMIs) gave a downbeat message indicating a loss of manufacturing momentum in April. The output PMI's fell in the US, China and the Euro area, with the latter stuck below 50 (i.e. indicating a contraction in activity). These figures suggest a deceleration in global industrial production to a 1% pace from 4% earlier in the year. New orders/ inventory ratios also weakened, a signal that next month's output indices are likely to slip further.
Chart 1: PMI’s US, China, Euro, Japan
25
30
35
40
45
50
55
60
65
2008 2009 2010 2011 2012 2013
US Eurozone Japan China
Index
Source: Markit, Schroders. 30 April 2013
These figures continue a run of softer data. In the US the Employment report disappointed with an increase of just 88,000 jobs in March, about half the expected gain. The US also saw falls in retail sales and orders for durable goods in March. The surprise index which captures the gap between expectations and outcomes in US macro data has turned negative (chart 2). The US economy was clearly losing momentum as the quarter ended.
Chart 2: US economic surprise index
-160
-120
-80
-40
0
40
80
120
160
Apr-10 Oct-10 Apr-11 Oct-11 Apr-12 Oct-12 Apr-13
Index
Positive surprises
Negative surprises
Source: Citigroup, Schroders. 26 April 20132Issued in April 2013 Schroder Investment Management Limited.31 Gresham Street, London EC2V 7QA. Registered No. 1893220 England. Authorised and regulated by the Financial Conduct Authority

30 April 2013 For professional investors only
The current slowdown has fundamental drivers
Higher taxes and the sequester to hit US activity
Elsewhere, China reported weaker than expected GDP growth for the first quarter: 7.7% y/y compared with expectations of 8%. Taiwanese export orders, often seen as a leading indicator for the region, also fell in March, another sign that manufacturing is downshifting. Copper prices, often seen as a barometer of global growth, have been weak and have just hit an 18-month low.
Genuine slowdown or statistical quirk?Ever since the bankruptcy of Lehman Brothers and subsequent collapse in the world economy in the first quarter of 2008, there has been a suspicion that statisticians have been overcompensating in their seasonal adjustments for the first three months of the year. Bad weather means this is always a slow period compared with the rest of the year so the figures are adjusted upward to compensate. However, one very bad quarter may distort subsequent attempts at adjustment. Consequently we get a false impression of first quarter strength which then unwinds sharply as the seasonal adjustments go into reverse in the second quarter.
There is no consensus on this and we can also point to other factors which have distorted the picture. For example, last year an unseasonal mild winter in the US boosted activity in the housing and retail sectors in the first quarter. In 2011, the Japanese earthquake and tsunami disrupted global growth as supply chains broke down in the second quarter. Prior to this, oil and commodity price spikes have also played a role, as has the Euro crisis throughout the period.
This year, the weather has been more “normal”, commodity prices are better behaved and the Euro crisis has not re-erupted (despite a bungled bailout in Cyprus and the uncertainty caused by the Italian elections). Instead, we would see the current slowdown as a consequence of the inventory cycle and tighter fiscal policy in the US against an on-going backdrop of fiscal austerity and bank de-leveraging in Europe.
The inventory cycle picked up at the end of last year when firms realised that the tail risks of a Euro break up or hard landing in China were not going to materialise, as central banks stepped up policy support. As we entered 2013, it also became clear that the US was not about to commit fiscal suicide by going over the cliff. Consequently as demand held up, firms had to increase production to boost inventory levels. The PMI figures suggest this effect has now played out.
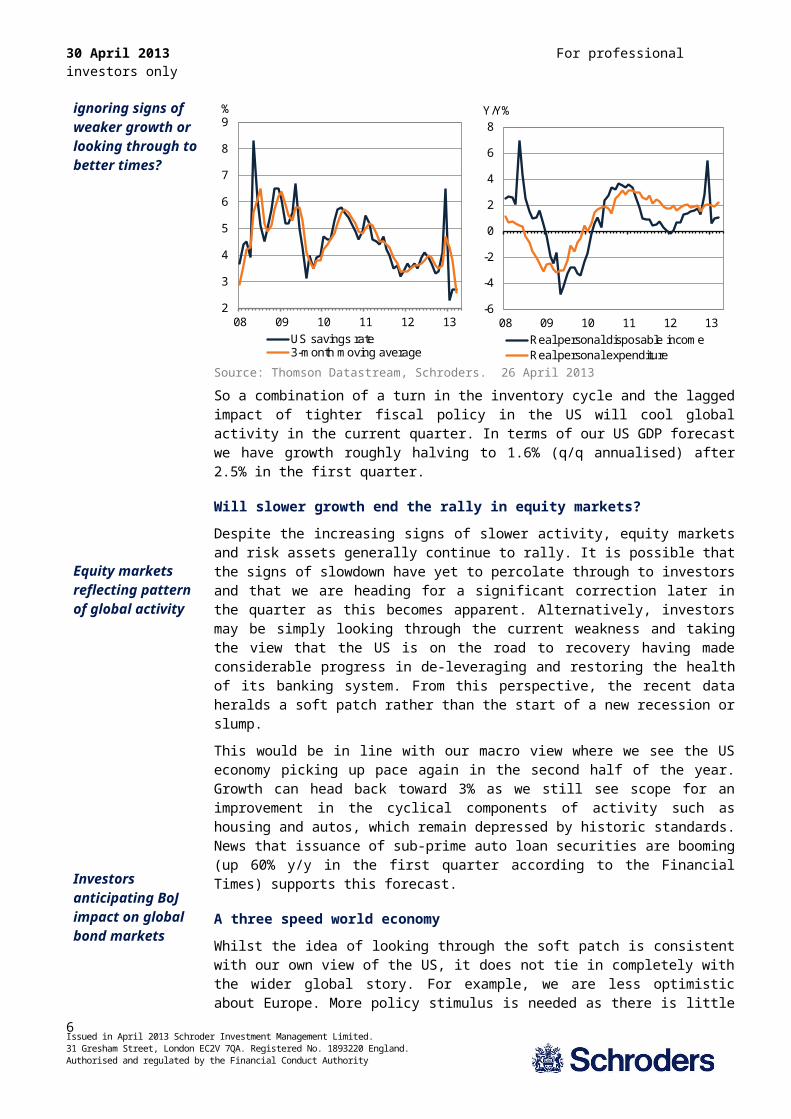
The US avoided the fiscal cliff, but not fiscal tighteningOn the US fiscal front, although the worst was not realised, taxes still rose by around 1% of GDP, primarily on wage earners. The initial reaction suggested that spending had withstood the hit as consumption held up over the first quarter. However, this was only achieved through a sharp fall in the household savings ratio and the signs are that consumers are now bringing spending back into line with disposable income (charts 3 & 4 on next page).
In addition we have had the sequester kick in from March 1st bringing sharp cuts in defence and welfare spending. There will be cuts in public employment and defence orders as a result. Although we do not expect total job losses to meet the 750k predicted by the Congressional Budget Office (CBO), the non-farm payroll figures could still see a loss of 30k jobs per month.
Issued in April 2013 Schroder Investment Management Limited.31 Gresham Street, London EC2V 7QA. Registered No. 1893220 England. Authorised and regulated by the Financial Conduct Authority
3

30 April 2013 For professional investors only
Are investors ignoring signs of weaker growth or looking through to better times?
Equity markets reflecting pattern of global activity
Charts 3 & 4: US savings rate & disposable income and spending
2
3
4
5
6
7
8
9
08 09 10 11 12 13US savings rate3-month moving average
%
-6
-4
-2
0
2
4
6
8
08 09 10 11 12 13Real personal disposable incomeReal personal expenditure
Y/Y%
Source: Thomson Datastream, Schroders. 26 April 2013
So a combination of a turn in the inventory cycle and the lagged impact of tighter fiscal policy in the US will cool global activity in the current quarter. In terms of our US GDP forecast we have growth roughly halving to 1.6% (q/q annualised) after 2.5% in the first quarter.
Will slower growth end the rally in equity markets?Despite the increasing signs of slower activity, equity markets and risk assets generally continue to rally. It is possible that the signs of slowdown have yet to percolate through to investors and that we are heading for a significant correction later in the quarter as this becomes apparent. Alternatively, investors may be simply looking through the current weakness and taking the view that the US is on the road to recovery having made considerable progress in de-leveraging and restoring the health of its banking system. From this perspective, the recent data heralds a soft patch rather than the start of a new recession or slump.
This would be in line with our macro view where we see the US economy picking up pace again in the second half of the year. Growth can head back toward 3% as we still see scope for an improvement in the cyclical components of activity such as housing and autos, which remain depressed by historic standards. News that issuance of sub-prime auto loan securities are booming (up 60% y/y in the first quarter according to the Financial Times) supports this forecast.
A three speed world economyWhilst the idea of looking through the soft patch is consistent with our own view of the US, it does not tie in completely with the wider global story. For example, we are less optimistic about Europe. More policy stimulus is needed as there is little sign that the easing of financial conditions since last summer has fed through to stronger lending activity and growth. In the emerging markets, growth is still good by developed world standards, but there has been a pick-up in inflationary pressure and policy makers are considering tighter monetary policy. Brazil has already raised its policy rate and slower growth seems in prospect.
The three speed world has become a feature of the world economy with the emerging world still enjoying the strongest growth, the US recovering and Europe stagnating.
To some extent the equity markets are reflecting this picture. The emerging equity markets are lagging the US in terms of performance. And from a multi-asset perspective we have seen the rise in risk assets accompanied by a rally in government bonds (see
Issued in April 2013 Schroder Investment Management Limited.31 Gresham Street, London EC2V 7QA. Registered No. 1893220 England. Authorised and regulated by the Financial Conduct Authority
4

30 April 2013 For professional investors only
Investors anticipating BoJ impact on global bond markets
The BoJ money printing has only started and will have a major impact in coming months
global equity and bond yield chart front page). Such a combination is relatively unusual as equity and bond markets tend to have been negatively correlated for much of the post crisis era as growth expectations have waxed and waned (i.e. rising growth expectations have been accompanied by rising equity markets and falling bond prices/ rising yields).
This pattern of market behaviour suggests that liquidity is driving risk assets by forcing bond yields down and pushing investors out along the risk curve in a search for yield. Enter the rejuvenated Bank of Japan (BoJ), with new governor Kuroda promising to double the monetary base, a move which involves stepping up asset purchases from ¥2 to ¥7 trillion and increasing the stock held by the BoJ from 30% of GDP to 60%.
In last month’s Viewpoint, we described the likely effect of the BoJ’s policy on the rest of the world with the devaluation of the Japanese Yen (JPY) generally acting in a deflationary direction, whilst capital outflows from Japanese investors seeking yield would tend to be reflationary. We did not expect to see much evidence of the latter until it became clear that the BoJ was having some success in creating inflation and that real yields on Japanese government bonds (JGB’s) had turned negative.
As yet, there is little evidence in the data that capital is flowing out of Japan. Indeed the recent Japanese Ministry of Finance figures show investors taking advantage of the weak JPY to repatriate capital. Anecdotal evidence suggests hedge funds are driving the rally in sovereign bonds, moving in anticipation of the Japanese institutions. Europe has been a beneficiary with peripheral bonds rallying alongside those from the traditional safe haven core. Whatever the cause the result is that the reflationary effects of the BoJ’s action are coming through more quickly than anticipated.
We believe this is the start of a major theme in markets. As we argued last month (see March Viewpoint), it will take considerable action by the BoJ to generate 2% inflation by the end of 2014 given the history of deflation and the size of the estimated output gap. We expect money printing to continue and to increase in pace over this period. Consequently, we could see further downward moves in bond yields even from these extraordinary levels. The JPY is likely to weaken further and support the Japanese equity market.
“Bond-like” stocks leading the equity rallyMeanwhile, global equity markets can continue to benefit. Looking at the sector breakdown of the rally it is clear that the search for yield is driving markets, not expectations of stronger global growth. According to the Wall Street Journal, within the 9% rise in the S&P500 this year, health care is up 19%, consumer staples 17% and utilities 16%. These defensive sectors are bought for their steady dividends and relative insulation from the economic cycle. By contrast the underperformers are the cyclical sectors: IT, energy and materials.
From this perspective, Quantitative Easing (QE) in Japan, alongside that in the US, is driving the equity rally as investors search for stocks which resemble bonds. Slower growth could lead to another “sell in May”, but if it leads to expectations of even more quantitative easing or other central bank action, 2013 could buck the recent trend and the rally will continue.
Issued in April 2013 Schroder Investment Management Limited.31 Gresham Street, London EC2V 7QA. Registered No. 1893220 England. Authorised and regulated by the Financial Conduct Authority
5
30 April 2013 For professional investors only
Some encouraging signs for Q1, as industrial production begins to stabilise
Q1 GDP should improve, but the Eurozone is likely to remain in recession
Europe needs the ECB to act
Is Europe really recovering? Industrial production data has improved, but leading indicators suggest that the economy could be about to take another turn for the worse. The European Central Bank now appears likely to provide some form of monetary stimulus, probably in the form of a cut in its main policy interest rate, despite there being a need for more aggressive action.
Is Europe really recovering?There have been some encouraging signs coming from the Eurozone. Despite the events in Italy and Cyprus, most European bourses are up year to date, while the yield on peripheral government bonds continue to fall. It appears that although investors have preferences for other regions of the world, there are some that are still supporting the region.
On the macro front, the latest industrial production data suggests some form of stabilisation across the biggest member states (see chart 5). Germany, France and Italy should see a substantial improvement in first quarter industrial production data, which will feed through into better GDP numbers overall.
Chart 5: Industrial production stabilising
-3.0%
-2.5%
-2.0%
-1.5%
-1.0%
-0.5%
0.0%
0.5%
Germany France Italy Spain
3-months/3-months
2012q3 2012q4 Feb '13 2013q1**2013q1 uses January and February data, and assumes no change in March to complete the quarter. Source: Thomson Datastream, Schroders. 26 April 2013.
We forecast the quarterly Eurozone aggregate GDP to improve in the first quarter, rising from -0.6% to -0.2%. The industrial production numbers above support the forecast. However, there has recently been another downturn in leading indicators which presents new downside risks to our forecast for a continued improvement in the numbers for the rest of the year.
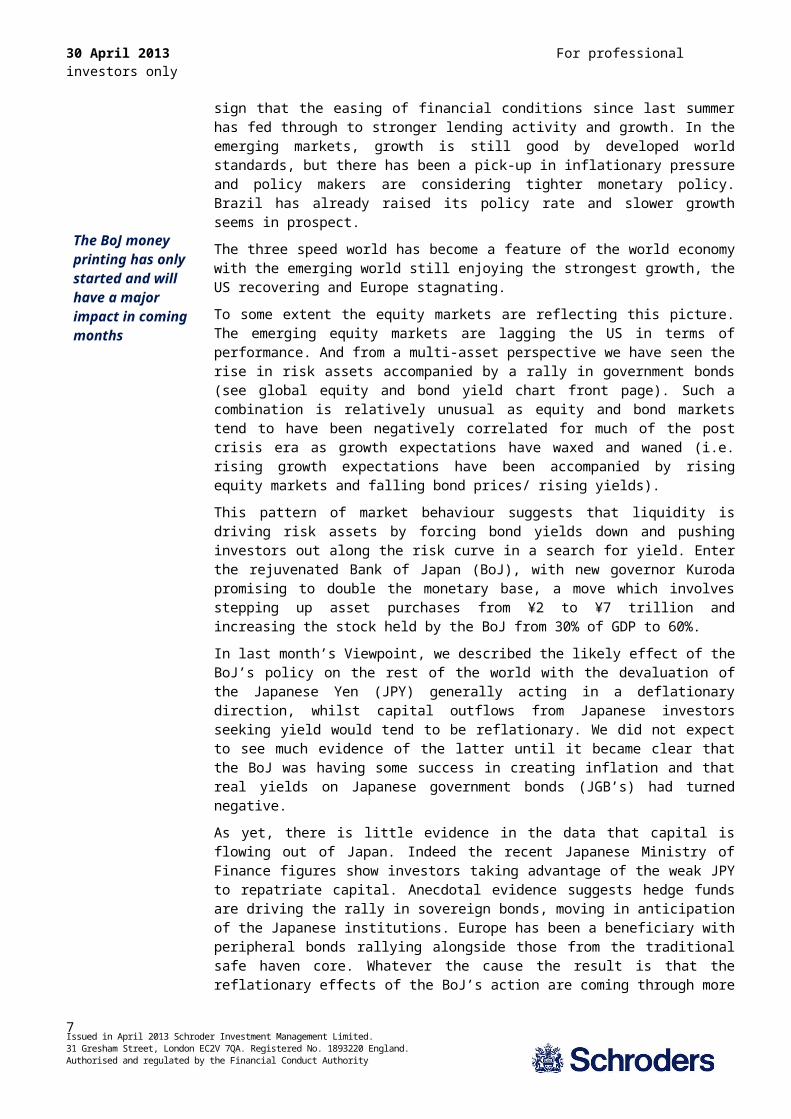
The macro composite purchasing managers’ index (PMI) for the Eurozone aggregate has fallen for three consecutive months since its peak in January. The ‘flash’ April reading of 46.3 is indicative of the pace of contraction in activity re-accelerating in the second quarter (a reading below 50 signals net overall falling activity, while above 50 signals positive growth). Similarly, our other favourite leading indicator - the Belgian National Bank (BNB) survey - is also signalling renewed weakness (see chart 6).
Issued in April 2013 Schroder Investment Management Limited.31 Gresham Street, London EC2V 7QA. Registered No. 1893220 England. Authorised and regulated by the Financial Conduct Authority
6
30 April 2013 For professional investors only
However, leading indicators suggest the pace of contraction could re-accelerate
Meanwhile, headline inflation is falling…
…and is falling even faster when you strip out the impact of tax increases.
Chart 6: Leading indicators turn down again
-6%
-4%
-2%
0%
2%
4%
6%
-6%
-4%
-2%
0%
2%
4%
6%
2006 2007 2008 2009 2010 2011 2012 2013Eurozone GDP growth, Y/Y Belgian National Bank survey*Markit PMI, EZ composite*
*Both of the surveys have been standardised to match the mean and standard deviation of the annual GDP figures, to provide an unbiased signal on growth. Source: Thomson Datastream, Eurostat, Markit, BNB, Schroders. 26 April 2013.
The PMIs and BNB survey are not the only indicators pointing to further weakness. Both the German IFO and the French INSEE surveys have been noticeably weaker too. It appears that while we could see an improvement in the GDP figures for the first quarter, we may yet see the decline in activity persisting for longer this year than previously anticipated.
Deflation risk risingWhile the growth recovery is being called into question, the inflation data continues to show underlying inflation falling across the Eurozone. Annual headline HICP inflation has fallen from 2.2% at the end of 2012 to 1.2% in March - meeting the European Central Bank’s target of below, but close to 2% annual inflation, but is also becoming a little too low for comfort. The falls have been largely as a result of lower inflation from energy and transportation costs. Indeed, with the economy in recession and unemployment rising sharply in a number of states, rising spare capacity especially in the labour market is causing a build up of deflationary pressure.The underlying weakness in pricing is highlighted further when taking into account the impact of tax increases. The headline rate of inflation in some countries if being artifically raised by increases in value added tax (VAT), along with a number of duties. Once these effects come out of the calculation, then the annual figures will turn down sharply. Eurostat helpfully publishes estimates of inflation rates excluding the impact of tax increases. These show that the Eurozone aggregate inflation rate excluding taxes for March (April not yet available) would be 1.3% instead of the headline 1.7% rate, which includes the impact of one-off tax increases (see chart 7 on next page).
Issued in April 2013 Schroder Investment Management Limited.31 Gresham Street, London EC2V 7QA. Registered No. 1893220 England. Authorised and regulated by the Financial Conduct Authority
7

30 April 2013 For professional investors only
The ECB needs to act, but options are limited
Chart 7: Underlying Eurozone inflation falling
-1%
0%
1%
2%
3%
4%
5%
2006 2007 2008 2009 2010 2011 2013
Y/Y
Eurozone Headline Headline excl. tax changesHeadline HCPI data is available for April, but the excluding taxes measure is only to March. Source: Thompson Datastream, Eurostat, Schroders. 30 April 2013.
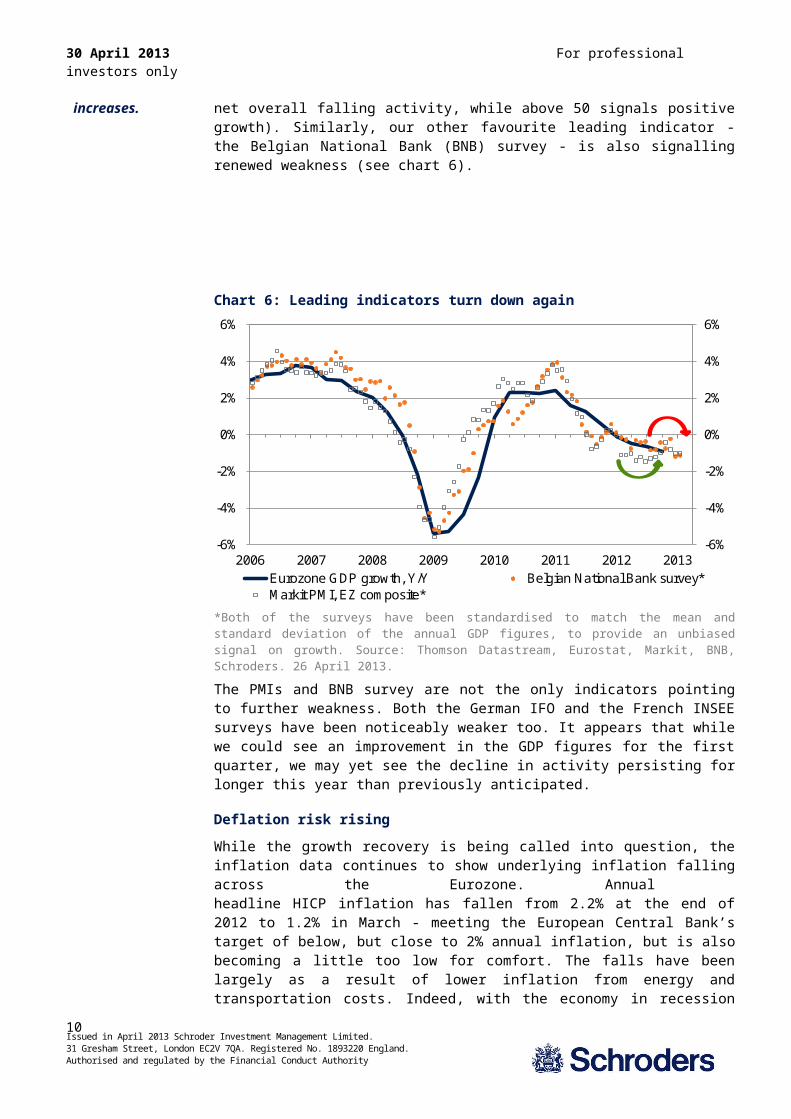
For individual countries that have raised their rates of VAT in the past year, the distortion is even greater. For example, the annual inflation rate in the Netherlands was 3.2% in March, but excluding the impact of the increase in VAT (raised from 19% to 21% in October 2012), inflation is 1.6% - half of the headline rate (see chart 8).Similarly, Spain’s headline inflation rate stood at 2.6% in March, however, when the impact of the increase in VAT (raised from 18% to 21% in September 2012), inflation is just 0.5% - less than a fifth of the headline rate (see chart 9).
Calling ‘Super’ MarioLeading indicators suggest the Eurozone recovery is in jeopardy, while inflation is falling, and is likely to fall further by the end of the year. Could the ECB intervene with additional monetary stimulus?Earlier this month, ECB President Mario Draghi said the executive committee was ready to act if the macro environment deteriorated further. The evidence presented in this note suggests that the ECB should act in the near future to support the economy. Options are limited for the central bank. The obvious action would be to cut the main policy interest rate (refinancing rate) from 0.75%, along with the marginal lending rate, currently at 1% (paid by banks that borrow more than the prescribed usual amounts). The ECB could also explore more non-standard measures like providing liquidity through long-term refinancing operations (LTROs). However, liquidity appears to be plentiful, so much so that some banks have been repaying LTRO cash borrowed last year, while inter-bank interest rates are currently lower than the ECB’s main policy interest rate (a sign of excess liquidity, which would normally be mopped up through open market operations). Quantitative Easing (QE) is the obvious suggestion, and would help push investors out of government bonds, and into something more productive. However, the legality of quantitative easing by the ECB is still under question. We recently asked the ECB directly if QE was a possibility, the response was blunt and unequivocal - “…Article 123 of the Treaty on the Functioning of the European Union prohibits the
Issued in April 2013 Schroder Investment Management Limited.31 Gresham Street, London EC2V 7QA. Registered No. 1893220 England. Authorised and regulated by the Financial Conduct Authority
8

30 April 2013 For professional investors only
We expect the ECB to cut interest rates by 25bps, but not to do much else. QE is still off the table
monetary financing of governments through the ECB.”In fact at the time of writing, German newspaper Handesblatt published details of a leaked opinion written by the Bundesbank, that it opposed the ECB’s current bond buying programme - outright monetary transactions (OMT). The opinion was submitted to the German constitutional court in its assessment of the OMT programme at the end of last year. Although the OMT programme has not been activated, it has been crucial in restoring confidence in peripheral government bonds, and the Euro itself.It seems that the common version of quantitative easing remains off the table for now, but there are signs that even the politics in Germany is changing. In a speech at the German Savings Banks’ day in Dresden, German Chancellor Angela Merkel unusually commented on monetary policy, and specifically, the need to address the broken transmission mechanism in peripheral Europe, referring to gains in competitiveness made through structural reforms, but lost to higher interest rates. On the face of it, this looks like a big step forward from Merkel, however, it’s worth remembering that Merkel is fighting for re-election, which appears to bring about sudden waves of pro-peripheral comments, only to be followed by back-peddling or unexpected conditions (the Spanish banking recapitalisation programme is just one example).In our view, Mario Draghi must take charge of the ECB’s executive committee, and push for more stimulus for the economy. We are changing our forecast for base rates in expectation of a 25 basis point reduction in the forthcoming May meeting. However, we doubt the ECB is ready to offer much more than the rate cut at this stage. This is unfortunate as we doubt the rate cut would have much of an impact on the economy. Banks that are able to lend have plentiful liquidity as mentioned above. Banks which are generally more reliant on the ECB for funding are likely to be shrinking their balance sheets, and so would not pass on a rate cut in the form of new lending. Instead, Draghi needs to challenge the ECB’s legal framework and begin to discuss QE as a potential policy option. It must be discussed as a deflation fighting tool rather than a tool to monetise debt, which is how it has been portrayed over the past few years in Europe.
Is the Chinese economy rebalancing?
It is often commented that the Chinese economy exhibits destabilising imbalances, with investment spending having risen strongly in recent years and far outstripping private consumption as a share of GDP. However, there are reasons to believe that this high level of investment can persist for longer than many commentators suggest. The recent first quarter GDP release continued to suggest that the much vaunted rebalancing towards domestic consumption and away from investment has started, but it is likely be a long and slow progress.
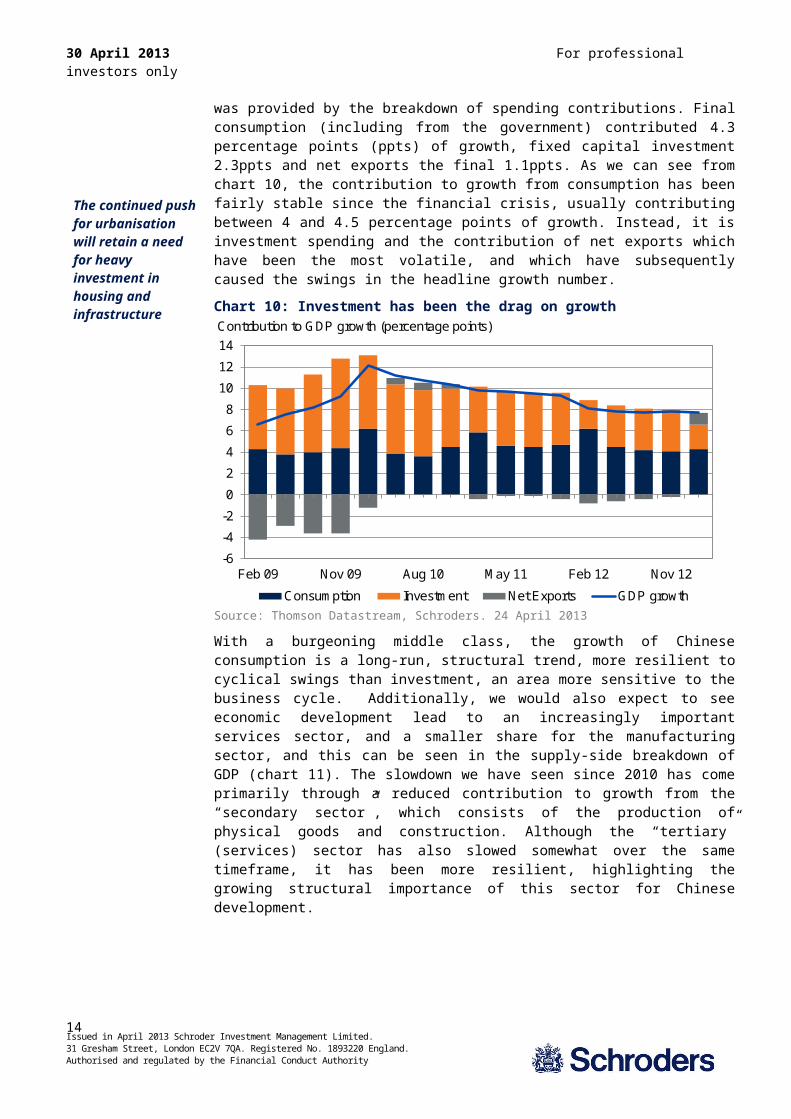
Aside from the surprise fall in first quarter GDP growth to 7.7% (from 7.9% in the fourth quarter), an interesting insight was provided by the breakdown of spending contributions. Final consumption (including from the government) contributed 4.3 percentage points (ppts) of growth, fixed capital investment 2.3ppts and net exports the final 1.1ppts. As we can see from chart 10, the contribution to growth from consumption has been fairly stable since the financial crisis, usually contributing between 4 and 4.5 percentage points of growth. Instead, it is investment spending and the contribution of net exports which have been the most volatile, and which have subsequently caused the swings in the headline growth number.
Chart 10: Investment has been the drag on growth
Issued in April 2013 Schroder Investment Management Limited.31 Gresham Street, London EC2V 7QA. Registered No. 1893220 England. Authorised and regulated by the Financial Conduct Authority
The slowdown in growth was caused by the contribution from investment
9
30 April 2013 For professional investors only
Increased consumption is long-term structural theme, resilient to cyclical swings
-6
-4
-2
0
2
4
6
8
10
12
14
Feb 09 Nov 09 Aug 10 May 11 Feb 12 Nov 12
Consumption Investment Net Exports GDP growth
Contribution to GDP growth (percentage points)
Source: Thomson Datastream, Schroders. 24 April 2013
With a burgeoning middle class, the growth of Chinese consumption is a long-run, structural trend, more resilient to cyclical swings than investment, an area more sensitive to the business cycle. Additionally, we would also expect to see economic development lead to an increasingly important services sector, and a smaller share for the manufacturing sector, and this can be seen in the supply-side breakdown of GDP (chart 11). The slowdown we have seen since 2010 has come primarily through a reduced contribution to growth from the “secondary sector”, which consists of the production of physical goods and construction. Although the “tertiary” (services) sector has also slowed somewhat over the same timeframe, it has been more resilient, highlighting the growing structural importance of this sector for Chinese development.
Chart 11: The service sector has been more resilient than manufacturing
0
1
2
3
4
5
6
7
8
2002 2003 2004 2005 2006 2007 2008 2009 2010 2011 2012
Primary sector Secondary sector Tertiary sector
Contribution to GDP growth (percentage points)
Issued in April 2013 Schroder Investment Management Limited.31 Gresham Street, London EC2V 7QA. Registered No. 1893220 England. Authorised and regulated by the Financial Conduct Authority
10

30 April 2013 For professional investors only
The continued push for urbanisation will retain a need for heavy investment in housing and infrastructure
The stock of fixed capital in China is not disproportionate to GDP, and depreciates quickly
Source: Thomson Datastream, Schroders. 24 April 2013
Detailed data on the tertiary sector has only recently been made available, but we have seen an increased contribution to growth from the real estate services sector since the middle of last year, which is unsurprising given the improvements we have seen in sales volumes in the property market. Despite the strength of retail sales data recently, however, the retail and wholesale service sector’s growth contribution has been declining in recent quarters. Nonetheless, retail remains the dominant service sector in terms of its contribution to growth.
While there are likely to be cyclical disturbances, structurally we should continue see a rise in the growth contribution of the services and consumption sectors somewhat offset a decline in the manufacturing and investment contributions, as China grows in wealth. However, this is likely to be a gradual process, and suggestions that this rebalancing towards consumption spells the end investment boom may be premature for a couple of key reasons.
First and foremost, the ongoing urbanisation process in China will remain supportive of heavy investment programmes. Just over 50% of the Chinese population are urbanised currently, and the authorities have announced a target of 60% by 2020. Although the urban population has grown sharply in China over the past decade, the parallels with the experience of Korea around 35 years ago suggests that this strong growth can continue for many years to come (chart 12). After reaching a similar stage of the urbanisation process that China is currently facing, the urbanisation rate of Korea continued to grow a further twenty percentage points in just over a decade. The demands this process places on housing and infrastructure maintains a need for heavy investment spending.
Chart 12: The urbanisation of China has a lot further to go
30
40
50
60
70
80
90
t-8 t-4 Baseyear
t+4 t+8 t+12 t+16 t+20
Korea (base year = 1977) China (base year = 2011)
Urban population (% of total)
Issued in April 2013 Schroder Investment Management Limited.31 Gresham Street, London EC2V 7QA. Registered No. 1893220 England. Authorised and regulated by the Financial Conduct Authority
11
30 April 2013 For professional investors only
The quality and efficiency of investment must be improved to correct the current underuse of resources
Source: Thomson Datastream, World Bank, Schroders. 24 April 2013
Secondly, though investment growth has been very strong, the Chinese capital stock relative to GDP remains below more advanced peers. This is unsurprising, given that China is not as wealthy, but suggests that there is scope for further catching up to take place. Measured in terms of capital per worker, the scope for further investment growth is even greater. Additionally, the relatively high rate of depreciation of the Chinese capital stock creates a demand for investment spending in fixed assets to replace obsolete machinery. Although the trend in depreciation has improved over the past decade, it remains a significant share of GDP, and this will maintain the need for substantial investment spending going forward.
Finally, investment remains the one of the quickest way for authorities to shore-up a rapid cyclical deterioration. The reduction in the official growth target was an acceptance that growth rates are likely to be lower going forward and mild slowdowns will be tolerated. Signs of a sharper decline or “hard landing”, as occurred in the middle of last year, however, will continue to be met with stimulus to support the economy and prevent unrest. Though it would be preferable for this impetus to occur through consumers (such as reducing taxes), to aide the rebalancing process, the reality remains that investment stimulus remains quicker to implement and take effect.
This is not to say that all the investment in China is efficient, or that rebalancing is not important. The extremely low rate of capacity utilisation (chart 13), and its rapid decline in the past decade, is indicative of an economy directing too many resources to unproductive sectors- primarily via state-owned enterprises (SOEs). We believe this has been a major cause of the deflation seen in Chinese producer prices, with corporates having little pricing power. It is vital that the efficiency and productiveness of investment spending is improved to eradicate this underutilisation of resources, and the liberalisation of the financial system, another long-term theme, will be beneficial in allowing the market to determine the allocation of capital as opposed to policymakers.
Chart 13: Capacity utilisation rate has plummeted - a sign of inefficiency
Issued in April 2013 Schroder Investment Management Limited.31 Gresham Street, London EC2V 7QA. Registered No. 1893220 England. Authorised and regulated by the Financial Conduct Authority
12

30 April 2013 For professional investors only
50
60
70
80
90
100
90 91 92 93 94 95 96 97 98 99 00 01 02 03 04 05 06 07 08 09 10 11 12
Average capacity utilisation rate
%
Source: IMF staff estimates, Societe Generale, April 2013.
Schroders Baseline Forecast
Issued in April 2013 Schroder Investment Management Limited.31 Gresham Street, London EC2V 7QA. Registered No. 1893220 England. Authorised and regulated by the Financial Conduct Authority
13
30 April 2013 For professional investors only
Real GDPy/y% Wt (%) 2012 2013 Prev. Consensus 2014 Prev. ConsensusWorld 100 2.4 2.4 (2.4) 2.5 3.2 (3.2) 3.1
Advanced* 65.2 1.2 1.0 (1.0) 1.1 1.9 (1.9) 1.8US 23.6 2.2 2.1 (2.1) 2.1 2.7 (2.7) 2.7Eurozone 20.4 -0.5 -0.6 (-0.6) -0.4 0.7 (0.7) 0.9
Germany 5.6 0.9 0.5 (0.5) 0.7 1.5 (1.5) 1.7UK 3.8 0.0 0.6 (0.6) 0.7 1.3 (1.3) 1.6Japan 9.2 1.9 1.0 (1.0) 1.3 2.3 (2.3) 1.3
Total Emerging** 34.8 4.6 5.2 (5.2) 5.2 5.6 (5.6) 5.5BRICs 21.1 5.5 6.2 (6.2) 6.3 6.5 (6.5) 6.5
China 11.4 7.7 8.2 (8.2) 8.2 8.3 (8.3) 8.0
Inflation CPI y/y% Wt (%) 2012 2013 Prev. Consensus 2014 Prev. ConsensusWorld 100 2.8 2.7 (2.7) 2.7 2.6 (2.6) 2.9
Advanced* 65.2 1.9 1.5 (1.5) 1.6 1.6 (1.6) 2.0US 23.6 2.2 1.7 (1.7) 1.9 1.7 (1.7) 2.1Eurozone 20.4 2.5 1.7 (1.7) 1.7 1.6 (1.6) 1.6
Germany 5.6 2.1 1.9 (1.9) 1.7 1.8 (1.8) 2.0UK 3.8 2.8 3.2 (3.2) 3.4 3.0 (3.0) 3.1Japan 9.2 -0.5 0.0 (0.0) 0.1 0.4 (0.4) 1.9
Total Emerging** 34.8 4.5 4.9 (4.9) 4.8 4.5 (4.5) 4.8BRICs 21.1 4.2 4.8 (4.8) 4.7 4.3 (4.3) 4.7
China 11.4 2.7 3.7 (3.7) 3.2 3.3 (3.3) 3.5
Interest rates % (Month of Dec) Current 2012 2013 Prev. Market 2014 Prev. Market
US 0.25 0.25 0.25 (0.25) 0.31 0.25 (0.25) 0.44UK 0.50 0.50 0.50 (0.50) 0.47 0.50 (0.50) 0.53Eurozone 0.75 0.75 0.50 (0.75) 0.20 0.50 (0.75) 0.33Japan 0.10 0.08 0.08 (0.08) 0.22 0.08 (0.08) 0.25China 6.00 6.00 6.00 (6.00) - 6.00 (6.00) -
Other monetary policy(Over year or by Dec) Current 2012 2013 Prev. 2014 Prev.
US QE ($Bn) 1660 1900 2920 (2920) 3175 (3175)UK QE (£Bn) 325 375 450 (450) 450 (450)Eurozone LTRO NO YES YES YES YES YESChina RRR (%) 20.00 20.00 20.00 20.00 20.00 20.00
Key variablesFX Current 2012 2013 Prev. Y/Y(%) 2014 Prev. Y/Y(%)
USD/GBP 1.55 1.60 1.52 (1.52) -5.0 1.50 (1.50) -1.3USD/EUR 1.31 1.25 1.35 (1.35) 8.0 1.30 (1.30) -3.7JPY/USD 98.2 82.0 100.0 (100.0) 22.0 105.0 (105.0) 5.0GBP/EUR 0.85 0.78 0.89 (0.89) 13.7 0.87 (0.87) -2.4RMB/USD 6.17 6.20 6.10 (6.10) -1.6 6.00 (6.00) -1.6
CommoditiesBrent Crude 103.0 112 115.2 (115) 3.3 107.4 (107) -6.8
Previous forecast refers to November 2012
Croatia, Latvia, Lithuania.
Source: Schroders, Thomson Datastream, Consensus Economics, April 2013Market data as at 29/04/2013
* Advanced markets: Australia, Canada, Denmark, Euro area, Israel, Japan, New Zealand, Singapore, Sw eden, Sw itzerland, Sw eden, Sw itzerland, United Kingdom, United States.
** Emerging markets : Argentina, Brazil, Chile, Colombia, Mexico, Peru, Venezuela, China, India, Indonesia, Malaysia, Philippines, South Korea, Taiw an, Thailand, South Africa, Russia, Czech Rep., Hungary, Poland, Romania, Turkey, Ukraine, Bulgaria,
I. Updated forecast charts - Consensus Economics
Issued in April 2013 Schroder Investment Management Limited.31 Gresham Street, London EC2V 7QA. Registered No. 1893220 England. Authorised and regulated by the Financial Conduct Authority
14

30 April 2013 For professional investors only
For the EM, EM Asia and Pacific ex Japan, growth and inflation forecasts are GDP weighted and calculated using Consensus Economics forecasts of individual countries.Chart A: GDP consensus forecasts
2013 2014
-1
0
1
2
3
4
5
6
7
8
Jan Mar May Jul Sep Nov Jan Mar
%
EM Asia
Pac ex JP
USUK
Eurozone Japan
Month of forecast
EM
-1
0
1
2
3
4
5
6
7
8
Jan Mar
%
EM Asia
Pac ex JP
US
UK
EurozoneJapan
Month of forecast
EM
Chart B: Inflation consensus forecasts2013 2014
-1
0
1
2
3
4
5
6
Jan Mar May Jul Sep Nov Jan Mar
%
EM Asia
Pac ex JP
USUK
Eurozone
Japan
Month of forecast
EM
-1
0
1
2
3
4
5
6
Jan Feb Mar Apr
%
EM Asia
Pac ex JP
USUK
EurozoneJapan
Month of forecast
EM
Source: Consensus Economics (April 2013), SchrodersPacific ex. Japan: Australia, Hong Kong, New Zealand, SingaporeEmerging Asia: China, India, Indonesia, Malaysia, Philippines, South Korea, Taiwan, ThailandEmerging markets: China, India, Indonesia, Malaysia, Philippines, South Korea, Taiwan, Thailand, Argentina, Brazil, Colombia, Chile, Mexico, Peru, Venezuela, South Africa, Czech Republic, Hungary, Poland, Romania, Russia, Turkey, Ukraine, Bulgaria, Croatia, Estonia, Latvia, Lithuania
The views and opinions contained herein are those of Schroder Investments Management's Economics team, and may not necessarily represent views expressed or reflected in other Schroders communications, strategies or funds.
This document does not constitute an offer to sell or any solicitation of any offer to buy securities or any other instrument described in this document. The information and opinions contained in this document have been obtained from sources we consider to be reliable. No responsibility can be accepted for errors of fact or opinion. This does not exclude or restrict any duty or liability that Schroders has to its customers under the Financial Services and Markets Act 2000 (as amended from time to time) or any other regulatory system. Reliance should not be placed on the views and information in the document when taking individual investment and/or strategic decisions. For your security, communications may be taped or monitored.
Issued in April 2013 Schroder Investment Management Limited.31 Gresham Street, London EC2V 7QA. Registered No. 1893220 England. Authorised and regulated by the Financial Conduct Authority
15