Carbonate Production Carbonate Production Carbonate Production Carbonate Platforms

Deep water temperature, carbonate ion, and ice volume changesacross the Eocene‐Oligocene climate transition
A. E. Pusz,1 R. C. Thunell,1 and K. G. Miller2
Received 16 February 2010; revised 11 January 2011; accepted 28 January 2011; published 21 April 2011.
[1] Paired benthic foraminiferal stable isotope and Mg/Ca data are used to estimate bottomwater temperature (BWT) and ice volume changes associated with the Eocene‐OligoceneTransition (EOT), the largest global climate event of the past 50 Myr. We utilized ODPSites 1090 and 1265 in the South Atlantic to assess seawater d18O (dw), Antarctic icevolume, and sea level changes across the EOT (∼33.8–33.54 Ma). We also use benthicd13C data to reconstruct the sources of the deep water masses in this region during the EOT.Our data, together with previously published records, indicate that a pulse of NorthernComponent Water influenced the South Atlantic immediately prior to and following theEOT. Benthic d18O records show a 0.5‰ increase at ∼33.8 Ma (EOT‐1) that represents a∼2°C cooling and a small (∼10 m) eustatic fall that is followed by a 1.0‰ increaseassociated with Oi‐1. The expected cooling of deep waters at Oi‐1 (∼33.54 Ma) is notapparent in our Mg/Ca records. We suggest the cooling is masked by coeval changes in thecarbonate saturation state (D[CO3
2−]) which affect the Mg/Ca data. To account for this, theBWT, ice volume, and dw estimates are corrected for a change in the D[CO3
2−] of deepwaters on the basis of recently published work. Corrected BWT at Sites 1090 and 1265show a ∼1.5°C cooling coincident with Oi‐1 and an average dw increase of ∼0.75‰. Theincrease in ice volume during Oi‐1 resulted in a ∼70 m drop in global sea level and thedevelopment of an Antarctic ice sheet that was near modern size or slightly larger.
Citation: Pusz, A. E., R. C. Thunell, and K. G. Miller (2011), Deep water temperature, carbonate ion, and ice volume changesacross the Eocene‐Oligocene climate transition, Paleoceanography, 26, PA2205, doi:10.1029/2010PA001950.
1. Introduction
[2] Earth’s climate has experienced a long‐term coolingover the past 50 million years as evidenced by a 5‰increase in deep sea benthic foraminiferal d18O during thisperiod [Savin et al., 1975; Shackleton and Kennett, 1975;Miller et al., 1987, 2005; Zachos et al., 2001]. Resultantoxygen isotope temperature estimates [Miller et al., 1987,2005; Zachos et al., 2001], along with benthic foraminiferalMg/Ca paleotemperatures, suggest as much as a ∼12°Ccooling of deep waters over the past 50 Myr [Lear et al.,2000; Billups and Schrag, 2002, 2003]. The Cenozoiccooling trend has been attributed to changes in ocean‐atmosphere circulation patterns associated with opening andclosing of ocean gateways [Kennett, 1977; Schnitker, 1980;Woodruff and Savin, 1989; Wright et al., 1992; Raymo,1994] and changes in atmospheric CO2 levels [Vincentand Berger, 1985; Flower and Kennett, 1993; DeContoand Pollard, 2003; Pagani et al., 2005; Pearson et al.,2009].
[3] The Eocene‐Oligocene transition (EOT) was thelargest of several abrupt events that punctuated the overallCenozoic cooling trend [Berger, 1982; Miller et al., 1987;Zachos et al., 2001]. In well‐resolved records, the ∼1.5‰benthic foraminiferal d18O increase at the EOT appears to bea two‐step event with the first phase beginning at 33.8 Ma(0.5‰) followed by a second increase of 1.0‰, Oi‐1(“Oligocene isotope event 1”), at 33.54 Ma [Miller et al.,1991, 2008; Zachos et al., 1996; Coxall et al., 2005]. Thed18O shift across the EOT reflects both deep water coolingand the development of continental‐size ice sheets on Ant-arctica [Miller et al., 1991, 2005; Zachos et al., 1996; Coxallet al., 2005; Lear et al., 2008]. Independent evidence for theonset of Antarctic glaciation associated with the EOT in-cludes the presence of ice rafted detritus at high southernlatitudes and changes in clay mineralogy in the SouthernOcean [Ehrmann, 1991; Ehrmann and Mackensen, 1992;Zachos et al., 1992; Robert et al., 2002].[4] Mg/Ca ratios of benthic foraminiferal calcite can
serve as an independent proxy for bottom water temper-ature [Nurnberg et al., 1996; Rosenthal et al., 1997; Leaet al., 1999; Elderfield and Ganssen, 2000]. However, theprimary BWT component can be masked by changes inthe carbonate ion concentration ([CO3
2−]) and saturationstate (D[CO3
2−]) of deep waters [Elderfield et al., 2006;Rosenthal et al., 2006; Yu and Elderfield, 2008]. The [CO3
2−]ion effect is based on core top Mg/Ca calibrations that show
1Department of Earth and Ocean Sciences, University of SouthCarolina, Columbia, South Carolina, USA.
2Department of Earth and Planetary Sciences, Rutgers University,Piscataway, New Jersey, USA.
Copyright 2011 by the American Geophysical Union.0883‐8305/11/2010PA001950
PALEOCEANOGRAPHY, VOL. 26, PA2205, doi:10.1029/2010PA001950, 2011
PA2205 1 of 15
higher temperature sensitivities in waters <3°C [Martin et al.,2002] attributed to the [CO3
2−] and D[CO32−] of seawater
[Elderfield et al., 2006; Rosenthal et al., 2006; Healey et al.,2008; Yu and Elderfield, 2008]. A change in the [CO3
2−] isimportant since there is a large‐scale (>1 km) drop in thecarbonate compensation depth (CCD) associated with theEOT [van Andel, 1975; Coxall et al., 2005]. Thus, pairedbenthic foraminiferal d18O and Mg/Ca ratios that are cor-rected for a change in the [CO3
2−] of deep waters can, inprinciple, be used to differentiate the contributions of icevolume and temperature to the d18O increase at the EOT.[5] Initial Mg/Ca studies of the past 50 million years at a
low resolution indicated there was no major change in BWTacross the EOT [Lear et al., 2000; Billups and Schrag,2003], implying that the entire 1.5‰ d18O increase wasdue to an ice volume change. Subsequent work at a higherresolution by Lear et al. [2004] using South Atlantic DeepSea Drilling Project (DSDP) Site 522 and equatorial PacificOcean Drilling Program (ODP) Site 1218 inferred a ∼2°Cwarming of deep water associated with Oi‐1 (Figure 1).However, any increase in BWT poses a problem because itrequires more growth of ice than can be accommodated onAntarctica today [Coxall et al., 2005; DeConto et al., 2008].The issue of ice accommodation space led to the hypothesisthat there were significant Northern Hemisphere ice sheetsduring the earliest Oligocene [Coxall et al., 2005; Tripatiet al., 2005]. No definitive evidence of large‐scale Eocene‐Oligocene northern hemisphere glaciation exists, leavingonly the current hypothesis of small valley glaciers andephemeral ice caps to explain the presence of drop stonesrecently identified off the coast of Greenland [Eldrett et al.,2007].[6] A more likely scenario points toward a change in the
D[CO32−] of deep waters caused by a global CCD drop that
influenced benthic foraminiferal Mg/Ca ratios across theEOT [van Andel, 1975; Lear et al., 2004; Coxall et al.,
2005; Rea and Lyle, 2005]. Benthic foraminiferal Li/Caratios support the hypothesis that an increased [CO3
2−] ofdeep waters is the primary influence on benthic foraminif-eral Mg/Ca records across the EOT [Lear and Rosenthal,2006; Lear et al., 2010; Peck et al., 2010]. Benthic fora-miniferal Li/Ca ratios provide a way to estimate a change indeep water [CO3
2−] because of a response to calcificationrates that is influenced by the seawater [CO3
2−] [Hall andChan, 2004; Lear and Rosenthal, 2006].[7] A recent study estimated a ∼29 mmol/kg [CO3
2−]increase in South Atlantic deep waters coincident with Oi‐1based on benthic foraminiferal Li/Ca ratios [Peck et al., 2010].Similarly, it is reported that there was a ∼37 mmol/kg [CO3
2−]rise in equatorial Pacific deep waters associated with Oi‐1[Lear and Rosenthal, 2006; Lear et al., 2010]. We use pub-lished Li/Ca records from ODP Site 1263 on the WalvisRidge [Peck et al., 2010] and ODP Site 1218 in the equatorialPacific [Lear et al., 2010] to correct for benthic foraminiferalMg/Ca overprinting due to [CO3
2−] changes associated withOi‐1. Site 1218 Li/Ca data [Lear et al., 2010] was selected tocorrect our Site 1090 benthic foraminiferal Mg/Ca recordbecause of its paleowater depth (≥3.7 km at ∼34Ma). The Site1263 Li/Ca record [Peck et al., 2010] was chosen to correctSite 1265 Mg/Ca ratios because it is in close proximity andhas a similar paleowater depth at ∼34 Ma. The [CO3
2−] cor-rection factor used on our benthic foraminiferal Mg/Ca data isbased on an empirical sensitivity of 0.0086 mmol/mol/mmol/kg [Elderfield et al., 2006].[8] Two deep sea sediment records with complete sections
across the EOT are utilized in the present study to investigatedeep water temperature and global ice volume changes. Wechose South Atlantic ODP Sites 1090 and 1265 (Figure 1)because of excellent core recovery, high carbonate content,and good foraminiferal preservation. Orbital‐scale resolution(10 and 40 cm sampling) benthic foraminiferal (Cibicidoidesspp.) d18O, d13C, and Mg/Ca records were generated across
Figure 1. Paleogeographic reconstruction for 34 Ma showing the locations of Ocean Drilling Program(ODP) Sites 1090 and 1265 used in this study (red circles) and Deep Sea Drilling Project (DSDP) Site 522and ODP Site 1218 (blue circles) from previous studies [Zachos et al., 1996; Coxall et al., 2005]. Themap was created using the Ocean Drilling Stratigraphic Network (http://www.odsn.de/).
PUSZ ET AL.: EOT TEMPERATURE AND ICE VOLUME PA2205PA2205
2 of 15

the EOT for both sites. As mentioned above, Sites 1090 and1265 benthic foraminiferal Mg/Ca records are corrected forchanges in the [CO3
2−] based on recent Li/Ca data from Pecket al. [2010] and Lear et al. [2010].[9] We assess the reliability of our benthic foraminiferal
stable isotope records by placing them into a global contextusing the multisite isotopic compilation from Cramer et al.[2009]. Benthic foraminiferal d13C data across the EOTfrom South Atlantic Sites 1090 and 1265 are compared toexisting records from equatorial Pacific ODP Site 1218[Coxall et al., 2005] and South Atlantic DSDP Site 522[Zachos et al., 1996] to reconstruct source regions for deepwater masses (Figure 1). Previous stable isotope work at Site1265 [Liu et al., 2004] reported on the benthic foraminiferalspecies C. praemundulus at a low resolution (∼50 kyr) fromtwo separate holes across the EOT. Site 1265 stable isotopeand trace metal data from the present study is derived from asingle hole (1265B) at a higher resolution (10 cm; equiva-lent to ∼17 kyr) in efforts to gain complete coverage ofchanges in deep water across the EOT.
2. Methods
2.1. Site Selection and Age Control
[10] South Atlantic ODP Site 1090 hole B is located on thesouthern flank of the Agulhas Ridge (42°54.8′S, 8°53.9′E) ata water depth of 3702 m, which is above the present‐daylysocline depth (4300 m) [Milliman, 1993; Dittert andHenrich, 2000]. The paleowater depth for Site 1090 isestimated to have been ∼3000–3300 m at ∼34 Ma (usingequations of Miller et al. [1986] and Stein and Stein [1992]and the following parameters: present water depth of 3702 m,sediment thickness of 800 m, basement age of 87 Ma, andpreexponential empirical constant of −3650). The CCD at∼34 Ma was positioned at ∼3100 m in the South Atlantic[Peck et al., 2010]. Site 1090 was located at approximately49°S, 2°E at ∼34 Ma [Anderson and Delaney, 2005]. TheEocene‐Oligocene boundary interval is located in sedimentsclassified as nannofossil‐diatom ooze with approximately30 weight percent carbonate [Gersonde et al., 1999]. A totalof one hundred and eighteen samples were taken at 40 cmintervals between 35 and 33.1 Ma (225–287 mcd), represent-ing a sample spacing of ∼10 kyr. ODP Site 1090 has excellentage control (Figures S1 and S2 in the auxiliarymaterial) basedon previously published magnetostratigraphy that is corre-lated to the geomagnetic polarity time scale (GPTS)[Channell et al., 2003].1 Average sedimentation rates for thelatest Eocene to earliest Oligocene section at Site 1090 are∼3.7 cm/kyr.[11] South Atlantic ODP Site 1265 hole B is located on
the Walvis Ridge (28°50.1′S, 2°38.3′E) at 3083 m waterdepth [Zachos et al., 2004]. The present‐day position of thelysocline in the Cape Basin is 4000 m [Hodell et al., 2001;Volbers and Henrich, 2002; Henrich et al., 2003]. Thepaleowater depth for Site 1265 at ∼34 Ma was ∼2400 m[Zachos et al., 2004] and the CCD was at ∼3100 m [Pecket al., 2010]. The paleolatitude for Site 1265 was ∼34°S,9°E during the latest Eocene [http://www.odsn.de/]. The
EOT sediments at this location display a change in com-position from uppermost Eocene clay bearing nannofossilooze to lowermost Oligocene foraminiferal‐dominatednannofossil ooze with carbonate content between 85% and95% [Zachos et al., 2004]. A total of 121 samples weretaken every 10 cm (equivalent to ∼17 kyr) between 32.8 and34.2 Ma (183–196mcd). Age control for Site 1265 is based onthe age‐depth model determined from magnetostratigraphyand calcareous nannofossil stratigraphy [Zachos et al., 2004].Sedimentation rates for the latest Eocene to earliest Oligoceneinterval average ∼0.5 cm/kyr.[12] The foraminiferal tests used are from burial depths of
180–200 m for Site 1265 and 200–300 m for Site 1090 andthus may have undergone some postdepositional dissolutionof the primary calcite [Liu et al., 2004]. Postburial disso-lution can alter the Mg/Ca ratios of foraminiferal tests bypreferentially removing Mg‐rich calcite causing artificiallycolder temperatures [e.g., Brown and Elderfield, 1996;Dekens et al., 2002; Regenberg et al., 2006; Rosenthal andLohmann, 2002; Rosenthal et al., 2000]. Similarly, post-burial accumulation of secondary calcite can modify theprimary Mg/Ca ratio and yield spuriously colder tempera-tures estimates depending on the amount and composition ofrecrystallization [Baker et al., 1982; Delaney, 1989]. Scan-ning electron microscope (SEM) images of benthic fora-miniferal tests from Sites 1090 and 1265 reveal excellentpreservation, with no indication of secondary calcification(Figure 2). Furthermore, any potential BWT change result-ing from minor dissolution/diagenesis would be less than theanalytical (±0.9°C) or calibration (±1.3°C) error; majordiagenesis is precluded based on the excellent preservationrevealed by SEM micrographs. We conclude the originalisotopic and geochemical signals incorporated in the fora-miniferal tests are not altered by diagenesis or dissolutionbased on our SEM images for both sites (Figure 2).[13] Oxygen and carbon isotope data for Sites 1090 and
1265 are plotted versus depth, core recovery, magneto-chronology, biostratigraphic zones, and lithology to estimatesedimentation rates and develop age models (Figures S1 andS2 in the auxiliary material). Though both sites lack a pre-cise orbital chronology, intersite correlations suggest thatthe magnetobiostratigraphic age models (Figure 3) haveuncertainties of less than 0.1 Myr. Chronology for Site 1090relies primarily on paleomagnetic age reversals [Channellet al., 2003] that are in good agreement with nannofossildatum levels [Marino and Flores, 2002]. The Site 1265 agemodel from 33 to 34 Ma is based primarily on nannofossiland paleomagnetic data [Zachos et al., 2004, chap. 6]. Theoldest 200 kyr interval for Site 1265 (34–34.2 Ma) is cor-related to the benthic foraminiferal d13C record from Site1090 to account for potential reworking.
2.2. Analytical Methods
[14] Sites 1090 and 1265 sediment samples were dis-aggregated in buffered water and washed through a 63 mmmesh sieve. Washed samples were dry sieved through a150 mm sieve and five to ten benthic foraminiferal specimensof the epifaunal genus Cibicidoides were picked from eachsample for stable isotope analysis. Approximately 100 mg ofsample was dissolved in 100% phosphoric acid and analyzedfor oxygen and carbon stable isotopes using a GV‐Isoprimestable isotope mass spectrometer. Isotope values are reported
1Auxiliary materials are available in the HTML. doi:10.1029/2010PA001950.
PUSZ ET AL.: EOT TEMPERATURE AND ICE VOLUME PA2205PA2205
3 of 15

relative to the VPDB (Vienna PeeDee belemnite) standard(d18O = −2.20‰ and d13C = 1.95‰; following Coplen et al.[1983]). Replicate analysis of our standard yields an analyt-ical precision (1s) of 0.06‰ for oxygen and 0.05‰ forcarbon. A portion of the Site 1090 samples (35 to 33.4 Ma)were analyzed on a Micromass Optima mass spectrometer atRutgers University using procedures similar to thosedescribed above. The laboratory standard was checked reg-ularly against NBS‐19, which has a d18O offset equal to0.04‰ and a d13C offset of 0.10‰. The laboratory standarderror (1s) is equal to 0.08‰ for d18O and 0.05‰ for d13C.[15] Five to ten individual benthic foraminifera were
cleaned for trace metal analysis with both the reductive andoxidative steps outlined by Boyle and Keigwin [1985].Foraminiferal tests (300–400 mg) were crushed prior tocleaning to ensure homogenization. Each cleaned samplewas dissolved in 500–800 mL of 5% HNO3 to yield a cal-
cium concentration of approximately 80 ppm. Magnesiumand calcium were measured simultaneously on a Jobin YvonUltima Inductively Coupled Plasma Atomic EmissionSpectrophotometer (ICP‐AES). Replicate analyses of astandard solution produced an analytical precision of 0.4%.Duplicate trace metal analyses performed downcore on 10%of the benthic foraminiferal samples resulted in an averagereproducibility of ±0.11 mmol/mol for Site 1265 and±0.17 mmol/mol for Site 1090 (Figure S3 in the auxiliarymaterial).
2.3. Mg‐Temperature Calibration
[16] We utilized the Mg/Ca temperature calibrationdeveloped by Raitzsch et al. [2008] for the benthic fora-miniferal species Cibicidoides mundulus,
Mg=Ca ¼ 0:627 exp 0:143� BWTð Þ; ð1Þ
Figure 2. SEM images of Ocean Drilling Program Sites 1090 and 1265 benthic foraminiferal specimensfrom the genus Cibicidoides at 228.24 and 186.58 m composite depth (mcd), respectively. (a) ODP Site1090 Cibicidoides grimsdalei SEM image at 400 mms from 228.24 mcd with 30 weight percent CaCO3
[Latimer and Filippelli, 2002]. (b) ODP Site 1090 Cibicidoides grimsdalei SEM image at 10 mms from228.24 mcd with 30 weight percent CaCO3 [Latimer and Filippelli, 2002]. (c) ODP Site 1265 Cibici-doides praemundulus SEM image at 400 mms showing spiral side of foraminifera from 186.58 mcd with85 weight percent CaCO3 [Kroon et al., 2006]. (d) ODP Site 1265 Cibicidoides praemundulus SEMimage at 400 mms showing umbilical side of foraminifera from 186.58 mcd with 85 weight percentCaCO3 [Kroon et al., 2006].
PUSZ ET AL.: EOT TEMPERATURE AND ICE VOLUME PA2205PA2205
4 of 15

where Mg/Ca and BWT are the C. praemundulus Mg/Caratio and bottom water temperature (°C), respectively.Temperatures calculated with this equation have an uncer-tainty of ±1.27°C. While Yu and Elderfield [2008] found nocorrelation between the Mg/Ca ratios of C. mundulus andBWT, a few other studies have shown a significant corre-lation [Elderfield et al., 2006; Healey et al., 2008]. Inaddition, C. mundulus has been used successfully toreconstruct BWT changes across Neogene global climatetransitions [Lear et al., 2003; Shevenell et al., 2008].[17] The calibration from Raitzsch et al. [2008] was
chosen for three reasons: (1) C. mundulus is considered tohave evolved from C. praemundulus [van Morkhoven et al.,1986]; (2) the equation is based on present‐day bottomwater temperatures between 1° and 15°C; and (3) theabsolute calculated BWT are comparable to previouslypublished latest Eocene‐earliest Oligocene deep water
temperatures using stable oxygen isotopes [Savin et al.,1975; Zachos et al., 1994] and low‐resolution benthicforaminiferal Mg/Ca records [Lear et al., 2000]. Our choiceof temperature calibration should have a minimal effect onthe relative temperature change because the publishedexponential equations that are based on both mixed speciesof Cibicidoides [Rosenthal et al., 1997; Martin et al., 2002;Lear et al., 2002; Elderfield et al., 2006] and C. mundulus[Lear et al., 2003; Raitzsch et al., 2008] have similarexponential constants (0.10 to 0.11 mmol/mol). Publishedlinear calibrations for Cibicidoides spp. [Rathburn and DeDeckker, 1997] and single species, C. mundulus [Healeyet al., 2008], result in overall lower‐amplitude temperaturechanges with the exception of the single species, C. mun-dulus, equation from Elderfield et al. [2006]. Furthermore,deep water temperatures during the Cenozoic are considered
Figure 3. ODP Sites 1090 and 1265 benthic foraminiferal stable isotope records across the Eocene‐Oligocene transition. (a) Sites 1090 (blue circles) and 1265 (red circles) benthic foraminiferal (Cibicidoidesspp.) d18O data verses age in millions of years. (b) Sites 1090 and 1265 benthic (Cibicidoides spp.) fora-miniferal d13C data. Oxygen and carbon isotope values are reported relative to the VPDB (Vienna PeeDeebelemnite) standard. Gray bars mark the EOT‐1 (Eocene‐Oligocene transition event 1), EOT‐2 (Eocene‐Oligocene transition event 2), and Oi‐1 (Oligocene isotope event 1) events occurring at 33.8, 33.63, and33.54 Ma, respectively [Miller et al., 1991, 2008; Lear et al., 2004; Coxall et al., 2005; Katz et al., 2008].The biomagnetostratigraphic age model follows Berggren et al. [1995], Cande and Kent [1995], andBerggren and Pearson [2005].
PUSZ ET AL.: EOT TEMPERATURE AND ICE VOLUME PA2205PA2205
5 of 15

to be fairly uniform throughout all of the ocean basins at anygiven time period [Savin et al., 1975].[18] We assumed the seawaterMg/Ca ratio was 4.3mmol/mol
at ∼34 Ma [Wilkinson and Algeo, 1989], compared to thepresent‐day ratio of 5.1 mmol/mol [Broecker and Peng,1982; Stanley and Hardie, 1998]. Although there is uncer-tainty in calculating Cenozoic paleotemperatures due tochanges in seawater Mg/Ca over time [Lear et al., 2000;Billups and Schrag, 2002], we feel confident the relativetemperature change across such a rapid event as the EOTremains unaffected by this issue because of the long resi-dence times of Mg and Ca in the ocean [Broecker and Peng,1982].
3. Results
3.1. Carbon Isotopes
[19] Site 1090 benthic foraminiferal (Cibicidoides spp.)d13C values vary between 0.0 and 0.7‰ from the base of therecord to ∼33.9 Ma (Figure 3). A 0.5‰ increase occurswithin ∼100 kyr beginning at ∼33.9 Ma and likely corre-sponds to EOT‐1, although the data in this interval is sparse.A second increase in benthic foraminiferal d13C of 1.0‰begins at 33.52 Ma and is coincident with Oi‐1. At theend of Oi‐1, d13C values reach a maximum of 1.7‰ at∼33.41 Ma. Subsequently, benthic foraminiferal d13Cdecreases slightly to values between 1.0 and 1.5‰ for theyoungest portion of the Site 1090 record.[20] The Site 1265 benthic foraminiferal (Cibicidoides
spp.) d13C record shows little variability between 34.2 and33.8 Ma, with values of 1.0–1.2‰ (Figure 3). Benthicforaminiferal d13C values increase by ∼1.2‰ over a 30 kyrperiod starting at ∼33.65 Ma and including Oi‐1 (Figure 3).As at Site 1265, benthic foraminiferal d13C ratios decreasefollowing Oi‐1 from ∼2.0‰ to 1.4‰ at 33.0 Ma.
3.2. Oxygen Isotopes
[21] Site 1090 benthic foraminiferal (Cibicidoides spp.)d18O values from the oldest portion of the record (34–35 Ma)vary between 0.5 and 1.0‰, with no long‐term trend overthis one million year time interval (Figure 3). Between∼33.9–33.6 Ma, there is an increase in d18O of ∼0.5‰(Figure 3). There are no obvious shifts associated with eitherEOT‐1 or EOT‐2, although the there are limited data acrossthe first of these events. A rapid increase in benthic fora-miniferal d18O of 1.0‰ begins at 33.55 Ma and coincideswith Oi‐1. Following the increase during Oi‐1, Site 1090d18O values decrease slightly to values centering near 2.2‰for the remainder of the record (Figure 3).[22] The Site 1265 benthic foraminiferal (Cibicidoides
spp.) d18O record is marked by relatively stable values (1.0–1.5‰) from 34.2 to 33.9 Ma (Figure 3). No apparent benthicforaminiferal d18O change occurs during EOT‐2 at Site1265, though there appears to be a minor (<0.5‰) increasespanning EOT‐1 (Figure 3). The benthic foraminiferal d18Orecords from Sites 1265 and 1090 are offset prior to 33.8 Maand convergence immediately above EOT‐1. A rapidincrease of 0.8‰ occurs at Site 1265 between 33.55 and33.45 Ma and correlates with Oi‐1. The Oi‐1 shift is fol-lowed by a slight decrease between 33.45 and 33.35 Ma(Figure 3). Values range between 1.9 and 2.2‰ throughout
the youngest part of the Site 1265 benthic foraminiferald18O record.
3.3. Comparison to Global Stable Isotope Compilations
[23] A number of studies have compiled available d18Oand d13C data in order to examine global trends during thelate Eocene and early Oligocene [Miller et al., 1987; Zachoset al., 2001; Cramer et al., 2009]. To assess the reliability ofthe Sites 1090 and 1265 benthic foraminiferal d18O andd13C records across the EOT, we compare them to the mostrecent of these compilations (Figure 4) from Cramer et al.[2009]. Site 1090 d18O values are lower than those of thewhole ocean prior to EOT‐1, suggesting it is bathed in arelatively warm or fresh water mass before 33.8 Ma(Figure 4). The Site 1090 benthic foraminiferal d13C valuesalso are at the lower end of those in the global record priorto EOT‐1 but become more similar to those in the globalcompilation after this event. Our d18O data from Site 1265displays good agreement with the global compilation acrossthe entire EOT (Figure 4). Conversely, the Site 1265 d13Cvalues are consistently at the higher end of the range ofvalues seen in the global record (Figure 4). Based on thiscomparison, we are confident that the stable isotope recordsfor Sites 1090 and 1265 are reliable indicators of pastchanges in water mass properties at these two locations.
3.4. Benthic Foraminiferal Mg/Ca Ratios
[24] Site 1090 benthic foraminiferal Mg/Ca ratios average0.8 ± 0.4 mmol/mol (2 s.d.) throughout the entire record,ranging from a maximum value of 1.2 mmol/mol andminimum of 0.5 mmol/mol (Figure 5). The lowest benthicforaminiferal Mg/Ca values of 0.5 mmol/mol occur at∼33.8 Ma and subsequently increase by ∼0.5 mmol/molduring Oi‐1 (Figure 5). Following a 100 kyr period of rela-tively stable values (∼0.8 mmol/mol) there is a secondincrease of ∼0.3 mmol/mol beginning at 33.27Ma (Figure 5).In the youngest portion of the Site 1090 record, from 33.27 to33.1 Ma, Mg/Ca ratios average ∼1.0 mmol/mol.[25] For Site 1265, C. praemundulus Mg/Ca values vary
between 1.1 and 2.1 mmol/mol over the entire length of therecord, with the average being 1.7 ± 0.4 mmol/mol (2 s.d.)(Figure 5). The initial 500 kyr of the Site 1265 record (34.2to 33.8 Ma) displays relatively large fluctuations that appearto track changes in the carbonate content (Figure 5). Site1265 benthic foraminiferal Mg/Ca ratios show a briefdecrease after EOT‐1 from 1.6 mmol/mol at ∼33.75 Ma to1.1 mmol/mol at 33.65 Ma. Subsequently, the record dis-plays a long‐term (600 kyr) increase from 1.1 mmol/mol at33.63 Ma to 2.1 mmol/mol at 33.21 Ma (Figure 5). Thegradual Mg/Ca increase of 1.0 mmol/mol over 600 kyrencompasses the Oi‐1 event identified in the d18O records(Figure 5). The remaining portion of the Site 1265 benthicforaminiferal Mg/Ca record shows minimal variability withan average of 1.7 mmol/mol from 33.2 to 33 Ma.
4. Discussion
4.1. Secular Effects of Carbonate Ion and CarbonCycle Variations
[26] Before assessing our benthic foraminiferal d13C andMg/Ca records from the perspective of past water massvariations, we evaluate the integrity of the data including
PUSZ ET AL.: EOT TEMPERATURE AND ICE VOLUME PA2205PA2205
6 of 15

their use as ventilation and paleotemperature indicators.Variations in deep water d13C values reflect changes in(1) the global carbon reservoir [Broecker, 1970, 1982;Shackleton, 1977], (2) deep water circulation patterns[Bender and Keigwin, 1979; Belanger et al., 1981; Curryand Lohmann, 1982, 1983; Boyle and Keigwin, 1982;Shackleton et al., 1983], and (3) regional surface waterproductivity [Sarnthein et al., 1982]. A global deep waterd13C increase coincident with Oi‐1 (Figure 3) is associatedwith a significant deepening of the CCD and rise in the[CO3
2−] of bottom waters [van Andel, 1975; Zachos et al.,1996; Salamy and Zachos, 1999; Coxall et al., 2005;Zachos and Kump, 2005; Merico et al., 2008]. The earliestOligocene benthic foraminiferal d13C increase coincideswith changes in marine productivity and/or in the organiccarbon to inorganic carbon burial rates in the high to middlesouthern latitudes [Diester‐Haass and Zahn, 1996, 2001;Salamy and Zachos, 1999; Diester‐Haass and Zachos,2003; Anderson and Delaney, 2005]. Sites 1090 and 1265benthic foraminiferal d13C records show an increase (0.5–0.7‰) coeval with Oi‐1 (Figure 3) that is consistent with
other deep sea records (Figure 6) [e.g., Miller et al., 1988;Miller and Thomas, 1985; Barrera and Huber, 1991;Zachos et al., 1992, 1996].[27] The proposed change in paleoproductivity and export
of organic carbon relative to carbonate carbon associatedwith Oi‐1 can be attributed to more vigorous ocean mixingrates. Considerable debate exists concerning whether astronger meridional temperature gradient, intensified windstress and upwelling, or the opening of tectonic gateways inthe Southern Ocean caused ocean mixing rates to increase atthis time [Diester‐Haass, 1996; Salamy and Zachos, 1999;Diester‐Haass and Zahn, 2001; Diester‐Haass and Zachos,2003; Hay et al., 2005; Latimer and Filippelli, 2002;Cramer et al., 2009].
4.2. Bottom Water Temperature and Water MassProperties
[28] Site 1090 BWT that are uncorrected for changes inthe [CO3
2−] range between 1° and 3°C in the early portion ofthe record from 34.5 to 34 Ma (Figure 7). BWT eventuallyincreases to as warm as 5°–6°C at the top of the Site 1090
Figure 4. Benthic foraminiferal d18O and d13C isotope records across the Eocene‐Oligocene transitionfrom ODP Sites 1090 (blue circles; this work) and 1265 (red circles; this work) verses age in millions ofyears. The gray curve represents a recent compilation from Cramer et al. [2009]. Isotope values arereported relative to the VPDB (Vienna PeeDee belemnite) standard. The biomagnetostratigraphic agemodel follows Berggren et al. [1995], BKSA95; Cande and Kent [1995], CK95; and Berggren andPearson [2005].
PUSZ ET AL.: EOT TEMPERATURE AND ICE VOLUME PA2205PA2205
7 of 15

record (Figure 7). In contrast, Site 1265 uncorrected BWTare uniformly warmer (6°–8°C) and marked by little changethroughout (Figure 7). Currently, Site 1090 BWT (1.2°C)are only slightly colder than those at Site 1265 (2.4°C)[Levitus and Boyer, 1994]. A ∼5°C difference in uncorrectedBWT between Sites 1090 and 1265 in the late Eocene and a∼1–2°C contrast in the early Oligocene suggests the twosites were bathed in different water masses prior to andfollowing the EOT. Colder BWT at Site 1090 compared toSite 1265 associated with the EOT are supported by recentwork that found a substantial Dd18O gradient betweenSouth and North Atlantic deep waters coincident with Oi‐1[Cramer et al., 2009]. Site 1090 shows a ∼2°C BWT
cooling from 34 to 33.8 Ma, the time period containingEOT‐1. A 200 kyr gap in the Site 1090 BWT record, pos-sibly due to dissolution (Figure 5), makes it impossible toconstrain the timing and magnitude of change across EOT‐1. At 33.8 Ma, Site 1265 BWT display a ∼1°C coolingassociated with EOT‐1 (Figure 7).[29] Site 1265 uncorrected BWT record shows no sig-
nificant change across Oi‐1 (Figure 7). In contrast, Site 1090uncorrected BWTs display a ∼3°C warming beginning atEOT‐2 and extending through Oi‐1 (Figure 7), which iscomparable to the 2°C increase estimated for deep waters atSites 1218 and 522 [Lear et al., 2000, 2004]. A BWTwarming associated with Oi‐1 is likely an artifact of changes
Figure 5. ODP Sites 1265 and 1090 benthic foraminiferal d18O, Mg/Ca, and weight percent carbonaterecords verses age in millions of years. (a) Site 1265 benthic foraminiferal d18O values (red circles;Cibicidoides spp.) verses age in millions of years. Isotope values are reported relative to the VPDB(Vienna PeeDee belemnite) standard. (b) Site 1265 benthic foraminiferal Mg/Ca ratios (red diamonds;C. praemundulus) in mmol/mol plotted with weight percent carbonate (black line) from Kroon et al.[2006]. (c) Site 1090 benthic foraminiferal d18O values (blue circles; Cibicidoides spp.). (d) Site 1090benthic foraminiferal Mg/Ca ratios (blue diamonds; Cibicidoides spp.) in mmol/mol plotted with weightpercent carbonate (black line) from Latimer and Filippelli [2002]. Gray bars mark the EOT‐1 (Eocene‐Oligocene transition event 1), EOT‐2 (Eocene‐Oligocene transition event 2), and Oi‐1 (Oligocene isotopeevent 1) events occurring at 33.8, 33.63, and 33.54 Ma, respectively [Miller et al., 1991, 2008; Lear et al.,2004; Coxall et al., 2005; Katz et al., 2008].
PUSZ ET AL.: EOT TEMPERATURE AND ICE VOLUME PA2205PA2205
8 of 15

in the [DCO32−] of the oceans coincident with the EOT [Lear
et al., 2004; Lear and Rosenthal, 2006; Peck et al., 2010;Lear et al., 2010]. An abrupt (<300 kyr) deepening (1.2 km)of the CCD occurred throughout the global ocean near theE‐O boundary [van Andel, 1975; Rea and Lyle, 2005;Coxall et al., 2005]. A rise in bottom water [CO3
2−] has beenshown to cause an increase in benthic foraminiferal Mg/Caratios [Elderfield et al., 2006; Rosenthal et al., 2006; Healeyet al., 2008; Yu and Elderfield, 2008], which in turn yieldtemperature estimates that are anomalously high.[30] A change in [DCO3
2−] may have affected the deeperof the two sites (Site 1090) more dramatically as evidencedby higher CaCO3 percentages at Site 1265 (85–95%) rela-tive to those at Site 1090 (5–40%) across the entireEOT interval (Figure 5). Nearby ODP Site 1263 (28°31.9′S,2°46.7′E) was determined to be above the lysocline at2.1 km paleodepth at ∼34 Ma [Peck et al., 2010]. Peck et al.[2010] estimated a ∼29 mmol/kg [CO3
2−] increase in bottomwaters at Site 1263 associated with Oi‐1. A ∼29 mmol/kg[CO3
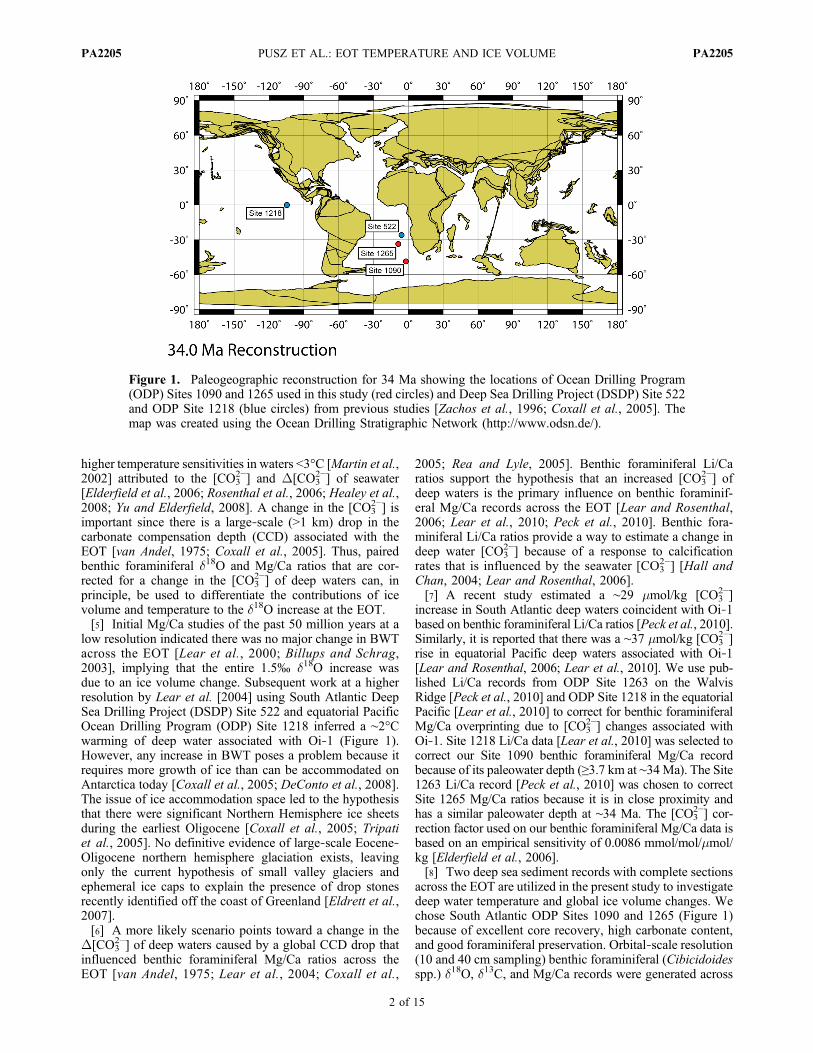
2−] change is equivalent to a Mg/Ca ratio increase of∼0.25 mmol/mol using the relationship of 0.0086 mmol/molper mmol/kg from Elderfield et al. [2006]. Correcting ourSite 1265 Mg/Ca deep water record for a ∼0.25 mmol/molincrease yields BWT estimates that show a ∼1.5°C coolingbeginning at ∼33.6 Ma and culminating at Oi‐1 (Figure 8).
Site 1090 Mg/Ca ratios are corrected for a larger change inthe [CO3
2−] because it is the deeper of the two sites located at3.2 km paleodepth at ∼34 Ma and the CaCO3 weight percentvaries significantly more than Site 1265 (Figure 5). Site1090 is adjusted for a 0.31 mmol/mol Mg/Ca increase[Elderfield et al., 2006] (Figure 8) based on a ∼36 mmol/kg[CO3
2−] change identified at equatorial Pacific ODP Site1218 (4 km paleodepth at 34 Ma) across Oi‐1[Lear et al.,2010]. Corrected Mg/Ca values for Site 1090 (Figure 8)yield a ∼1.5°C BWT decrease associated with Oi‐1, similarto that for Site 1265.[31] Our reconstructed Mg/Ca BWT records for Sites
1090 and 1265 can be used in conjunction with the benthicforaminiferal d13C data to postulate the source regions fordeep water masses at these two locations during the EOT[Bender and Keigwin, 1979; Curry and Lohmann, 1982,1983; Boyle and Keigwin, 1982; Shackleton et al., 1983;Mix and Fairbanks, 1985; Oppo and Fairbanks, 1987]. Atpresent, Site 1265 is bathed by nutrient‐depleted NorthAtlantic Deep Water (NADW) with a d13C value of ∼1.0‰[Kroopnick, 1985]. Likewise, Site 1090 is currently locatedin the mixing zone between NADW and lower CircumpolarDeep Water, with a d13C value of ∼0.4‰ [Kroopnick,1985]. The principle region for deep water formation dur-ing the early Paleogene was the Southern Ocean [Miller and
Figure 6. Summary of the latest Eocene to earliest Oligocene d13C ratios for Cibicidoides from SouthernOcean ODP Site 1090, east Atlantic ODP Site 1265, east Atlantic DSDP Site 522 [Zachos et al., 1996],and Pacific Ocean ODP Site 1218 [Coxall et al., 2005]. Site 1090 represents the Southern Ocean end‐member, with Site 1218 [Coxall et al., 2005] serving as the Pacific end‐member for deep water during theEOT. Gray shading illustrates the influence of a more nutrient‐depleted water mass at Sites 1265 and522 [Zachos et al., 1996]. The d18O and d13C values are reported relative to the VPDB (Vienna PeeDeebelemnite) standard. Black horizontal lines mark the EOT‐1 (Eocene‐Oligocene transition event 1),EOT‐2 (Eocene‐Oligocene transition event 2), and Oi‐1 (Oligocene isotope event 1) events occurring at33.8, 33.63, and 33.54 Ma, respectively [Miller et al., 1991, 2008; Lear et al., 2004; Coxall et al., 2005;Katz et al., 2008].
PUSZ ET AL.: EOT TEMPERATURE AND ICE VOLUME PA2205PA2205
9 of 15

Tucholke, 1983; Mountain and Miller, 1992; Pak andMiller, 1992; Thomas et al., 2003; Via and Thomas,2006]. Some studies from the North Atlantic suggest aNorthern Component Water mass (NCW; ancient analog toNADW [Wright et al., 1991]), probably originating in theNorwegian Sea, was produced in the early Oligocene andthe latest Eocene [Miller and Tucholke, 1983; Miller, 1992;Wold, 1994].[32] Sites 1090 and 1265 benthic foraminiferal d13C
records are compared with two high‐resolution EOT d13Crecords (Figure 6) from equatorial Pacific Site 1218 (4 kmpaleodepth) [Coxall et al., 2005] and South Atlantic Site522 (3 km paleodepth) [Zachos et al., 1996] (Figure 1).
Throughout the entire study interval, Site 1265 benthic d13Cvalues are higher than those at both Site 1090 and Site 1218,but often similar to those for Site 522 (Figure 6). Site 1090is marked by relatively low (0.4‰) benthic d13C valuesprior to EOT‐1 that are comparable to the modern‐dayCircumpolar Deep Waters [Kroopnick, 1985]. In contrast,Site 1265 benthic d13C values are consistently 1.0‰ orhigher, which would be indicative of a more nutrient‐depleted water mass, most likely from a northern sourceregion. In Figure 6, Site 1090 is considered to represent theSouthern Ocean end‐member, with Site 1218 [Coxall et al.,2005] serving as the Pacific end‐member for deep waterduring the latest Eocene‐earliest Oligocene. Sites 522
Figure 7. ODP Sites 1090 and 1265 benthic foraminiferal d18O, uncorrected Mg/Ca, and uncorrectedbottom water temperature (BWT) records verses age in millions of years. (a) Benthic foraminiferal(Cibicidoides spp.) d18O records from Sites 1090 (blue circles) and 1265 (red circles). Isotope valuesare reported relative to the VPDB (Vienna PeeDee belemnite) standard. (b) Sites 1090 (blue diamonds;Cibicidoides spp.) and 1265 (red diamonds; C. praemundulus) benthic foraminiferal Mg/Ca ratios inmmol/mol uncorrected for changes in the deep water carbonate ion concentration associated with Oi‐1[Peck et al., 2010; Lear et al., 2010]; black lines show three‐point running average. (c) Unadjustedbottom water temperatures (Site 1090, blue triangles; Site 1265, red triangles) calculated from uncorrectedbenthic foraminiferal Mg/Ca data in Figure 7b using the benthic foraminiferal calibration of Raitzsch et al.[2008] with the modern‐day Mg/Ca seawater value (5.1 mmol/mol) and assuming Mg/Ca = 4.3 mmol/molat 34 Ma; black lines display three‐point running average. Gray bars mark the EOT‐1 (Eocene‐Oligocenetransition event 1), EOT‐2 (Eocene‐Oligocene transition event 2) and Oi‐1 (Oligocene isotope event 1),events occurring at 33.8, 33.63, and 33.54 Ma, respectively [Miller et al., 1991, 2008; Lear et al., 2004;Coxall et al., 2005; Katz et al., 2008].
PUSZ ET AL.: EOT TEMPERATURE AND ICE VOLUME PA2205PA2205
10 of 15
[Zachos et al., 1996] and 1265 have similar d13C valuesprior to EOT‐1 and following Oi‐1 (Figure 6), likely indi-cating the presence of northern sourced waters at these twolocations prior to EOT‐1 and in the earliest Oligocene(Figure 6).[33] A late Eocene to early Oligocene age for deep water
formation in the North Atlantic is considerably older thanmost previous estimates from benthic foraminiferal d13C andfaunal studies [e.g., Schnitker, 1980; Wright et al., 1992;Wright and Miller, 1996]. Our benthic d13C record for Site1265 is consistent with the presence of nutrient‐depleted
northern sourced water at 2400 m depth in the SouthAtlantic in the earliest Oligocene (Figure 6). Neodymiumisotope records support an early Oligocene age for NCWexport production [Scher and Martin, 2004; Via andThomas, 2006]. Likewise, recent seismic stratigraphicstudies from the Southeast Faeroes drift and the north-western Rockall Trough report an age of 35 Ma in lateEocene for the presence of NCW [Davies et al., 2001; Howeet al., 2001], consistent with prior studies from the northernNorth Atlantic that noted an erosional pulse associated withreflector R4 spanning the Eocene/Oligocene boundary
Figure 8. ODP Sites 1090 and 1265 benthic foraminiferal d18O, corrected Mg/Ca, corrected bottomwater temperature (BWT), and corrected seawater d18O records verses age in millions of years. (a) Benthicforaminiferal (Cibicidoides spp.) d18O records from Sites 1090 (blue circles) and 1265 (red circles). Isotopevalues are reported relative to the VPDB (Vienna PeeDee belemnite) standard. (b) Sites 1090 (blue dia-monds; Cibicidoides spp.) and 1265 (red diamonds; C. praemundulus) benthic foraminiferal Mg/Caratios in mmol/mol corrected for changes in the deep water carbonate ion concentration associated withOi‐1 [Peck et al., 2010; Lear et al., 2010]; black lines show three‐point running average. (c) Adjustedbottom water temperatures (BWT) corrected for changes in the carbonate ion concentration from Sites1090 (blue triangles) and Site 1265 (red triangles) calculated from adjusted benthic foraminiferal Mg/Cadata in Figure 8b using the benthic foraminiferal calibration of Raitzsch et al. [2008] with the modern‐day Mg/Ca seawater value (5.1 mmol/mol) and assuming Mg/Ca = 4.3 mmol/mol at 34 Ma; black linesdisplay three‐point running average. (d) Corrected bottom water d18O (dw) calculated from benthicforaminiferal d18O data in Figure 8a and adjusted BWT in Figure 8c using the equation of Shackleton[1974]. Gray bars mark the EOT‐1 (Eocene‐Oligocene transition event 1), EOT‐2 (Eocene‐Oligocenetransition event 2), and Oi‐1 (Oligocene isotope event 1) events occurring at 33.8, 33.63, and 33.54 Ma,respectively [Miller et al., 1991, 2008; Lear et al., 2004; Coxall et al., 2005; Katz et al., 2008].
PUSZ ET AL.: EOT TEMPERATURE AND ICE VOLUME PA2205PA2205
11 of 15

[Miller and Tucholke, 1983]. A potential mechanism for thesouthward penetration of NCW is revealed in sedimentaryrecords from DSDP Site 336 that show rapid subsidenceof the Greenland‐Scotland Ridge from 36 to 32 Ma thatallowed deep waters to spill into the North Atlantic fromthe Norwegian Sea [Abelson et al., 2008].
4.3. Seawater d18O, Sea Level, and Global Ice Volume
[34] Utilizing the Mg/Ca BWT estimates corrected forchanges in the [CO3
2−], we attempt to partition the benthicforaminiferal d18O records into their temperature and icevolume components. The d18O of bottom water (dw) forSites 1090 and 1265 is estimated using the equation belowfrom Shackleton [1974]:
�w ¼ �c � 16:9� Tð Þ=4½ �; ð2Þ
where T and dc are the C. praemundulus corrected Mg/Catemperature and d18O, respectively.[35] While the Site 1090 dw record lacks data across
EOT‐1, Site 1265 displays a small dw increase of ∼0.5‰(Figure 8). The estimated 2°C BWT cooling during EOT‐1in the Site 1090 corrected Mg/Ca record would beequivalent to a benthic foraminiferal d18O shift of ∼0.5‰,which is virtually the entire measured change. Thus, weconclude that EOT‐1 is primarily a cooling event accom-panied by minimal ice growth.[36] The Site 1265 dw record adjusted for changes in
the [CO32−] shows a larger shift (∼1.0‰) than for Site 1090
(∼0.5‰) across Oi‐1 (Figure 8). The average dw shiftacross Oi‐1 for Sites 1090 and 1265 is ∼0.75‰, whichequates to an average ∼70 m drop in sea level, using eitherthe Pleistocene sea level dw calibration of 0.11‰/10 m[Fairbanks and Matthews, 1978] or the Oligocene cali-brations of 0.10‰/10 m [Pekar et al., 2002; DeConto andPollard, 2003; Katz et al., 2008]. A 0.5 to 1.0‰ dw shift atSites 1090 and 1265 equates to a minimum 45 m andmaximum 90 m eustatic fall coincident with Oi‐1. Anaverage global sea level fall of ∼70 m is comparable toearlier independent estimates of a 55–70 m drop associatedwith Oi‐1 determined at other locations using differenttechniques [Pekar et al., 2002; Miller et al., 2005; Katzet al., 2008].[37] We estimate an average ice volume increase of 21 ×
106 km3 associated with Oi‐1 based on a value of −50‰ forthe Antarctic ice sheet d18O [Shackleton and Kennett, 1975]and a 0.75‰ change in the dw of the oceans. Our ice volumecalculation assumes an ice‐free world with an averageoceanic d18O composition of −1.2‰ and total water volumeof 1.39 × 10⁹ km3 [Shackleton and Kennett, 1975]. Usingthe dw changes at Sites 1090 and 1265, we estimate thevolume of ice on Antarctic coincident with Oi‐1 rangedfrom of 14 × 106 km3 to 28 × 106 km3, which is equivalentto ∼55 to 115% of the present‐day ice sheet [Lythe et al.,2001] with ∼85% being the average value. Alternately, aless depleted d18O value (−45‰) has been proposed for theearliest Oligocene ice sheet based on evidence for lowerd18O precipitation values during late Early Cretaceouscaused by an intensified hydrologic cycle [White et al.,2001]. A lower ice sheet d18O value of −45‰ yields anaverage ice volume of 23 × 106 km3 that is equivalent tonearly 95% of today’s Antarctic ice sheet. We find an ear-
liest Oligocene Antarctic ice sheet of 55–115% of its pres-ent‐day size plausible based on the recent work fromWilsonand Luyendyk [2009] that suggests the West Antarctic land-mass was 10–20% larger in area during the latest Eocene.
5. Conclusions
[38] While it has long been recognized that major climatereorganization occurred at the EOT, it has been difficult todifferentiate temperature and ice volume changes associatedwith this event. Our results from ODP Sites 1090 and1265 show a 0.5‰ d18O increase associated with EOT‐1(33.8 Ma) that reflects a 2°C global cooling event based onbenthic foraminiferal Mg/Ca data, with little if any icegrowth and sea level change at this time. Our uncorrectedMg/Ca records yield a 3°C warming of bottom water tem-peratures that are concurrent with Oi‐1. The absence ofbottom water cooling coincident with Oi‐1 is consistentwith other deep sea records (i.e., Sites 522 and 1218) [Learet al., 2000, 2004], but is most likely an artifact of adeepening of the CCD at this time [van Andel, 1975; Reaand Lyle, 2005; Coxall et al., 2005]. Sites 1090 and 1265BWT and benthic d13C records provide evidence for a pulseof Northern Component Water prior to and following theEOT. Reconstructed BWT and seawater dw records cor-rected for a change in the [CO3
2−] show a ∼1.5°C coolingand simultaneous 0.75‰ dw average increase coincidentwith Oi‐1. The 0.75‰ dw increase during Oi‐1 is equivalentto a ∼70 m mean eustatic lowering and an ice volumechange that is 85–95% of the modern Antarctic ice sheet.
[39] Acknowledgments. We thank Eric Tappa for sample analysesand data processing and Mimi Katz, Howie Scher, and Ben Cramer fortheir insightful discussions and suggestions. We graciously thank VickyPeck and Carrie Lear for access to their manuscripts recently accepted toPaleoceanography. We thank Rainer Zahn and two anonymous reviewersfor editorial reviews and helpful advice to improve our manuscript. Sam-ples for this work were obtained from the Ocean Drilling Program(ODP), which is supported by the U.S. National Science Foundation(NSF) and by Joint Oceanographic Institutions. This research was fundedby NSF grants ANT‐0732995 (Thunell) and OCE0623256 (Miller).
ReferencesAbelson, M., A. Agnon, and A. Almogi‐Labin (2008), Indications for con-trol of the Iceland plume on the Eocene‐Oligocene “greenhouse‐icehouse”climate transition, Earth Planet. Sci. Lett., 265, 33–48, doi:10.1016/j.epsl.2007.09.021.
Anderson, L. D., and M. L. Delaney (2005), Use of multiproxy records onthe Agulhas Ridge, Southern Ocean (Ocean Drilling Project Leg 177,Site 1090) to investigate sub‐Antarctic hydrography from the Oligoceneto the early Miocene, Paleoceanography, 20, PA3011, doi:10.1029/2004PA001082.
Baker, P., J. Gieskes, and H. Elderfield (1982), Diagenesis of carbonates indeep‐sea sediments‐Evidence from Sr/Ca ratios and interstitial dissolvedSr2+ data, J. Sediment. Petrol., 52, 71–82.
Barrera, E., and B. T. Huber (1991), Paleogene and early Neogeneoceanography of the Southern Ocean: Leg 119 foraminifer stable iso-tope results, Proc. Ocean Drill. Program, Sci. Results, 119, 693–717.
Belanger, P. E., W. B. Curry, and R. K. Matthews (1981), Core‐topevaluation of benthic foraminiferal isotopic ratios for paleo‐oceano-graphic interpretations, Palaeogeogr. Palaeoclimatol. Palaeoecol., 33,205–220, doi:10.1016/0031-0182(81)90039-0.
Bender, M. L., and L. D. Keigwin (1979), Speculations about the upperMiocene change in abyssal Pacific dissolved bicarbonate d13C, EarthPlanet. Sci. Lett., 45, 383–393, doi:10.1016/0012-821X(79)90138-9.
Berger, W. H. (1982), Deep‐sea stratigraphy: Cenozoic climate steps andthe search for chemoclimatic feedback, in Cyclic and Event Stratification,edited by G. Einsele and A. Sielacher, pp. 121–157, Springer, New York.
PUSZ ET AL.: EOT TEMPERATURE AND ICE VOLUME PA2205PA2205
12 of 15

Berggren, W. A., and P. N. Pearson (2005), A revised tropical to subtrop-ical Paleogene planktonic foraminiferal zonation, J. Foraminiferal Res.,35(4), 279–298, doi:10.2113/35.4.279.
Berggren, W. A., D. V. Kent, C. C. Swisher, and M.‐P. Aubry (1995),A revised Cenozoic geochronology and chronostratigraphic, in Geo-chronology, Time Scales and Global Stratigraphic Correlations, editedby W. A. Berggren et al., Spec. Publ. SEPM Soc. Sediment. Geol., 54,pp. 129–212.
Billups, K., and D. P. Schrag (2002), Paleotemperatures and ice volume ofthe past 27 Myr revisited with paired Mg/Ca and 18O/16O measurementson benthic foraminifera, Paleoceanography, 17(1), 1003, doi:10.1029/2000PA000567.
Billups, K., and D. P. Schrag (2003), Application of benthic foraminiferalMg/Ca ratios to questions of Cenozoic climate change, Earth Planet. Sci.Lett., 209, 181–195, doi:10.1016/S0012-821X(03)00067-0.
Boyle, E. A., and L. D. Keigwin (1982), Deep circulation of the NorthAtlantic over the last 200,000 years: Geochemical evidence, Science,218(4574), 784–787, doi:10.1126/science.218.4574.784.
Boyle, E. A., and L. D. Keigwin (1985), Comparison of Atlantic andPacific paleochemical records for the last 250,000 years: Changes in deepocean circulation and chemical inventories, Earth Planet. Sci. Lett., 76,135–150, doi:10.1016/0012-821X(85)90154-2.
Broecker, W. S. (1970), A boundary condition on the evolution of atmo-spheric oxygen, J. Geophys. Res., 75, 3553–3557, doi:10.1029/JC075i018p03553.
Broecker, W. S. (1982), Ocean chemistry during glacial time, Geochim.Cosmochim. Acta, 46, 1689–1705, doi:10.1016/0016-7037(82)90110-7.
Broecker, W. S., and T.‐H. Peng (1982), Tracers in the Sea, Lamont‐Doherty Earth Obs., Palisades, N. Y.
Brown, S. J., and H. Elderfield (1996), Variations in Mg/Ca and Sr/Caratios of planktonic foraminifera caused by post‐depositional dissolution:Evidence of shallow Mg‐dependent dissolution, Paleoceanography, 11(5),543–551, doi:10.1029/96PA01491.
Cande, S., and D. Kent (1995), Revised calibration of the geomagneticpolarity timescale for the Late Cretaceous and Cenozoic, J. Geophys.Res., 110, 6093–6095, doi:10.1029/94JB03098.
Channell, J. T., S. Galeotti, E. Martin, K. Billups, H. D. Scher, and J. S.Stoner (2003), Eocene to Miocene magnetostratigraphy, biostratigraphy,and chemostratigraphy at ODP Site 1090(sub‐Antarctic South Atlantic),Geol. Soc. Am. Bull., 115(5), 607–623, doi:10.1130/0016-7606(2003)115<0607:ETMMBA>2.0.CO;2.
Coplen, T. B., C. Kendall, and J. Hopple (1983), Comparison of stable iso-tope reference samples, Nature, 302, 236–238, doi:10.1038/302236a0.
Coxall, H. K., P. A. Wilson, H. Palike, C. H. Lear, and J. Backman (2005),Rapid stepwise onset of Antarctic glaciation and deeper calcite compen-sation in the Pacific Ocean, Nature, 433, 53–57, doi:10.1038/nature03135.
Cramer, B. S., J. R. Toggweiler, J. D. Wright, M. E. Katz, and K. G. Miller(2009), Ocean overturning since the Late Cretaceous: Inferences from anew benthic foraminiferal isotope compilation, Paleoceanography, 24,PA4216, doi:10.1029/2008PA001683.
Curry, W. B., and G. P. Lohmann (1982), Carbon isotopic changes inbenthic foraminifera from the western South Atlantic: Reconstructionof glacial abyssal circulation patterns, Quat. Res., 18(2), 218–235,doi:10.1016/0033-5894(82)90071-0.
Curry, W. B., and G. P. Lohmann (1983), Reduced advection into AtlanticOcean deep eastern basins during the last glacial maximum, Nature, 306,577–580, doi:10.1038/306577a0.
Davies, R., J. Cartwright, J. Pike, and C. Line (2001), Early Oligocene ini-tiation of North Atlantic Deep Water formation, Nature, 410, 917–920,doi:10.1038/35073551.
DeConto, R. M., and D. Pollard (2003), Rapid Cenozoic glaciation ofAntarctica triggered by declining atmospheric CO2, Nature, 421,245–249, doi:10.1038/nature01290.
DeConto, R. M., D. Pollard, P. A. Wilson, H. Pälike, C. H. Lear, andM. Pagani (2008), Thresholds for Cenozoic bipolar glaciation, Nature,455, 652–656, doi:10.1038/nature07337.
Dekens, P. S., D. W. Lea, D. K. Pak, and H. J. Spero (2002), Core top cal-ibration of Mg/Ca in tropical foraminifera: Refining paleotemperatureestimation, Geochem. Geophys. Geosyst., 3(4), 1022, doi:10.1029/2001GC000200.
Delaney, M. L. (1989), Temporal changes in interstitial water chemistryand calcite recrystallization in marine sediments, Earth Planet. Sci. Lett.,95, 23–37, doi:10.1016/0012-821X(89)90165-9.
Diester‐Haass, L. (1996), Late Eocene‐Oligocene paleoceanography in thesouthern Indian Ocean (ODP Site 744), Mar. Geol., 130(1–2), 99–119,doi:10.1016/0025-3227(95)00128-X.
Diester‐Haass, L., and J. C. Zachos (2003), The Eocene‐Oligocene transi-tion in the Equatorial Atlantic (ODP Site 925), Paleoproductivity increase
and positive d13C excursion, in From Greenhouse to Icehouse, edited byD. R. Prothero et al., pp. 397–418, Columbia Univ. Press, New York.
Diester‐Haass, L., and R. Zahn (1996), Eocene‐Oligocene transition inthe Southern Ocean: History of water mass circulation and biologicalproductivity, Geology, 24(2), 163–166, doi:10.1130/0091-7613(1996)024<0163:EOTITS>2.3.CO;2.
Diester‐Haass, L., and R. Zahn (2001), Paleoproductivity increase at theEocene‐ Oligocene climatic transition: ODP/DSDP sites 763 and 592,Palaeogeogr. Palaeoclimatol. Palaeoecol., 172, 153–170, doi:10.1016/S0031-0182(01)00280-2.
Dittert, N., and R. Henrich (2000), Carbonate dissolution in the SouthAtlantic Ocean: Evidence from ultrastructure breakdown in Globigerinabulloides, Deep Sea Res., Part I, 47(4), 603–620, doi:10.1016/S0967-0637(99)00069-2.
Ehrmann, W. U. (1991), Implications of sediment composition on thesouthern Kerguelen Plateau for paleoclimate and depositional environ-ment, Proc. Ocean Drill. Program, Sci. Results, 119, 185–210,doi:10.2973/odp.proc.sr.119.121.1991.
Ehrmann, W. U., and A. Mackensen (1992), Sedimentological for theformation of an East Antarctic ice sheet in Eocene/Oligocene time,Palaeogeogr. Palaeoclimatol. Palaeoecol., 93, 85–112, doi:10.1016/0031-0182(92)90185-8.
Elderfield, H., and G. Ganssen (2000), Past temperature and d18O ofsurface ocean waters inferred from foraminiferal Mg/Ca ratios, Nature,405, 442–445, doi:10.1038/35013033.
Elderfield, H., J. Yu, P. Anand, T. Kiefer, and B. Nyland (2006), Calibra-tions for benthic foraminiferal Mg/Ca paleothermometry and the carbon-ate ion hypothesis, Earth Planet. Sci. Lett., 250, 633–649, doi:10.1016/j.epsl.2006.07.041.
Eldrett, J. S., I. C. Harding, P. A. Wilson, E. Butler, and A. P. Roberts(2007), Continental ice in Greenland during the Eocene and Oligocene,Nature, 446, 176–179, doi:10.1038/nature05591.
Fairbanks, R. G., and R. K. Matthews (1978), The marine oxygen isotopicrecord in Pleistocene coral, Barbados,West Indies,Quat. Res., 10, 181–196,doi:10.1016/0033-5894(78)90100-X.
Flower, B. P., and J. P. Kennett (1993), Relations between Monterey For-mation deposition and middle Miocene global cooling: Naples Beachsection, Calif. Geol., 21, 877–880, doi:10.1130/0091-7613(1993)021<0877:RBMFDA>2.3.CO;2.
Gersonde, R., et al. (1999), Southern Ocean Paleoceanography, Proc.Ocean Drill. Program, Initial Rep., vol. 177, Ocean Drill. Program,College Station, Tex., doi:10.2973/odp.proc.ir.177.1999.
Hall, J. M., and L. H. Chan (2004), Li/Ca in multiple species of benthic andplanktonic foraminifera: Thermocline, latitudinal, and glacial‐interglacialvariation, Geochim. Cosmochim. Acta, 68, 529–545, doi:10.1016/S0016-7037(03)00451-4.
Hay, W., S. Flögel, and E. Söding (2005), Is the initiation of glaciation onAntarctica related to a change in the structure of the ocean?, GlobalPlanet. Change, 45, 23–33, doi:10.1016/j.gloplacha.2004.09.005.
Healey, S. L., R. C. Thunell, and B. H. Corliss (2008), TheMg/Ca‐temperaturerelationship of benthic foraminiferal calcite: New core‐top calibrations in the<4°C temperature, Earth Planet. Sci. Lett., 272, 523–530, doi:10.1016/j.epsl.2008.05.023.
Henrich, R., K. H. Baumann, S. Gerhardt, M. Groger, and A. Volbers(2003), Carbonate preservation in deep and intermediate water massesin the South Atlantic: Evaluation and Geological Record (a review), inThe South Atlantic in the Late Quaternary‐Reconstruction of MaterialBudgets and Current Systems, edited by G. Wefer, S. Mulitza, andV. Ratmeyer, pp. 645–670, Springer, Berlin.
Hodell, D. A., C. D. Charles, and F. J. Sierro (2001), Late Pleistoceneevolution of the ocean’s carbonate system, Earth Planet. Sci. Lett.,192, 109–124, doi:10.1016/S0012-821X(01)00430-7.
Howe, J. A., M. S. Stoker, and K. J. Woolfe (2001), Deep‐marine seabederosion and gravel lags in the northwestern Rockall Trough, North Atlan-tic Ocean, J. Geol. Soc., 158(3), 427–438, doi:10.1144/jgs.158.3.427.
Katz, M. E., K. G. Miller, J. D. Wright, B. S. Wade, J. V. Browning,B. S. Cramer, and Y. Rosenthal (2008), Stepwise transition from theEocene greenhouse to the Oligocene icehouse, Nat. Geosci., 1, 329–334,doi:10.1038/ngeo179.
Kennett, J. P. (1977), Cenozoic evolution of Antarctic glaciation, theCircum‐Antarctic Ocean, and their impact on global paleoceanogra-phy, J. Geophys. Res., 82, 3843–3860, doi:10.1029/JC082i027p03843.
Kroon, D., J. C. Zachos, and C. Richter (Eds.) (2006), Early CenozoicExtreme Climates: The Walvis Ridge Transect Sites 1262–1267, Proc.Ocean Drill. Program, Sci. Results, vol. 208, Ocean Drill. Program,College Station, Tex., doi:10.2973/odp.proc.sr.208.2006.
Kroopnick, P. M. (1985), The distribution of 13C of SCO2 in the worldoceans, Deep Sea Res., Part A, 32(1), 57–84, doi:10.1016/0198-0149(85)90017-2.
PUSZ ET AL.: EOT TEMPERATURE AND ICE VOLUME PA2205PA2205
13 of 15

Latimer, J., and G. Filippelli (2002), Eocene to Miocene terrigenous inputsand export production: Geochemical evidence from ODP Leg 177, Site1090, Palaeogeogr. Palaeoclimatol. Palaeoecol., 182, 151–164,doi:10.1016/S0031-0182(01)00493-X.
Lea, D., T. Mashiotta, and H. Spero (1999), Controls on magnesiumand strontium uptake in planktonic foraminifera as determined by liveculturing, Geochim. Cosmochim. Acta, 63, 2369–2379, doi:10.1016/S0016-7037(99)00197-0.
Lear, C. H., and Y. Rosenthal (2006), Benthic foraminiferal Li/Ca: Insightsinto Cenozoic seawater carbonate saturation state, Geology, 34(11),985–988, doi:10.1130/G22792A.1.
Lear, C. H., H. Elderfield, and P. A. Wilson (2000), Cenozoic deep‐seatemperatures and global ice volumes from Mg/Ca in benthic foraminiferalcalcite, Science, 287(5451), 269–272, doi:10.1126/science.287.5451.269.
Lear, C. H., Y. Rosenthal, and N. Slowey (2002), Benthic foraminiferalMg/Ca paleothermometry: A revised core‐top evalution, Geochim. Cosmo-chim. Acta, 66(19), 3375–3387, doi:10.1016/S0016-7037(02)00941-9.
Lear, C. H., Y. Rosenthal, and J. D. Wright (2003), The closing of a sea-way: Ocean water masses and global climate change, Earth Planet. Sci.Lett., 210, 425–436, doi:10.1016/S0012-821X(03)00164-X.
Lear, C. H., Y. Rosenthal, H. K. Coxall, and P. A. Wilson (2004), LateEocene to early Miocene ice sheet dynamics and the global carbon cycle,Paleoceanography, 19, PA4015, doi:10.1029/2004PA001039.
Lear, C. H., T. R. Bailey, P. N. Pearson, H. K. Coxall, and Y. Rosenthal(2008), Cooling and ice growth across the Eocene‐Oligocene transition,Geology, 36(3), 251–254, doi:10.1130/G24584A.1.
Lear, C. H., E. M. Mawbey, and Y. Rosenthal (2010), Cenozoic benthicforaminiferal Mg/Ca and Li/Ca records: Towards unlocking temperaturesand saturation states, Paleoceanography, 25, PA4215, doi:10.1029/2009PA001880.
Levitus, S., and T. P. Boyer (1994), World Ocean Atlas 1994, vol. 4,Temperature, NOAA Atlas NESDIS, vol. 4, 129 pp., NOAA, SilverSpring, Md.
Liu, Z., S. Tuo, Q. Zhao, X. Cheng, and W. Huang (2004), Deep‐waterEarliest Oligocene Glacial Maximum (EOGM) in South Atlantic, Chin.Sci. Bull., 49(20), 2190–2197.
Lythe, M. B., D. G. Vaughan, and the BEDMAP Consortium (2001),BEDMAP: A new ice thickness and subglacial topographic model ofAntarctica, J. Geophys. Res., 106, 11,335–11,351, doi:10.1029/2000JB900449.
Marino, M., and J.‐A. Flores (2002), Middle Eocene to early Oligocene cal-careous nannofossil stratigraphy at Leg 177 Site 1090, Mar. Micropa-leontol., 45, 383–398, doi:10.1016/S0377-8398(02)00036-1.
Martin, P. A., D. W. Lea, Y. Rosenthal, N. J. Shackleton, M. Sarnthein,and T. Papenfuss (2002), Quaternary deep sea temperature historiesderived from benthic foraminiferal Mg/Ca, Earth Planet. Sci. Lett.,198, 193–209, doi:10.1016/S0012-821X(02)00472-7.
Merico, A., T. Tyrrell, and P. A. Wilson (2008), Eocene/Oligocene oceande‐acidification linked to Antarctic glaciation by sea‐level fall, Nature,452, doi:10.1038/nature06853.
Miller, K. G. (1992), Middle Eocene to Oligocene stable isotopes, climate, anddeep‐ water history: The Terminal Eocene Event?, in Eocene‐OligoceneClimatic and Biotic Evolution, edited by D. R. Prothero and W. A.Berggren, pp. 160–177, Princeton Univ. Press, Princeton, N. J.
Miller, K. G., and E. Thomas (1985), Late Eocene to Oligocene benthicforaminiferal isotopic record, Site 574, equatorial Pacific, Initial Rep.Deep Sea Drill. Proj., 85, 771–777.
Miller, K. G., and B. E. Tucholke (1983), Development of Cenozoic abyssalcirculation south of the Greenland‐Scotland Ridge, in Structure andDevelopment of the Greenland‐Scotland Ridge: New Methods and Con-cepts, edited by M. Bott et al., NATO Conf. Ser. IV, 8, 549–589.
Miller, K. G., R. G. Fairbanks, and E. Thomas (1986), Benthic foraminif-eral carbon isotope records and the development of abyssal circulationin the eastern North Atlantic, Initial Rep. Deep Sea Drill. Proj., 94,981–996.
Miller, K. G., R. G. Fairbanks, and G. S. Mountain (1987), Tertiary oxygenisotope synthesis, sea level history, and continental margin erosion,Paleoceanography, 2(1), 1–19, doi:10.1029/PA002i001p00001.
Miller, K. G., M. D. Feigenson, D. V. Kent, and R. K. Olsson (1988), Oli-gocene stable isotope (87Sr/86Sr, d18O, d13C) standard section, Deep SeaDrilling Project Site 522, Paleoceanography, 3, 223–233, doi:10.1029/PA003i002p00223.
Miller, K. G., J. D. Wright, and R. G. Fairbanks (1991), Unlocking theicehouse: Oligocene‐Miocene oxygen isotopes, eustasy, and marginerosion, J. Geophys. Res., 96, 6829–6848, doi:10.1029/90JB02015.
Miller, K. G., M. A. Kominz, J. V. Browning, J. D. Wright, G. S. Mountain,M. E. Katz, P. J. Sugarman, B. S. Cramer, N. Christie‐Blick, and S. F.Pekar (2005), The Phanerozoic record of global sea‐level change, Science,310(5752), 1293–1298, doi:10.1126/science.1116412.
Miller, K. G., J. V. Browning, M.‐P. Aubry, B. S. Wade, M. E. Katz, A. A.Kulpecz, and J. D. Wright (2008), Eocene‐Oligocene global climate andsea‐level changes: St. Stephens Quarry, Alabama, Geol. Soc. Am. Bull.,120(1–2), 34–53, doi:10.1130/B26105.1.
Milliman, J. D. (1993), Production and accumulation of calcium carbonatein the ocean: Budget of a non steady state, Global Biogeochem. Cycles,7(4), 927–957, doi:10.1029/93GB02524.
Mix, A. C., and R. G. Fairbanks (1985), North Atlantic surface‐ocean con-trol of Pleistocene deep‐ocean circulation, Earth Planet. Sci. Lett., 73,231–243, doi:10.1016/0012-821X(85)90072-X.
Mountain, G. S., and K. G. Miller (1992), Seismic and geological evidencefor late Paleocene‐early Eocene deep water circulation in the westernNorth Atlantic, Paleoceanography, 7(4), 423–439, doi:10.1029/92PA01268.
Nurnberg, D., J. Bijma, and C. Hemleben (1996), Assessing the reliabilityof magnesium in foraminiferal calcite as a proxy for water mass tempera-tures, Geochim. Cosmochim. Acta, 60, 803–814, doi:10.1016/0016-7037(95)00446-7.
Oppo, D. W., and R. G. Fairbanks (1987), Variability in the deep and interme-diate water circulation of the Atlantic Ocean during the past 25,000 years:Northern Hemisphere modulation of the Southern Ocean, Earth Planet.Sci. Lett., 86, 1–15, doi:10.1016/0012-821X(87)90183-X.
Pagani, M., J. C. Zachos, K. H. Freeman, B. Tipple, and S. Bohaty (2005),Marked decline in atmospheric carbon dioxide concentrations during thePaleogene, Science, 309, 600–603, doi:10.1126/science.1110063.
Pak, D. K., and K. G. Miller (1992), Paleocene to Eocene benthic forami-niferal isotopes and assemblages: Implications for deep water circulation,Paleoceanography, 7(4), 405–422, doi:10.1029/92PA01234.
Pearson, P. N., G. L. Foster, and B. S. Wade (2009), Atmospheric carbondioxide during the Eocene‐Oligocene climate transition, Nature, 461,1110–1113, doi:10.1038/nature08447.
Peck, V. L., J. Yu, S. Kender, and C. R. Riesselman (2010), Shifting oceancarbonate chemistry during the Eocene‐Oligocene climate transition: Im-plications for deep ocean Mg/Ca paleothermometry, Paleoceanography,25, PA4219, doi:10.1029/2009PA001906.
Pekar, S. F., N. Christie‐Blick, M. A. Kominz, and K. G. Miller (2002),Calibration between glacial eustasy and oxygen isotopic data for the earlyicehouse world of the Oligocene, Geology, 30(10), 903–906,doi:10.1130/0091-7613(2002)030<0903:CBEEFB>2.0.CO;2.
Raitzsch, M., H. Kuhnert, J. Groeneveld, and T. Bickert (2008), Benthicforaminifer Mg/Ca anomalies in South Atlantic core top sediments andtheir implications for paleothermometry, Geochem. Geophys. Geosyst.,9, Q05010, doi:10.1029/2007GC001788.
Rathburn, A. E., and P. DeDeckker (1997), Magnesium and strontium ofrecent benthic foraminifera from the Coral Sea, Australia and PrydzBay, Antarctica, Mar. Micropaleontol., 32, 231–248, doi:10.1016/S0377-8398(97)00028-5.
Raymo, M. E. (1994), The Himalayas, organic carbon burial, and climate inthe Miocene, Paleoceanography, 9(3), 399–404, doi:10.1029/94PA00289.
Rea, D. K., and M. Lyle (2005), Paleogene calcite compensation depth inthe eastern subtropical Pacific: Answers and questions, Paleoceanogra-phy, 20, PA1012, doi:10.1029/2004PA001064.
Regenberg, M., D. Nürnberg, S. Steph, J. Groeneveld, D. Garbe‐Schonberg,R. Tiedemann, and W.‐C. Dullo (2006), Assessing the effect of dissolu-tion on planktonic foraminiferal Mg/Ca ratios: Evidence from Caribbeancore tops, Geochem. Geophys. Geosyst., 7, Q07P15, doi:10.1029/2005GC001019.
Robert, C., L. Diester‐Haass, and H. Chamley (2002), Late Eocene‐Oligocene oceanographic development at southern high latitudes, fromterrigenous and biogenic particles: A comparison of Kerguelen Plateauand Maud Rise, ODP Sites 744 and 689, Mar. Geol., 191, 37–54,doi:10.1016/S0025-3227(02)00508-X.
Rosenthal, Y., and G. P. Lohmann (2002), Accurate estimation of seasurface temperatures using dissolution‐corrected calibrations for Mg/Capaleothermometry, Paleoceanography, 17(3), 1044, doi:10.1029/2001PA000749.
Rosenthal, Y., E. A. Boyle, and N. Slowey (1997), Environmental controlson the incorporation of Mg, Sr, F and Cd into benthic foraminiferal shellsfrom Little Bahama Bank: Prospects for thermocline paleoceanography,Geochim. Cosmochim. Acta, 61, 3633–3643, doi:10.1016/S0016-7037(97)00181-6.
Rosenthal, Y., G. P. Lohmann, K. C. Lohmann, and R. M. Sherrell (2000),Incorporation and preservation of Mg in Globigerinoides sacculifer:Implications for reconstructing the temperature and 18O/16O of seawater,Paleoceanography, 15(1), 135–145, doi:10.1029/1999PA000415.
Rosenthal, Y., C. H. Lear, D. W. Oppo, and B. Linsley (2006), Tempera-ture and carbonate ion effects on Mg/Ca and Sr/Ca ratios in benthic fora-
PUSZ ET AL.: EOT TEMPERATURE AND ICE VOLUME PA2205PA2205
14 of 15
minifera: Aragonitic species Hoeglundina elegans, Paleoceanography,21, PA1007, doi:10.1029/2005PA001158.
Salamy, K. A., and J. C. Zachos (1999), Latest Eocene‐Early Oligoceneclimate change and Southern Ocean fertility: Inferences from sedimentaccumulation and stable isotope data, Palaeogeogr. Palaeoclimatol.Palaeoecol., 145, 61–77, doi:10.1016/S0031-0182(98)00093-5.
Sarnthein, M., J. Thiede, U. Pflaumann, H. Erlenkeuser, D. Futterer,B. Koopmann, H. Lange, and E. Seibold (1982), Atmospheric and oceaniccirculation patterns off northwest Africa during the past 25 million years,in Geology of the Northwest African Continental Margin, edited byU. von Rad et al., pp. 545–604, Springer, New York.
Savin, S. M., R. G. Douglas, and F. G. Stehli (1975), Tertiary marinepaleotemperatures, Geol. Soc. Am. Bull., 86(11), 1499–1510, doi:10.1130/0016-7606(1975)86<1499:TMP>2.0.CO;2.
Scher, H. D., and E. E. Martin (2004), Circulation in the Southern Oceanduring the Paleogene inferred from neodymium isotopes, Earth Planet.Sci. Lett., 228, 391–405, doi:10.1016/j.epsl.2004.10.016.
Schnitker, D. (1980), North Atlantic oceanography as possible cause ofAntarctic glaciation and eutrophication, Nature, 284, 615–616,doi:10.1038/284615a0.
Shackleton, N. J. (1974), Attainment of isotopic equilibrium between oceanwater and the benthonic foraminifera genus Uvigerina: Isotopic changesin the ocean during the last glacial, Colloq. Int. CNRS, 219, 203–209.
Shackleton, N. J. (1977), Carbon‐13 in Uvigerina: Tropical rain foresthistory and the equatorial Pacific carbonate dissolution cycles, in TheFate of Fossil Fuel CO2 in the Oceans, edited by N. R. Andersonand A. Malahoff, pp. 401–427, Plenum, New York.
Shackleton, N. J., and J. P. Kennett (1975), Paleotemperature history ofthe Cenozoic and initiation of Antarctic glaciations: Oxygen and carbonisotopic analyses in DSDP Sites 277, 279, and 281, Initial Rep. DeepSea Drill. Proj., 29, 743–755, doi:10.2973/dsdp.proc.29.117.1975.
Shackleton, N. J., J. Imbrie, and M. A. Hall (1983), Oxygen and carbonisotope record of East Pacific core V19‐30: Implications for the forma-tion of deep water in the late Pleistocene, Earth Planet. Sci. Lett., 65,233–244, doi:10.1016/0012-821X(83)90162-0.
Shevenell, A. E., J. P. Kennett, and D. W. Lea (2008), Middle Miocene icesheet dynamics, deep‐sea temperatures, and carbon cycling: A SouthernOcean perspective, Geochem. Geophys. Geosyst. , 9 , Q02006,doi:10.1029/2007GC001736.
Stanley, S. M., and L. A. Hardie (1998), Secular oscillations in the carbon-ate mineralogy or reef‐building and sediment producing organismsdriven by tectonically forced shifts in seawater chemistry, Palaeogeogr.Palaeoclimatol. Palaeoecol., 144, 3–19, doi:10.1016/S0031-0182(98)00109-6.
Stein, C. A., and S. Stein (1992), A model for the global variation in oce-anic depth and heat flow with lithospheric age, Nature, 359, 123–129,doi:10.1038/359123a0.
Thomas, D. J., T. J. Bralower, and C. E. Jones (2003), Neodymium isotopicreconstruction of late Paleocene‐early Eocene thermohaline circulation,Earth Planet. Sci. Lett., 209, 309–322, doi:10.1016/S0012-821X(03)00096-7.
Tripati, A., J. Backman, H. Elderfield, and P. Ferretti (2005), Eocene bipo-lar glaciations associated with global carbon cycle changes, Nature, 436,341–346, doi:10.1038/nature03874.
van Andel, T. H. (1975), Mesozoic/Cenozoic calcite compensation depthand the global distribution of calcareous sediments, Earth Planet. Sci.Lett., 26, 187–194, doi:10.1016/0012-821X(75)90086-2.
van Morkhoven, F. P. C. M., W. A. Berggren, and A. S. Edwards (1986),Cenozoic Cosmopolitan Deep‐Water Benthic Foraminifera, Bull. Cent.Rech. Explor. Prod. Elf Aquitaine, vol. 11, 421 pp.
Via, R. K., and D. J. Thomas (2006), Evolution of Atlantic thermohalinecirculation: Early Oligocene onset of deep‐water production in the NorthAtlantic, Geology, 34(6), 441–444, doi:10.1130/G22545.1.
Vincent, E., and W. H. Berger (1985), Carbon dioxide and polar cooling inthe Miocene: The Monterey hypothesis, in The Carbon Cycle and Atmo-
spheric CO2: Natural Variations, Archean to Present, Geophys. Monogr.Ser, vol. 32, edited by E. T. Sundquist and W. S. Broecker, pp. 455–468,AGU, Washington, D. C.
Volbers, A. N., and R. Henrich (2002), Present water mass calcium car-bonate corrosiveness in the eastern South Atlantic inferred from ultra-structural breakdown of Globigerina bulloides in surface sediments,Mar. Geol., 186, 471–486, doi:10.1016/S0025-3227(02)00333-X.
White, T., L. Gonzalez, G. Ludvigson, and C. Poulsen (2001), MiddleCretaceous greenhouse hydrologic cycle of North America, Geology,29 (4 ) , 363–366 , do i :10 .1130/0091-7613(2001)029<0363 :MCGHCO>2.0.CO;2.
Wilkinson, B. H., and T. J. Algeo (1989), Sedimentary carbonate record ofcalcium‐ magnesium cycling, Am. J. Sci., 289, 1158–1194, doi:10.2475/ajs.289.10.1158.
Wilson, D. S., and B. P. Luyendyk (2009), West Antarctic paleotopographyestimated at the Eocene‐Oligocene climate transition, Geophys. Res.Lett., 36, L16302, doi:10.1029/2009GL039297.
Wold, C. N. (1994), Cenozoic sediment accumulation on drifts in the north-ern North Atlantic, Paleoceanography, 9(6), 917–941, doi:10.1029/94PA01438.
Woodruff, F., and S. Savin (1989), Miocene deep water oceanography,Paleoceanography, 4(1), 87–140, doi:10.1029/PA004i001p00087.
Wright, J. D., and K. G. Miller (1996), Control of North Atlantic deepwater circulation by the Greenland‐Scotland Ridge, Paleoceanography,11(2), 157–170, doi:10.1029/95PA03696.
Wright, J. D., K. G. Miller, and R. G. Fairbanks (1991), Evolution ofmodern deep water circulation: Evidence from the late Miocene South-ern Ocean, Paleoceanography, 6(2), 275–290, doi:10.1029/90PA02498.
Wright, J. D., K. G. Miller, and R. G. Fairbanks (1992), Early and middleMiocene stable isotopes: Implications for deep water circulation andclimate, Paleoceanography, 7(3), 357–389, doi:10.1029/92PA00760.
Yu, J., and H. Elderfield (2008), Mg/Ca in the benthic foraminiferaCibicidoides wuellerstorfi and Cibicidoides mundulus: Temperatureversus carbonate ion saturation saturation, Earth Planet. Sci. Lett.,276, 129–139, doi:10.1016/j.epsl.2008.09.015.
Zachos, J. C., and L. R. Kump (2005), Carbon cycle feedbacks and the ini-tiation of Antarctic glaciation in the earliest Oligocene, Global Planet.Change, 47(1), 51–66, doi:10.1016/j.gloplacha.2005.01.001.
Zachos, J. C., J. R. Breza, and W. Wise (1992), Early Oligocene ice‐sheetexpansion on Antarctica: Stable isotope and sedimentological evidencefrom the Kerguelen Plateau, southern Indian Ocean, Geology, 20(6),569–573, doi:10.1130/0091-7613(1992)020<0569:EOISEO>2.3.CO;2.
Zachos, J. C., L. D. Stott, and K. C. Lohmann (1994), Evolution of earlyCenozoic marine temperatures, Paleoceanography, 9(2), 353–387,doi:10.1029/93PA03266.
Zachos, J. C., T. M. Quinn, and K. A. Salamy (1996), High‐resolution(104 years) deep‐sea foraminiferal stable isotope records of the Eocene‐Oligocene climate transition, Paleoceanography, 11(3), 251–266,doi:10.1029/96PA00571.
Zachos, J., M. Pagani, L. Sloan, E. Thomas, and K. Billups (2001), Trends,rhythms, and aberrations in global climate 65 Ma to present, Science,292, 686–693, doi:10.1126/science.1059412.
Zachos, J. C., et al. (2004), Early Cenozoic Extreme Climates: The WalvisRidge Transect, Proc. Ocean Drill. Program, Initial Rep., vol. 208, editedby H. Nevill, Ocean Drill. Program, College Station, Tex., doi:10.2973/odp.proc.ir.208.2004.
K. G. Miller, Department of Earth and Planetary Sciences, RutgersUniversity, Wright Geological Laboratory, 610 Taylor Rd., Piscataway,NJ 08854, USA.A. E. Pusz and R. C. Thunell, Department of Earth and Ocean Sciences,
University of South Carolina, 701 Sumter St., Columbia, SC 29208, USA.([email protected])
PUSZ ET AL.: EOT TEMPERATURE AND ICE VOLUME PA2205PA2205
15 of 15