Deep targeted sequencing of TP53 in chronic lymphocytic ...
46
Deep targeted sequencing of TP53 in chronic lymphocytic leukemia: clinical impact at diagnosis and at time of treatment by Christian Brieghel, Savvas Kinalis, Christina W. Yde, Ane Y. Schmidt, Lars Jønson, Michael A. Andersen, Caspar da Cunha-Bang, Lone B. Pedersen, Christian H. Geisler, Finn C. Nielsen, and Carsten U. Niemann Haematologica 2018 [Epub ahead of print] Citation: Christian Brieghel, Savvas Kinalis, Christina W. Yde, Ane Y. Schmidt, Lars Jónson, Michael A. Andersen, Caspar da Cunha-Bang, Lone B. Pedersen, Christian H. Geisler, Finn C. Nielsen, and Carsten U. Niemann. Deep targeted sequencing of TP53 in chronic lymphocytic leukemia: clinical impact at diagnosis and at time of treatment. Haematologica. 2018; 103:xxx doi:10.3324/haematol.2018.195818 Publisher's Disclaimer. E-publishing ahead of print is increasingly important for the rapid dissemination of science.Haematologica is, therefore, E-publishing PDF files of an early version of manuscripts thathave completed a regular peer review and have been accepted for publication. E-publi- shingof this PDF file has been approved by the authors. After having E-published Ahead ofPrint, manuscripts will then undergo technical and English editing, typesetting, proof correc- tion and be presented for the authors' final approval; the final version of the manuscriptwill then appear in print on a regular issue of the journal. All legal disclaimers thatapply to the journal also pertain to this production process. Copyright 2018 Ferrata Storti Foundation. Published Ahead of Print on December 4, 2018, as doi:10.3324/haematol.2018.195818.
Transcript of Deep targeted sequencing of TP53 in chronic lymphocytic ...

Deep targeted sequencing of TP53 in chronic lymphocytic leukemia: clinical impact at diagnosis and at time of treatment
by Christian Brieghel, Savvas Kinalis, Christina W. Yde, Ane Y. Schmidt, Lars Jønson, Michael A. Andersen, Caspar da Cunha-Bang, Lone B. Pedersen, Christian H. Geisler, Finn C. Nielsen, and Carsten U. Niemann
Haematologica 2018 [Epub ahead of print]
Citation: Christian Brieghel, Savvas Kinalis, Christina W. Yde, Ane Y. Schmidt, Lars Jónson, Michael A. Andersen, Caspar da Cunha-Bang, Lone B. Pedersen, Christian H. Geisler, Finn C. Nielsen,and Carsten U. Niemann. Deep targeted sequencing of TP53 in chronic lymphocytic leukemia: clinical impact at diagnosis and at time of treatment.Haematologica. 2018; 103:xxxdoi:10.3324/haematol.2018.195818
Publisher's Disclaimer.E-publishing ahead of print is increasingly important for the rapid dissemination ofscience.Haematologica is, therefore, E-publishing PDF files of an early version of manuscriptsthathave completed a regular peer review and have been accepted for publication. E-publi-shingof this PDF file has been approved by the authors. After having E-published AheadofPrint, manuscripts will then undergo technical and English editing, typesetting, proof correc-tion and be presented for the authors' final approval; the final version of the manuscriptwillthen appear in print on a regular issue of the journal. All legal disclaimers thatapply to thejournal also pertain to this production process.
Copyright 2018 Ferrata Storti Foundation.Published Ahead of Print on December 4, 2018, as doi:10.3324/haematol.2018.195818.
TITLE: Deep targeted sequencing of TP53 in chronic lymphocytic leukemia: clinical impact at diagnosis and at time of treatment.
AUTHORS: Christian Brieghel1, Savvas Kinalis2, Christina W. Yde2, Ane Y. Schmidt2, Lars Jønson2, Michael A. Andersen1, Caspar da Cunha-Bang1, Lone B. Pedersen1, Christian H. Geisler1, Finn C. Nielsen2, and Carsten U. Niemann1.
1. Department of Hematology, Rigshospitalet, Copenhagen, Denmark. 2. Center for Genomic Medicine, Rigshospitalet, Copenhagen, Denmark.
RUNNING HEADS: TP53 mutations in chronic lymphocytic leukemia
Correspondence to
Carsten Utoft Niemann Dept. Haematology Rigshospitalet, Blegdamsvej 9 2100-Copenhagen, Denmark [email protected] Phone +45 35 45 78 30
Abstract word count: 254
Main text word count: 3,376
Tables: 1 + 8 supplementary tables
Figures: 4 + 8 supplementary figures
References: 34

ABSTRACT
In chronic lymphocytic leukemia, TP53 mutations and deletion of chromosome 17p are well-characterized biomarkers associated with poor progression-free and overall survival following chemoimmunotherapy. Patients harboring low burden TP53 mutations with variant allele frequencies of 0.3-15% have been shown to have similar dismal outcome as those with high burden mutations. We here describe a highly sensitive deep targeted Next Generation Sequencing assay allowing for the detection of TP53 mutations as low as 0.2% variant allele frequency. Within a consecutive, single center cohort of 290 newly diagnosed patients with chronic lymphocytic leukemia, deletion of chromosome 17p was the only TP53 aberration significantly associated with shorter overall survival and treatment-free survival. We were unable to demonstrate any impact of TP53 mutations, whether high burden (variant allele frequency >10%) or low burden (variant allele frequency ≤10%), in the absence of deletion of chromosome 17p. In addition, the impact of high burden TP53 aberration (deletion of chromosome 17p and/or TP53 mutation with variant allele frequency >10%) was only evident for patients with IGHV unmutated status; no impact of TP53 aberrations on outcome was seen for patients with IGHV mutated status. In 61 patients at time of treatment, the prognostic impact of TP53 mutations above 1% variant allele frequency could be confirmed. This study furthers the identification of a clinical significant limit of detection for robust TP53 mutation analysis in chronic lymphocytic leukemia. Multicenter studies are needed for validation of ultra-sensitive TP53 mutation assays in order to define and implement a technical as well as clinical lower limit of detection.

Introduction
Chronic lymphocytic leukemia (CLL) is a clonal B-cell malignancy characterized by a heterogeneous clinical course. Prognostic and predictive markers of survival and treatment outcome are essential in management of the disease.1 Deletion of chromosome 17p (del(17p)) and TP53 mutation (TP53mut) remain the most important risk factors for progression-free survival (PFS) and overall survival (OS) following chemo- and chemoimmunotherapy (CIT).2-6 In recent years, B-cell receptor pathway inhibitors (idelalisib, ibrutinib and acalabrutinib) and Bcl-2 inhibitors (venetoclax) have demonstrated remarkable response rates and durable remissions in both treatment naïve and previously treated CLL patients with TP53ab.7-11 Randomized clinical trials comparing CIT directly to targeted therapy in a TP53 aberrated population are still awaited. Thus, assessment of TP53 aberration (TP53ab: del(17p) and/or TP53mut) is recommended prior to any treatment decision.12
Approximately 80% of patients with del(17p) also harbor TP53muts on the remaining allele, while a subset of patients have TP53muts without del(17p).5 However, Sanger sequencing and fluorescent in situ hybridization (FISH) fail to detect 4-5% of newly diagnosed and untreated patients with CLL harboring low burden TP53muts (Sanger negative) without concomitant del(17p).13, 14 Deep targeted Next Generation Sequencing (NGS) of TP53 have shown that low burden TP53muts with a variant allele frequency (VAF) as low as 0.3% have similar outcome as patients with high burden TP53muts (Sanger positive).13, 14 However, recent data from the UK CLL4 trial indicated that low burden TP53muts did not impact neither OS nor PFS for patients treated with chemotherapy.15 For newly diagnosed patients harboring only one TP53ab, better OS is demonstrated compared to patients with both del(17p) and TP53mut. Similarly, patients with del(17p) and additional low burden TP53mut show better OS compared to patients with additional high burden TP53mut.16, 17 Thus, the impact of additional TP53ab warrants further investigation.
Upon therapy, the prevalence and size of TP53 clones increase due to clonal evolution and acquisition of new TP53muts.18, 19 Targeted therapy is established as the standard of care for patients with TP53ab CLL.20, 21 Whether patients with low burden TP53ab may benefit more from targeted therapy compared to standard CIT still remains open for investigation, as evidence and thus guidelines are unresolved.12 Thus, studies to elucidate a technical and a clinically significant limit of detection (LOD) for TP53mut are warranted to guide clinical decisions for these patients.
We here describe a robust NGS assay for detection of TP53mut as low as 0.2% VAF. In order to investigate a clinically relevant LOD for low burden TP53mut, we assessed the impact of TP53mut at diagnosis and at time of treatment in a single center cohort of patients with CLL.
Methods
Patients and materials
All consecutive patients diagnosed with CLL from a single center sampled between January 2007 and October 2014 were included (Figure S1). Samples from patients obtained within 200 days of the diagnostic flow cytometry were considered newly diagnosed.21 To assess the clinical impact of TP53ab at time of treatment, samples obtained up to 200 days before treatment were included for

a separate analysis. All available samples considered newly diagnosed and/or sampled at time of treatment were sequenced. Due to the retrospective nature of the study, TP53 analysis was performed on peripheral blood mononuclear cells (PBMCs) and not on purified CLL cells. For 244 patients (81% of the newly diagnosed cohort) with available flow cytometry data at time of sampling, 197 patients (81%) had CLL populations >70% of the PBMCs (see supplementary methods), thus we report VAFs based on PBMCs.
Patient characteristics and clinical data were obtained from medical records and registries; CLL-IPI factors in terms of age (≤65 vs >65 years), Binet stage (A vs. B or C), beta-2-microglobulin (<4.0 mg/L vs ≥4.0 mg/L), IGHV mutational status (germline identity <98% vs ≥98%), and TP53ab only by FISH (no del(17p) vs del(17p)) were included.3, 22 Del(17p) was considered positive if present in at least 10% of 200 interphases. The study was approved by the National Committee on Health Research Ethics, the Data Protection Agency and the Health Authorities.
TP53 mutational analysis by deep targeted sequencing
A high sensitivity TP53 assay was established based on serial 10-fold dilutions of DNA from patient samples with donor DNA. By including a dilution step for each sequenced sample, background noise was filtered and a LOD was established at 0.2% VAF (supplementary methods, Figure S2). For each patient, DNA extracted from PBMCs was analyzed undiluted and diluted 20% (dilution factor 5) in DNA derived from the SU-DHL4 cell line. A known TP53mut (p.Arg273Cys) harbored in the cell line DNA acted as internal control of dilution grade. Using 100 ng gDNA per reaction, TP53 exons 2-10 incl. 2 bp intronic overlap for splice sites were amplified with 30 cycles of PCR using Phusion® HSII High-Fidelity DNA polymerase (Life Technologies, Waltham, MA, USA). Primers are provided in Table S1. In brief, library preparation was performed following manufacturer protocol KAPA DNA Library Preparation (Nimblegen). Using SeqCap Adapter Kit A and B (Roche NimbleGen) or NEXTflex™ DNA Barcodes 96 (Bioo Scientific, Austin, TX, USA), libraries were pooled (24 or 96 samples per lane) and sequenced as paired-end on a HiSeq2500 using HiSeq® SBS Kit v4 (2x125 base PE, Illumina) to obtain a minimum target read depth of 20,000x.
Bioinformatic workflow
A workflow for detection of low burden variants was developed in CLC Biomedical Genomics Workbench 3.0 (CLC BGW, Qiagen, Hilden, Germany) as described in supplementary methods. Achieving a median coverage of 144,158 reads (99% of region > 26,217x), we applied both a dilution match algorithm (DMA) and a stereotypic error model (SEM) described in detail in supplementary methods. In brief, only variants that diluted correctly were called as TP53mut by DMA (Figure S3), while SEM identified outliers from the position-specific and nucleotide-specific background noise as true TP53mut based on the distribution of stereotypic errors (Figures S4-S5).13 Results from both DMA and SEM were compared using contingency tables, and only true positive variants were considered true mutations used in subsequent analyses (Figure S6 and Table S4).
Validation by droplet digital PCR and Capture based targeted NGS

Droplet digital PCR (ddPCR) was used to validate initial low burden variants. Allele specific Prime Assay™ probes (Bio-Rad, Hercules, CA, USA) were applied for triplicate analyses using QX200™ Droplet Digital™ PCR System and QuantaSoft™ 1.7 (Bio-Rad) according to instructions from the manufacturer. A custom made SeqCap EZ Choice gene panel (Roche Nimblegen) containing TP53 exons 2-10 was used to validate mutations with a VAF ≥1% as described in supplementary methods.
Statistics
Time to event was calculated from date of diagnosis for treatment-free survival (TFS), and from date of diagnosis or first date of treatment for OS. Patients were followed until initiation of CLL-specific treatment or death or end of follow-up, which ever came first, defined as TFS, and until death or end of follow-up, whichever came first, defined as overall survival (OS). Analyses were performed using Kaplan–Meier method and Log-rank test was used to compare outcome. TP53muts were stratified into high and low burden mutations (VAF>10% and VAF ≤10%, respectively) including minor TP53muts (VAF<1%).12, 18 Since allogeneic stem cell transplantation is considered the only curative treatment in CLL, follow up was censored upon allogeneic stem cell transplantation for the cohort analyzed at time of treatment. FISH was not repeated at time of treatment in five patients for whom the baseline FISH were extrapolated. All analyses downstream of CLC BGW were performed with R version 3.4.1.23
Results
Patient cohorts and impact of baseline characteristics
A total of 446 patients were included in this study. We excluded 44 patients with unavailable material and 92 patients who were neither newly diagnosed nor sampled at time of treatment. The two final cohorts included 290 newly diagnosed patients and 61 patients sampled at time of treatment including 50 patients at time of 1st line treatment and 11 at time of later line treatment (Figure S1). Median time from date of diagnosis to sample collection was 2 days (IQR: 1.25-2.00). During a median follow-up of 6.0 years (IQR 3.9-7.9), 97 (33%) patients received treatment and 81 (28%) deaths were registered among newly diagnosed patients. Compared to the Danish nation-wide cohort, fewer patients were older than 65 years (58.6% vs. 71.2%) and a lower prevalence of Binet Stage B/C disease (15.3% vs 20.6%) as well as a lower prevalence of del(17p) (2.4% vs. 6.1%) were seen in this cohort. Except for age, high-risk features were enriched in the 61 patients at time of treatment compared to the newly diagnosed patients (Table 1).
Improved robustness of low burden TP53 mutation detection Robust detection of low burden TP53muts was ensured by combining a dilution match algorithm (DMA) and a stereotypic error model (SEM). For DMA, the ratio of variants called in both undiluted and diluted samples from the same patient (dilution ratio, DR) and the reference allele frequency of a known cell line mutation used for dilution (dilution grade, DG) were plotted (Figure S3). The

proximity to a line with a slope of one between the DG and adjusted DR defined true mutations for DMA. For SEM, we modeled frequent variants (observed ≥20) according to each unique genomic position and nucleotide change, while infrequent variants (observed <20) were modeled according to each unique nucleotide change only. VAFs were fitted to gamma distributions allowing for identification of true mutations using Bonferroni correction (Figure S4-S5). For the full study cohort of 308 patients, 98 and 116 TP53muts were called by DMA and SEM, respectively (Figure S6 and Table S5). Using a LOD of 1% VAF, we obtained 100% consistency between DMA and SEM for determination of true mutations (Table S4C). Between 0.3%-1% VAF, 32 true positive TP53muts were further identified while excluding four variants only detected by either DMA or SEM (Table S4B). Reporting TP53muts as low as 0.2% VAF, 10 additional true positive TP53muts could be identified, while 26 mutations only identified by either DMA or SEM were excluded (Tables S4A and S5). Validating the first 30 low burden TP53muts identified, all were confirmed by ddPCR with high correlation between VAF by ddPCR and deep tNGS (r2 = 0.999, Table S6). Consequently, one TP53mut (0.2% VAF) only identified by DMA was excluded based on SEM (Figure S7C) but was in fact validated by ddPCR. However, the TP53 status remained unchanged as this patient harbored additional high and low burden mutations.
Among the 290 newly diagnosed patients, 41 patients (14%) harbored 18 high burden (VAF >10%) and 31 low burden mutations (VAF ≤10%) including 20 minor TP53muts (VAF <1%). This resulted in six patients with both del(17p) and TP53mut, one with del(17p) only, 10 with high burden TP53mut only and 25 patients with low burden TP53mut only (Figure 1A and Table S5). Patients harboring only minor TP53mut were mainly older patients (>65 years) otherwise characterized as low risk according to CLL-IPI (Table S7A), whereas the distribution of high and low burden TP53muts were similar among patients stratified based IGHV mutational status (Table S7B). All mutations were located within exons 4-8 and 80% were missense mutations. Multiple high burden TP53muts were seen in two patients while multiple low burden TP53muts were seen in 5 patients.
Among 61 patients at time of treatment, we identified 57 mutations in 17 patients (28%): 7 patients with high burden and 10 with low burden TP53muts including 4 with minor TP53muts (Figure 1B and Table S5). Forty-three mutations (75%) were observed in 6 of 11 previously treated patients with a median VAF of 1.01% (IQR 0.46-2.93). Five of the 6 patients with del(17p) also harbored TP53muts on the remaining allele at time of treatment (Table S8A). All mutations were located within exons 4-9 and 72% were missense mutations (Figure 1B). Seven patients harbored multiple TP53muts. Patient characteristics are summarized in Table S8.
Prognostic impact in newly diagnosed patients
Stratifying TP53 aberrated patients into high and low burden (TP53wt vs VAF ≤10% vs VAF >10%), only high burden TP53ab (incl. del(17p)) patients showed a trend for worse OS and significantly worse TFS compared to TP53wt (Figure 2 A-B, p=0.06, p=0.01, respectively). Further stratifying low burden TP53mut patients (VAF <1% vs VAF 1-10%), still no impact on OS or TFS was seen for neither group (Figure 2 C-D), whereas combining the group of patients with a VAF above 1% could demonstrate a significant impact on OS and TFS compared to TP53wt (Figure S8 A-B). However, this was fully dependent on del(17p) patients (Figure 2 E-F, p=0.004 and p<0.001, respectively), as TP53 mutated patients without del(17p) demonstrated similar OS and TFS

compared to TP53wt patients (Figure 2 E-F, p>0.25 and Figure S8 C-D). Multiple TP53muts were observed in seven newly diagnosed patients without impact on OS or TFS (1 vs >1 TP53mut, p >0.2, data not shown), while multiple TP53ab including del(17p) resulted in a significant impact on OS and a trend for TFS (1 vs >1 TP53ab, p=0.036, p=0.051, respectively, data not shown).
Prediction of treatment outcome
At time of treatment, TP53ab was significantly associated with a poor OS compared to patients with TP53wt (Figure 3A, p=0.005, data not shown). Stratifying TP53 aberrated patients into high and low burden, only high burden TP53ab patients demonstrated poor OS compared to TP53wt (Figure 3A, p<0.001). Further stratifying low burden TP53 mutated patient (VAF <1% vs VAF 1-10%), OS was significantly worse for patients with TP53mut with VAF 1-10% compared to TP53wt (Figure 3 B, p=0.002). Combining the group of patients with TP53ab with VAF 1-100%, the association persisted when omitting del(17p) patients (Figure 3 C, p≤0.001). Four patients with minor TP53muts remained alive and in complete remission at end of follow up (Figure 3 B-C). There was no survival difference between patients harboring one TP53mut with a VAF greater than 1% (VAF 1-100%) and patients with more than 1 TP53mut (p=0.85, data not shown). Although both 1st line (50 patients) and later line treated patients (11 patients) were included in the cohort at time of treatment, TP53 status demonstrated similar negative impact on OS in both subcohorts (data not shown).
TP53 status may predict outcome in newly diagnosed patients with unmutated IGHV status
As most patients with TP53ab at time of treatment were also IGHV unmutated (IGHV-U, Table S8), we explored the synergy between TP53ab and IGHV mutational status for newly diagnosed patients. For patients with mutated IGHV (IGHV-M), TP53ab (whether low burden or high burden, incl. four patients with del(17p)) did not impact OS or TFS. However, for patients with IGHV-U status, high burden TP53ab (incl. three patients with del(17p)) significantly impacted both OS and TFS (Figure 4, p=0.036, p=0.005, respectively).
Discussion
This study demonstrates that neither high nor low burden TP53muts at time of CLL diagnosis independently influenced OS or TFS in a consecutive cohort of newly diagnosed patients. However, patients with del(17p) at time of diagnosis had an inferior outcome. In addition, the subgroup of patients with TP53ab >10% VAF among patients with IGHV-U status demonstrated inferior OS and TFS. At time of treatment, patients with sole TP53muts >1% VAF had shorter OS as had patients with del(17p).
In this study, del(17p) in newly diagnosed CLL was rare (2.4%) while still demonstrating a negative prognostic impact in accordance with our previous validation of CLL-IPI (3) in a Danish nation-wide cohort.24 The majority of del(17p) patients were also TP53 mutated as expected.5 Although we demonstrate a similar prevalence of TP53 mutated patients and a similar distribution of variant

allele frequencies, TP53muts without concomitant FISH positive for del(17p) were more frequent in newly diagnosed patients (10.7% with a LOD 0.3%) compared to previous publications.13, 14, 17 In particular, sole low burden TP53muts (7.2%) were highly prevalent, whereas the prevalence of patients with sole high burden TP53muts (3.4%) were similar to previous reports.13, 14, 17 Despite a high prevalence and in contrast to Rossi et al,13 we could not demonstrate impact on OS of neither high nor low burden TP53muts without del(17p) in newly diagnosed patients. Similar to our results, Stengel et al demonstrated a better OS in newly diagnosed patients with TP53mut only compared to concomitant del(17p) and TP53mut, which may support the lack of impact on OS in our smaller cohort.17 Further, no impact on time to treatment among newly diagnosed TP53 mutated patients compared to TP53wt patients was reported by Nadeu et al.14 More prevalent high risk factors with impact on early need of treatment observed across previous studies may also contribute to the different impact of TP53muts.13, 14, 17 For instance, the previous studies included older patients with higher Binet stage and more frequent del(17p) resulting in lower frequencies of TP53 mutated patients without del(17p) than in our cohort. Furthermore, a lower CLL-IPI score among our patients was seen compared to the Danish nation-wide CLL cohort, probably due to varying regional referral patterns.
In contrast to previously published data,25 IGHV-U status was not enriched in newly diagnosed TP53 mutated patients, which may in part explain the indolence of our cohort. Synergy was demonstrated for IGHV mutational status and TP53ab in this study. For patients with IGHV-U status, high burden TP53ab correlated with poor outcome among newly diagnosed patients. However, TP53ab (whether high burden or low burden) had no negative prognostic impact on the more indolent disease course for patients with IGHV-M status in accordance with previous studies.26-29 Thus, the less aggressive phenotype in our cohort may diminish any independent impact of TP53muts, especially due to the proportion of IGHV-M status among TP53 mutated patients. High cell proliferation, shorter time to treatment and a distinct pattern of nucleotide shifts in patients with IGHV-U may contribute to the mechanisms causing this interaction between IGHV mutational status and TP53ab.18, 30
Like the majority of NGS studies investigating the clinical impact of TP53muts,13, 14, 16, 18, 31, 32 we confirm the negative impact on OS of TP53muts above 1% VAF at time of treatment. A recent study, however, was unable to show this association for patients harboring low burden TP53muts only.15
In our study, minor TP53muts were highly abundant among pretreated patients. However, minor TP53muts were exclusively observed as the only TP53ab in treatment naïve patients. These newly diagnosed patients with only a single minor TP53mut were mainly older patients with an otherwise favorable risk profile and outcome. Even the four patients with minor TP53mut requiring initial treatment (three with IGHV-U status) remained alive and in complete remission at end of follow up. This may indicate that minor TP53muts as the sole TP53ab is an age related phenomenon of a more benign character similar to reports on clonal hematopoiesis in myeloid malignancies.33 A recent study accordingly found TP53muts enriched among older CLL patients.17
Current guidelines for assessment of TP53muts prior the treatment recommend a LOD at 10% VAF for clinical decisions with the option to report low burden mutations down to 5% VAF by NGS as long as the unresolved clinical significance of such mutations is stated.12 The reason for a caveat when reporting TP53muts below 10% VAF results from 1) low reproducibility between

different NGS platforms in this range and 2) an uncertain clinical significance of low burden mutations.12 To address the technical question of reproducibility, we here report a stereotypic error model of both nucleotide and position specific variants from deep targeted NGS in combination with an algorithm based on the dilution of patient DNA. By this approach, we have developed a technically robust method for detection of TP53muts that would be easily transferred across different platforms and laboratories. For clinical use, we do however recommend using a cell line harboring a rare TP53mut predicted to encode functional p53, such as BRG-A (TP53:c.1060C>G), to avoid both risk of contamination and risk of omitting significant low burden mutations.34 We successfully achieved a LOD of 0.3% VAF, applied in previous studies of minor TP53muts,13, 14, 18 and could even lower the LOD to 0.2% VAF. As we were unable to prove any impact in newly diagnosed patients with IGHV-M, our results support the current guidelines recommending TP53 assessment only prior to treatment.
This study furthers the identification of a clinical significant LOD for TP53muts in CLL. The here proposed method for analysis of minor TP53muts warrants validation across laboratories for a current technical LOD for TP53muts. Subsequent validation and standardization of TP53 mutation assays within networks such as ERIC (http://ericll.org) may provide the platform needed for collaborative multicenter analyses seeking to define a validated clinical LOD for TP53muts.
References
1. Parikh SA, Shanafelt TD. Prognostic factors and risk stratification in chronic lymphocytic
leukemia. Semin Oncol. 2016;43(2):233-240.
2. Pflug N, Bahlo J, Shanafelt T, et al. Development of a comprehensive prognostic index for
patients with chronic lymphocytic leukemia. Blood. 2014;124(1):49-62.
3. International CLLIPIwg. An international prognostic index for patients with chronic
lymphocytic leukaemia (CLL-IPI): a meta-analysis of individual patient data. Lancet Oncol. 2016;17(6):779-
790.
4. Dohner H, Stilgenbauer S, Benner A, et al. Genomic aberrations and survival in chronic
lymphocytic leukemia. N Engl J Med. 2000;343(26):1910-1916.
5. Zenz T, Eichhorst B, Busch R, et al. TP53 Mutation and Survival in Chronic Lymphocytic
Leukemia. J Clin Oncol. 2010;28(29):4473-4479.
6. Stilgenbauer S, Schnaiter A, Paschka P, et al. Gene mutations and treatment outcome in
chronic lymphocytic leukemia: results from the CLL8 trial. Blood. 2014;123(21):3247-3254.
7. Byrd JC, O'Brien S, James DF. Ibrutinib in relapsed chronic lymphocytic leukemia. N Engl J
Med. 2013;369(13):1278-1279.
8. Farooqui MZ, Valdez J, Martyr S, et al. Ibrutinib for previously untreated and relapsed or
refractory chronic lymphocytic leukaemia with TP53 aberrations: a phase 2, single-arm trial. Lancet Oncol.
2015;16(2):169-176.
9. Furman RR, Sharman JP, Coutre SE, et al. Idelalisib and Rituximab in Relapsed Chronic
Lymphocytic Leukemia. N Engl J Med. 2014;370(11):997-1007.
10. Roberts AW, Davids MS, Pagel JM, et al. Targeting BCL2 with Venetoclax in Relapsed Chronic
Lymphocytic Leukemia. N Engl J Med. 2016;374(4):311-322.
11. Byrd JC, Furman RR, Coutre SE, et al. Targeting BTK with ibrutinib in relapsed chronic
lymphocytic leukemia. N Engl J Med. 2013;369(1):32-42.
12. Malcikova J, Tausch E, Rossi D, et al. ERIC recommendations for TP53 mutation analysis in
chronic lymphocytic leukemia-update on methodological approaches and results interpretation. Leukemia.
2018;32(5):1070-1080.
13. Rossi D, Khiabanian H, Spina V, et al. Clinical impact of small TP53 mutated subclones in
chronic lymphocytic leukemia. Blood. 2014;123(14):2139-2147.
14. Nadeu F, Delgado J, Royo C, et al. Clinical impact of clonal and subclonal TP53, SF3B1, BIRC3,
NOTCH1, and ATM mutations in chronic lymphocytic leukemia. Blood. 2016;127(17):2122-2130.
15. Blakemore S. The Contribution of Gene Mutations to Long-Term Clinical Outcomes: Data
from the Randomised UK LRF CLL4 Trial. Blood. 2017;130(Suppl 1):259.
16. Yu L, Kim HT, Kasar SN, et al. Survival of Del17p CLL Depends on Genomic Complexity and
Somatic Mutation. Clin Cancer Res. 2016;23(3):735–745.
17. Stengel A, Kern W, Haferlach T, Meggendorfer M, Fasan A, Haferlach C. The impact of TP53
mutations and TP53 deletions on survival varies between AML, ALL, MDS and CLL: an analysis of 3307 cases.
Leukemia. 2017;31(3):705-711.
18. Malcikova J, Stano-Kozubik K, Tichy B, et al. Detailed analysis of therapy-driven clonal
evolution of TP53 mutations in chronic lymphocytic leukemia. Leukemia. 2015;29(4):877-885.
19. Landau DA, Carter SL, Stojanov P, et al. Evolution and impact of subclonal mutations in
chronic lymphocytic leukemia. Cell. 2013;152(4):714-726.
20. Brown JR, Kay N. Chemoimmunotherapy Is Not Dead Yet in Chronic Lymphocytic Leukemia. J
Clin Oncol. 2017;35(26):2989-2992.
21. Hallek M, Cheson BD, Catovsky D, et al. iwCLL guidelines for diagnosis, indications for
treatment, response assessment, and supportive management of CLL. Blood. 2018;131(25):2745-2760.

22. da Cunha-Bang C, Geisler CH, Enggaard L, et al. The Danish National Chronic Lymphocytic
Leukemia Registry. Clin Epidemiol. 2016;8(1):561-565.
23. Team RC. R: A Language and Environment for Statistical Computing. 2017.
24. da Cunha-Bang C, Christiansen I, Niemann CU. The CLL-IPI applied in a population-based
cohort. Blood. 2016;128(17):2181-2183.
25. Sutton LA, Ljungstrom V, Mansouri L, et al. Targeted next-generation sequencing in chronic
lymphocytic leukemia: a high-throughput yet tailored approach will facilitate implementation in a clinical
setting. Haematologica. 2015;100(3):370-376.
26. Delgado J, Salaverria I, Baumann T, et al. Genomic complexity and IGHV mutational status
are key predictors of outcome of chronic lymphocytic leukemia patients with TP53 disruption.
Haematologica. 2014;99(11):e231–e234.
27. Jeromin S, Haferlach C, Dicker F, Haferlach T, Kern C. Patients with TP53 disruption and IGHV
Mutated Status Show Indolent Clinical Course: A Study on 1,327 Treatment-Naive CLL Cases. Blood.
2016;128(22):4378.
28. Best OG, Gardiner AC, Davis ZA, et al. A subset of Binet stage A CLL patients with TP53
abnormalities and mutated IGHV genes have stable disease. Leukemia. 2009;23(1):212–214.
29. Sutton LA, Hadzidimitriou A, Baliakas P, et al. Immunoglobulin genes in chronic lymphocytic
leukemia: key to understanding the disease and improving risk stratification. Haematologica.
2017;102(6):968-971.
30. Murphy EJ, Neuberg DS, Rassenti LZ, et al. Leukemia-cell proliferation and disease
progression in patients with early stage chronic lymphocytic leukemia. Leukemia. 2017;31(6):1348–1354.
31. Landau DA, Tausch E, Taylor-Weiner AN, et al. Mutations driving CLL and their evolution in
progression and relapse. Nature. 2015;526(7574):525-530.
32. Puente XS, Bea S, Valdes-Mas R, et al. Non-coding recurrent mutations in chronic
lymphocytic leukaemia. Nature. 2015;526(7574):519-524.
33. Wong TN, Ramsingh G, Young AL, et al. Role of TP53mutations in the origin and evolution of
therapy-related acute myeloid leukaemia. Nature. 2015;2015(518):552-557.
34. Campomenosi P, Fronza G, Ottaggio L, et al. Heterogeneous p53 mutations in a Burkitt
lymphoma from an AIDS patient with monoclonal c-myc and VDJ rearrangements. Int J Cancer.
1997;73(6):816-821.

Tables
Table 1. Patient characteristics of the Danish nationwide cohort and study cohorts for newly diagnosed patients and patients at time of treatment. *Indicates inconclusive IGHV analysis. Beta-2-microglobulin (B2M), fluorescent in situ hybridization (FISH).
Nationwide Newly diagnosed Time of treatment
Variable N (%) N (%) N (%)
Age ≤65 years 1017 (28.8) 120 (41.4) 35 (57.4)
>65 years 2513 (71.2) 170 (58.6) 26 (42.6)
Binet A 2804 (79.4) 232 (84.7) 20 (32.8)
B/C 726 (20.6) 42 (15.3) 41 (67.2)
Unknown 0 16 0
B2M ≤4.0 mg/L 2233 (86.0) 213 (86.6) 27 (73.0)
>4.0 mg/L 365 (14.0) 33 (13.4) 10 (27.0)
Unknown 932 44 24
IGHV Mutated 1822 (67.9) 192 (68.1) 17 (30.4)
Unmutated 861 (32.1) 90 (31.9) 39 (69.6)
Unknown 847 8* 5*
FISH No del(17p) 2832 (93.9) 283 (97.6) 55 (90.2)
Del(17p) 185 (6.1) 7 (2.4) 6 (9.8)
Unknown 513 0 0

Figure legends
Figure 1. Characterization of TP53 mutations. Number of mutations indicated in bar plots (regardless of del(17p)) and the number of patients according to TP53 status indicated in pie charts. (A) Located within exons 4-8, 49 mutations were detected in 41 of 290 newly diagnosed patients; six of seven del(17p) patients also harbored TP53 mutations. Eighteen (37%) and 31 (63%) mutations classified as high and low burden, respectively. (B) 57 TP53 mutations within exons 4-9 were detected in 17 of 61 patients at time of treatment; five of 6 del(17p) patients also harbored TP53 mutations. Nine (16%) and 48 (84%) mutations classified as high and low burden, respectively. Primarily missense mutations were detected. All percentages indicate variant allele frequencies (VAF). TP53 mutation without del(17p) (TP53mut).
Figure 2. Overall and treatment-free survival in newly diagnosed patients. Kaplan Meier curves comparing (A, C, E) overall (OS) and (B, D, F) treatment-free survival (TFS) based on (A-B) TP53 aberrations stratified based on variant allele frequencies (VAF) incl. del(17p) with 10% cut-off or (C-D) 1% and 10% cut-off. (E-F) Del(17p) and subgroups with TP53 mutations without del(17p) (TP53mut w/o del(17p)) analyzed separately. P-values indicated in tables.
Figure 3. Overall survival in patients from time of treatment. Stratifying patients with TP53 aberrations incl. del(17p) based on (A) variant allele frequencies (VAF) with 10% cut-off or (B) 1% and 10% cut-off. (C) Del(17p) vs subgroups with TP53 mutations without del(17p) (TP53mut w/o del(17p)) with 1% VAF cut-off is shown. Del(17p) status may reflect baseline if a second FISH was not performed at time of treatment. P-values indicated in tables.
Figure 4. Stratified analysis in newly diagnosed patients based on TP53 and IGHV status. Kaplan Meier curves for (A) overall survival (OS) and (B) treatment-free survival (TFS) in newly diagnosed patients stratified for IGHV status and for TP53 aberrations based on variant allele frequencies (VAF) ≤10% and >10%. Four and three del(17p) are included for mutated (IGHV-M) and unmutated IGHV (IGHV-U), respectively. P-values indicated in tables.


1
Supplementary information
Deep targeted sequencing of TP53 in chronic lymphocytic leukemia:
clinical impact at diagnosis and at time of treatment.
Christian Brieghel1, Savvas Kinalis2, Christina W. Yde2, Ane Y. Schmidt2, Lars Jønson2, Michael A.
Andersen1, Caspar da Cunha-Bang1, Lone B. Pedersen1, Christian Geisler1, Finn C. Nielsen2, and
Carsten U. Niemann1.
1. Department of Hematology, Rigshospitalet, Copenhagen, Denmark. 2. Center for Genomic Medicine, Rigshospitalet, Copenhagen, Denmark.

2
Content
Supplemental methods
Supplemental results
Supplemental references
Supplemental table legends
Table S1: Primers for PCR amplification of TP53
Table S2: TP53 mutations in 8 test samples with del(17p)
Table S3: Excluded TP53 mutations
Table S4: Contingency tables
Table S5: TP53 mutations identified by dilution match algorithm and stereotypic error model
Table S6: Validation by droplet digital PCR
Table S7: Patient characteristics in newly diagnosed patients stratified according to TP53 and
IGHV mutational status
Table S8: Patient characteristics patients at time of treatment stratified according to TP53 and
IGHV mutational status
Supplemental figure legends
Figure S1: Consort diagram of patients included in the study
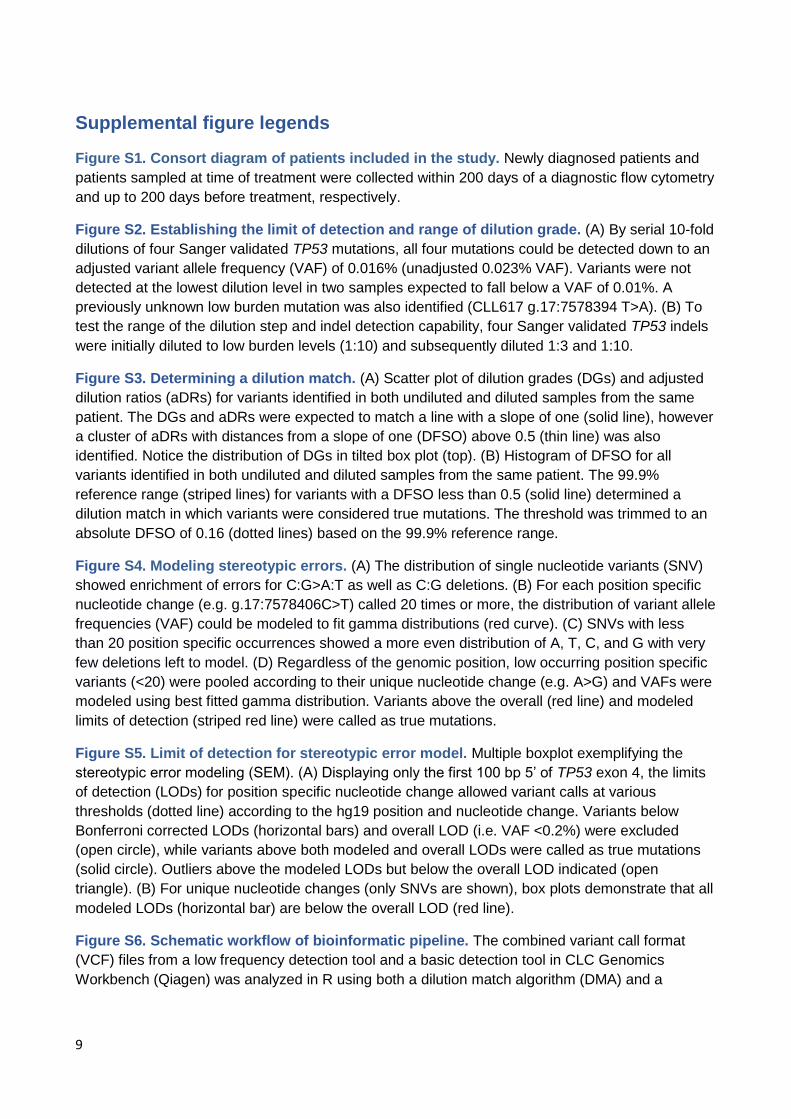
Figure S2: Establishing the limit of detection and range of dilution grade
Figure S3: Determining a dilution match
Figure S4: Modeling stereotypic errors
Figure S5: Limit of detection for stereotypic error model
Figure S6: Schematic workflow of bioinformatic pipeline
Figure S7: Stereotypic error distribution of problematic variants
Figure S8: Subanalysis of overall and treatment-free survival in newly diagnosed patients

3
Supplemental methods
Deep-targeted sequencing
Peripheral blood mononuclear cells (PBMC) were isolated from fresh EDTA blood with Lymfoprep
(Axis-Shield, Oslo, Norway). Genomic DNA was extracted using QIAamp DNA Blood Midi kit
(Qiagen, Hilden, Germany) and quantified on a Qubit® 2.0 fluorometer (Thermo Fisher Scientific,
Waltham, MA, USA). The SU-DHL4 cell line was cultured in 90% RPMI 1640 media, 19% FCS,
and 1% streptomycin at 37°C. Primers were designed to flank TP53 exons 2-10 (RefSeq
NM_00546.5) including splicing sites with 2 bp intronic overlap. We used one primer-pair for exons
2, 3, 7, 8, and 10, two primer-pairs for exon 5 and 9, while exon 4 was covered using 4 primer-
pairs (Table S1). Patient samples were amplified using Phusion® Hot Start II High-Fidelity DNA
polymerase (Thermo Fisher Scientific) with 30 cycles of PCR. Library preparation was performed
on a SciClone G3 Liquid Handling Workstation (Perkin Elmer, Waltham, MA, USA) according to the
manufacturer’s protocol: KAPA DNA Library Preparation, Rev 1 (Roche Nimblegen, Madison, WI,
USA). In brief, amplicons were purified using SeqCap Pure Capture Bead Kit containing AMPure®
XP Beads (Beckman, Brea, CA, USA). Following end repair and poly(A)-tailing, adaptor ligation
was performed with SeqCap Adapter Kit A and B (Roche NimbleGen) or NEXTflex™ DNA
Barcodes 96 (Bioo Scientific, Austin, TX, USA). Following seven cycles of PCR and an additional
AMPure step, libraries were pooled either 24 or 96 samples per lane and sequenced as paired-end
on a HiSeq2500. Using HiSeq® SBS Kit v4 (2x125 base PE; Illumina, San Diego, CA, US), 75% of
reads in the target region were paired.
Determination of sensitivity of the assay
To establish the sensitivity of the TP53 mutation assay, serial dilution of Sanger validated TP53
mutations (TP53muts) were sequenced. Pilot study samples were handled as described above
using only SeqCap Adapters (Roche NimbleGen) and sequenced as paired-end on a MiSeq using
MiSeq Reagent Kit v2 (Illumina, 2x250 base PE). With mutations detected as low as 0.023%
variant allele frequency (VAF), the limit of detection (LOD) was established at 0.2% VAF while a
dilution step (dilution factor 5) was included to increase the robustness of the assay (Figure S2A).
By subtraction of the VAF from variants called in pure cell line DNA, the correlation between
dilution grade and detected VAF was improved (r2 > 0.9957 vs r2 > 0.9967, squared Pearson’s
correlation coefficient). Thus, this approach was chosen for future analyses, replacing any negative
adjusted VAF with zero. The range of the dilution step and the ability to detect insertions and
deletions (indels) was confirmed based on similar serial dilution of patient samples with known
TP53 indels (Figure S2B). Finally, the performance of the assay was evaluated assessing eight
del(17p) samples with unknown TP53 mutational status. As expected, seven of eight samples
harbored TP53 mutations (Table S2).
Bioinformatic workflow
Based on the pilot studies, a workflow for detection of low burden variants was developed in CLC
Biomedical Genomics Workbench 3.0 (CLC BGW, Qiagen). Paired reads were trimmed 20 bp 5` to

4
remove primers and 1 bp 3` to remove bad quality reads further allowing for a quality-score of 0.01.
Reads were mapped to the hg19 (ensembl GRCh37.73) reference genome and realigned using 2
multipasses. Directional frequency filter was set to zero to ensure variant calls in unpaired reads
(25% of target region). The combined call of both a low frequency (VAF ≥0.001%) and basic
variant detection tool (VAF ≥2%) were used to ensure detection of both high and low burden
mutations. To describe the distribution of inevitable low frequency errors (error distribution), all
variants with a minimum of 1 variant read and VAF ≥0.001% were called.
Dilution match algorithm
In analyses downstream of CLC BGW, the adjusted dilution ratios (aDRs) and the dilution grades
(DGs: reference allele frequency of p.Arg273Cys) were plotted and expected to match a line with a
slope of one (Figure S3A). However, a cluster with aDRs around 1 (i.e. a distance to a line with
slope of 1 above 0.5) was also observed and consequently excluded. We next calculated the
99.9% reference range (mean ± 3.27 SD) of remaining distances to a line with a slope of 1 and
trimmed the reference range to an absolute distance ≤0.16. Variants within this distance were
considered to have a dilution match (Figure S3B).
|(𝑅𝐴𝐹(𝑝. 𝑅273𝐶)𝑑𝑖𝑙𝑢𝑡𝑒𝑑 −𝑉𝐴𝐹𝑑𝑖𝑙𝑢𝑡𝑒𝑑 − 𝐷𝐻𝐿4 𝑉𝐴𝐹𝑢𝑛𝑑𝑖𝑙𝑢𝑡𝑒𝑑
𝑉𝐴𝐹𝑢𝑛𝑑𝑖𝑙𝑢𝑡𝑒𝑑 − 𝐷𝐻𝐿4 𝑉𝐴𝐹𝑢𝑛𝑑𝑖𝑙𝑢𝑡𝑒𝑑)| ≤ 0.16
Dilution match algorithm
Stereotypic error model
We further modeled the distribution of stereotypic errors1 to identify outliers considered as true
mutations.2 As modeling of variant reads included inevitable differences in read depth (coverage),
we modeled VAF in two steps as summarized in Figures S4-S6. First, each unique genomic
position including nucleotide change (e.g. g.17:7579472G>C) were grouped and modeled only if
observed in 20 samples or more. Secondly, we grouped each unique nucleotide change (e.g. A>T)
and modeled only if observed in 20 samples or more. Extreme outliers were excluded from
modeling by truncating VAFs that were further than 2 and 4 standard deviations (SDs) from the
mean of the log transformed VAF distributions. Subsequently, truncated VAFs were modeled to fit
gamma distributions that allowed us to identify outliers using Bonferroni adjusted right-sided P-
values of 10-2, 10-4, and 10-6. Unfit for modeling, variants with a rare nucleotide change observed in
less than 20 samples were called with a LOD of 2% VAF. Due to the design of the dilution match
algorithm, c.817C>T (p.Arg273Cys) could not be modeled by this approach. Thus, this mutation
was called with a LOD of 2% VAF.
Reporting variant findings
Variants identified by the dilution match algorithm (DMA) and stereotypic error model (SEM) with a
minimum of 10 variant reads and a VAF ≥0.2% were called and referenced in the IARC TP53
database (http://p53.iarc.fr) excluding validated polymorphisms, synonymous mutations and
mutations predicted to encode functional p53 (Table S3).

5
Comparison of results from the DMA and SEM was performed with 2x2 contingency tables using
combinations of annotated P-values and SDs for LODs 0.2%, 0.3%, and 1% VAF to evaluate the
performance of both methods (Table S4). The three LODs represented our threshold, the lower
threshold used in previous publications,2-4 and the threshold of minor TP53 mutations,3
respectively.
All analyses downstream of CLC BGW were performed with R version 3.4.1 using packages
tidyverse, fitdistrplus, robustHD, epiR, Publish, survival and survminer.5 Source code is available
upon request.
Validation by droplet digital PCR and capture based NGS
Droplet digital PCR (ddPCR) was used to validate the first 30 low burden TP53 mutations.
Genomic DNA was fragmented to approximately 150 bp using S220 Focused-ultrasonicator
(Covaris, Woburn, MA, USA). Custom made allele specific Prime Assay™ probes (Bio-Rad,
Hercules, CA, USA) were added to triplicates of fragmented DNA from either TP53 aberrated
patients or healthy donors. Water acted as non-template controls. Following droplet generation and
39 cycles of PCR using ddPCR Supermix for Probes (no dUTP, Bio-Rad), fluorescent FAM and
HEX signals were read and analyzed on QX200™ Droplet Digital™ PCR System using
QuantaSoft™ 1.7 (Bio-Rad).
Samples from newly diagnosed patients referred between 2008 and 2014 were sequenced using a
custom made SeqCap EZ Choice gene panel (Roche Nimblegen) containing TP53 exons 2-10.
DNA extracted from peripheral blood mononuclear cells (PBMC) was fragmented (Covaris) and
purified using AMPure XP Beads (Beckman). Following end repair and poly(A)-tailing, fragments
were adaptor ligated using NEXTflex™ DNA Barcodes 96 (Bioo Scientific) using KAPA Library
Preparation Kit (Roche NimbleGen) and amplified with 7 cycles of PCR. Pooled libraries were
hybridized twice using SeqCap EZ Kit (Roche NimbleGen) to capture target regions and
sequenced as pair-end on a HiSeq2500 using HiSeq® SBS Kit v4 (2x125 base PE; Illumina). All
samples were sequenced in a single HiSeq run to obtain 80% of output and subsequently analyzed
in CLC BGW allowing for a VAF >1%. CLC BGW workflow is available upon request.
Evaluation of CLL cell fraction by flow cytometry
To evaluate the fraction of CLL cells in purified PBMCs, we reanalyzed the diagnostic fcs files.
Samples were originally run on a FACSCalibur or FACSCanto II (BD, Franklin Lakes, NJ, USA).
Reanalysis was performed using FlowJo® vX.0.7 (Flowjo, Ashland, OR, USA). The fraction of CLL
cells (CD5+, CD19+) was calculated from mononuclear cells gated by CD45 and SSC.

6
Supplemental results
SEM identified a c.848G>A (p.Arg283His) in 45 patients (range: 0.20-0.43% VAF, Figure S7A).
However, none of these were positive by DMA. This specific mutation was considered low frequent
noise and excluded from downstream analyses comparing DMA and SEM. Four variants were only
detected by DMA including three c.848_849delGC (p.Arg283fs*22) positioned at a problematic
position with a wide distribution of background noise (Figure S7 A-B) and one c.488A>G
(p.Tyr163Cys) that was validated by ddPCR but excluded based on SEM modeled on only 24
events (Figure S7C). Twenty-two variants were only detected by SEM. This included one
c.338T>G (p.Phe113Cys) identified at 0.6% VAF, while the remaining 21 variants fell below 0.3%
VAF (Table S5); the LOD applied in previous studies.2, 4 All 70 true negative variants with VAF ≥1%
excluded by both the SEM and the DMA consisted of a splicing site variant c.74+2T>G. This
variant showed a multimodal distribution considered unfit for modeling and is thought to be a
mapping error rather than a result of PCR (Figure S7D).
Due to redundant mutations, validation of the initial 20 TP53muts by ddPCR included 30 low
burden TP53mut (VAF ≤10%) with a median VAF of 0.91% (IQR: 0.41-2.95%). All tested samples
were validated (Table S6). In addition, three high burden TP53muts (VAF >10%) and two minor
TP53muts (VAF <1%) called with a LOD of 0.1% VAF were also validated. Among TP53muts
above 1% VAF tested by capture based targeted NGS, 24 (92%) were validated: 2 mutations could
not be validated (VAF of 1.2% and 2.9%, Table S5).

7
Supplemental references
1. Newman AM, Lovejoy AF, Klass DM, et al. Integrated digital error suppression for improved detection of circulating tumor DNA. Nat Biotechnol. 2016;34(5):547-555.
2. Rossi D, Khiabanian H, Spina V, et al. Clinical impact of small TP53 mutated subclones in chronic lymphocytic leukemia. Blood. 2014;123(14):2139-2147. 3. Malcikova J, Stano-Kozubik K, Tichy B, et al. Detailed analysis of therapy-driven clonal evolution of TP53 mutations in chronic lymphocytic leukemia. Leukemia. 2015;29(877-885. 4. Nadeu F, Delgado J, Royo C, et al. Clinical impact of clonal and subclonal TP53, SF3B1, BIRC3, NOTCH1, and ATM mutations in chronic lymphocytic leukemia. Blood. 2016;127(17):2122-2130. 5. Team RC. R: A Language and Environment for Statistical Computing. 2017.

8
Supplemental table legends
Table S1. The primers used for PCR amplification of TP53 exons 2-10.
Table S2. Analysis of 8 del(17p) test samples with unknown TP53 status. Nine TP53 mutations
were identified in the 7 of the 8 samples using the dilution match algorithm. Dilution grade (DG)
and dilution ratio (DR) were highly similar with short distances from a slope of one (DFSO = DG -
DR).
Table S3. TP53 mutations excluded from analysis. Mutations predicted to encode functional p53
and silent mutations were excluded.
Table S4. Contingency tables show results for the entire study cohort (n=308) of the dilution match
algorithm (DMA) and stereotypic error modeling (SEM) at three different limits of detection (LOD of
VAF ≥0.2%, VAF ≥0.3%, and VAF ≥1%) and 6 different SEM settings (P-values and SD). Standard
deviations (SD) were used for truncating extreme outliers before modeling and Bonferroni adjusted
P-values were used to identify modeled outliers.
Table S5. TP53 mutations identified by dilution match algorithm (DMA) and stereotypic error model
(SEM). Only variants identified by both DMA and SEM were considered true mutations. *Indicates
newly diagnosed patients.
Table S6. Validation by droplet digital PCR. Probes for initial TP53 findings validated all 33 tested
mutations above the limit of detection (LOD) of the assay (0.2% VAF). Two mutations below the
LOD were also validated, but not included in the final report. Note that 14 mutations in 7 non-
diagnostic patients, who were neither sampled 0-200 days before treatment were also tested and
validated.
Table S7. Patient characteristics in newly diagnosed patients stratified according to TP53 (A) and
IGHV status (B). TP53 wild-type (TP53wt), TP53 mutations without del(17p) (TP53mut), del(17p)
regardless of TP53 mutational status (Del(17p)), beta-2-microglobulin (B2M), fluorescent in situ
hybridization (FISH).
Table S8. Patient characteristics at time of treatment stratified according to TP53 (A) and IGHV
status (B). TP53 wild-type (TP53wt), TP53 mutations without del(17p) (TP53mut), del(17p)
regardless of TP53 mutational status (Del(17p)), beta-2-microglobulin (B2M), fluorescent in situ
hybridization (FISH).

TP53 Strand OligoExon 2 Forward AGTGTCTCATGCTGGATCCCExon 2 Reverse GTGGGCCTGCCCTTCCAATGExon 3 Forward AGAGACCTGTGGGAAGCGAAExon 3 Reverse CCCAGCCCAACCCTTGTCCTExon 4a Forward CAGGGCAGCTACGGTTTCCGExon 4a Reverse CTGACAGGAAGCCAAAGGGTExon 4b Forward CCCAGAATGCCAGAGGCTGCExon 4b Reverse AGTCACAGACTTGGCTGTCCExon 4c Forward CCAGAATGCCAGAGGCTGCTExon 4c Reverse GGGCAACTGACCGTGCAAGTExon 4d Forward CTGAGGACCTGGTCATCTGAExon 4d Reverse TGTAGGAGCTGCTGGTGCAGExon 5a Forward CCCTGTGCAGCTGTGGGTTGExon 5a Reverse CTGGGCAACCAGCCCTGTCGExon 5b Forward TTGTGCCCTGACTTTCAACTExon 5b Reverse GCTGTGACTGCTTGTAGATGExon 6 Forward CAGGCCTCTGATTCCTCACTExon 6 Reverse CTCCTCCCAGAGACCCCAGTExon 7 Forward ACTGGCCTCATCTTGGGCCTExon 7 Reverse GCCAGTGTGCAGGGTGGCAAExon 8a Forward GAACAGCTTTGAGGTGCGTGExon 8a Reverse CGCTTCTTGTCCTGCTTGCTExon 8b Forward CAGGTAGGACCTGATTTCCTExon 8b Reverse CCTGGGGGCAGCTCGTGGTGExon 9a Forward GCAGTTATGCCTCAGATTCAExon 9a Reverse AACTTTCCACTTGATAAGAGExon 9b Forward GCAGTTATGCCTCAGATTCAExon 9b Reverse GATAAGAGGTCCCAAGACTTExon 10 Forward TGAACCATCTTTTAACTCAGExon 10 Reverse AGGAAGGGGCTGAGGTCACT
Table S1. The primers used in PCR amplification of TP53 exons 2-10.

Case g description Undiluted VAF (%) Diluted VAF (%) aDR DG DFSOPilot1 17:7577536 T>C 11.40 2.38 0.209 0.216 -0.007Pilot2 17:7577536 T>C 11.52 2.32 0.201 0.250 -0.049Pilot3 17:7579446 T>G 0.31 0.07 0.226 0.161 0.065Pilot3 17:7579440^7579441 ->G 0.29 0.05 0.189 0.161 0.028Pilot4 17:7578239 C>- 77.38 8.79 0.114 0.134 -0.020Pilot5 17:7578203 C>G 11.01 1.15 0.104 0.113 -0.009Pilot6 17:7578403 C>T 75.47 7.34 0.097 0.117 -0.020Pilot7 17:7578205 C>A 39.71 8.77 0.221 0.252 -0.031Pilot7 17:7578268 A>C 13.98 3.16 0.226 0.252 -0.026
Table S2. Analysis of 8 del(17p) test samples with unknown TP53 status. Nine TP53 mutations wereidentified in the 7 of the 8 samples using the dilution match algorithm. Dilution grade (DG) and the adjusteddilution ratio (aDR) showed high correlation as seen by short distances from a slope of one (DFSO = DG -aDR).

Sample ID c description p description VAF (%) Exon Exclusion criterion
CLL47 c.704A>G p.Asn235Ser 49.18 Exon 7 Encoding functional p53CLL61 c.672G>A p.Glu224Glu 0.69 Exon 6 Silent mutationCLL93 c.114A>C p.Gln38His 0.21 Exon 4 Encoding functional p53CLL122 c.826G>A p.Ala276Thr 2.54 Exon 8 Encoding functional p53CLL140 c.1060C>A p.Gln354Lys 52.51 Exon 10 Encoding functional p53
CLL214 c.704A>G p.Asn235Ser 48.96 Exon 7 Encoding functional p53CLL239 c.410T>C p.Leu137Pro 1.04 Exon 5 Encoding functional p53CLL247 c.837G>A p.Gly279Gly 1.43 Exon 8 Silent mutationCLL250 c.570T>C p.Pro190Pro 0.52 Exon 6 Silent mutationCLL267 c.1015G>A p.Glu339Lys 49.56 Exon 10 Encoding functional p53CLL329 c.612G>A p.Glu204Glu 50.05 Exon 6 Silent mutation
Table S3. TP53 mutations excluded from analysis. Mutations predited to encode functional p53 and silentmutations were excluded.

DMA +94SEM +
DMA −
4SEM −
Total
98Total
22386408
116390506
A DMA +84SEM +
DMA −
3SEM −
Total
87Total
1127128
85130215
B DMA +52SEM +
DMA −
0SEM −
Total
52Total
07070
52 70122
C
DMA +94SEM +
DMA −
4SEM −
Total
98Total
22386408
116390506
D DMA +84SEM +
DMA −
3SEM −
Total
87Total
1127128
85130215
E DMA +52SEM +
DMA −
0SEM −
Total
52Total
07070
52 70122
F
DMA +94SEM +
DMA −
4SEM −
Total
98Total
22386408
116390506
G DMA +84SEM +
DMA −
3SEM −
Total
87Total
1127128
85130215
H DMA +52SEM +
DMA −
0SEM −
Total
52Total
07070
52 70122
I
DMA +93SEM +
DMA −
5SEM −
Total
98Total
22386408
115391506
J DMA +83SEM +
DMA −
4SEM −
Total
87Total
1127128
84131215
K DMA +52SEM +
DMA −
0SEM −
Total
52Total
07070
52 70122
L
DMA +93SEM +
DMA −
5SEM −
Total
98Total
22386408
115391506
M DMA +83SEM +
DMA −
4SEM −
Total
87Total
1127128
84131215
N DMA +52SEM +
DMA −
0SEM −
Total
52Total
07070
52 70122
O
DMA +91SEM +
DMA −
7SEM −
Total
98Total
22386408
113393506
P DMA +82SEM +
DMA −
5SEM −
Total
87Total
1127128
83132215
Q DMA +52SEM +
DMA −
0SEM −
Total
52Total
07070
52 70122
R
DMA +94SEM +
DMA −
4SEM −
Total
98Total
22386408
116390506
A DMA +84SEM +
DMA −
3SEM −
Total
87Total
1127128
85130215
B DMA +52SEM +
DMA −
0SEM −
Total
52Total
07070
52 70122
C
DMA +94SEM +
DMA −
4SEM −
Total
98Total
22386408
116390506
D DMA +84SEM +
DMA −
3SEM −
Total
87Total
1127128
85130215
E DMA +52SEM +
DMA −
0SEM −
Total
52Total
07070
52 70122
F
DMA +94SEM +
DMA −
4SEM −
Total
98Total
22386408
116390506
G DMA +84SEM +
DMA −
3SEM −
Total
87Total
1127128
85130215
H DMA +52SEM +
DMA −
0SEM −
Total
52Total
07070
52 70122
I
DMA +93SEM +
DMA −
5SEM −
Total
98Total
22386408
115391506
J DMA +83SEM +
DMA −
4SEM −
Total
87Total
1127128
84131215
K DMA +52SEM +
DMA −
0SEM −
Total
52Total
07070
52 70122
L
DMA +93SEM +
DMA −
5SEM −
Total
98Total
22386408
115391506
M DMA +83SEM +
DMA −
4SEM −
Total
87Total
1127128
84131215
N DMA +52SEM +
DMA −
0SEM −
Total
52Total
07070
52 70122
O
DMA +91SEM +
DMA −
7SEM −
Total
98Total
22386408
113393506
P DMA +82SEM +
DMA −
5SEM −
Total
87Total
1127128
83132215
Q DMA +52SEM +
DMA −
0SEM −
Total
52Total
07070
52 70122
R
P SDLOD
2
VAF≥0.2%
Table S4. Contingency tables
VAF≥0.3% VAF≥1%
10-2
10-4
10-6
4
2
2
4
4

Sample ID c description p description VAF (%) Exon Effect Tool Validated
CLL6* c.848_849delGC p.Arg283fs 0.36 Exon 8 frame shift DMA Not testedCLL14 c.613T>A p.Tyr205Asn 0.22 Exon 6 missense SEM Not testedCLL15* c.672+1G>A NA 97.45 Exon 6 splice SEM & DMA Not testedCLL18 c.667C>A p.Pro223Thr 0.21 Exon 6 missense SEM Not testedCLL20* c.667C>A p.Pro223Thr 0.29 Exon 6 missense SEM Not tested
CLL20* c.565G>T p.Ala189Ser 0.27 Exon 6 missense SEM Not testedCLL21* c.832C>T p.Pro278Ser 0.44 Exon 8 missense SEM & DMA ddPCRCLL21* c.667C>A p.Pro223Thr 0.29 Exon 6 missense SEM Not testedCLL21* c.1086C>A p.Ser362Arg 0.26 Exon 10 missense SEM Not testedCLL21* c.565G>T p.Ala189Ser 0.25 Exon 6 missense SEM Not tested
CLL22 c.413C>T p.Ala138Val 5.34 Exon 5 missense SEM & DMA Not testedCLL22 c.395A>G p.Lys132Arg 4.77 Exon 5 missense SEM & DMA ddPCRCLL22 c.767C>G p.Thr256Arg 2.81 Exon 7 missense SEM & DMA Not testedCLL22 c.451C>T p.Pro151Ser 1.63 Exon 5 missense SEM & DMA Not testedCLL22 c.742C>T p.Arg248Trp 1.47 Exon 7 missense SEM & DMA ddPCR
CLL22 c.673-2A>T NA 1.05 Exon 7 splice SEM & DMA Not testedCLL22 c.673-2A>G NA 0.99 Exon 7 splice SEM & DMA Not testedCLL22 c.659A>G p.Tyr220Cys 0.94 Exon 6 missense SEM & DMA ddPCRCLL22 c.701A>G p.Tyr234Cys 0.91 Exon 7 missense SEM & DMA ddPCRCLL22 c.673-2A>C NA 0.87 Exon 7 splice SEM & DMA Not tested
CLL22 c.577C>G p.His193Asp 0.71 Exon 6 missense SEM & DMA Not testedCLL22 c.736A>G p.Met246Val 0.49 Exon 7 missense SEM & DMA Not testedCLL22 c.542G>A p.Arg181His 0.33 Exon 5 missense SEM & DMA Not testedCLL22 c.783-2A>T NA 0.29 Exon 8 splice SEM Not testedCLL22 c.667C>A p.Pro223Thr 0.29 Exon 6 missense SEM Not tested
CLL22 c.1086C>A p.Ser362Arg 0.28 Exon 10 missense SEM Not testedCLL22 c.565G>T p.Ala189Ser 0.28 Exon 6 missense SEM Not testedCLL22 c.560-2A>T NA 0.23 Exon 6 splice SEM & DMA Not testedCLL22 c.404G>T p.Cys135Phe 0.22 Exon 5 missense SEM Not testedCLL22 c.577C>A p.His193Asn 0.20 Exon 6 missense SEM Not tested
CLL22 c.395A>C p.Lys132Thr 0.20 Exon 5 missense SEM Not testedCLL33* c.809T>C p.Phe270Ser 2.55 Exon 8 missense SEM & DMA ddPCRCLL45* c.814G>A p.Val272Met 0.45 Exon 8 missense SEM & DMA ddPCRCLL56* c.82G>T p.Glu28* 0.24 Exon 3 nonsense SEM Not testedCLL65 c.596G>T p.Gly199Val 2.95 Exon 6 missense SEM & DMA ddPCR
CLL65 c.700T>A p.Tyr234Asn 0.41 Exon 7 missense SEM & DMA ddPCRCLL74 c.814G>A p.Val272Met 30.15 Exon 8 missense SEM & DMA ddPCRCLL74 c.239delC p.Pro80fs 10.79 Exon 4 frame shift SEM & DMA Not testedCLL74 c.488A>G p.Tyr163Cys 3.50 Exon 5 missense SEM & DMA ddPCRCLL74 c.332T>C p.Leu111Pro 3.14 Exon 4 missense SEM & DMA Not tested
CLL74 c.743G>A p.Arg248Gln 3.05 Exon 7 missense SEM & DMA Not testedCLL74 c.838A>G p.Arg280Gly 2.24 Exon 8 missense SEM & DMA Not testedCLL74 c.722C>G p.Ser241Cys 2.12 Exon 7 missense SEM & DMA Not testedCLL74 c.524G>A p.Arg175His 1.98 Exon 5 missense SEM & DMA Not testedCLL74 c.920-2A>G NA 1.90 Exon 9 splice SEM & DMA Not tested
CLL74 c.581T>G p.Leu194Arg 1.75 Exon 6 missense SEM & DMA Not testedCLL74 c.993+2T>C NA 1.01 Exon 9 splice SEM & DMA Not testedCLL74 c.818G>A p.Arg273His 0.78 Exon 8 missense SEM & DMA Not testedCLL74 c.338T>G p.Phe113Cys 0.64 Exon 4 missense SEM Not testedCLL74 c.701A>G p.Tyr234Cys 0.52 Exon 7 missense SEM & DMA ddPCR
CLL74 c.659A>G p.Tyr220Cys 0.48 Exon 6 missense SEM & DMA Not testedCLL74 c.830G>A p.Cys277Tyr 0.47 Exon 8 missense SEM & DMA Not testedCLL74 c.272G>A p.Trp91* 0.45 Exon 4 nonsense SEM & DMA Not testedCLL74 c.413C>T p.Ala138Val 0.38 Exon 5 missense SEM & DMA Not testedCLL74 c.536A>G p.His179Arg 0.27 Exon 5 missense SEM & DMA Not tested
CLL74 c.395A>G p.Lys132Arg 0.27 Exon 5 missense SEM & DMA ddPCR

(continued)Sample ID c description p description VAF (%) Exon Effect Tool Validated
CLL74 c.673-2A>T NA 0.21 Exon 7 splice SEM Not testedCLL77* c.844C>G p.Arg282Gly 0.26 Exon 8 missense SEM & DMA Not testedCLL94* c.745A>G p.Arg249Gly 11.06 Exon 7 missense SEM & DMA CaptureCLL98* c.472C>G p.Arg158Gly 6.32 Exon 5 missense SEM & DMA ddPCR & Capture
CLL104* c.742C>T p.Arg248Trp 0.29 Exon 7 missense SEM & DMA ddPCRCLL107* c.388C>T p.Leu130Phe 0.21 Exon 5 missense SEM & DMA Not testedCLL109* c.902delC p.Pro301fs 0.24 Exon 8 frame shift SEM Not testedCLL111* c.823T>C p.Cys275Arg 0.58 Exon 8 missense SEM & DMA Not testedCLL112* c.524G>A p.Arg175His 48.92 Exon 5 missense SEM & DMA Capture
CLL116* c.716A>G p.Asn239Ser 11.86 Exon 7 missense SEM & DMA CaptureCLL120* c.736A>G p.Met246Val 18.24 Exon 7 missense SEM & DMA CaptureCLL120* c.527G>T p.Cys176Phe 0.20 Exon 5 missense SEM & DMA Not testedCLL135* c.610delG p.Glu204fs 77.27 Exon 6 frame shift SEM & DMA CaptureCLL137 c.530C>T p.Pro177Leu 2.25 Exon 5 missense SEM & DMA Not tested
CLL139* c.726C>G p.Cys242Trp 0.66 Exon 7 missense SEM & DMA Not testedCLL144* c.734G>A p.Gly245Asp 79.37 Exon 7 missense SEM & DMA CaptureCLL144* c.536A>T p.His179Leu 1.22 Exon 5 missense SEM & DMA Not validated (Capture)CLL145* c.848_849delGC p.Arg283fs 0.45 Exon 8 frame shift DMA Not testedCLL146* c.848_849delGC p.Arg283fs 0.34 Exon 8 frame shift DMA Not tested
CLL150* c.626_627delGA p.Arg209fs 40.10 Exon 6 frame shift SEM & DMA ddPCR & CaptureCLL161 c.376-1G>A NA 4.50 Exon 5 splice SEM & DMA Not testedCLL165* c.309C>G p.Tyr103* 1.94 Exon 4 nonsense SEM & DMA CaptureCLL177* c.830G>A p.Cys277Tyr 2.19 Exon 8 missense SEM & DMA CaptureCLL179* c.524G>A p.Arg175His 0.45 Exon 5 missense SEM & DMA Not tested
CLL187* c.318C>G p.Ser106Arg 2.87 Exon 4 missense SEM & DMA CaptureCLL191* c.438G>A p.Trp146* 26.41 Exon 5 nonsense SEM & DMA CaptureCLL193 c.439_440insG p.Val147fs 41.24 Exon 5 frame shift SEM & DMA Not testedCLL193 c.733G>A p.Gly245Ser 29.85 Exon 7 missense SEM & DMA Not testedCLL193 c.481G>A p.Ala161Thr 0.29 Exon 5 missense SEM Not tested
CLL193 c.488A>G p.Tyr163Cys 0.23 Exon 5 missense DMA Not testedCLL193 c.128T>A p.Leu43* 0.21 Exon 4 nonsense SEM & DMA Not testedCLL223* c.644G>T p.Ser215Ile 40.75 Exon 6 missense SEM & DMA CaptureCLL223* c.581T>G p.Leu194Arg 13.62 Exon 6 missense SEM & DMA CaptureCLL233* c.772G>A p.Glu258Lys 0.49 Exon 7 missense SEM & DMA Not tested
CLL250* c.572_573insCC p.Gln192fs 0.48 Exon 6 frame shift SEM & DMA Not testedCLL251* c.869G>A p.Arg290His 50.49 Exon 8 missense SEM & DMA CaptureCLL258* c.848G>C p.Arg283Pro 0.27 Exon 8 missense SEM & DMA Not testedCLL261* c.455_456insT p.Pro153fs 0.36 Exon 5 frame shift SEM & DMA Not testedCLL269* c.440T>G p.Val147Gly 33.23 Exon 5 missense SEM & DMA Capture
CLL275* c.524G>A p.Arg175His 3.02 Exon 5 missense SEM & DMA Not testedCLL288* c.581T>G p.Leu194Arg 59.85 Exon 6 missense SEM & DMA CaptureCLL294* c.577C>T p.His193Tyr 27.33 Exon 6 missense SEM & DMA CaptureCLL299* c.388C>T p.Leu130Phe 0.94 Exon 5 missense SEM & DMA Not testedCLL302* c.314G>A p.Gly105Asp 0.31 Exon 4 missense SEM & DMA Not tested
CLL310* c.482C>A p.Ala161Asp 20.83 Exon 5 missense SEM & DMA CaptureCLL310* c.626_627delGA p.Arg209fs 13.80 Exon 6 frame shift SEM & DMA ddPCR & CaptureCLL325* c.737T>G p.Met246Arg 8.84 Exon 7 missense SEM & DMA CaptureCLL327* c.830G>T p.Cys277Phe 3.92 Exon 8 missense SEM & DMA CaptureCLL328 c.469G>T p.Val157Phe 79.62 Exon 5 missense SEM & DMA Not tested
CLL328 c.764delT p.Ile255fs 0.43 Exon 7 frame shift SEM & DMA Not testedCLL328 c.529C>A p.Pro177Thr 0.42 Exon 5 missense SEM & DMA Not testedCLL328 c.645T>G p.Ser215Arg 0.37 Exon 6 missense SEM & DMA Not testedCLL328 c.993+1G>A NA 0.30 Exon 9 splice SEM & DMA Not testedCLL342* c.626_627delGA p.Arg209fs 1.60 Exon 6 frame shift SEM & DMA ddPCR & Capture
CLL342* c.722C>T p.Ser241Phe 0.42 Exon 7 missense SEM & DMA Not testedCLL346* c.742C>G p.Arg248Gly 2.94 Exon 7 missense SEM & DMA Not validated (Capture)
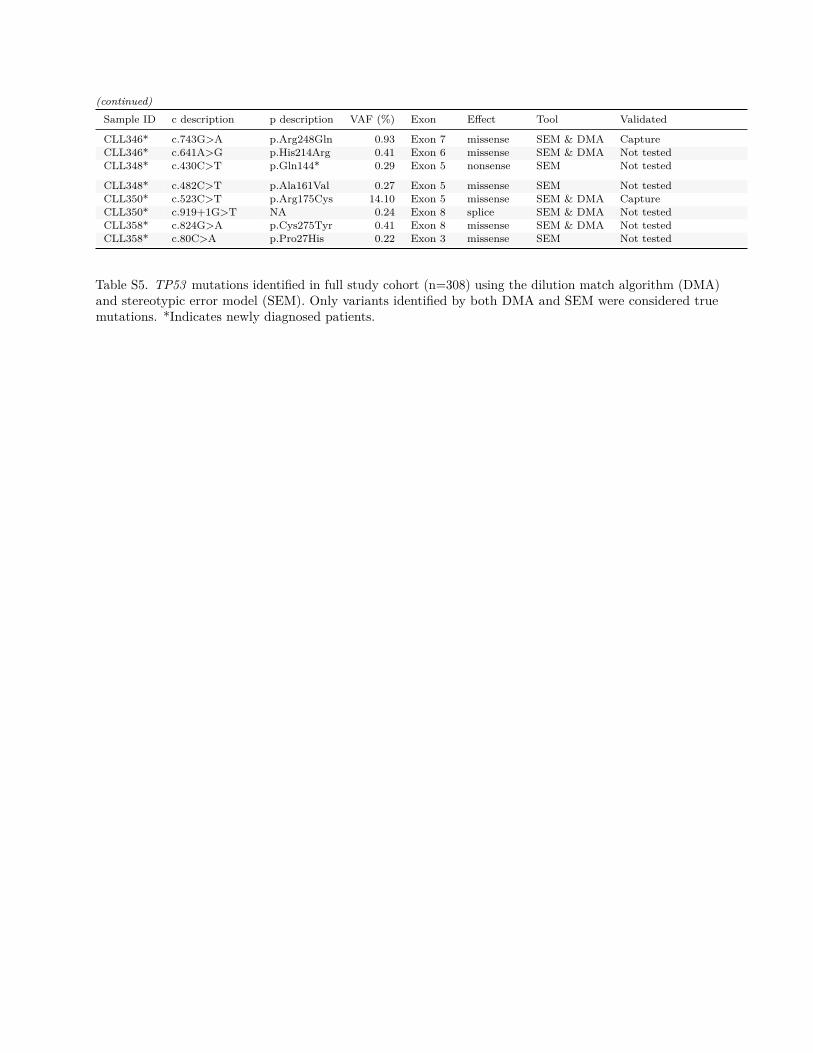
(continued)Sample ID c description p description VAF (%) Exon Effect Tool Validated
CLL346* c.743G>A p.Arg248Gln 0.93 Exon 7 missense SEM & DMA CaptureCLL346* c.641A>G p.His214Arg 0.41 Exon 6 missense SEM & DMA Not testedCLL348* c.430C>T p.Gln144* 0.29 Exon 5 nonsense SEM Not tested
CLL348* c.482C>T p.Ala161Val 0.27 Exon 5 missense SEM Not testedCLL350* c.523C>T p.Arg175Cys 14.10 Exon 5 missense SEM & DMA CaptureCLL350* c.919+1G>T NA 0.24 Exon 8 splice SEM & DMA Not testedCLL358* c.824G>A p.Cys275Tyr 0.41 Exon 8 missense SEM & DMA Not testedCLL358* c.80C>A p.Pro27His 0.22 Exon 3 missense SEM Not tested
Table S5. TP53 mutations identified in full study cohort (n=308) using the dilution match algorithm (DMA)and stereotypic error model (SEM). Only variants identified by both DMA and SEM were considered truemutations. *Indicates newly diagnosed patients.

Sample ID Assay VAF by ddPCR (%) VAF by NGS (%) H20 Control (%) Cohort
CLL21 P278S 0.33 0.44 0.00 Newly diagnosedCLL33 F270S 2.34 2.55 0.00 Newly diagnosedCLL45 V272M 0.23 0.45 0.00 Newly diagnosedCLL98 R158G 6.63 6.32 0.00 Newly diagnosedCLL104 R248W 0.46 0.29 0.00 Newly diagnosed
CLL150 R209Kfs*6 40.94 40.10 0.00 Newly diagnosedCLL148 R209Kfs*6 0.22 0.15 0.00 Newly diagnosedCLL310 R209Kfs*6 14.38 13.80 0.00 Newly diagnosedCLL315 R209Kfs*6 0.08 0.13 0.00 Newly diagnosedCLL342 R209Kfs*6 1.67 1.60 0.00 Newly diagnosed
CLL22 Y220C 0.90 0.94 0.00 At time of treatmentCLL22 K132R 6.22 4.77 0.00 At time of treatmentCLL22 R248W 1.36 1.47 0.00 At time of treatmentCLL22 Y234C 1.01 0.91 0.00 At time of treatmentCLL65 G199V 3.26 2.95 0.00 At time of treatment
CLL65 Y234N 0.37 0.41 0.00 At time of treatmentCLL74 Y163C 3.28 3.50 0.00 At time of treatmentCLL74 V272M 32.32 30.15 0.06 At time of treatmentCLL74 Y234C 0.48 0.52 0.00 At time of treatmentCLL74 K132R 0.40 0.27 0.00 At time of treatment
CLL193 Y163C 0.14 0.23 0.00 At time of treatmentCLL4 Q331* 5.41 4.90 0.00 Non-diagnostic, not treatedCLL4 R209Kfs*6 2.07 1.82 0.00 Non-diagnostic, not treatedCLL10 P316Sfs*21 0.23 0.20 0.00 Non-diagnostic, not treatedCLL26 C135F 4.48 4.20 0.00 Non-diagnostic, not treated
CLL40 Y163C 0.45 0.53 0.00 Non-diagnostic, not treatedCLL40 K132R 0.39 0.35 0.00 Non-diagnostic, not treatedCLL40 R248W 0.32 0.29 0.00 Non-diagnostic, not treatedCLL40 Y234C 1.46 1.20 0.00 Non-diagnostic, not treatedCLL67 I195T 0.35 0.36 0.00 Non-diagnostic, not treated
CLL134 R248W 1.36 0.90 0.00 Non-diagnostic, not treatedCLL134 I195T 0.67 0.45 0.00 Non-diagnostic, not treatedCLL134 Y234C 0.43 0.34 0.00 Non-diagnostic, not treatedCLL186 R248W 0.41 0.44 0.00 Non-diagnostic, not treatedCLL186 Y234C 2.54 2.61 0.00 Non-diagnostic, not treated
Table S6. Droplet digital PCR (ddPCR) probes for initial TP53 findings validated all 33 tested mutationsabove the threshold of 0.2% VAF. Two mutations below the VAF threshold of 0.2% were also validated, butnot included in the final report. Note that 14 mutations in 7 non-diagnostic patients not sampled before 200days of treatment were also tested and validated.

A) Patient characteristics according to TP53 mutational status in newly diagnosed patients
TP53wt (N=249) TP53 mutated (N=41)
Variable VAF<1%, N (%) VAF 1-10%, N (%) VAF>10%, N (%)
Age <65 years 111 (44.6) 2 (13.3) 2 (20.0) 5 (31.2)>65 years 138 (55.4) 13 (86.7) 8 (80.0) 11 (68.8)
Binet A 203 (85.7) 12 (92.3) 8 (88.9) 9 (60.0)B/C 34 (14.3) 1 (7.7) 1 (11.1) 6 (40.0)
Unknown 12 2 1 1
B2M <4.0 mg/L 184 (87.6) 12 (100.0) 7 (77.8) 10 (66.7)>4.0 mg/L 26 (12.4) 0 (0.0) 2 (22.2) 5 (33.3)
Unknown 39 3 1 1IGHV Mutated 170 (69.1) 12 (80.0) 4 (44.4) 9 (56.2)
Unmutated 76 (30.9) 3 (20.0) 5 (55.6) 7 (43.8)
Inconclusive 3 0 1 0FISH No del(17p) 248 (99.6) 15 (100.0) 10 (100.0) 10 (62.5)
Del(17p) 1 (0.4) 0 (0.0) 0 (0.0) 6 (37.5)
B) Patient characteristics according to IGHV mutational status in newly diagnosed patients
IGHV mutational status (N=290)
Variable Mutated, N (%) Unmutated, N (%) Inconclusive, N (%)
Age >65 years 74 (38.5) 43 (47.8) 3 (37.5)<65 years 118 (61.5) 47 (52.2) 5 (62.5)
Binet A 166 (91.2) 59 (70.2) 7 (87.5)B/C 16 (8.8) 25 (29.8) 1 (12.5)
Unknown 10 6 0
B2M <4.0 mg/L 148 (89.7) 58 (78.4) 7 (100.0)>4.0 mg/L 17 (10.3) 16 (21.6) 0 (0.0)
Unknown 27 16 1TP53 status TP53wt 166 (86.5) 75 (83.3) 7 (87.5)
TP53mut <1% 12 (6.2) 3 (3.3) 0 (0.0)
TP53mut 1-10% 4 (2.1) 5 (5.6) 1 (12.5)TP53mut >10% 6 (3.1) 4 (4.4) 0 (0.0)
Del(17p) 4 (2.1) 3 (3.3) 0 (0.0)
Table S7. Patient characteristics in newly diagnosed patients stratified according to TP53 (A) and IGHVmutational status (B). TP53 wild-type (TP53wt), TP53 mutation without del(17p) (TP53mut), del(17p)regardless of TP53 mutational status (Del(17p)), beta-2-microglobulin (B2M), fluorescent in situ hybridization(FISH).

A) Patient characteristics according to TP53 mutational status at time of treatment
TP53wt (N=44) TP53 mutated (N=17)
Variable VAF<1%, N (%) VAF 1-10%, N (%) VAF>10%, N (%)
Age <65 years 27 (61.4) 1 (25.0) 3 (50.0) 4 (57.1)>65 years 17 (38.6) 3 (75.0) 3 (50.0) 3 (42.9)
Binet A 13 (29.5) 3 (75.0) 2 (33.3) 2 (28.6)B/C 31 (70.5) 1 (25.0) 4 (66.7) 5 (71.4)
B2M <4.0 mg/L 21 (77.8) 4 (100.0) 1 (50.0) 1 (25.0)
>4.0 mg/L 6 (22.2) 0 (0.0) 1 (50.0) 3 (75.0)Unknown 17 0 4 3
IGHV Mutated 15 (36.6) 1 (25.0) 1 (20.0) 0 (0.0)Unmutated 26 (63.4) 3 (75.0) 4 (80.0) 7 (100.0)
Inconclusive 3 0 1 0
FISH No del(17p) 43 (97.7) 4 (100.0) 5 (83.3) 3 (42.9)Del(17p) 1 (2.3) 0 (0.0) 1 (16.7) 4 (57.1)
B) Patient characteristics according to IGHV mutational status at time of treatment
IGHV mutational status (N = 61)
Variable Mutated, N (%) Unmutated, N (%) Inconclusive, N (%)
Age >65 years 8 (44.4) 27 (64.3) 4 (66.7)<65 years 10 (55.6) 15 (35.7) 2 (33.3)
Binet A 6 (37.5) 13 (37.1) 3 (60.0)B/C 10 (62.5) 22 (62.9) 2 (40.0)
Unknown 2 7 1
B2M <4.0 mg/L 9 (75.0) 16 (69.6) 2 (100.0)>4.0 mg/L 3 (25.0) 7 (30.4) 0 (0.0)
Unknown 6 19 4TP53 status TP53wt 16 (88.9) 25 (59.5) 4 (66.7)
TP53mut <1% 1 (5.6) 3 (7.1) 0 (0.0)
TP53mut 1-10% 1 (5.6) 5 (11.9) 1 (16.7)TP53mut >10% 0 (0.0) 3 (7.1) 0 (0.0)
Del(17p) 0 (0.0) 6 (14.3) 1 (16.7)
Table S8. Patient characteristics at time of treatment stratified according to TP53 (A) and IGHV mutationalstatus (B). TP53 wild-type (TP53wt), TP53 mutation without del(17p) (TP53mut), del(17p) regardless ofTP53 mutational status (Del(17p)), beta-2-microglobulin (B2M), fluorescent in situ hybridization (FISH).
9
Supplemental figure legends
Figure S1. Consort diagram of patients included in the study. Newly diagnosed patients and
patients sampled at time of treatment were collected within 200 days of a diagnostic flow cytometry
and up to 200 days before treatment, respectively.
Figure S2. Establishing the limit of detection and range of dilution grade. (A) By serial 10-fold
dilutions of four Sanger validated TP53 mutations, all four mutations could be detected down to an
adjusted variant allele frequency (VAF) of 0.016% (unadjusted 0.023% VAF). Variants were not
detected at the lowest dilution level in two samples expected to fall below a VAF of 0.01%. A
previously unknown low burden mutation was also identified (CLL617 g.17:7578394 T>A). (B) To
test the range of the dilution step and indel detection capability, four Sanger validated TP53 indels
were initially diluted to low burden levels (1:10) and subsequently diluted 1:3 and 1:10.
Figure S3. Determining a dilution match. (A) Scatter plot of dilution grades (DGs) and adjusted
dilution ratios (aDRs) for variants identified in both undiluted and diluted samples from the same
patient. The DGs and aDRs were expected to match a line with a slope of one (solid line), however
a cluster of aDRs with distances from a slope of one (DFSO) above 0.5 (thin line) was also
identified. Notice the distribution of DGs in tilted box plot (top). (B) Histogram of DFSO for all
variants identified in both undiluted and diluted samples from the same patient. The 99.9%
reference range (striped lines) for variants with a DFSO less than 0.5 (solid line) determined a
dilution match in which variants were considered true mutations. The threshold was trimmed to an
absolute DFSO of 0.16 (dotted lines) based on the 99.9% reference range.
Figure S4. Modeling stereotypic errors. (A) The distribution of single nucleotide variants (SNV)
showed enrichment of errors for C:G>A:T as well as C:G deletions. (B) For each position specific
nucleotide change (e.g. g.17:7578406C>T) called 20 times or more, the distribution of variant allele
frequencies (VAF) could be modeled to fit gamma distributions (red curve). (C) SNVs with less
than 20 position specific occurrences showed a more even distribution of A, T, C, and G with very
few deletions left to model. (D) Regardless of the genomic position, low occurring position specific
variants (<20) were pooled according to their unique nucleotide change (e.g. A>G) and VAFs were
modeled using best fitted gamma distribution. Variants above the overall (red line) and modeled
limits of detection (striped red line) were called as true mutations.
Figure S5. Limit of detection for stereotypic error model. Multiple boxplot exemplifying the
stereotypic error modeling (SEM). (A) Displaying only the first 100 bp 5’ of TP53 exon 4, the limits
of detection (LODs) for position specific nucleotide change allowed variant calls at various
thresholds (dotted line) according to the hg19 position and nucleotide change. Variants below
Bonferroni corrected LODs (horizontal bars) and overall LOD (i.e. VAF <0.2%) were excluded
(open circle), while variants above both modeled and overall LODs were called as true mutations
(solid circle). Outliers above the modeled LODs but below the overall LOD indicated (open
triangle). (B) For unique nucleotide changes (only SNVs are shown), box plots demonstrate that all
modeled LODs (horizontal bar) are below the overall LOD (red line).
Figure S6. Schematic workflow of bioinformatic pipeline. The combined variant call format
(VCF) files from a low frequency detection tool and a basic detection tool in CLC Genomics
Workbench (Qiagen) was analyzed in R using both a dilution match algorithm (DMA) and a

10
stereotypic error model (SEM). For DMA, the number of total variants is indicated (N), while the
number of unique variants (N) and number of unique variants modeled (n) is indicated for SEM.
Variants were further cross referenced in the IARC TP53 database. Only true positive mutations
from DMA and SEM were included in the final call.
Figure S7. Stereotypic error distribution of problematic variants. (A) g.17:7577090C>T
(p.Arg283His) showed a distribution with a wide right tail. Stereotypic error modeling (SEM)
identified 45 false positive mutations for this variant between 0.2-0.65% VAF. (B) At the same
position, g.17:7577089_7577090GC>- (p.Arg283fs*22) was called in three patients using the
dilution match algorithm (DMA), but excluded using SEM. (C) With only 24 observations, SEM
excluded a ddPCR validated g.17:7578442T>C (p.Tyr163Cys) with VAF of 0.23% (red arrow) that
was called by the dilution match algorithm (DMA). (D) g.17:77579837A>C (c.74+2T>G) splicing
site mutation shows a multimodal distribution unfit for modeling. This variant was called by CLC in
116 undiluted samples with a VAF up to 1.7% but was excluded by both DMA and SEM. Best fitted
gamma distribution (red curves), modeled position specific limit of detection (LOD; dotted red line),
and overall LOD of 0.2% VAF (red line).
Figure S8. Subanalysis of overall and treatment-free survival in newly diagnosed patients.
Kaplan Meier curves comparing (A-B) overall (OS) and (C-D) treatment-free survival (TFS) based
on TP53 status. Patients with TP53mut 1-10% VAF and TP53ab >10% VAF shown separately (A,
C). Patients with TP53mut 1-10% VAF and TP53mut >10% VAF shown separately (B, D).
Significant difference in TFS between TP53ab >10% VAF and TP53 wild-type (TP53wt) was
demonstrated. P-values indicated in tables.

Figure S1.
446pa&entsreferredtoins&tu&on
427pa&entsreferredforIGHVanalysis
292newlydiagnosedpa&ents
290newlydiagnosedpa&ents
19neverreferredforIGHVanalysis
25pa&entswithinsufficientmaterial
61pa&entssampledat&meoftreatment
2pa&entswithlowcoverage(mean<1000x)
18pa&entstreatedwithin200
daysincl.7at1stlinetreatment
92pa&entssampledaFeror>200daysof
treament
Exclusion
317newlydiagnosedpa&ents
43treatedwithin200days
(2w/17p-)
110pa&entssampled>200days
fromdiagnosis
Sequenced
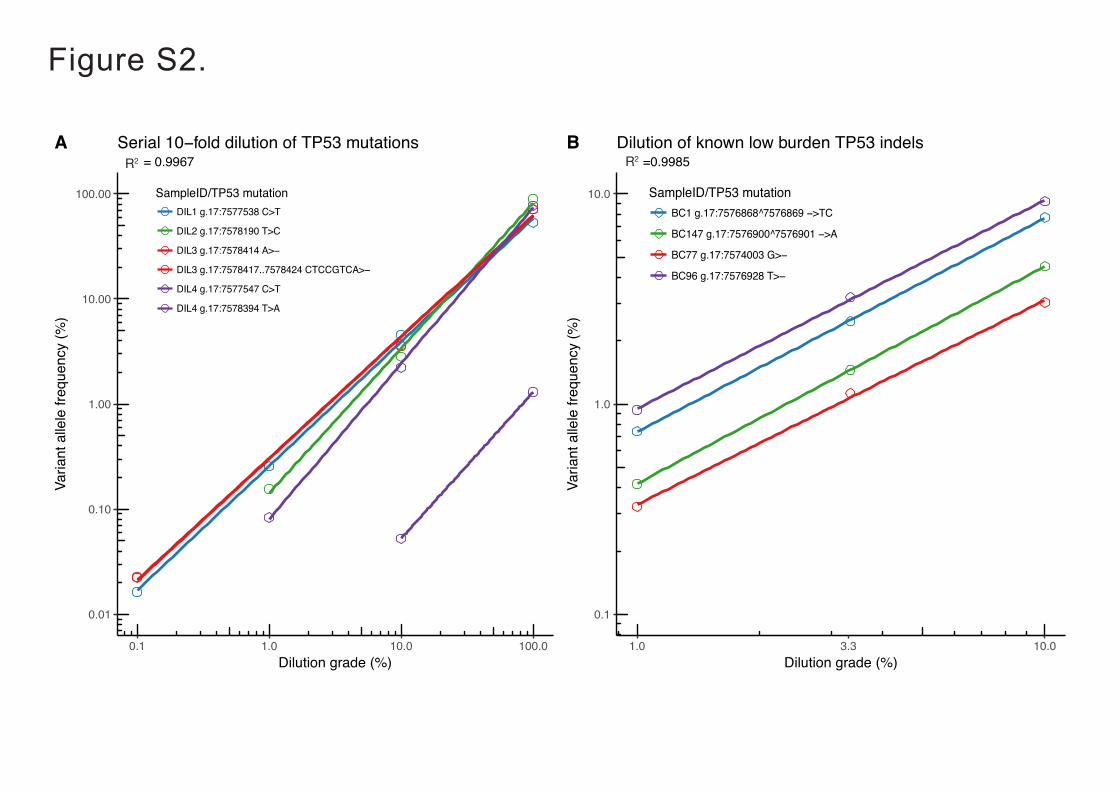
0.01
0.10
1.00
10.00
100.00
0.1 1.0 10.0 100.0Dilution grade (%)
Varia
nt a
llele
freq
uenc
y (%
)
R^2 = 0.9967Serial 10−fold dilution of TP53 mutationsA
0.1
1.0
10.0
1.0 3.3 10.0Dilution grade (%)
Varia
nt a
llele
freq
uenc
y (%
)
R^2 =0.9985Dilution of known low burden TP53 indelsB
Figure S2.
0.01
0.10
1.00
10.00
100.00
0.1 1.0 10.0 100.0Dilution grade (%)
Varia
nt a
llele
freq
uenc
y (%
)
SampleID/TP53 mutationDIL1 g.17:7577538 C>T
DIL2 g.17:7578190 T>C
DIL3 g.17:7578414 A>−
DIL3 g.17:7578417..7578424 CTCCGTCA>−
DIL4 g.17:7577547 C>T
DIL4 g.17:7578394 T>A
R^2 = 0.9967Serial 10−fold dilution of TP53 mutationsA
0.1
1.0
10.0
1.0 3.3 10.0Dilution grade (%)
Varia
nt a
llele
freq
uenc
y (%
)
SampleID/TP53 mutationBC1 g.17:7576868^7576869 −>TC
BC147 g.17:7576900^7576901 −>A
BC77 g.17:7574003 G>−
BC96 g.17:7576928 T>−
R^2 =0.9985Dilution of known low burden TP53 indelsB
R2R2

Figure S3.
0.00
0.25
0.50
0.75
1.00
1.25
0.0 0.2 0.4 0.6DG
aDR
Distribution of dilution grades and adjusted dilution ratios forvariants in both undiluted and diluted sample from the same patient
A
0
25
50
75
100
−0.25 0.00 0.25 0.50 0.75 1.00Distance from slope of one (DFSO = DG − aDR)
Obs
erve
d co
unt
Determing the threshold for correct dilution using the distance from a line with slope of oneDistance from slope of oneB
0.00
0.25
0.50
0.75
1.00
1.25
0.0 0.2 0.4 0.6DG
aDR
0.00
0.25
0.50
0.75
1.00DFOtype
VAF<1%
1−10%
>10%
Distribution of dilution grades and adjusted dilution ratios forvariants in both undiluted and diluted sample from the same patient

Figure S4.
0
20000
40000
60000
80000
A T C GNucleotide reference
Obs
erve
d (n
)
Nucleotidechange
>A
>T
>C
>G
>−
Distribution of SNV modeled for position specific nucleotide changeA
0
10
20
30
40
0.00 0.25 0.50 0.75 1.00VAF (%)
Obs
erve
d (n
)
Position specific nucleotide change for g.7578518C>T (hg19)Stereotypic error distribution and fitted gamma distribution B
0
500
1000
1500
A T C GNucleotide reference
Obs
erve
d (n
)
Nucleotidechange
>A
>T
>C
>G
>−
Distribution of SNV modeled for specific nucleotide changeC
0
10
20
30
0.00 0.25 0.50 0.75 1.00VAF (%)
Obs
erve
d (n
)Unique nucleotide change for G>AStereotypic error distribution and fitted gamma distributionD

Figure S5.
——
—
—
——
——
—
—
—
—
—
— —
——
—
—
—
—
—
—
——
—
—
—
—
——
——
—
—
—
—
—
——
——
—
—
—
——
—
—
— ——
——
—
—
—
—
—
——
——
—
—
—
—
——
——
—
—
—
——
——
—
—
—
—
—
——
——
—
—
—
——
—
——
—
—
—
—
—
——
——
—
—
—
—
——
——
——
—
—
—
—
—
—
——
—
—
—
——
——
—
—
—
——
—
——
—
—
—
—
——
—
—
— —
—
——
—
—
—
—
—
—
——
—
—
—
—
——
——
—
—
—
—
——
——
—
—
—
——
—
—
——
——
—
—
—
——
—
—
—
—
——
—
—
——
——
—
—
—
—
—
—
——
—
—
—
——
——
—
—
—
—
——
—
—
—
—
— —
—
—
——
——
—
—
—
—
——
—
—
—
——
——
—
——
—
——
——
—
—
—
—
——
—
—
—
—
——
—
—
—
—
—
—
——
——
—
—
—
—
——
—
—
—
——
—
—
—
—
—
——
—
—
—
——
——
—
—
—
——
——
—
—
—
—
——
—
—
——
——
—
—
— ——
—
——
—
—
——
——
— —
—
—
—
—
——
—
—
—
—
——
——
—
—
—
——
——
—
—
—
—
——
—
—
—
— ——
——
—
—
—
—
—
—
——
——
—
—
—
——
—
——
—
—
—
—
——
——
— —
—
—
—
—
——
——
—
—
—
——
——
—
—
—
——
—
—
—
——
—
——
—
—
—
—
——
—
—
——
——
—
—
—
—
——
—
—
—
—
——
—
—
——
—
——
—
—
—
——
—
——
—
——
——
—
—
—
—
——
— —
—
—
——
——
—
—
——
——
—
—
——
—
——
—
—
—
—
—
——
—
—
—
—
——
—
—
—
——
—
—
—
—
—
——
——
—
—
—
—
——
——
—
—
——
——
—
—
—
——
——
—
—
—
—
——
—
—
—
—
——
——
—
—
—
—
——
—
——
—
—
—
—
——
—
—
——
——
—
—
—
——
——
—
—
—
——
——
—
—
—
—
——
—
—
—
—
——
—
—
—
—
——
—
——
—
—
—
—
——
——
—
—
—
——
——
—
—
——
—
——
—
—
—
——
——
—
——
—
——
——
—
—
——
——
—
—
——
——
—
—
—
——
——
—
—
—
——
—
——
—
—
—
—
——
—
—
——
——
—
—
—
—
—
——
—
—
—
——
—
—
—
—
——
——
—
—
—
—
——
—
—
——
——
—
—
—
—
—
—
—
—
——
—
—
—
—
——
——
—
—
—
—
—
——
—
——
— —
—
——
—
——
—
——
—
—
—
——
—
——
—
—
—
——
——
———
—
—
—
—
——
——
—
—
—
——
— —
—
—
—
— —
—
—
——
——
—
—
——
—
— —
——
——
—
——
—
——
—
——
—
—
——
—
—
——
—
—
—
——
——
—
—
—
——
——
—
—
—
—
——
——
—
—
—
— ——
—
——
—
—
—
——
——
—
—
——
——
—
—
—
——
——
—
—
——
——
—
—
—
—
— —
——
——
—
—
——
——
—
—
—
——
——
—
—
—
——
——
—
—
—
—
——
——
—
—
—
——
——
—
—
——
——
—
—
—
—
——
——
—
—
—
—
——
——
—
—
—
——
——
—
—
—
—
—
——
—
——
—
—
——
——
—
—
—
—
——
—
——
—
—
—
——
—
——
—
—
—
—
—
——
—
—
—
——
—
——
—
—
—
——
—
——
—
—
—
——
——
—
—
—
——
—
——
—
—
——
——
—
—
——
——
—
—
—
——
——
—
—
—
——
——
—
—
—
—
—
——
—
—
—
—
—
—
——
—
—
——
——
—
———
—
—
—
—
—
—
——
—
—
—
—
—
—
——
—
—
—
—
—
——
——
—
—
—
——
—
—
—
—
——
—
—
—
—
—
—
——
—
—
—
——
——
—
—
——
——
—
—
—
——
——
—
—
—
——
——
—
—
—
——
—
—
——
——
—
—
—
—
———
——
—
—
—
——
—
—
—
—
——
—
—
———
—
—
——
——
—
—
—
——
—
—
—
—
——
—
—
—
——
——
—
———
—
—
—
—
——
—
—
—
——
—
—
——
——
—
—
—
——
—
—
———
—
—
—
—
——
—
—
—
—
——
—
—
—
—
—
——
—
—
—
—
——
—
—
—
——
——
—
———
—
—
—
—
——
—
—
—
——
—
—
—
——
——
—
—
——
——
—
—
—
——
——
—
———
—
—
—
—
——
—
—
—
—
——
——
—
—
—
——
——
—
——
—
——
——
—
—
—
——
—
—
—
——
——
— —
—
—
—
——
—
—
—
—
——
—
——
—
——
——
—
—
—
—
——
—
—
—
——
—
——
—
—
—
——
—
——
—
—
—
—
——
—
—
——
——
—
—
——
——
—
—
—
—
—
——
—
—
—
——
—
—
—
——
—
——
—
—
——
——
—
—
—
—
——
——
—
—
—
—
—
——
—
—
—
——
——
— —
—
——
—
——
——
—
———
—
—
—
—
—
——
——
—
—
——
——
—
—
—
———
—
—
—
——
—
—
—
—
—
——
—
—
—
——
——
—
—
—
—
—
——
—
—
—
—
—
———
—
—
—
——
—
——
—
—
—
——
——
—
—
—
—
——
—
—
—
—
——
—
—
—
——
—
—
—
——
——
—
—
—
——
—
——
—
——
——
—
—
—
——
—
—
—
—
———
—
—
—
——
—
—
—
——
—
—
—
——
——
—
—
——
——
—
—
—
——
—
—
——
——
—
—
—
——
—
—
—
——
—
—
—
——
—
—
—
——
—
—
—
—
—— —
——
—
—
—
—
——
——
—
—
—
—
——
—
—
——
——
—
—
———
—
—
—
——
——
—
—
—
——
—
—
—
——
—
—
— ——
—
——
—
—
—
——
—
—
—
—
——
—
—
———
—
—
—
——
—
—
—
——
—
——
—
—
——
——
—
—
—
—
——
—
—
—
——
——
—
—
——
——
—
—
—
——
—
—
—
——
—
—
—
—
—
——
—
—
—
——
—
—
—
——
—
—
—
—
—
—
——
—
—
—
——
—
—
—
—
——
—
—
———
—
—
—
——
—
—
—
——
—
—
—
——
——
—
—
—
——
——
—
—
—
—
——
—
—
—
—
—
—
——
—
—
—
—
——
—
—
—
——
—
—
——
—
———
—
—
—
——
—
—
———
—
—
—
——
—
—
——
——
—
———
—
—
—
——
——
—
———
—
—
—
—
——
—
—
—
—
——
—
—
—
—
—
——
—
—
——
——
—
—
—
—
——
—
—
—
—
——
——
—
—
—
——
—
—
—
—
——
——
—
—
—
——
—
—
——
—
——
—
—
——
—
——
—
—
—
——
——
—
—
—
—
——
—
—
—
—
——
—
—
—
——
—
—
—
——
——
—
—
——
——
—
—
——
——
—
—
—
—
——
—
—
—
——
—
—
— ——
——
—
—
—
——
—
——
—
—
—
—
—
——
—
——
—
—
—
— —
——
—
—
—
——
—
——
—
—
—
—
—
—
——
——
—
—
—
—
—
——
—
—
—
—
——
—
—
—
——
—
—
———
—
—
—
——
——
—
—
—
——
—
—
—
——
— —
—
—
— ——
——
—
—
—
——
——
—
—
—
——
—
—
——
——
—
—
—
—
—
—
——
—
—
—
——
—
——
—
—
—
—
——
—
—
——
——
—
—
—
—
——
—
—
—
—
——
——
—
——
—
—
——
—
—
—
—
——
—
—
—
——
——
—
—
—
— ——
——
—
—
—
——
——
—
—
—
—
— ——
——
—
—
——
——
—
——
—
—
——
—
—
—
—
—
——
——
—
—
—
—
——
—
—
——
——
—
—
—
—
—
——
——
—
—
—
——
——
—
—
——
—
—
—
—
——
—
—
—
——
——
—
—
——
——
—
—
——
——
—
—
—
——
—
—
—
—
——
—
—
—
— —
—
——
——
—
—
—
—
——
——
—
—
—
——
—
—
—
——
——
—
—
——
——
——
—
—
—
—
——
——
—
—
—
——
—
——
— —
—
—
—
— ——
——
—
—
—
—
—
——
——
—
—
—
—
—
—
——
——
—
—
—
—
—
——
—
—
—
—
—
——
—
——
—
—
——
—
——
—
—
—
—
——
——
— —
—
—
—
—
——
—
—
—
——
——
—
—
—
—
—
——
——
—
—
—
—
—
—
——
——
—
—
—
——
——
—
—
— ——
——
—
—
—
——
—
—
——
——
—
—
—
—
—
——
—
—
——
——
—
—
—
——
——
—
—
—
—
—
—
——
—
—
—
—
——
——
——
—
—
—
—
—
—
——
—
—
——
——
—
—
—
—
—
—
——
—
—
—
—
—
——
——
—
—
—
—
—
——
——
—
—
—
—
——
—
—
—
——
——
—
—
———
—
—
— —
——
—
—
— ——
——
—
—
—
—
—
——
—
—
—
——
——
—
—
—
——
—
—
——
—
——
——
—
—
—
——
——
—
—
—
——
—
——
—
—
—
—
—
——
—
—
—
—
—
— —
——
——
—
—
—
——
——
—
—
—
—
——
—
——
—
——
——
—
—
—
—
—
—
——
—
—
—
—
——
—
—
—
—
—
——
—
—
—
—
—
——
— —
—
—
—
——
——
—
—
——
—
— —
——
—
—
—
—
——
——
—
—
—
——
—
——
——
—
—
—
—
——
——
—
—
—
——
——
—
—
—
——
——
—
—
—
——
——
—
—
—
——
—
——
—
—
——
——
—
—
—
—
—
—
——
——
—
—
—
—
——
—
—
—
—
——
——
—
—
—
—
——
——
—
—
—
—
—
— —
——
—
—
—
—
——
——
—
—
—
—
——
——
—
—
—
——
—
—
—
—
——
——
—
—
—
—
——
——
—
—
—
—
—
——
——
—
—
—
——
—
——
—
—
——
—
—
—
——
—
—
—
—
——
—
—
—
—
— —
—
—
——
—
—
—
—
——
—
—
——
—
—
——
—
—
—
—
—
——
——
—
—
—
——
—
—
——
——
—
—
——
——
—
—
—
—
——
—
—
——
—
——
——
—
—
—
—
——
——
—
—
—
—
——
——
—
—
—
——
—
—
—
——
——
—
—
—
—
—
——
—
—
—
——
—
—
—
— —
——
—
—
——
——
—
—
——
——
—
——
—
—
——
—
—
——
——
—
—
— ——
——
—
—
—
—
——
—
—
—
——
——
—
—
—
—
——
—
—
—
——
—
—
—
—
——
—
—
—
—
——
—
—
—
——
—
——
—
—
—
——
—
—
—
——
—
—
—
——
——
—
—
——
——
—
—
—
—
——
——
—
—
—
——
——
—
—
—
——
—
—
—
——
—
—
—
——
—
—
—
—
——
—
—
—
——
——
—
—
—
—
——
——
—
—
—
——
——
—
—
——
——
—
—
—
—
——
—
——
—
—
——
—
—
——
——
—
—
—
——
—
—
—
——
—
—
——
——
—
—
—
——
——
—
—
—
—
——
—
—
—
——
——
—
—
—
—
——
——
—
—
—
—
——
——
—
—
—
—
—
—
—
——
—
—
—
——
—
—
—
—
——
—
—
—
———
—
—
——
——
—
—
—
—
—
——
—
—
—
—
—
——
—
—
—
——
——
—
——
—
——
——
—
——
—
——
——
—
—
—
——
—
——
—
—
—
—
——
—
——
—
——
—
——
——
—
—
—
—
——
—
—
——
——
—
—
—
—
—
——
——
—
—
—
——
—
—
—
—
——
—
—
——
——
—
—
—
——
— —
—
—
—
——
—
—
—
—
—
—
——
— —
—
—
—
——
—
—
— —
—
——
—
—
—
—
—
——
—
—
—
——
——
—
—
—
—
——
—
—
—
—
—
—
——
—
—
—
—
——
—
——
—
——
——
—
—
—
—
——
— —
—
—
—
——
—
—
—
—
—
—
— —
——
—
—
—
—
——
—
—
—
—
——
—
—
— —
——
——
— —
—
—
—
—
—
——
—
—
—
—
—
——
— —
—
—
—
——
—
—
—
—
——
—
———
—
—
———
—
—
—
——
——
—
—
—
—
——
—
—
——
——
—
—
——
——
—
—
—
—
——
—
—
—
—
—
——
—
—
—
——
—
—
—
—
——
—
—
——
——
—
—
—
——
——
—
—
—
—
——
—
—
—
—
—
—
—
——
—
—
—
—
—
——
—
—
—
—
—
——
—
—
— —
——
——
—
—
—
——
—
——
—
—
—
——
—
—
——
——
—
—
—
——
——
—
—
—
—
—
——
—
—
—
——
——
—
—
—
—
——
—
—
—
—
—
——
—
——
—
—
—
—
—
——
—
—
——
——
—
—
—
——
——
—
—
—
——
—
—
—
——
—
—
—
—
—
——
—
—
—
——
——
—
—
—
—
—
——
—
—
—
—
——
—
—
——
—
——
—
—
——
—
—
—
—
——
—
—
—
——
—
—
——
——
—
—
—
—
—
—
——
—
—
—
—
——
—
—
—
—
—
—— —
——
—
—
—
— —
—
—
——
—
—
——
——
—
—
——
——
—
—
——
——
—
—
—
—
——
——
—
—
—
——
——
—
—
—
—
——
——
—
—
—
—
—
—
——
—
—
——
—
——
—
—
—
—
—
—
——
—
—
—
——
—
—
—
—
——
——
—
—
—
——
— —
—
—
—
—
——
——
—
—
—
—
——
—
—
——
—
——
——
—
—
——
——
—
—
—
——
—
—
—
—
—
—
——
——
—
—
—
—
——
—
——
—
—
—
—
——
——
——
—
—
——
——
—
—
—
—
——
——
——
—
—
—
—
——
—
—
—
——
——
—
—
—
—
——
——
—
—
——
——
—
—
—
—
—
—
——
—
—
—
—
—
—
——
—
—
——
——
—
—
—
—
—
—
——
—
—
—
—
—
—
—
——
—
—
—
—
—
—
——
—
——
—
—
——
——
—
—
—
—
—
——
——
—
—
—
—
——
—
——
—
——
——
—
—
—
—
——
——
—
—
—
——
—
——
—
—
—
——
——
—
—
—
—
—
——
—
—
—
—
——
——
—
—
—
—
—
——
—
——
—
—
—
—
——
—
—
—
—
——
—
——
—
—
——
—
—
—
——
——
—
—
—
——
——
—
—
——
——
—
—
—
—
—
——
—
—
—
—
—
——
——
—
—
—
——
—
—
—
——
—
—
—
—
—
—
—
——
—
—
———
—
—
—
—
———
—
—
—
—
—
— —
—
—
—
—
—
—
——
—
—
—
—
————
—
—
—
—
—
——
—
—
—
—
— ——
—
—
—
—
— ———
—
—
—
—
—
—
—
—
——
—
—
—
—
—
— ——
—
—
—
— ——
—
—
— ———
—
—
—
—
—
———
—
—
—
—
——
—
—
—
—
— —
—
—
—
—
——
—
—
—
—
——
—
—
—
— ———
—
—
—
—
—
—
—
—
—
— ———
—
—
—
— ——
—
—
—
—
— ———
—
—
— ——
—
—
—
—
—
——
—
—
—
—
— ——
—
—
—
———
—
—
—
—
—
—
—
—
— —
—
—
—
—
— ——
—
—
—
—
— ——
—
—
—
— ————
—
—
—
—
—
—
——
—
—
—
— ——
—
—
—
— —
—
—
—
—
—
———
—
—
—
— ——
—
—
—
—
——
—
—
—
—
—
—
———
—
—
—
—
— ——
—
—
—
—
—
—
—
—
—
—
——
—
——
—
—
—
—
—
——
——
—
—
—
—
—
—— —
—
—
—
—
— ——
—
—
—
— —
—
—
—
—
— ——
—
—
—
—
——
—
—
—
—
—
——
—
—
—
—
—
———
—
—
—
—
—
—
—
—
—
—
—
—
—
—
—
—
—
—
——
—
—
—
—
—
—
—
—
—
—
—
—
—
— —
——
—
—
—
—
—
—
—
—
—
—
—
—
—
—
—
—
—
— —
———
—
—
—
—
——
—
—
—
—
— —
—
—
—
—
—
————
—
—
—
— ——— ——
—
—
—
—
—
—
— ——
—
—
—
—
—
—
—
—
— —
—
—
—
—
———
—
—
—
— —
—
—
—
—
—
— ——
—
—
—
—
—
—
— ——
—
—
——
—
—
—
— ———
—
—
—
— ——
—
—
—
—
— ——
—
—
—
—
——
—
—
—
—
—
—
—
—
—
— ———
—
—
——
—
—
——
—
—
—
—
—
——
—
—
—
—
— —
——
—
—
—
—
— ——
—
—
—
—
—
—
— ——
—
—
—
—
—
—
— ——
—
—
—
—
—
——
—
—
—
—
——
—
—
—
——
—
—
——
—
—
—
— ——
—
—
— ——
—
—
——
—
—
—
—
— ——
—
—
—
—
—
——
—
—
—
—
—
———
—
—
—
—
—
—
—
——
—
—
—
—
—
— —— —
—
—
—
—
— ——
—
—
—
——
—
—
—
— —
—
—
— ——
—
—
—
—
—
——
—
—
—
—
—
—
—
———
—
—
—
— ——
—
—
—
—
—
— ——
—
—
—
—
—
—
—
—
—
—
—
— —
———
—
—
—
—
—
— —
———
—
—
—
—
—
—
—
—
—
—
———
—
—
—
—
—
—
—
—
—
—
—
—
—
—
— —
—
—
—
—
—
—
—
—
— —
——
—
—
—
—
———
—
—
—
—
— ——
—
—
—
— ——
—
—
—
— ——
—
—
—
— ——
—
—
—
—
———
—
—
—
—
—
——
—
—
—
——
—
—
—
— ——
—
—
——
— —
———
—
—
—
—
—
—
—
——
—
—
—
—
—
—
—
——
—
—
—
—
— ——
—
—
——
—
——
—
—
—
—
—
— —
———
—
—
—
— —
——
— —
—
—
—
—
—
——
—
—
—
— —— —
—
—
—
—
—
—
—
—
—
—
—
—
——
—
—
—
——
—
—
—
—
——
— ——
—
—
—
—
—
—
——
—
—
—
——
— —
——
—
—
—
—
———
—
—
—
—
—
—
—
—
——
—
—
—
—
— —
——
—
—
—
—
—
—
——
—
—
—
—
—
—
—
—
—
—
—
—
—
—
—
—
———
—
—
—
——
—
—
—
——
—
—
—
— ——
—
—
—
—
—
———
—
—
—
— ——
—
—
——
—
—
—
—
——
—
—
—
——
—
—
—
—
—
—
—
—
———
—
—
—
— —
—
—
—
—
—
—
— ———
—
—
—
—
——
—
—
—
——
—
—
—
—
——
—
——
—
—
—
—
—
—
—
——
——
—
—
——
—
—
—
—
— —
—
——
—
—
—
—
—
—
—
—
—
—
——
—
—
—
—
—
——
—
——
—
——
—
—
—— —
—
—
—
—
—
—
—
— ——
—
—
—
——
—
—
—
—
—
—
——
—
——
—
—
—— —
—
—
—
—
————
—
—
—
—
——
—
—
—
——
—
—
—
——— —
—
—
— ——
—
—
—
——
—
—
—
——
—
—
— ——
—
—
—
—
—
—
——
—
—
—
—
—
———
—
—
—
——
—
—
—
—
—
— ———
—
—
— —
——
—
—
— ——
—
—
—
—
——
—
—
—
—
—
—
—
—
—
——
—
—
—
—
—
—
—
—
———
—
—
——
—
—
——
—
—
—
— —
———
—
—
—
—
———
—
—
—
— ——
—
—
— ——
—
—
—
—
——
—
—
—
— —
—
—
—
—
—
—
—
— —
—
—
—
—
—
—
—
—
—
—
—
—
—
—
—
——
—
—
—
— ——
—
—
—
—
—
——
—
—
—
—
———
—
—
—
—
——
—
—
—
—
—
——
—
—
—
——
—
—
—
—
—
——
—
—
—
—
—
—
—
——
—
—
— ——
—
—
— ———
—
—
—
—
—
—
—
——
—
—
—
—
—
—
— ——
—
—
—
—
—
—
— —
—
—
—
—
—
—
—
—
—
—
—
—
—
—
—
—
—
— —
—
—
—
—
—
——
—
—
—
—
— ———
—
—
—
—
—
— —
—
—
— —
—
—
—
———
—
—
—
—
— —
—
—
—
—
—
—
—
— ——
—
—
—
—
— ——
—
—
—
——
—
—
—
—
—
—
—
—
——
—
—
—
— —
—
—
——
—
—
—
—
—
—
—
—
——
—
—
—
—
— ——
—
—
—
—
— ——
—
—
—
— ——
—
—
—
— —
—
—
——
—
—
—
—
— ———
—
—
—
— ———
——
—
—
——
— ——
—
—
—
—
—
—
———
—
—
— ——
—
—
—
—
—
—
—
—
—
—
—
—
—
— ——
—
—
—
—
——
—
—
—
—
—
—
—
—
—
— ——
—
—
—
——
—
—
—
——
— ——
—
—
—
—
—
—
— —
—
—
—
— ——
—
—
— ——
—
—
—
— ——
—
—
— —
—
——
—
—
—
—
—
—
—
——
— ——
—
—
—
—
—
—
—
—
——
—
—
—
——
—
—
—
— —— —
—
—
— ——
—
—
—
— ——
—
—
—
—
—
—
—
——
—
—
— ——
—
—
—
—
—
—
—
—
—
—
— —
—
—
—
———
—
—
—
—
— ——
—
—
—
—
———
—
—
—
—
— ——
—
—
— ——
—
—
—
— —
—
—
—
—
—
—
———
—
—
—
—
—
—
—
—
—
—
—
—
—
——
—
—
—
—
—
— —
—
—
—
—
— ——
—
—
—
—
— —
—
—
—
—
—
—
——
—
—
—
— ——
—
—
—
—
—
—
—
——
—
—
—
— —
—
—
—
—
—
—
— —
—
—
—
— ——
—
—
— ———
—
—
—
—
—
—
— ——
—
—
—
—
——
— ——
—
——
—
—
—
—
—
—
—
—
—
—
—
—
—
—
— —
—
—
——
— ——
—
—
—
— ——
—
—
—
—
—
—
—
—
——
—
—
—
—
—
—
——
—
—
—
—
—
—
—
—
—
—
— —
—
—
—
— —
—
—
—
—
—
—
—
—
— ——
—
—
— —
—
—
—
—
—
—
—
——
—
—
—
——
—
—
—
—
—
—
—
—
—
——
—
—
——
—
—
—
—
—
——
—
—
—
—
— ——
—
—
—
— —
—
—
—
—
——
—
—
—
—
—
——
—
—
—
—
—
—
—
—
—
—
——
—
—
—
——
—
—
—
—
—
—
—
—
—
—
——
—
—
—
—
—
——
—
—
—
—
—
—
—
—
—
— ——
—
—
—
—
—
—
—
—
—
—
—
—
—
—
—
—
— ———
—
—
——
—
—
—
—
—
——
—
—
—
—
——
—
—
——
—
—
— —— ——
—
—
—
—
—
— ———
—
—
—
—
—
—
—
———— —
—
—
—
—
—
————
—
—
—
—
————
—
—
—
—
— ————
—
—
—
—
— ———
—
—
—
—
—
—
—
——
—
—
—
— ——
—
——
—
—
— ———
—
—
—
—
—
————
—
—
—
—
—
————
—
—
—
—
—
— —— ——
—
—
—
—
—
—
—
————
—
—
—
— ———
—
—
—
—
— ————
—
—
—
—
— ——— —
—
—
—
—
— ———
—
—
—
— —— —
—
—
— —
—
—
— — ——
—
—
—
—
—
—
————
—
—
—
—
—
— ———
—
—
—
—
———
——
—
——
—
—
—
———
——
—
—
—
—
— ———— —
—
—
—
—
—
—
———
—
—
—
—
—
———— —
—
—
——
—
—
—
————
—
—
—
— ——
—
—
—
—
— ———
—
—
—
—
———
—
—
—
—
— ——— —
—
—
—
—
— —
———
—
—
—
—
—
—
———
—
—
—
—
— ——
—
—
—
———
—
—
—
—
—
—
—
—
—
——
—
—
—
—
— —
—
—
——— —
—
—
—
—
—
— ——
—
—
—
—
—
——
—
—
—
—
—
——
—
—
—
—
—
— ——
—
—
—
—
—
—
—
—
—
—
—
—
—
—
——
—
—
—
— ——
—
—
—
—
—
——
——
—
—
—
—
—
—
—
—
—
—
—
—
—
—
—
—
——
—
—
—
—
—
—
—
—
—
—
— ——
—
—
—
—
—
—
—
—
—
—
—
— —
—
—
—
—
— ——
—
—
—
—
—
—
—
—
—— —
—
—
—
—
— —
—
—
—
—
— ——
—
—
—
—
—
—
—
—
—
—
—
—
—
—
—
— —— —
—
—
—
—
—
—
—
—
—
—
—
— ——
—
—
—
——
—
—
—
—
— ——
—
—
—
— ——
—
—
—
— ——
—
—
—
—
——
—
—
—
—
— ———
—
—
—
—
—
—
— —
—
—
—
—
—
— ——
—
—
—
——
—
——
—
—
—
—
—
—
— —
—
—
—
—
— ——
—
—
—
——
—
—
—
—
—
——
—
—
—
— ——
—
—
—
——
—
—
——
—
—
—
— ——
—
—
—
—
—
——
—
—
—
—
—
——
—
—
—
—
—
—
— —
—
—
—
—
—
—
— —
—
—
— —
——
—
—
—
—
—
—
—
—
—
—
—
—
—
—
—
—
—
— ——
—
—
— —
—
—
—
— ———
—
—
—
—
—
—
—
—
—
—
——
—
—
—
—
—
—
—
—
—
—
—
—
—
— —
—
—
—
— ——
—
—
—
——
—
—
—
—
— —
—
—
—
—
— ——
—
—
—
—
—
——
—
—
—
—
——
—
—
—
—
—
— —
—
—
—
—
—
—
——
—
—
—
—
—
——
—
—
—
—
—
— —
—
—
— —
—
—
—
—
—
—
—
——
—
—
—
—
—
—
—
—
——
—
—
—
—
—
—
—
——
—
—
—
—
—
—
—
—
—
—
—
—
——
—
—
——
—
—
——
—
—
—
—
— ——
—
—
—
—
—
——
—
—
—
—
——
—
—
—
—
—
——
—
—
—
—
—
—
—
—
— ——
—
—
—
—
—
—
—
—
—
——
—
—
—
—
—
—
—
—
—
—
——
—
—
—
— ———
—
—
—
—
—
—
—
—
—
—
—
—
—
—
—
—
—
—
—
—
—
—
—
—
—
——
—
—
—
———
—
—
—
—
—
— ——
—
—
—
—
—
—
——
—
—
—
—
—
—
— ——
—
——
—
—
—
——
—
—
—
— ——
—
—
—
— ——
—
—
— ——
—
—
—
—
——
—
—
—
— ——
—
—
—
—
—
—
—
—
——
—
—
—
— —
—
—
—
—
—
—
—
—
—
—
—
—
—
—
—
—
—
——
—
—
—
—
—
—
—
——
—
—
—
—
—
—
—
—
—
—
—
—
—
—
——
—
—
—
—
—
— —
—
—
—
—
—
—
—
—
—
—
—
—
—
— —
—
—
—
—
—
—
—
—
—
— ——
—
—
—
———
—
—
—
—
—
—
—
—
—
— ——
—
—
—
— —
—
—
—
—
—
——
—
—
—
—
———
—
—
—
—
—
— ——
—
—
——
—
—
—
—
————
—
—
—
—
—
—
—
—
—
— —
—
—
—
—
—
—
—
——
—
—
—
—
—
—
——
—
—
—
— ———
—
—
—
—
—
—
—
—
— ——
—
—
—
—
——
—
—
—
— —
——
—
—
—
—
— ——
—
—
—
—
— ——
—
—
——
—
—
— ——
—
——
—
—
—
— —
—
—
—
—
— ——
—
—
—
— ——
—
—
—
—
—
—
—
—
—
—
——
—
——
—
—
—
—
—
———
—
—
—
— ——
—
—
—
— ——
—
—
—
—
—
— ——
—
—
—
—
—
——— —
—
—
—
———
—
—
—
———
—
—
—
— ——
—
—
—
—
—
——
—
—
—
—
——
—
—
—
—
—
— —
——
—
—
—
——
—
—
—
—
—
—
—
—
——
—
—
—
— —
——
—
—
— —
—
—
— ——
—
—
—
—
——
—
—
—
—
———
—
—
—
——
—
—
—
—
—
—
— —
—
—
—
—
—
—
—
—
—
——
—
—
—
—
—
—
—
—
—
——
—
—
—
— ——
—
—
—
—
———
—
—
—
—
——
—
—
—
—
—
—
— ——
—
—
—
—
——
—
—
—
—
—
—
— ——
—
—
—
—
—
—
—
—
— ——
—
—
—
—
——
—
—
— ———
—
—
—
——
—
—
—
—
—
—
———
—
—
—
— —
—
—
—
—
—
—
——
—
—
—
— ——
—
—
—
—
——
—
—
—
—
— ——
—
—
—
—
—
—
—
—
—
—
—
——— —
—
——
—
—
—
— ——
—
—
—
—
— ——
—
—
—
—
—
—
—
—
—
——
—
——
—
—
— —
—
—
—
—
——
—
—
—
—
— ——
—
—
—
——
—
—
—
— ———
—
—
—
—
— ——
—
—
—
—
—
—
———
—
—
—
—
—
———
—
—
—
—
—
— ——
—
—
—
—
——
—
—
—
—
—
—
—
—
—
—
——
—
—
—
—
—
—
———
—
—
—
—
—
— ——
—
——
—
———
—
—
—
—
—
——
—
—
—
——
———
——
—
—
——
—
—
——
—
—
—
——
———
—
——
—
——
——
———
—
——
—
——
—
—
——
—
———
————
—
—
—
———
—
——
—
—
—
————
—
——————
— —
——
—
——
—
——
—
—
—
—
—
—————
————
—
—
—
—
——
—
——
——
—
——
——
—
— —
—
—
——
—— —
—————
——
—
—
—
———
—
—
—
——
——
—
——
—
—
—
——
—— —
—
—
——
——
—
—
—
— — —
——
—
—
—
—
—
——
—
—
—
——
— — —
—
—
—
—
——
—
—
—
—
— ——
——
—
——
——
—
—
——
——
— ——
— —
——
—
— —
—
— —
——
—
—
— —
——
— —
——
—
—
— —
—
— —
——
—
——
— —
——
—
——
——
— —
—
—
—
—
—
— — — —
—
— —
—
— —
—
— —
——
—
—
—
—
——
——
——
—
—
— —
——
—
—
—
—
— ——
——
—
—
——
—
—
—
—
— —
—
—
—
— ——
——
— —
—
—
— —
——
—— —
—
— —
—
— —
——
——
—
— —
——
———
——
——
——
———
—
—
——
—
——
———
——
—— ——— —
—
—
—
——
——
—
———
——
——
—
——
——
—
—
—
——
—
—
————
—
—
—
—
—
—
——
———
——
——
———
—
— ——
—
——
——
—
———
—
——
——
———
—
———
—
———
——
——
—
—— —
— —
——
—
——
——
———
—
—
—
———
—
——
—
——
—
—
—
—
——
—
——
——————
———
———
—
———
—
—
—
———— —
———
————
—
—
——
——
—
————
—
————
—
—
——
——
—
——
——
——
——
——
—
——
—
—
———
—
——
—
—
——
——
—
——
—————
——
—
—
— — —
—
—
——
—
——
—
————
—
—
———
——
——
—
——
—
——
———
——
—
—
— — —
—————
——
—
—
——
——
——
———
——
—
—
—
——
—
——
———
——
—
—
——
——
——
——
—
—
——
—
— —
—
—
—
—
——
—
———
—
———
— —
——
—
———
—
——
———
—
———
——
—
——
—
——
—
—
—
—
——
—
—
—
——
—
——
—
—
—
——
———
—
—
—
—
————
—
——
— —
—
—
—
—
—
——
——— —
—
——
——
—
—
—
——
——
——
—
—
———
—
—
—
——
—
———
——
——
—
—
———
—
—
—
—
———
————
—
—
——
—
—
—
—
——
——
—
——
——
—
——
—
—
——
———
—
—
—
——
—
———
—
——
———
—
—
—
——
——
———
—
—
——
—
—
——
—
—
——
—
——
—
—
———
—
—
————
—
——
——
———
——
——
—
——
———
—
——
—
——
—
—
———
———
—
—
——
——
—
—
—
——
—
——
———
—
———
——
—————
——
——
——
—
—
—
— —
——
——
—
—
————
————
——
——
—
——
—
—
——
——
——
—
—
——
—
—
—
—
——
———
——
——
——
——
—
———
—
———
——
—
——
———
———
—
——
——
—
—
————
—
——
— —
——
—
——
—
———
—
—
——
—
——
—
—
———
—
——
——
——
—
—
——
—
—
———
———
—
—
——
———
—
—
—
— —
—
— — —
———
——
——
—
—
—
—
——
—
—
————
————
———
———
————
———
—
———
———
——
——
—
—
——
——
—
—
——
—
——
———
———
———
—
——
——
—
—
—
——
——
——
—
———
— —
——
—
—
—
——
—
——
—
—
—
——
————
———
—
——
———
——
——
——
——
——
—
—
—
— —
———
———
—
— —
——
———
—
—
—
——
———
———
——
— ——
—
——
—
—
——
—— ——
—
—
—
—
——
—
——
————
—
— —
——
— —
——
—
—
—
———
——
—
—
——
———
———
—
———
—
—
——
—
—
———
—
——
———
——
— —
——
——
————
— —
——
— —
——
—
—
——
——
—
—
——
——
—
——
———
—
———
———
———
—
——
—
—
——
—
—
———
——
————
———
——
—
—
——
—
—
— —
———
—— —
—
——
—
——
— —
—
— —— ——
— —— —
— —
— ——
——
— — —
—
— —
—
——— —— — ——
— —
—
——
——
—
—
— —
— —
— —
— — — ——
—
— — —— —
——
——
— ——
— ——
——
——
—— — ——
—
——
—
——
——
—
——
—
—
———
—
—
——
— — ——
—
—
—
——
—— —
——
— ——
—
——
—
—
—
—
—
—— ——
— — ——
——
——
——
—— —
—
—
—
—
—
—
— ———
—
—
——
——
—
—
—
—
—
— ——
—— —
—— —
—
—
——
——
—
— —
—
—— —
——
—— — — ——
——
—
— — —
—
— — ———
——
—
——
—
—
—
—
——
——
——
——
——
—
——
— ——
—
—
——
—
——
—
—
——
—
—
——
—
— ——
—
— — —
—
——
—
—
—
—
—
—
——
—
— —
—
——
—
——
——
—
—
——
—
— ——
—
——
—
—
—
—
——
—
—
—
——
——
—— —
—
— ——
——
————
— —
—
—
—
—— —
—
——
——
—
—
——
——
——
——
—
—
— —
——
—
——
—
——
—
— —
—
— ——
— —
——
—
——
——
—
—
——
— — ——
—
——
— —
—
— —
— ——
— —
— —
—
——
——
—
— — —
— —
——
— — ——
—
— ——
—
—
— ——
—
— —
—
—
——
——
—
— ——
— —
— ——
—
—
— ——
—
—
— ——
—
— ——
—
— ——
—
—— —
—
—
—
—
— ——
——
— —
—
——
—
——
—— — ——
—
— ——
——
— ——
—
—
—— — ——
— —
——
—
——
— ——
—
——
— ———
—
—
— — ——
—
—
—
——
——
—
—— — — —
—
— —
— ——
— — —
——
—
—
—
—
—
—
—
—
— —— — —
—
—
——
—
— —
—
—
——
—
—
——
——
——
—
— —— — ——
—
——
—
— ——
—
—
—
—
—— — —
——
— —
—
— — ——
—
— —
—
— ——
—
—— —
—
——
—
— ——
—
—
—
——
——
—
—— —
—
—— — —
—
—
—
—
—
—
—
——
—
—
—
—
—
—
—
—
—
—
——
—
—
— —— —
—
—
———
——
— — —
—
——
—
— —
—
——
—
—
—— —
—
——
—
— ———
—
—
— — — —
—— — —
—
— — ———
—
—
—
—
—
—
—
— ——
—
—
—
——
— ——
—
——
—
— —
—
—
—
—
— ——
—
—
——
—
—
—
—
—
——
— — ———
—
—
—
— — ———
——
—
—
— ——
—
— — —
—
——
——— — —
—
—
—
— ——
— ——
—
—
——
— — ———
—
——
—
— —
—
—— —
—— — —
—
—
——
——
— ——
——
——
—
—
—
—
— ——
—— — ———
—
——
—
—
———
—
—
—
— ———
—
—— — —
——
—— — ——
—— —
— —
—
—
—— — —
—
—
— ——
—
— — ——
—
—
——
——
— — —
—
— — ———
——
—
— ———
—
——
— —
—
——
—
———
—— — ———
—
——
——
——
— ——
— ——
— ——
——
—
—
—
—
—
——
—
—
——
——
—
——
——
— —
—
— — ——
—
——
—
——
—
—
—— —
—
—— — ——
—
——
——
— ————
—
—
— ———
—
——
—
——
——
—
——
—
— ——
—
—
———
——
—
—
—
—— —
—
—
——
——
— — —
—
— ——
—
— — —— —
—
——
— — —
—
——
——
——
—
——
—
—
— —
—
——
—
— ——
—
—
—
— —
—
——
— —
—
——
——
—
— —
—
—
——
—
—
—
———
—
— —
—
— — — ——
—
——
—
—
— —
——
—
—
— —
——
——
—
—
— —
—
— ——
——
—
—
—
—
——
—
—
—
—
—
—
—
—
— ——
—
—
—
—
——
—
——
—
——
—
—— — —
—
——
—
— — ——
—
——
—
——
—
—
—
—
—
——
—
—
——
—
—
—
— — ——
—
—
— ——
—
—
—
—— —— —
—
—
—
—
—
—
—
——
—— —
—
—— —
—
— — —
——
—
—
——
—
——
—
— —
—— — —
—
——— —
—
— — — ——— —— —
—
—— —
—
— —— —
——
—
——
—
——
—
—
——
—
—
— — —
—— —
——
——
——
——
—
—
——
— —— —
—
— — —
—
— — —
—— —
——
—
—
—
— ——— —— —
—
—
—
— ——
—— —
—— — —— —
—
—— —
——
—
——
—
—
——
— ——
—
—
— ——
——
——
—
—
——
—
— ——
—
—
— ——
—
——
—
—
——
— —— —
—
—
— ———
— — —
—
— ——
—— — —— ——
—— —
—— —— — —
—
——
—
— ——
——
—— — — —— —
—
—
—— — —
——
——
—
— —
—
——
—
—
— ——
—
——
—
——
—— —— —
—
—
—
—
— ——
— — —
—
——
—
— — —
—— —
—
—
——
—
—
— —— ———
— ——
—
—
— —— —
—
——
— ——
—
—
—
——
——
—— — ——
——
—— — —
—
—
—— ——
—
—
—
——
—
—
—
—
———
—
— ———
—— — ——
—
—
—
—
—
——
—
—
——
——
——
— —— ——
—
—— — —
—
——
—
——
— —
— —
——
——
—
— ———
— ———
—
——
— — —
—
— —
—
——
——
——
—
—
—
—
—
—
—
—
—
— ——
—
—
——
— — —
—
—
—
——
—
— ——
—
—
——
—
——
—
—
—
—— — —
——
——
— —
——
—
— —— — —
— —
——
— — ——— —
—— —— —— —
—
—
— ———
—
——
—
— ——
——
— — ——
— —
—
— ——
—
—
——
—
— — —— ——
—
——
— —
—
— — — ——
—
——— — —
—— — —
—
— — ———
—
—
—
— ——
——
—
——
——
—
—— ——
—
—
—
—
— —
—
—
—
——
——
—
——
— — — — —— — —
——
—
—
— — — —
——
—
—— —— — ——
——
—— —
—
—
—
—
— ——
—
—— ——
—— —
—— —
—
—
——
—
——
— — ——
—
—
— ——
— ——
— —
—— ——
—
——
—
——
—
—
——
—
——
—
— ——
— ——
—
— — ——
——
— ———
— ——
— — ——
—— —
—
——
—
——
——
——
—
——— —— ——
—
——
——
—
——
—
—— ——
—
——— — —
— ———
—
—— —— — —
——
—
— ——
—
—
— ———
——
—
—
———
—
— — —
—
——— ——
—
— — —
—
— ——
— —— —
—
— ——
—— ——
——
—
— ——
—
— — —— — —— — ———
—— —— —
—
——
—
— —— ——
— ———
—
— —
—— —
—
——
——
———
—
——
— ———
——
——
— — ——
—
—— — —
—
——
—
— ——
—
———
— — — ——
— ——
—
— —
—
——— — —
—
—
——
——
—
— —
—
—
— ———
—— —
—— — —— ——
—
—— ——
— ——
—— —
—
—
——
——
——
—
——
—
— —— —
——
— —
—
——
—
—
———
—— ——
—
——
—
—
——
— ——
—
—
—
——
—
———
—
—
——
— —
—
—— —
—
—— —
——
—
— ———
—— ——
——
——
—
—— — —
—— — —
—
—— — ———
—
— — ——
——
—
— ——
—
—
——
—
—
—— —
——
—
—— — ——
— —
—
—— — ——
— —
—
—
——
—
—
——
—
— ——
—— — —
—
——
—
—— — —
—
— — ——
—
——
——
——
—
——
— ———
—
——
— —
—
——
——
—
——
—
—
——
——
— —
—
——
—
—
—
—
—
— ——
—
——— —
—
—
—
—
—
—
—
——
— ——
—
——
—
— —
—
— ——
—
—
——
—
—
—
—
——
——
— —
—
——
——
——
—
——
—
——
—
——
—
— ——
—
——
——
——
——
——
——
——
——
——
—
——
—
——
——
—
——
—
——
——
—— —
——
——
——
—
——
——
——
——
——
—
—
——
——
—
——
—
—
——
—
——
—
——
—
——
——
—
——
—
——
—
——
—
—
——
—
——
——
—
—
——
—
——
—
—
——
—
——
——
—— —
——
——
——
—
—
——
—
——
—
—
—
——
——
—
— ——
—
——
—
——
——
——
——
—
——
—
— ——
—
——
——
——
——
——
—
—
——
—
—— —
——
—— —
——
— ——
—
——
——
——
——
——
——
——
——
——
——
—
——
——
—
——
—
——
——
——
——
——
—
—
——
——
——
——
—
——
—
——
—
——
——
——
——
——
—
—
——
—
——
——
—
——
—
——
—
——
——
—
——
—
——
—
——
——
— ——
—
—
——
——
—
——
——
——
——
—
——
—
——
——
—
——
—
—
—
——
—
——
—
——
——
—
——
—
—
——
—
—
——
—
——
——
——
——
——
——
——
—
——
——
—
——
—
—
——
——
—
——
——
—
——
——
—
—
——
—
—
—
——
—
—
——
——
—
——
——
—
—
——
—
—
—
——
——
——
—
—
——
—
——
—
—
——
——
—
—
——
——
—
——
—
——
——
—
——
— ——
——
—
——
—
—
—
——
——
——
—
—
—
——
—
—
——
——
—
—
——
——
—
—
——
——
—
—
——
—
—
——
—
— ——
—
—
—
——
—
—— —
——
—
—
—
—
——
——
—
—
—
——
—
——
——
——
—
——
——
——
——
—
——
——
——
—
—
— —
—
—
——
——
——
—
—
——
—
—
——
—
——
—
—
— ——
——
—
—
—
——
—
——
——
—
—
—
——
—
——
——
—
——
——
—
—
—
——
—
—
——
——
—
——
—
—
——
——
—
——
—
——
—
——
——
—
—
——
—
——
—
——
—
—
——
——
——
—
——
——
——
— —
——
——
— —
—
—
——
——
——
—
—
—
——
——
—
— —
—
—
—
—
—
——
— —
—
—
——
——
——
—
—
—
——
—
—
—
—
——
——
——
—
—
—
—
—
——
—
—
——
— ——
——
—
—
——
—
——
—
——
—
——
—
—
——
—
——
—
——
—
—
———
——
——
——
——
—
——
——
——
—
——
—
——
—
—
——
—
——
——
—
——
—
— ——
—
——
—
——
——
—
——
——
—
— ——
——
—
—
—
——
—
——
—
—
——
——
—
——
—
— ——
—
——
——
——
——
—
——
——
—
——
——
——
—
——
—
——
—
—
——
—
——
—
—
——
—
— —
——
—
——
—
——
——
——
—
——
—
——
—
——
——
——
——
—
——
——
——
——
——
— ——
——
——
———
——
——
—
—
—
——
——
—
—
——
—
——
—
— —
—
——
——
——
—
—
——
—
——
—
—
——
——
——
——
—
—
—
——
——
—
——
——
—
——
——
——
—
— ——
—
——
—
——
—
——
—
——
—
——
——
—
——
——
——
——
——
—
— ——
——
— ——
—
—
——
—
——
—
——
—
——
—
——
—
——
——
—
—
——
—
—
—
——
—
——
—
——
—
——
—
——
——
—
— ——
—
——
—
——
——
—
——
—
—
——
—
——
—
——
——
——
—
—
—
——
——
—
— ——
—
——
——
——
——
—
——
——
——
—
—
— ——
—
——
—
——
——
——
—
——
—
—
——
—
——
——
——
——
——
——
——
—
——
—
—
——
——
—
——
——
—
——
—
——
—
——
—
——
——
—
—
—
——
—
——
—
——
——
——
—
——
——
—
—
——
—
——
——
——
—
——
——
——
——
——
——
—
——
——
—
——
——
—
——
——
—
——
——
——
——
—
——
—
— —
—
——
——
—
——
—
——
——
——
——
——
——
——
——
——
——
—
—
——
——
—
——
—
——
——
——
——
——
——
—
——
——
—
——
——
——
——
——
——
——
—
— ——
—
——
—
——
——
——
—
——
——
—
——
——
—
——
——
——
—
——
——
——
—
— ——
—
——
——
——
—
——
—
——
——
—— —
——
—— —
——
——
——
——
—
—— —
——
——
——
——
——
——
——
——
——
—
—
—
——
—
— ——
—
——
——
——
—
——
—
——
——
—
—
——
——
—
—
——
—
——
—
——
—
——
——
——
—
——
——
—
——
——
—
——
——
—
—
—
——
—
——
——
——
——
——
——
——
—
——
—
—
—
——
—
—— —
——
——
——
—— —
——
—
——
——
—
——
——
——
——
——
—
——
——
——
——
——
——
——
——
——
——
—
——
——
—
——
——
—— —
——
——
——
—
——
——
——
——
——
——
—
——
——
——
——
—
—
——
—
—
— ——
——
—
——
——
——
——
——
—
—
—
——
—
——
——
—
——
——
——
——
——
——
——
——
—
——
——
——
——
——
——
——
——
——
——
——
——
——
——
——
——
——
——
——
——
——
——
——
—
——
——
——
——
——
——
—
—— —
——
——
——
——
——
—
——
——
——
——
——
——
——
——
—
——
—
——
——
—
——
——
——
——
——
—
——
——
—
——
——
——
——
—
——
——
——
——
—
——
——
—
——
—
——
——
——
——
——
—
——
——
——
—
—
——
—
—
——
——
—
—
——
—
—
——
—
——
——
——
——
—
—
——
—
——
—
——
——
——
——
—
——
—
——
——
—
—
——
— ——
—
——
—
——
——
—
——
——
— ——
——
—
——
——
——
——
—
——
——
——
—
——
—
——
—
——
—
—
——
—
—— —
——
— ——
—
——
—
——
——
—
——
—
——
—
——
——
—
——
——
——
—
——
—
——
——
——
——
——
—
——
—
——
——
—
——
—
——
—
——
—
——
——
—
——
——
—
—
——
—
——
—
——
——
——
—
—
—
——
—
— ——
——
——
——
——
——
——
——
——
——
——
—
——
——
——
——
——
—
——
——
—
——
——
——
—
——
—
— ——
—
—
—
——
—
—
——
——
—
——
—
——
—
——
—
——
——
——
—
——
—
——
—
——
——
——
—
——
——
— ——
—
——
——
—
——
—
——
——
——
—
——
—
——
——
——
—
——
—
— ——
—
—
—
——
—
—
——
—
——
——
——
—
——
—
——
—
——
—
——
——
—
——
—
——
——
—
——
——
——
——
——
——
——
—
——
——
——
——
—
—
—
——
—
——
——
—
—
——
——
—
—— —
——
——
——
——
—
——
——
—
— ——
—
—
——
—
——
—
——
——
——
——
—
——
—
——
—
——
—
——
——
—— —
——
——
—
—— —
——
——
——
—
——
—
—— —
——
——
——
—
——
—
10−3
10−2
10−1
100
101
102
7578500 7578520 7578540hg19 position on chr:17
VAF
(%
)
Thresholds for position specific nucleotide changeA
——————
—————————————————————————————————————————————————————————————————————————————
———————————————————————————————————————————————————————————————————————————————————————————————————————————————————————————————————————————————————————————————————————————————————————————————————————————————————————
———————
———————————————————————————————————————————————————————————————————————————————————————————————————————————————————————————————————————————————————————————————————————————————————————————————————————
——————————————————————————————————————————————————————————————————————————————————————————————————————————————————————————————————————————————————————————————————————————————————————————————————————————————————————————————————————————————————————————————
————————————————————————————————————————————————————————————————————————————————————————————————————————————————
———————————————————————————————————————————————————————————————————————————————————————————————————————————————————————————————————————
———————————
——————————————————————————————————————————————————————————————————————————————————————————————————————————————————————————————————————————————
—————————————————————————————————————————————————————————————————————————————————————————————————————————————————————————————————————
———————————————————————————————————————————————————————————————————————————————————————————————————————
10−3
10−2
10−1
100
101
102
A T C GNucleotide reference
VAF
(%
)
Thresholds for nucleotide specific changeB
Nucleotidechange
A
T
C
G
−

Figure S6. FASTQimport
Pairedreads
Trimming
Mapping
Realignment
Lowfrequencydetec>on
CombinedVCF
Basicdetec>on
Dilutedsamples
Dilu>ongradeDilu>onra>o
IARCTP53
DMAcallN=98
VAF>0.001%ORVAF>2%
MaptoHg19referencegenomeNon-specificmatchhandling:• Exon3:Maprandomly• Exons2,4-10:Ignore
Trimsequence:20bp5’+1bp3’Q-score>0.01
Posi>onspecific
Nucleo>despecific
Rarevariants
IARCTP53
SEMcallN=116
Meancoverage>1000x
CLC
wo
rkb
ench
R
cu
sto
ms
crip
t
N=162,800N=167,033
Dilu>onmatch
N=496uniquenotmodeledNorarevariantsw/VAF>2%
Exclusion
ValidatedSNPsSynonymousPredictedfunc>onalp53
Dilu>onmatch
algorithm
Stereotypicerrormodel
FinalcallN=94
Trueposi>ves
N=7,847uniquen=2,099uniquemodeled
N=698uniquen=202uniquemodeled
N=446
Undilutedsamples

0
50
100
0.00 0.25 0.50 0.75 1.00VAF (%)
Obs
erve
d (n
)
Position specific nucleotide change for hg19 g.17:7577090C>T/p.Arg283HisStereotypic error distribution and fitted gamma distribution A
0
5
10
0.00 0.25 0.50 0.75 1.00VAF (%)
Obs
erve
d (n
)
Position specific nucleotide change for hg19 g.17:7577089_7577090delGC/p.Arg283fs*22Stereotypic error distribution and fitted gamma distribution B
0
1
2
3
4
5
0.00 0.25 0.50 0.75 1.00VAF (%)
Obs
erve
d (n
)
Position specific nucleotide change for hg19 g.17:7578442T>C/p.Tyr163CysStereotypic error distribution and fitted gamma distributionC
0
2
4
6
8
0 1 2 3VAF (%)
Obs
erve
d (n
)
Position specific nucleotide change for hg19 g.17:77579837A>C/c.74+2T>GStereotypic error distribution and fitted gamma distribution D
Figure S7.
↓

||
||||||||||||| ||||||||||||||||||||||||||||||| |||||||| ||||||| |||||||||||| | ||| ||| |||||| ||||||| |||||||| |||| |||||||||| ||||||| | || |||||||| || ||||| | ||||||| || ||| ||||||||| | ||
| || || ||| |
| | || || | |
| | |
|
| ||| | | ||
|
| | | | | | |
0.00
0.25
0.50
0.75
1.00
0 2 4 6 8Time from diagnosis (years)
Surv
ival p
roba
bilit
y
248 223 149 90 43 815 15 11 5 4 027 21 13 5 1 0−−−
No. patients
||
||||||||||||| ||||||||||||||||||||||||||||||| |||||||| ||||||| |||||||||||| | ||| ||| |||||| ||||||| |||||||| |||| |||||||||| ||||||| | || |||||||| || ||||| | ||||||| || ||| ||||||||| | ||
| || || ||| |
| | || || | |
| | |
|
| | | | ||
|
| | | | | |
| | |
0.00
0.25
0.50
0.75
1.00
0 2 4 6 8Time from diagnosis (years)
Surv
ival p
roba
bilit
y
248 223 149 90 43 815 15 11 5 4 020 17 12 5 1 07 4 1 0 0 0−−−−
No. patients
|
|
||||| ||||| |||||||||||||||||||||||||| ||| ||| |||| | |||||| ||| || ||||| |||| ||||||| |||| |||||||| |||||| | || || ||| | ||||||
| | | |
| |
| |
| ||
| | | |
0.00
0.25
0.50
0.75
1.00
0 2 4 6 8Time from diagnosis (years)
Prog
ress
ion
prob
abilit
y
248 176 104 62 2915 11 9 5 427 13 8 2 1−−−
No. patients
|
|
||||| ||||| |||||||||||||||||||||||||| ||| ||| |||| | |||||| ||| || ||||| |||| ||||||| |||| |||||||| |||||| | || || ||| | ||||||
| | | |
| || | | ||
| | | |
0.00
0.25
0.50
0.75
1.00
0 2 4 6 8Time from diagnosis (years)
Prog
ress
ion
prob
abilit
y
248 176 104 62 2915 11 9 5 420 11 8 2 17 2 0 0 0−−−−
No. patients
||
||||||||||||| ||||||||||||||||||||||||||||||| |||||||| ||||||| |||||||||||| | ||| ||| |||||| ||||||| |||||||| |||| |||||||||| ||||||| | || |||||||| || ||||| | ||||||| || ||| ||||||||| | ||
| || || ||| |
| | || || | |
| | |
|
| ||| | | ||
|
| | | | | | |
0.00
0.25
0.50
0.75
1.00
0 2 4 6 8Time from diagnosis (years)
Surv
ival p
roba
bilit
y
248 223 149 90 43 815 15 11 5 4 027 21 13 5 1 0−−−
No. patients
||
||||||||||||| ||||||||||||||||||||||||||||||| |||||||| ||||||| |||||||||||| | ||| ||| |||||| ||||||| |||||||| |||| |||||||||| ||||||| | || |||||||| || ||||| | ||||||| || ||| ||||||||| | ||
| || || ||| |
| | || || | |
| | |
|
| | | | ||
|
| | | | | |
| | |
0.00
0.25
0.50
0.75
1.00
0 2 4 6 8Time from diagnosis (years)
Surv
ival p
roba
bilit
y
248 223 149 90 43 815 15 11 5 4 020 17 12 5 1 07 4 1 0 0 0−−−−
No. patients
|
|
||||| ||||| |||||||||||||||||||||||||| ||| ||| |||| | |||||| ||| || ||||| |||| ||||||| |||| |||||||| |||||| | || || ||| | ||||||
| | | |
| |
| |
| ||
| | | |
0.00
0.25
0.50
0.75
1.00
0 2 4 6 8Time from diagnosis (years)
Prog
ress
ion
prob
abilit
y
248 176 104 62 2915 11 9 5 427 13 8 2 1−−−
No. patients
|
|
||||| ||||| |||||||||||||||||||||||||| ||| ||| |||| | |||||| ||| || ||||| |||| ||||||| |||| |||||||| |||||| | || || ||| | ||||||
| | | |
| || | | ||
| | | |
0.00
0.25
0.50
0.75
1.00
0 2 4 6 8Time from diagnosis (years)
Prog
ress
ion
prob
abilit
y
248 176 104 62 2915 11 9 5 420 11 8 2 17 2 0 0 0−−−−
No. patients
Figure S8.
OS TFS
A B
C D
+ ++++++++++++++++++++++++++++++++++++++++++++++++++++++++++++++++++++++++++++++++++++++++++++++++++++++++++++++++++++++++++
+++ ++
+ + ++
+
++ ++++ ++ +
0.00
0.25
0.50
0.75
1.00
0 2 4 6 8Time from diagnosis (years)
Prog
ress
ion
prob
abilit
y
++
++
++
TP53wt
TP53ab
TP53mut <1%
TP53ab 1−100%
TP53mut 1−100%
Del(17p)
246 174 103 61 29 31 1 0 0 0 015 11 9 5 4 01 1 1 1 0 020 11 8 2 1 07 2 0 0 0 0−−−−−−Number at risk
+ ++++++++++++++++++++++++++++++++++++++++++++++++++++++++++++++++++++++++++++++++++++++++++++++++++++++++++++++++++++++++++
+++ ++
+ + ++
+
++ ++++ ++ +
0.00
0.25
0.50
0.75
1.00
0 2 4 6 8Time from diagnosis (years)
Prog
ress
ion
prob
abilit
y++
++
++
TP53wt
TP53ab
TP53mut <1%
TP53ab 1−100%
TP53mut 1−100%
Del(17p)
246 174 103 61 29 31 1 0 0 0 015 11 9 5 4 01 1 1 1 0 020 11 8 2 1 07 2 0 0 0 0−−−−−−Number at risk
+ ++++++++++++++++++++++++++++++++++++++++++++++++++++++++++++++++++++++++++++++++++++++++++++++++++++++++++++++++++++++++++
+++ ++
+ + ++
+
++ ++++ ++ +
0.00
0.25
0.50
0.75
1.00
0 2 4 6 8Time from diagnosis (years)
Prog
ress
ion
prob
abilit
y
++
++
++
TP53wt
TP53ab
TP53mut <1%
TP53ab 1−100%
TP53mut 1−100%
Del(17p)
246 174 103 61 29 31 1 0 0 0 015 11 9 5 4 01 1 1 1 0 020 11 8 2 1 07 2 0 0 0 0−−−−−−Number at risk
||
||||| ||||| |||||||||||||||||||||||||| ||| || |||| | |||||| ||| || ||||| |||| ||||||| |||| ||||||| |||||| | || || ||| | ||||||| || |||||| | ||| || |
|
| | | |
| | |
|
|
| | | ||| | | |
0.00
0.25
0.50
0.75
1.00
0 2 4 6 8Time from diagnosis (years)
Pro
gre
ssio
n p
rob
ab
ility
|
|
|
|
|
|
TP53wt
TP53ab
TP53mut <1%
TP53ab 1−100%
TP53mut 1−100% w/o del(17p)
Del(17p)
246 174 103 61 29 31 1 0 0 0 015 11 9 5 4 01 1 1 1 0 020 11 8 2 1 07 2 0 0 0 0−−−−−−Number at risk