Deep COVID DeteCT: an international experience on COVID-19 ...
13
Henry Ford Health System Henry Ford Health System Henry Ford Health System Scholarly Commons Henry Ford Health System Scholarly Commons Diagnostic Radiology Articles Diagnostic Radiology 12-1-2020 Deep COVID DeteCT: an international experience on COVID-19 Deep COVID DeteCT: an international experience on COVID-19 lung detection and prognosis using chest CT lung detection and prognosis using chest CT Edward H. Lee Jimmy Zheng Errol Colak Maryam Mohammadzadeh Golnaz Houshmand See next page for additional authors Follow this and additional works at: https://scholarlycommons.henryford.com/radiology_articles Recommended Citation Recommended Citation Lee EH, Zheng J, Colak E, Mohammadzadeh M, Houshmand G, Bevins N, Kitamura F, Altinmakas E, Reis E, Kim J, Klochko C, Han M, Moradian S, Mohammadzadeh A, Sharifian H, Hashemi H, Firouznia K, Ghanaati H, Gity M, Doğan H, Salehinejad H, Alves H, Seekins J, Abdala N, Atasoy Ç, Pouraliakbar H, Maleki M, Wong S, Yeom KW. Deep COVID DeteCT: an international experience on COVID-19 lung detection and prognosis using chest CT. npj Digital Medicine 2020; 4(1). This Article is brought to you for free and open access by the Diagnostic Radiology at Henry Ford Health System Scholarly Commons. It has been accepted for inclusion in Diagnostic Radiology Articles by an authorized administrator of Henry Ford Health System Scholarly Commons.
Transcript of Deep COVID DeteCT: an international experience on COVID-19 ...

Henry Ford Health System Henry Ford Health System
Henry Ford Health System Scholarly Commons Henry Ford Health System Scholarly Commons
Diagnostic Radiology Articles Diagnostic Radiology
12-1-2020
Deep COVID DeteCT: an international experience on COVID-19 Deep COVID DeteCT: an international experience on COVID-19
lung detection and prognosis using chest CT lung detection and prognosis using chest CT
Edward H. Lee
Jimmy Zheng
Errol Colak
Maryam Mohammadzadeh
Golnaz Houshmand
See next page for additional authors
Follow this and additional works at: https://scholarlycommons.henryford.com/radiology_articles
Recommended Citation Recommended Citation Lee EH, Zheng J, Colak E, Mohammadzadeh M, Houshmand G, Bevins N, Kitamura F, Altinmakas E, Reis E, Kim J, Klochko C, Han M, Moradian S, Mohammadzadeh A, Sharifian H, Hashemi H, Firouznia K, Ghanaati H, Gity M, Doğan H, Salehinejad H, Alves H, Seekins J, Abdala N, Atasoy Ç, Pouraliakbar H, Maleki M, Wong S, Yeom KW. Deep COVID DeteCT: an international experience on COVID-19 lung detection and prognosis using chest CT. npj Digital Medicine 2020; 4(1).
This Article is brought to you for free and open access by the Diagnostic Radiology at Henry Ford Health System Scholarly Commons. It has been accepted for inclusion in Diagnostic Radiology Articles by an authorized administrator of Henry Ford Health System Scholarly Commons.

Authors Authors Edward H. Lee, Jimmy Zheng, Errol Colak, Maryam Mohammadzadeh, Golnaz Houshmand, Nicholas Bevins, Felipe Kitamura, Emre Altinmakas, Eduardo Pontes Reis, Jae Kwang Kim, Chad Klochko, Michelle Han, Sadegh Moradian, Ali Mohammadzadeh, Hashem Sharifian, Hassan Hashemi, Kavous Firouznia, Hossien Ghanaati, Masoumeh Gity, Hakan Doğan, Hojjat Salehinejad, Henrique Alves, Jayne Seekins, Nitamar Abdala, Çetin Atasoy, Hamidreza Pouraliakbar, Majid Maleki, S. Simon Wong, and Kristen W. Yeom
This article is available at Henry Ford Health System Scholarly Commons: https://scholarlycommons.henryford.com/radiology_articles/239
ARTICLE OPEN
Deep COVID DeteCT: an international experience onCOVID-19 lung detection and prognosis using chest CTEdward H. Lee 1✉, Jimmy Zheng 1, Errol Colak 2, Maryam Mohammadzadeh3, Golnaz Houshmand 4, Nicholas Bevins5,Felipe Kitamura 6, Emre Altinmakas7, Eduardo Pontes Reis8, Jae-Kwang Kim 9, Chad Klochko 4, Michelle Han 1,Sadegh Moradian10, Ali Mohammadzadeh4, Hashem Sharifian3, Hassan Hashemi11, Kavous Firouznia 11, Hossien Ghanaati11,Masoumeh Gity11, Hakan Doğan 7, Hojjat Salehinejad2, Henrique Alves 6, Jayne Seekins1, Nitamar Abdala 6, Çetin Atasoy7,Hamidreza Pouraliakbar4, Majid Maleki4, S. Simon Wong12 and Kristen W. Yeom 1✉
The Coronavirus disease 2019 (COVID-19) presents open questions in how we clinically diagnose and assess disease course.Recently, chest computed tomography (CT) has shown utility for COVID-19 diagnosis. In this study, we developed Deep COVIDDeteCT (DCD), a deep learning convolutional neural network (CNN) that uses the entire chest CT volume to automatically predictCOVID-19 (COVID+) from non-COVID-19 (COVID−) pneumonia and normal controls. We discuss training strategies and differencesin performance across 13 international institutions and 8 countries. The inclusion of non-China sites in training significantlyimproved classification performance with area under the curve (AUCs) and accuracies above 0.8 on most test sites. Furthermore,using available follow-up scans, we investigate methods to track patient disease course and predict prognosis.
npj Digital Medicine (2021) 4:11 ; https://doi.org/10.1038/s41746-020-00369-1
INTRODUCTIONCoronavirus disease 2019 (COVID-19) caused by severe acuterespiratory syndrome corona virus 2 (SAR-Cov-2) has inflicted aglobal health crisis and was declared a pandemic in March 20201.The high transmission rates that can lead to respiratory distressand multiple organ failures, requisite critical care resources, andrising mortality2–4 have prompted an urgent need for earlydetection, accurate diagnosis, and predictive tools.Real-time reverse-transcription polymerase chain reaction (RT-
PCR) is the primary method for SAR-Cov-2 diagnosis. However, RT-PCR has shown variable sensitivity and specificity5–7 either due toinsufficient viral load, sample collection methods, or lack ofdefinitive reference standards8,9. Studies have reported character-istic imaging features of COVID-19 pneumonia10 and proposedchest CT to either complement RT-PCR or serve as the initialworkup in highly suspected cases given the potential for falsenegative RT-PCR11–13 and to gauge disease severity14,15.As the pandemic expands to global regions with limited access
to nucleic acid detection kits, chest CT may play a greaterdiagnostic role for COVID-19 and disease monitoring, highlightinga need for automated or quantitative analytics. Recently, studieshave reported success in deep learning methods with CT slices asinputs for COVID-19 classification16–18 or segmentation outputs toquantitate lung opacification and correlate disease severity19.Machine learning can capitalize on large-scale, high-dimensionalimage data and offers the opportunity to optimize a frameworkfor COVID-19 evaluation, including prognostic models that stratifyrisk groups. This study goal was to develop Deep COVID DeteCT orDCD, a 27-layer 3D model, which (1) classifies COVID-19
pneumonia (COVID+) from non-COVID-19 (COVID−) pneumoniaand normal lung, and (2) predicts disease course using chest CT.To the best of our knowledge, our study investigates one of thelargest and most diverse patient population, and compares anddiscusses differences in performance across 13 international sites.The study sites are shown in Figs. 1, 2. Patient characteristics foreach site is shown in Fig. 2.
● We designed a simple-to-use model (DCD) for classificationtrained and evaluated across 13 diverse sites from aroundthe world.
● We investigate generalizability across all 13 sites, and discussthe contribution of participants outside of China on modelperformance.
● We track the disease course of COVID+ confirmed patients byusing DCD features over time.
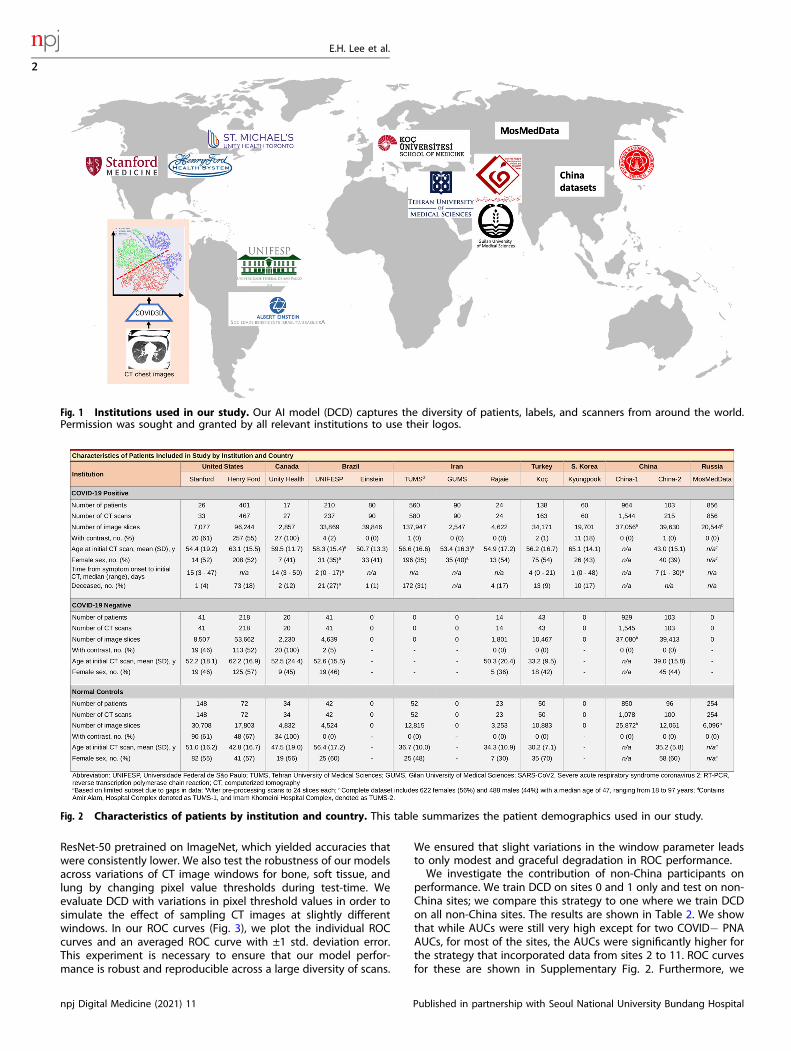
RESULTSA deep 3D model for classification using 13 internationalinstitutionsIn task 1, we report high accuracies and Area under the Curve(AUC) in Table 1 with Receiver Operating Characteristics (ROC)curves shown in Fig. 3. Table 1 shows multiple training, validation,and test configurations. For example, with test site ID 9, the modelis trained for 20 epochs and internally validated on all sites exceptHenry Ford, GUMS, and TUMS-2. After validation, the model isevaluated on the hold-out test site, Henry Ford. Our volumetric-based approach is also far superior to a 2D approach using a
1Department of Radiology, School of Medicine, Stanford University, Stanford, CA 94305, USA. 2Unity Health Toronto, University of Toronto, Toronto, ON M5S, Canada. 3Division ofRadiology, Amir Alam Hospital, Tehran University of Medical Sciences, Tehran, Iran. 4Rajaie Cardiovascular Medical and Research Center, Iran University of Medical Sciences,Tehran, Iran. 5Henry Ford Health System, Detroit, Michigan, USA. 6Universidade Federal de São Paulo (UNIFESP), São Paulo, Brazil. 7Department of Radiology, Koç UniversitySchool of Medicine, Istanbul, Turkey. 8Hospital Israelita Albert Einstein, São Paulo, Brazil. 9Department of Radiology, School of Medicine, Kyungpook National University, Daegu,Korea. 10School of Medicine, Tehran University of Medical Sciences, Tehran, Iran. 11Advanced Diagnostic and Interventional Radiology Research Center(ADIR), Medical ImagingCenter, Imam Khomeini Hospital Complex, Tehran University of Medical Sciences, Tehran, Iran. 12Department of Electrical Engineering, Stanford University, Stanford, CA 94305,USA. ✉email: [email protected]; [email protected]
www.nature.com/npjdigitalmed
Published in partnership with Seoul National University Bundang Hospital
1234567890():,;
ResNet-50 pretrained on ImageNet, which yielded accuracies thatwere consistently lower. We also test the robustness of our modelsacross variations of CT image windows for bone, soft tissue, andlung by changing pixel value thresholds during test-time. Weevaluate DCD with variations in pixel threshold values in order tosimulate the effect of sampling CT images at slightly differentwindows. In our ROC curves (Fig. 3), we plot the individual ROCcurves and an averaged ROC curve with ±1 std. deviation error.This experiment is necessary to ensure that our model perfor-mance is robust and reproducible across a large diversity of scans.
We ensured that slight variations in the window parameter leadsto only modest and graceful degradation in ROC performance.We investigate the contribution of non-China participants on
performance. We train DCD on sites 0 and 1 only and test on non-China sites; we compare this strategy to one where we train DCDon all non-China sites. The results are shown in Table 2. We showthat while AUCs were still very high except for two COVID− PNAAUCs, for most of the sites, the AUCs were significantly higher forthe strategy that incorporated data from sites 2 to 11. ROC curvesfor these are shown in Supplementary Fig. 2. Furthermore, we
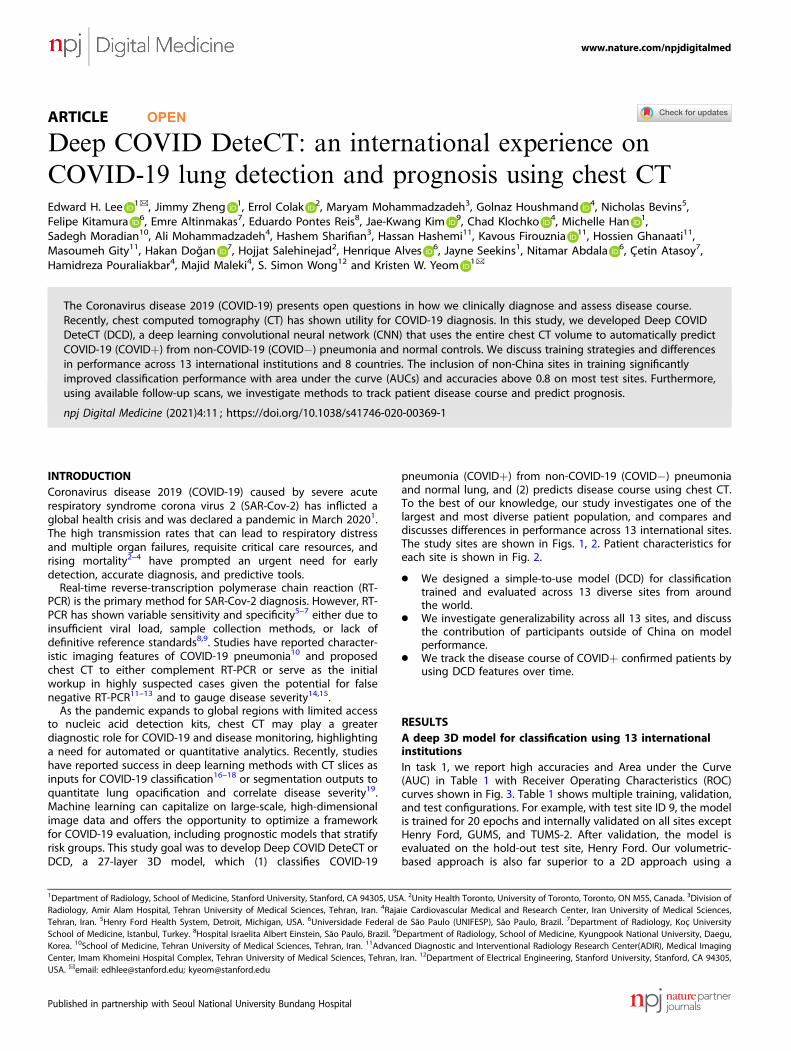
Fig. 1 Institutions used in our study. Our AI model (DCD) captures the diversity of patients, labels, and scanners from around the world.Permission was sought and granted by all relevant institutions to use their logos.
Fig. 2 Characteristics of patients by institution and country. This table summarizes the patient demographics used in our study.
E.H. Lee et al.
2
npj Digital Medicine (2021) 11 Published in partnership with Seoul National University Bundang Hospital
1234567890():,;
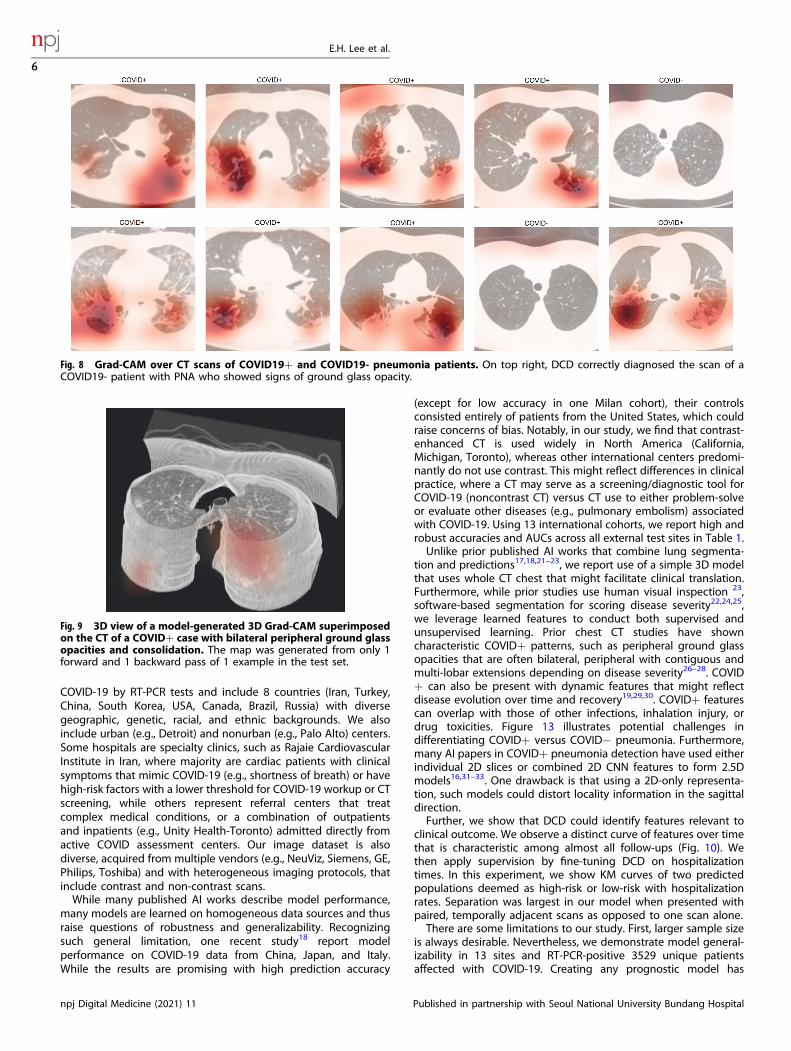
investigate the effect of fine-tuning by (1) training a model on aset of sites, and (2) fine-tuning the model on a small subset ofpatients from the test site of interest. For example, we train DCDon sites 1 to 11 and fine-tune and internally validate for amaximum of 20 epochs on 20% of China-1 patients. The testaccuracy on the remaining 80% of China-1 is 91.2%, whereas it is71.6% without fine-tuning (70.7% on all China-1). Similarly, wetrain on sites 0 to 10 and fine-tune on 20% of MosMedData. Fine-tuning boosts performance from 73.2% to 80.6%. This is likelybecause the model learned to capture large variations indemographic and data collection practices. For example,COVID+ cases from Einstein site were of mild severity whilethose of TUMS-2 were severe; in fact, one-third of TUMS-2COVID+ patients died. To illustrate this, we plot histograms ofpredictions for all COVID+ cases for Einstein (Fig. 4), GUMS (Fig. 5),and TUMS-2 (Fig. 6). COVID+ predictions from Einstein have lowerconfidence and higher variability than those of GUMS and TUMS-2. Next, we plot DCD features using t-distributed stochasticneighbor embedding (TSNE) (Fig. 7) to provide intuition of howthe diagnosis predictions are arranged in a high-dimensionalspace. Finally, we used DCD to generate gradient-based heatmaps20 (also known as Grad-CAM) on our external cohorts. InFig. 8, we illustrate examples of where the DCD features activatestrongly to key regions in the lungs. For example, in the COVID+patients, we see almost all the ground glass opacity lighting up. InCOVID− patients, COVID+ activation is limited. A 3D view of ourmodel’s heatmap on a COVID+ patient is shown in Fig. 9.
A method to describe disease trajectory and prognosis usinglearned featuresIn task 2, we deployed DCD on successive follow-up scans tomeasure DCD features over time. The goal was to track theprogression of each patient’s individual disease status in anunsupervised manner. Higher feature scores for a given scanmean that the scan appears more similar to COVID+ population.In Fig. 10, we compute features denoted as s(t) for follow-uppatients.We show in Fig. 10(a) that many of the patients’ scores
increased rapidly to a peak within 10 days. This was then followedby a gradual decline in COVID+ severity, which may indicatepatient recovery. Even at and beyond the end of theirhospitalization stay, many of the survivors’ lungs still containedfeatures characteristic of COVID+ active disease. We theorize that
we can use these features that map COVID+ severity over time topredict prognosis.We quantify prognosis by the length of hospitalization (in days)
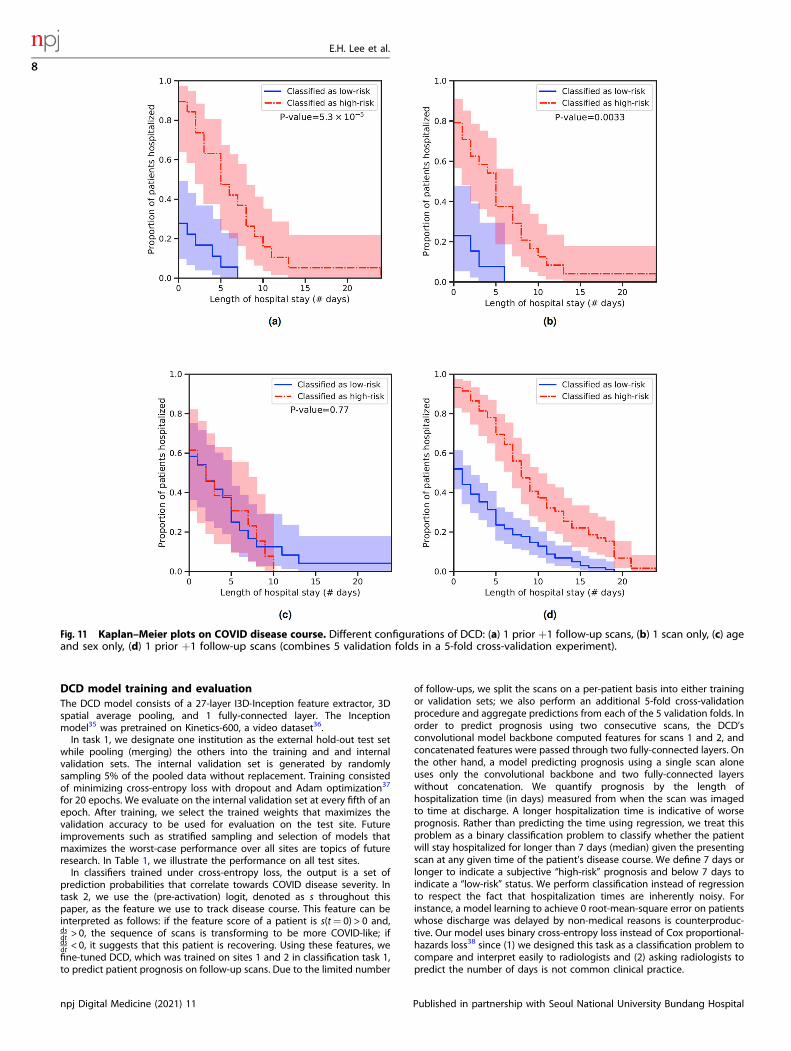
measured from when the scan was imaged to time at discharge. Alonger hospitalization window is indicative of worse prognosis.From our findings in Fig. 10, we expect that a large increase inDCD features over a short time window between 2 scans isindicative of a long hospitalization period and “high-risk”prognosis outcome. Similarly, a significant decrease in featuresover a short time indicates a low-risk prognosis. Features thatgrow in time but flatten out may also indicate low-risk.Furthermore, predicting prognosis is difficult with one scan alone,and knowing two scans may not be enough to tell when thepatient’s feature score will peak. Two of these scenarios are shownin the Supplementary Fig. 3. Our intuition tells us that modelstrained to predict prognosis on hospitalization times can do betterby looking at many sequential scans than just one scan alone. Inthe following experiments, we compared the prognostic perfor-mance of two scans (one prior and one follow-up) to onescan alone.In Fig. 11 Kaplan–Meier (KM) are plotted on validation sets for
different model configurations. The models stratify the patientsinto one of two groups: high-risk or low-risk. The first model (a)uses 2 sequential scans (one prior and one follow-up study) asinputs, while the second model (b) uses only one scan. We achievegreater separation using two sequential scans (log-rank P= 5.3 ×10⁻⁵). We achieve poor separation for a model trained using onlyage and sex as inputs (c). As an extension of (a), we perform 5-foldcross-validation and aggregate all 5 validation fold predictions inone KM plot. Finally, in order to account for any human-biasbetween discharge time and length of time between scans, wetrain a model using only the length of time as input (i.e., noimages). This yields poor separation with P= 0.27.To qualitatively assess the disease course of follow-up scans, we
present heat maps that attend to regions in three dimensions inspace and one in time. The Grad CAM20 of a 2D image, H(x, y),reveal pixels that activate strongly to the predicted class. H(x, y) isnormalized throughout the entire (x, y)-plane from 0 to 1 for allpixel values (x, y). In our work, because we aim to track the diseasetrajectory from one scan to the next, we choose not to normalizewith respect to one scan alone. Instead, we multiply the gradientmaps by the feature score computed in Fig. 10. We compute anew map, H(x, y, z, t), across both space and time. This does two
Table 1. Performance on all test sites.
Test site ID Institution Train/Val. sites Normals AUC COVID− PNA AUC COVID+ AUC Accuracy
0 China-1 1,..,11 0.948 0.741 0.858 0.707
1 China-2 0,2,...,11 0.988 0.80 0.908 0.789
2 Kyungpook 0,1,3,..,11 N/A N/A N/A 0.921
3 Stanford 0,..,2,4,..,11 0.952 0.831 0.93 0.804
4 Unity Health 0,..,3,5,..,11 0.98 0.829 0.914 0.775
5 Koç 0,..,4,6,..,11 0.948 0.776 0.909 0.779
6 Rajaie 0,..,5,7,..,11 0.984 0.811 0.858 0.767
7 Einstein 0,..,6,8,..,11 N/A N/A N/A 0.915
8 UNIFESP 0,..,7,9,..,11 0.987 0.895 0.916 0.828
9 Henry Ford 0,..,8,10,..,11 0.986 0.830 0.889 0.76
10 TUMS-1 0,..,9,11 0.978 N/A 0.933 0.881
11 MosMedData 0,..,10 0.806 N/A 0.808 0.747
12 GUMS 0,..,11 N/A N/A N/A 0.944
13 TUMS-2 0,..,11 N/A N/A N/A 0.974
Entries with N/A are due to class imbalance.
E.H. Lee et al.
3
Published in partnership with Seoul National University Bundang Hospital npj Digital Medicine (2021) 11
1234567890():,;

Fig. 3 Receiver operating characteristics (ROC) curves and area under the curve (AUC) for different external test sites. The sites are: China-1 (a), China-2 (b), Stanford (c), Unity Health (d), Koç (e), Rajaie (f), UNIFESP (g), Henry Ford (h), TUMS-1 (i), MosMedData (j). ROC curves were notplotted for sites with imbalanced data: Kyungpook, GUMS, and TUMS-2. The confusion matrix for our model trained on all sites and finetunedon 20% of site China-1 (15% train, 5% validation) and evaluated on the remaining 80% of China-1 (k).
E.H. Lee et al.
4
npj Digital Medicine (2021) 11 Published in partnership with Seoul National University Bundang Hospital

things: (1) scales the scan’s attention map by the degree of COVIDseverity at time t relative to all time points, and (2) providesdirection information for when the CT becomes less similar toCOVID+ data distribution. In Fig. 12, we plot H(x, y, z, t) on a 24year old patient who had 5 scans in the course of 50 days. On day13, the patient was discharged. The feature score s(t= 12) at day12’s scan is almost 0, which is why H(x, y, z, t= 12) ≈ 0.
DISCUSSIONTo the best of our knowledge, our study investigates one of thelargest and most diverse patient population confirmed to have
Table 2. Performance of model trained on sites 0 and 1 versus a model trained on all sites.
Test Site Institution Train/Val. Sites Normals AUC COVID− PNA AUC COVID+ AUC
3 Stanford 0,1 0.898 0.741 0.906
3 Stanford 0,..,2,4,..,11 0.952 0.831 0.93
4 Unity Health 0,1 0.844 0.603 0.859
4 Unity Health 0,..,3,5,..,11 0.98 0.829 0.914
5 Koç 0,1 0.875 0.351 0.822
5 Koç 0,..,4,6,..,11 0.948 0.776 0.909
6 Rajaie 0,1 0.903 0.775 0.724
6 Rajaie 0,..,5,7,..,11 0.984 0.811 0.858
8 UNIFESP 0,1 0.929 0.347 0.928
8 UNIFESP 0,..,7,9,..,11 0.987 0.895 0.916
9 Henry Ford 0,1 0.967 0.620 0.874
9 Henry Ford 0,..,8,10,..,11 0.986 0.830 0.889
10 TUMS-1 0,1 0.948 N/A 0.947
10 TUMS-1 0,..,9,11 0.978 N/A 0.933
11 MosMedData 0,1 0.636 N/A 0.604
11 MosMedData 0,..,10 0.806 N/A 0.808
Fig. 4 DCD predictions for Site 7. Histogram of model outputs onexternal hold-out test site 7 (Einstein) with only COVID+ cases.
Fig. 5 DCD predictions for Site 12. Histogram of model outputs onexternal hold-out test site 12 (GUMS) with only COVID+ cases.
Fig. 6 DCD predictions for Site 13. Histogram of model outputs onexternal hold-out test site 13 (TUMS-2) with only COVID+ cases.
Fig. 7 Two-dimensional manifold of features generated usingt-distributed stochastic neighbor embedding (TSNE) on the DCDmodel. DCD evaluated on the test set of China-1 (80% of China-1). Itwas trained on sites 1 to 11 and finetuned on the training set ofChina-1 (20% of China-1).
E.H. Lee et al.
5
Published in partnership with Seoul National University Bundang Hospital npj Digital Medicine (2021) 11
COVID-19 by RT-PCR tests and include 8 countries (Iran, Turkey,China, South Korea, USA, Canada, Brazil, Russia) with diversegeographic, genetic, racial, and ethnic backgrounds. We alsoinclude urban (e.g., Detroit) and nonurban (e.g., Palo Alto) centers.Some hospitals are specialty clinics, such as Rajaie CardiovascularInstitute in Iran, where majority are cardiac patients with clinicalsymptoms that mimic COVID-19 (e.g., shortness of breath) or havehigh-risk factors with a lower threshold for COVID-19 workup or CTscreening, while others represent referral centers that treatcomplex medical conditions, or a combination of outpatientsand inpatients (e.g., Unity Health-Toronto) admitted directly fromactive COVID assessment centers. Our image dataset is alsodiverse, acquired from multiple vendors (e.g., NeuViz, Siemens, GE,Philips, Toshiba) and with heterogeneous imaging protocols, thatinclude contrast and non-contrast scans.While many published AI works describe model performance,
many models are learned on homogeneous data sources and thusraise questions of robustness and generalizability. Recognizingsuch general limitation, one recent study18 report modelperformance on COVID-19 data from China, Japan, and Italy.While the results are promising with high prediction accuracy
(except for low accuracy in one Milan cohort), their controlsconsisted entirely of patients from the United States, which couldraise concerns of bias. Notably, in our study, we find that contrast-enhanced CT is used widely in North America (California,Michigan, Toronto), whereas other international centers predomi-nantly do not use contrast. This might reflect differences in clinicalpractice, where a CT may serve as a screening/diagnostic tool forCOVID-19 (noncontrast CT) versus CT use to either problem-solveor evaluate other diseases (e.g., pulmonary embolism) associatedwith COVID-19. Using 13 international cohorts, we report high androbust accuracies and AUCs across all external test sites in Table 1.Unlike prior published AI works that combine lung segmenta-
tion and predictions17,18,21–23, we report use of a simple 3D modelthat uses whole CT chest that might facilitate clinical translation.Furthermore, while prior studies use human visual inspection 23,software-based segmentation for scoring disease severity22,24,25,we leverage learned features to conduct both supervised andunsupervised learning. Prior chest CT studies have showncharacteristic COVID+ patterns, such as peripheral ground glassopacities that are often bilateral, peripheral with contiguous andmulti-lobar extensions depending on disease severity26–28. COVID+ can also be present with dynamic features that might reflectdisease evolution over time and recovery19,29,30. COVID+ featurescan overlap with those of other infections, inhalation injury, ordrug toxicities. Figure 13 illustrates potential challenges indifferentiating COVID+ versus COVID− pneumonia. Furthermore,many AI papers in COVID+ pneumonia detection have used eitherindividual 2D slices or combined 2D CNN features to form 2.5Dmodels16,31–33. One drawback is that using a 2D-only representa-tion, such models could distort locality information in the sagittaldirection.Further, we show that DCD could identify features relevant to
clinical outcome. We observe a distinct curve of features over timethat is characteristic among almost all follow-ups (Fig. 10). Wethen apply supervision by fine-tuning DCD on hospitalizationtimes. In this experiment, we show KM curves of two predictedpopulations deemed as high-risk or low-risk with hospitalizationrates. Separation was largest in our model when presented withpaired, temporally adjacent scans as opposed to one scan alone.There are some limitations to our study. First, larger sample size
is always desirable. Nevertheless, we demonstrate model general-izability in 13 sites and RT-PCR-positive 3529 unique patientsaffected with COVID-19. Creating any prognostic model has
Fig. 8 Grad-CAM over CT scans of COVID19+ and COVID19- pneumonia patients. On top right, DCD correctly diagnosed the scan of aCOVID19- patient with PNA who showed signs of ground glass opacity.
Fig. 9 3D view of a model-generated 3D Grad-CAM superimposedon the CT of a COVID+ case with bilateral peripheral ground glassopacities and consolidation. The map was generated from only 1forward and 1 backward pass of 1 example in the test set.
E.H. Lee et al.
6
npj Digital Medicine (2021) 11 Published in partnership with Seoul National University Bundang Hospital

inherent challenges such as the existence of many complexclinical variables. We do not examine the effects of differenttherapies, which is beyond the scope of this study.In conclusion, we present DCD, a single 3D model that
diagnoses and tracks disease course over hospitalization withoutthe aid of complex preprocessing. We leverage transfer learningfrom Kinetics video dataset for classification; we show robustgeneralizability across diverse international cohorts. We showindicative patterns in DCD features that correlate with the patientoutcome. Finally, we show heat maps that highlight the visualprogression of a patient’s disease trajectory over time.
METHODSMulti-center datasetWe conducted a multi-center retrospective study across 13 institutionsincluding 2 COVID+ datasets from China17 and 1 from Russia34.Institutional review board (IRB) at participating hospitals approved thisretrospective study with waiver of consent. Waiver of consent wasgranted by the IRB for the following reasons: (1) The research involves nomore than minimal risk to the participants because it involves materials(data, documents, records) that have been or will be collected, andprecautions will be taken to ensure that confidentiality is maintained, (2)the waiver will not adversely affect the rights and welfare of theparticipants because procedures are in place to protect confidentiality,and (3) information learned during the study will not affect thetreatment of participants. Patient demographics are summarized inFig. 2. The following represents the inclusion criteria: patients presentedwith clinical symptoms suspicious for COVID-19 pneumonia, obtained at
least one confirmatory real time RT-PCR tests to determine COVID-19status, and obtained diagnostic quality chest CT. For RT-PCR testing,samples of respiratory secretions from bronchoalveolar lavage, endo-tracheal aspirate, nasopharyngeal or oropharyngeal swabs were used.Scanner models and slice thicknesses for participating institutions areshown in Supplementary Fig. 1.
Image preprocessingAll raw data from institutions except for China-1 and MosMedData wereprovided in Digital Imaging and Communications in Medicine (DICOM)format. The majority of the patient DICOMs contained dynamic range ofpixel intensities consistent with that of a lung window. Patient DICOMseries were collected and scaled to 256 × 256 pixels. DCD was designed tosample 24 planes evenly across the lung. To accommodate a large range ofslice thickness (1 to 5-mm), DCD uniformly sub-samples across the sagittalplane until 24 approximately-equidistant slices are extracted per patient.For data augmentation during training, we also generate additional 24-plane samples by applying random jitter in the depth dimension. Finally,before each 24 × 256 × 256 image is fed into the model for training, weapply a clipping function that truncates all Hounsfield unit intensity valuesabove a fixed pre-determined value. This was to ensure that largeHounsfield Unit values outside the lung (e.g., bone) does not saturate andoverwhelm the signal from the lung. During training, we randomlycropped images to 240 × 240 and resized them back to 256 × 256,performed random flipping in the x and y directions, and applied randomjitter in the depth dimension. During test-time, we measure ROC curvesand AUCs across different clipping values (±6.25% jitter) to simulate theeffect of sampling CT images at slightly different windows.
Fig. 10 Features from DCD for the follow-up patients over time. Scans with high scores indicate high similarity to the COVID+ PNApopulation. Many patients show a representative feature trajectory with increasing COVID+ PNA intensity peaking near the time of dischargefollowed by a subsequent decrease after discharge. a Time-series of COVID-19 survivors with 2 or more follow-up scans, and (b) 3D plot ofselected survivor scores that reveal similar trajectories.
E.H. Lee et al.
7
Published in partnership with Seoul National University Bundang Hospital npj Digital Medicine (2021) 11
DCD model training and evaluationThe DCD model consists of a 27-layer I3D-Inception feature extractor, 3Dspatial average pooling, and 1 fully-connected layer. The Inceptionmodel35 was pretrained on Kinetics-600, a video dataset36.In task 1, we designate one institution as the external hold-out test set
while pooling (merging) the others into the training and and internalvalidation sets. The internal validation set is generated by randomlysampling 5% of the pooled data without replacement. Training consistedof minimizing cross-entropy loss with dropout and Adam optimization37
for 20 epochs. We evaluate on the internal validation set at every fifth of anepoch. After training, we select the trained weights that maximizes thevalidation accuracy to be used for evaluation on the test site. Futureimprovements such as stratified sampling and selection of models thatmaximizes the worst-case performance over all sites are topics of futureresearch. In Table 1, we illustrate the performance on all test sites.In classifiers trained under cross-entropy loss, the output is a set of
prediction probabilities that correlate towards COVID disease severity. Intask 2, we use the (pre-activation) logit, denoted as s throughout thispaper, as the feature we use to track disease course. This feature can beinterpreted as follows: if the feature score of a patient is s(t= 0) > 0 and,dsdt > 0, the sequence of scans is transforming to be more COVID-like; ifdsdt < 0, it suggests that this patient is recovering. Using these features, wefine-tuned DCD, which was trained on sites 1 and 2 in classification task 1,to predict patient prognosis on follow-up scans. Due to the limited number
of follow-ups, we split the scans on a per-patient basis into either trainingor validation sets; we also perform an additional 5-fold cross-validationprocedure and aggregate predictions from each of the 5 validation folds. Inorder to predict prognosis using two consecutive scans, the DCD’sconvolutional model backbone computed features for scans 1 and 2, andconcatenated features were passed through two fully-connected layers. Onthe other hand, a model predicting prognosis using a single scan aloneuses only the convolutional backbone and two fully-connected layerswithout concatenation. We quantify prognosis by the length ofhospitalization time (in days) measured from when the scan was imagedto time at discharge. A longer hospitalization time is indicative of worseprognosis. Rather than predicting the time using regression, we treat thisproblem as a binary classification problem to classify whether the patientwill stay hospitalized for longer than 7 days (median) given the presentingscan at any given time of the patient’s disease course. We define 7 days orlonger to indicate a subjective “high-risk” prognosis and below 7 days toindicate a “low-risk” status. We perform classification instead of regressionto respect the fact that hospitalization times are inherently noisy. Forinstance, a model learning to achieve 0 root-mean-square error on patientswhose discharge was delayed by non-medical reasons is counterproduc-tive. Our model uses binary cross-entropy loss instead of Cox proportional-hazards loss38 since (1) we designed this task as a classification problem tocompare and interpret easily to radiologists and (2) asking radiologists topredict the number of days is not common clinical practice.
Fig. 11 Kaplan–Meier plots on COVID disease course. Different configurations of DCD: (a) 1 prior +1 follow-up scans, (b) 1 scan only, (c) ageand sex only, (d) 1 prior +1 follow-up scans (combines 5 validation folds in a 5-fold cross-validation experiment).
E.H. Lee et al.
8
npj Digital Medicine (2021) 11 Published in partnership with Seoul National University Bundang Hospital
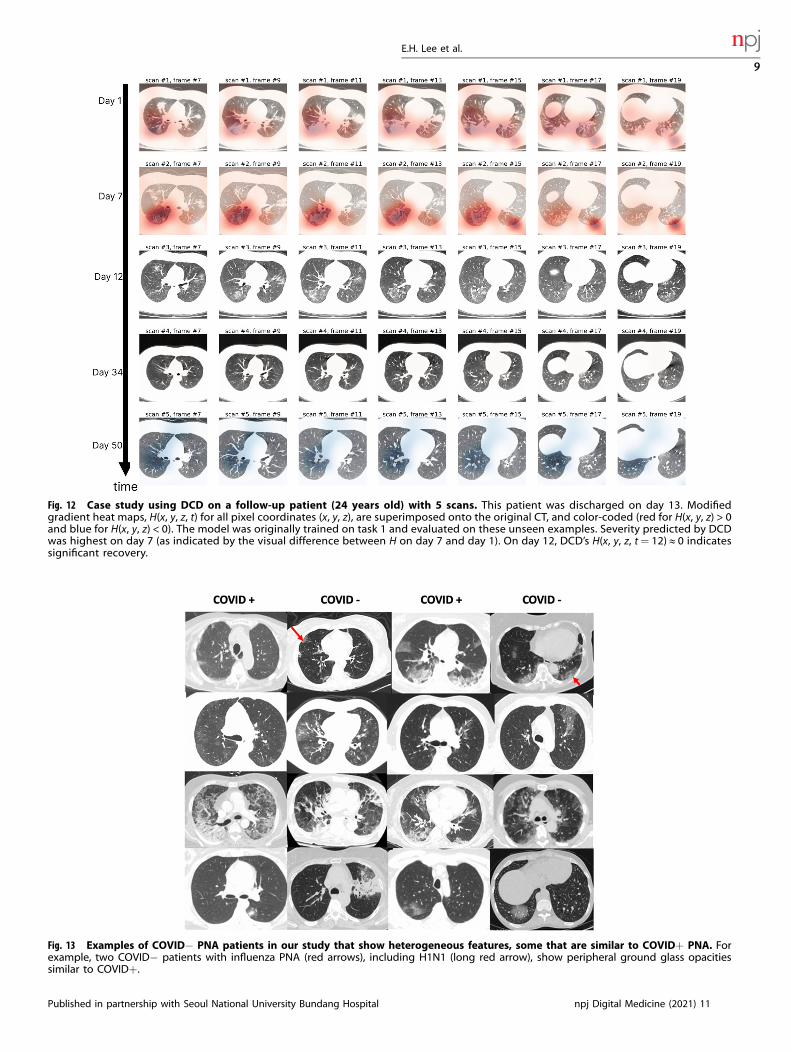
Fig. 12 Case study using DCD on a follow-up patient (24 years old) with 5 scans. This patient was discharged on day 13. Modifiedgradient heat maps, H(x, y, z, t) for all pixel coordinates (x, y, z), are superimposed onto the original CT, and color-coded (red for H(x, y, z) > 0and blue for H(x, y, z) < 0). The model was originally trained on task 1 and evaluated on these unseen examples. Severity predicted by DCDwas highest on day 7 (as indicated by the visual difference between H on day 7 and day 1). On day 12, DCD’s H(x, y, z, t= 12) ≈ 0 indicatessignificant recovery.
Fig. 13 Examples of COVID− PNA patients in our study that show heterogeneous features, some that are similar to COVID+ PNA. Forexample, two COVID− patients with influenza PNA (red arrows), including H1N1 (long red arrow), show peripheral ground glass opacitiessimilar to COVID+.
E.H. Lee et al.
9
Published in partnership with Seoul National University Bundang Hospital npj Digital Medicine (2021) 11

Reporting summaryFurther information on research design is available in the Nature ResearchReporting Summary linked to this article.
DATA AVAILABILITYNot all the datasets generated and analyzed during the study are currently publiclyavailable. Datasets from Stanford, Koç, Unity Health, and UNIFESP have beensubmitted to the Radiological Society North America for public release: RSNAInternational COVID-19 Open Radiology Database (RICORD)39, and will be publiclyavailable in the near future.
CODE AVAILABILITYWe plan to open-source code at a future date with incremental public updates as weobtain more results and data. Please check in https://github.com/edhlee/Deep-COVID-DeteCT for updates.
Received: 15 May 2020; Accepted: 13 November 2020;
REFERENCES1. Zhou, P. et al. A pneumonia outbreak associated with a new coronavirus of
probable bat origin. Nature 579, 270–273 (2020).2. Chen, N. et al. Epidemiological and clinical characteristics of 99 cases of 2019
novel Coronavirus Pneumonia in Wuhan, China: a descriptive study. Lancet 395,507–513 (2020).
3. Wang, D. et al. Clinical characteristics of 138 hospitalized patients with 2019Novel Coronavirus-infected Pneumonia in Wuhan, China. JAMA 323, 1061–1069(2020).
4. Li, Q. et al. Early transmission dynamics in Wuhan, China, of novel Coronavirus-Infected Pneumonia. New Engl. J. Med. 382, 1199–1207 (2020).
5. Liu, R. et al. Positive rate of RT-PCR detection of SARS-CoV-2 infection in 4880cases from one hospital in Wuhan, China, from Jan to Feb 2020. Clinica chimicaacta; international journal of clinical chemistry 505, 172–175 (2020).
6. Wang, W. et al. Detection of SARS-COV-2 in different types of clinical specimens.JAMA 11, 1843–1844 (2020).
7. Pan, J. et al. Potential rapid diagnostics, vaccine and therapeutics for 2019 novelCoronavirus (2019-ncov): a systemic review. J. Clin. Med. 26, 3 (2020).
8. Pulia, M. S., O'Brien, T. P., Hou, P. C., Schuman, A. & Sambursky, R. Multi-tieredscreening and diagnosis strategy for COVID-19: a model for sustainable testingcapacity in response to pandemic. Ann. Med. 52, 207–214 (2020).
9. Omer, S. B., Malani, P. & del Rio, C. The COVID-19 pandemic in the us: a clinicalupdate. JAMA 323, 1767–1768 (2020).
10. Xu, Y. H. et al. Clinical and computed tomographic imaging features of novelCoronavirus Pneumonia caused by SARS-COV-2. J. Infect. Dis. 80, 394–400(2020).
11. Xie, Z. et al. Chest CT for Typical Coronavirus Disease 2019 (COVID-19) Pneu-monia: Relationship to Negative RT-PCR Testing. Radiology 296, E41–E45(2020).
12. Ai, T. et al. Correlation of Chest CT and RT-PCR Testing for Coronavirus Disease2019 (COVID-19) in China: A Report of 1014 Cases. Radiology 296, E32–E40 (2020).
13. Yang, W. et al. The role of imaging in 2019 novel Coronavirus Pneumonia (COVID-19). Eur. Radiol. 30, 4874–4882 (2020).
14. Liu, K. C. et al. CT manifestations of Coronavirus disease-2019: a retrospectiveanalysis of 73 cases by disease severity. Eur. J. Radiol. 126, 108941 (2020).
15. Li, K. et al. The clinical and chest CT features associated with severe and criticalCOVID-19 Pneumonia. Invest. Radiol. 55, 327–331 (2020).
16. Li, L. et al. Using artificial intelligence to detect COVID-19 and community-acquired pneumonia based on pulmonary CT: evaluation of the diagnosticaccuracy. Radiology 296, E65–E71 (2020).
17. Zhang, K. et al. Clinically Applicable AI System for Accurate Diagnosis, Quanti-tative Measurements, and Prognosis of COVID-19 Pneumonia Using ComputedTomography. Cell 181, 1423–1433.e1–e11 (2020).
18. Harmon, S. A. et al. Artificial intelligence for the detection of COVID-19 pneu-monia on chest CT using multinational datasets. Nat. Commun. 11, 1–7 (2020).
19. Huang, L. et al. Serial quantitative chest ct assessment of covid-19: Deep-learningapproach. Radiol. Cardiothor. Imaging 2, e200075 (2020).
20. Selvaraju, R. et al. Grad-cam: visual explanations from deep networks viagradient-based localization. In Proceedings of the IEEE International Conference onComputer Vision. pp. 618–626 (IEEE, 2017).
21. Wu, X. et al. Deep learning-based multi-view fusion model for screening 2019novel Coronavirus Pneumonia: a multicenter study. Eur. J. Radiol. 128, 109041(2020).
22. Li, Z. et al. From community-acquired pneumonia to COVID-19: a deep learning-based method for quantitative analysis of covid-19 on thick-section CT scans. Eur.Radiol. 30, 6828–6837 (2020).
23. Wang, S. et al. A fully automatic deep learning system for COVID-19 diagnosticand prognostic analysis. Eur. Respiratory J. 56, 2000775 (2020).
24. Lessmann, N. et al. Automated assessment of COVID-19 reporting and datasystem and chest CT severity scores in patients suspected of having COVID-19using artificial intelligence. Radiology 298, E18–E28 (2021).
25. Pu, J. et al. Automated quantification of covid-19 severity and progression usingchest CT images. Eur. Radiol. 31, 436–446 (2020).
26. Chung, M. et al. CT imaging features of 2019 novel Coronavirus (2019-nCOV).Radiology 295, 202–207 (2020).
27. Saleh, S. et al. Coronavirus disease 2019 (COVID-19): a systematic review ofimaging findings in 919 patients. Am. J. Roentgenol. 14, 1–7 (2020).
28. Song, F. et al. Emerging Coronavirus 2019-nCOV pneumonia. Radiology 295,210–217 (2020).
29. Wang, Y. et al. Temporal changes of CT findings in 90 patients with Covid-19Pneumonia: a longitudinal study. Radiology 296, E55–E64 (2020).
30. Pan, F. et al. Time Course of Lung Changes at Chest CT during Recovery fromCoronavirus Disease 2019 (COVID-19). Radiology 295, 715–721 (2020).
31. Song, J. et al. End-to-end automatic differentiation of the coronavirus disease2019 (COVID-19) from viral pneumonia based on chest CT. Eur. J. Nucl. Med. Mol.Imaging 47, 2516–2524 (2020).
32. Singh, D. et al. Classification of covid-19 patients from chest ct images usingmulti-objective differential evolution-based convolutional neural networks. Eur. J.Clin. Microbiol. Infect. Dis.: official publication of the European Society of ClinicalMicrobiology 39, 1379–1389 (2020).
33. Jaiswal, A., Gianchandani, N., Singh, D., Kumar, V. & Kaur, M. Classification of thecovid-19 infected patients using densenet201 based deep transfer learning. J.Biomol. Structure Dynam. 1–8. Advance online publication (2020).
34. Morozov, S. P. et al. MosMedData: chest CT scans with COVID-19 related findingsdataset. (2020).
35. Tsang, S. H. Review: GoogLeNet (Inception v1)–Winner of ILSVRC 2014 (ImageClassification) (2018).
36. Carreira, J. & Zisserman, A. Quo vadis, action recognition? a new model and thekinetics dataset. In Proceedings of the IEEE Conference on Computer Vision andPattern Recognition. 6299–6308 (IEEE, 2017).
37. Kingma, D. P. & Ba, J. Adam: A Method for Stochastic Optimization. In 3rdInternational Conference on Learning Representations (Bengio, Y. and LeCun, Y.eds) (ICLR, San Diego, 2015).
38. Davidson-Pilon, C. Lifelines: survival analysis in Python. J Open Source Software1317 (2019).
39. COVID-19 RICORD - RSNA. RSNA International COVID-19 open radiology database.https://www.rsna.org/en/covid-19/COVID-19-RICORD (2020).
ACKNOWLEDGEMENTSStanford Chemistry, Engineering and Medicine for Human Health (ChEM-H) RISEprogram provided funding support for this study. We thank Stanford Center forArtificial Intelligence in Medicine and Imaging (AIMI) for their support on StanfordAIMI and Hospital Israelita Albert Einstein research partnership.
AUTHOR CONTRIBUTIONSConception of the study by E.L., E.C., K.Y.; experiments done by E.L.; data preparationby E.L., J.Z., M.M., G.H., F.K., E.A., N.B., J.L., C.K., S.M., E.R., E.C., K.Y., H.D., E.R., E.C., K.Y.
COMPETING INTERESTSThe authors declare no competing interests.
ADDITIONAL INFORMATIONSupplementary information is available for this paper at https://doi.org/10.1038/s41746-020-00369-1.
Correspondence and requests for materials should be addressed to E.H.L. or K.W.Y.
Reprints and permission information is available at http://www.nature.com/reprints
E.H. Lee et al.
10
npj Digital Medicine (2021) 11 Published in partnership with Seoul National University Bundang Hospital
Publisher’s note Springer Nature remains neutral with regard to jurisdictional claimsin published maps and institutional affiliations.
Open Access This article is licensed under a Creative CommonsAttribution 4.0 International License, which permits use, sharing,
adaptation, distribution and reproduction in anymedium or format, as long as you giveappropriate credit to the original author(s) and the source, provide a link to the Creative
Commons license, and indicate if changes were made. The images or other third partymaterial in this article are included in the article’s Creative Commons license, unlessindicated otherwise in a credit line to the material. If material is not included in thearticle’s Creative Commons license and your intended use is not permitted by statutoryregulation or exceeds the permitted use, you will need to obtain permission directlyfrom the copyright holder. To view a copy of this license, visit http://creativecommons.org/licenses/by/4.0/.
© The Author(s) 2021
E.H. Lee et al.
11
Published in partnership with Seoul National University Bundang Hospital npj Digital Medicine (2021) 11