
deconstructing mobile & tablet gaming 2015 -...
42
DECONSTRUCTING MOBILE & TABLET GAMING 2015 EEDAR 2015 SYNDICATED REPORT - FREE VERSION CONTACT For full report pricing and more information contact Cooper Waddell at [email protected] or visit http://www.eedar.com/Contact.aspx
Transcript of deconstructing mobile & tablet gaming 2015 -...

DECONSTRUCTING MOBILE & TABLET GAMING 2015EEDAR 2015 SYNDICATED REPORT - FREE VERSION
CONTACTFor full report pricing and more information contact Cooper Waddell at [email protected] or visit http://www.eedar.com/Contact.aspx

2© COPYRIGHT 2015. ELECTRONIC ENTERTAINMENT DESIGN AND RESEARCH. PROPRIETARY AND CONFIDENTIAL.
TERMS OF USE
THIS REPORT IS PROVIDED ON AN “AS IS” BASIS WITHOUT WARRANTIES OF ANY KIND, EITHER EXPRESS OR IMPLIED, INCLUDING WARRANTIES OF MERCHANTABILITY OR FITNESS FOR A PARTICULAR PURPOSE, OTHER THAN THOSE WARRANTIES WHICH ARE IMPLIED BY AND INCAPABLE OF EXCLUSION, RESTRICTION OR MODIFICATION UNDER THE LAWS APPLICABLE TO THE MASTER AGREEMENT FOR SERVICES.
THE FOLLOWING DISCLAIMER OF LIABILITY APPLIES TO ANY DAMAGES OR INJURY CAUSED BY ANY ERROR, OMISSION, DELETION, DEFECT OR USE OF, WHETHER FOR BREACH OF CONTRACT, TORTUOUS BEHAVIOR, NEGLIGENCE, OR UNDER ANY OTHER CAUSE OF ACTION:
IN NO EVENT WILL ELECTRONIC ENTERTAINMEI NT DESIGN AND RESEARCH OR ANY PERSON OR ENTITY INVOLVED IN CREATING, PRODUCING OR DISTRIBUTING THIS REPORT BE LIABLE FOR ANY DIRECT, INDIRECT, INCIDENTAL, SPECIAL OR CONSEQUENTIAL DAMAGES ARISING OUT OF THE USE OF OR INABILITY TO USE THE REPORT OR OUT OF THE BREACH OF ANY WARRANTY; YOU HEREBY ACKNOWLEDGE THAT THIS DISCLAIMER OF LIABILITY SHALL APPLY TO ALL CONTENT CONTAINED IN THIS REPORT. ELECTRONIC ENTERTAINMENT DESIGN AND RESEARCH’S LIABILITY TO YOU, IF ANY, SHALL IN NO EVENT EXCEED THE TOTAL AMOUNT PAID TO ELECTRONIC ENTERTAINMENT DESIGN AND RESEARCH FOR THE REPORT.
IT IS YOUR RESPONSIBILITY TO EVALUATE THE ACCURACY, COMPLETENESS OR USEFULNESS OF ANY INFORMATION, OPINION, ADVICE OR OTHER CONTENT AVAILABLE IN THIS REPORT. YOU SHOULD USE YOUR BEST JUDGMENT AND EXERCISE CAUTION WHERE APPROPRIATE.
NEITHER ELECTRONIC ENTERTAINMENT DESIGN AND RESEARCH NOR ITS THIRD PARTY CONTENT PROVIDERS SHALL HAVE ANY LIABILITY FOR DECISIONS BASED UPON, OR THE RESULTS OBTAINED FROM THE REPORT. NEITHER ELECTRONIC ENTERTAINMENT DESIGN AND RESEARCH NOR ITS THIRD PARTY CONTENT PROVIDERS GUARANTEE OR WARRANT THE ACCURACY OR COMPLETENESS OF ANY SUCH INFORMATION.
YOU AGREE TO DEFEND, INDEMNIFY AND HOLD HARMLESS ELECTRONIC ENTERTAINMENT DESIGN AND RESEARCH, ITS AFFILIATES AND THEIR RESPECTIVE DIRECTORS, OFFICERS, EMPLOYEES AND AGENTS FROM AND AGAINST ALL CLAIMS AND EXPENSES, INCLUDING ATTORNEYS’ FEES, ARISING OUT OF THE USE BY YOU OF THE REPORT.

3© COPYRIGHT 2015 ELECTRONIC ENTERTAINMENT DESIGN AND RESEARCH. PROPRIETARY AND CONFIDENTIAL.
TABLE OF CONTENTS
REPORT OVERVIEW 5
TERMINOLOGY 7
MOBILE GAMING GENRES 8
MOBILE GAMING MARKET OVERVIEW 10
2015 MOBILE GAMING MARKET 11
WHO IS PLAYING? 12
WHAT ARE THEY PLAYING ON? 13
WHAT IS THEIR PRIMARY OS? 14
HOW DO THEY USE THEIR DEVICES? 15
WHERE DO THEY PLAY GAMES? 17
HOW DO THEY PLAY? 19
HOW DO THEY SPEND? 20
WHAT IS THEIR OVERALL INVESTMENT? 21
WHY DO THEY PLAY MOBILE GAMES? 22
MOBILE GAMING FUNNEL 23
DISCOVERY 24
ENGAGEMENT 26
VIRALITY 31
MONETIZATION 33
CHURN 36
MOBILE GENRE OVERVIEW 38
MOBILE GENRE SYSTEM 39
TOP GENRES PLAYED 40
GENRE SUMMARIES 41
PUZZLE GENRES 42
ARCADE GENRES 43
SIMULATION GENRES 44
SKILL & CHANCE GENRES 45
STRATEGY GENRES 46
RPG GENRES 47
ACTION GENRES 48
OTHER GENRES 49
(REGION)* - MARKET OVERVIEW 50
MARKET SIZING & SEGMENTATION 51
DEVICE OS MARKET SIZING 52
MOBILE GAMING REVENUE 53
DEMOGRAPHICS 54
MOBILE GAMING SPEND 55
MOBILE GAMING TIME 57
MOBILE GAMING INVESTMENT 59
DEVICE USAGE 60
MOBILE GAMING LOCATIONS 61
MOTIVATIONS FOR MOBILE GAMING 62
* Highlighted sections are available in full report. Regions include North America, Japan, South Korea, and China. Regions can be purchased separately.

4© COPYRIGHT 2015 ELECTRONIC ENTERTAINMENT DESIGN AND RESEARCH. PROPRIETARY AND CONFIDENTIAL.
TABLE OF CONTENTS
(REGION)* - MOBILE GAMING FUNNEL 63
DISCOVERY 64
ENGAGEMENT 66
VIRALITY 71
MONETIZATION 73
CHURN 76
MOBILE GENRE ANALYSIS 78
MOBILE GENRE SIZING 79
MOBILE GENRE OVERLAP 80
PUZZLE GENRES 81
ARCADE GENRES 83
SKILL & CHANCE GENRES 85
SIMULATION GENRES 87
RPG & STRATEGY GENRES 89
ACTION, SPORTS & RACING GENRES 91
SEGMENTED RESPONSE DATA 93
SEGMENTED MOTIVATIONS 94
SEGMENTED DISCOVERY SOURCE 99
SEGMENTED INITIAL ENGAGMENT 104
SEGMENTED BRAND ENGAGEMENT 109
SEGMENTED SHARING ACTIVITIES 114
SEGMENTED IAP MOTIVATIONS 119
SEGMENTED IAP PURCHASES 124
SEGMENTED REASONS FOR CHURN 129
METHODOLOGY 134
ABOUT EEDAR 134
* Highlighted sections are available in full report. Regions include North America, Japan, South Korea, and China. Regions can be purchased separately.

5© COPYRIGHT 2015 ELECTRONIC ENTERTAINMENT DESIGN AND RESEARCH. PROPRIETARY AND CONFIDENTIAL.
REPORT OVERVIEW
2015 REPORT OVERVIEW
The EEDAR 2015 Deconstructing Mobile & Tablet Gaming Reports focus on the gaming habits of smartphone and tablet gamers in 4 key regions: North America, Japan, China, and South Korea. For each regional market, a detailed profile is presented around 4 themes:
I. Market Sizing & Segmentation
II. Market Demographics & Behavior
III. Mobile Gaming Funnel Analysis
IV. Mobile Genre Analysis
This first series of analyses determines the number of mobile gamers and segments this market into distinct groups based on mobile spend. The second section focuses on gamer activity, demographics, and reasons for mobile gaming. The third section analyzes the mobile gaming funnel, from engagement through monetization. The fourth section analyzes the market size, player base demographics, and overlap of the established mobile game genres.
METHODOLOGY
Data in the 2015 Deconstructing Mobile & Tablet Gaming Report is from a consumer survey measuring the attitudes and behaviors of a representative sample of three thousand North American (USA and CA), one thousand Japanese, one thousand Chinese and one thousand South Korean active adult mobile gamers that played one or more mobile game within the past 6 months on their smartphone or tablet. EEDAR conducted a consumer survey in July 2015, measuring the attitudes and behaviors on over 250 variables related to smartphone games, tablet games, and general gaming behavior.

6© COPYRIGHT 2015 ELECTRONIC ENTERTAINMENT DESIGN AND RESEARCH. PROPRIETARY AND CONFIDENTIAL.
TERMINOLOGY
SMARTPHONE GAMERS
Smartphone owners that have played a game on their smartphone in the past 6 months.
• A smartphone is a cellular telephone that can support and run third-party applications and has internet access. An iPod Touch is also considered a smartphone.
TABLET GAMERS
Tablet owners that have played a game on their tablet in the past 6 months.
• A mobile tablet is a wireless, portable computer with a touchscreen interface that is capable of running applications and accessing the internet.
MOBILE GAMERS
Active smartphone and/or tablet gamers, past 6 months.
OS
The operating system being run by the smartphone or tablet. The major gaming OS on smartphone and tablets are Apple iOS, Google Android, and Other (including Windows, Blackberry, etc.). Each OS typically has a proprietary app store, with Android tending to be more fragmented (especially in China).
PREMIUM GAMES
Games purchased through the App marketplace. Prices range from $0.99 to $19.99 and higher.
FREE-TO–PLAY APPS (F2P)
Game is initially free to download from the App marketplace.
IN-APP PURCHASES (IAP)
F2P and Paid Apps have additional content that can be purchased from within the game, including both consumable purchases (e.g. currency, boosts, energy, etc.) and permanent content purchases (e.g. level packs, aesthetic items, characters/heroes, etc.).
MOBILE GAMER SPEND SEGMENT
Categories of mobile gamers based on total spend in the past year on mobile games. This reflects total spend across all relevant titles in the given year, not spend on a specific title.
• Mobile Gamer Spend Segments are ranked from light spending to heavy spending: Non-Payer (spent $0 on mobile games in the past year), Moderate Payer (spent $0.99 - $99.99 in the past year), and Heavy Payer (Whale; spent over $100 in the past year).
• For regions utilizing currencies other than USD, the values have been converted to roughly equivalent ranges based on similarly meaningful currency buckets.
MOBILE GAMER PLAY SEGMENT
Categories of mobile gamers based on their average weekly play time of mobile games. This reflects total play time across all relevant titles, not play of a specific title.
• Mobile Gamer Play Segments are ranked from light play to heavy play: Light Players (play less than 1 hour per week), Moderate Player (play 1 hour – 5 hours per week), and Heavy Player (play greater than 5 hours per week).

7© COPYRIGHT 2015 ELECTRONIC ENTERTAINMENT DESIGN AND RESEARCH. PROPRIETARY AND CONFIDENTIAL.
TERMINOLOGY
INVESTMENT INDEX
In addition to separately segmenting mobile gamers on the basis of money and time spent on mobile games, EEDAR combines these independent measures of gamer investment into the Investment Index.
• This index features 9 potential pairings of pay and play patterns that represent 5 distinctive types of player experiences that range from Minimal Investment (i.e. those who do not pay, and play very little), to Extreme Investment (i.e. are heavy spenders and players).
• EEDAR notes that this scale represents an update to the Investment Scale appearing in the 2014 Deconstructing Mobile & Tablet Gaming Report, and that the terminology has been changed to remove references to Casual and Core gamers, which were potentially a source of confusion.
• To clarify how the new terminology relates to the old, the definitions that follow feature references to the old terms, alongside the new ones.
MINIMAL INVESTORS (previously Casual Gamers)
The least invested gamers in mobile gaming, playing very little (in infrequent, short bursts), and paying nothing for their games (Non-Payers / Light Players).
LOW INVESTORS (previously Semi-Casual Gamers)
Gamers that combine a mixture of low investment and moderate investment across their spend and play segmentations (including Non-Payers / Moderate Players, and Moderate Payers / Light Players).
MODERATE INVESTORS (previously Moderate Gamers)
Gamers that tend to be moderate in their spend and play segmentations, as well as those whose pay/play habits diverge widely (i.e. those who spend a lot, but do not play a lot, or vice versa).
HEAVY INVESTORS (previously Semi-Core Gamers)
Gamers combining a mixture of moderate to heavy investment across their spend and play segmentations (including Moderate Payers / Heavy Players, and Heavy Payers / Moderate Players).
EXTREME INVESTORS (previously Core Gamers)
The most invested mobile gamers – heavily playing and paying for their games (Heavy Payers / Heavy Players).
NON-PAYER($0 / YEAR)
MODERATE PAYER($0.99-$100 / YEAR)
HEAVY PAYER(< $100 / YEAR)
LIGHT PLAYER (< 1 HOUR / WEEK) MINIMAL LOW MODERATE
MODERATE PLAYER (1-5 HOURS / WEEK) LOW MODERATE HEAVY
HEAVY PLAYER (> 5 HOUR / WEEK) MODERATE HEAVY EXTREME

8© COPYRIGHT 2015 ELECTRONIC ENTERTAINMENT DESIGN AND RESEARCH. PROPRIETARY AND CONFIDENTIAL.
MOBILE GAMING GENRES
PUZZLE
MATCHING PUZZLE: Puzzle games where players must match like things together through swapping, shooting, manipulation, or other mechanisms. (Candy Crush Saga, Bejeweled Blitz, Panda Pop)
BRAIN PUZZLE: Puzzle games that focus on manipulating words and letters, numbers, finding hidden objects, or completing trivia. (Words with Friends, Threes, Draw Something 2, QuizUp, Mystery Manor)
PHYSICS PUZZLE: Puzzle games where gravity, angles, trajectories, and other physics-based variables are key characteristics of gameplay. (Angry Birds, Cut the Rope, Where’s my Water?, Peggle)
ARCADE
GENERAL ARCADE: Characterized by an easy-to-learn interface and rules of play, scoring points, and level progression. (Fruit Ninja, Flick: Homerun)
ENDLESS RUNNER: Characterized by a single avatar, scrolling at a fixed or increasing pace across a vertical or horizontal 2D or 3D space. The object of these games is to prolong gameplay without colliding into obstacles. (Jetpack Joyride, Temple Run, Subway Surfers, Run with Friends)
MUSIC / RHYTHM: Gameplay focuses on tapping/swiping in time with music or as prompts appear on the screen. (Magic Piano by Smule, Beat Sneak, Miku Flick)
SKILL & CHANCE
CASINO (SKILL & CHANCE): This genre includes all games that mimic those games found in a traditional casino that emphasize gambling with real or fake currency. These can be further divided based on the types of games included:
• Casino – Skill games afford the player some control over the outcome of the game, relying on knowledge of strategy to be successful (e.g. poker, blackjack).
• Casino – Chance games dictate success or failure based on random chance (e.g. slots, bingo, roulette, craps).
• Integrated Casino games include a variety of gaming experience, often some games of skill and some of chance, intended to mimic the experience of going to a real casino.
NON-CASINO SKILL & CHANCE: This genre includes all traditional card, board and dice games that do not center around gambling. (Dice with Buddies, Monopoly, Solitaire, Uno, Yahtzee, Dominos, Mahjong)
SIMULATION
SIMULATION: Characterized by putting the user in control of a confined role or social environment, acting as leader or planner. (The Sims FreePlay, High School Story, Covet Fashion, Kim Kardashian: Hollywood, My Talking Angela)
CITY BUILDER / RESOURCE MANAGEMENT: Goal of the game is to build and manage a city. Unlike Combat City Builders, these games do not feature significant combat, although players often compete with each other in other ways. (DragonVale, Hay Day, The Simpsons: Tapped Out, Smurfs’ Village)

9© COPYRIGHT 2015 ELECTRONIC ENTERTAINMENT DESIGN AND RESEARCH. PROPRIETARY AND CONFIDENTIAL.
MOBILE GAMING GENRES
STRATEGY
GENERAL STRATEGY: Focus of gameplay is combat between many controlled units with skillful planning and tactical thinking. Combat can be either real-time or turn-based. (Hero Academy, Plague Inc., Catan, XCOM: Enemy Unknown)
COMBAT CITY BUILDER: Goal of the game is to build a city and an army. The army is used to attack other players, usually in asynchronous multiplayer combat. (Clash of Clans, Kingdoms of Camelot, Modern War, Game of War: Fire Age)
TRADING CARD GAME (TCG): Strategy games that mimic traditional table top strategic card games. (Magic the Gathering 2015, Hearthstone: Heroes of Warcraft)
TOWER DEFENSE: Games that are similar to RTS, but the purpose is to defend against waves of spawning enemies. This is primarily done by placing structures between the spawn point of enemies and their goal (Plants vs. Zombies, Bloons TD, Fieldrunners, Kingdom Rush)
RPG
ROLE PLAYING GAME (RPG): Gameplay focuses on the advancement of the main character, acquisition of items and an over-arching storyline. (Chaos Rings, Final Fantasy)
SOCIAL RPG / CARD BATTLE: Hybrid experiences featuring light RPG progression elements, with character/card collection mechanics and deck/team building mimicking Collectable Card games. (Summoner’s War, Heroes Charge, Rage of Bahamut, Legend of the Cryptids)
ACTION
SHOOTER: The primary action performed by the user’s personification is shooting a weapon. (Frontline Commando, NOVA, Deer Hunter 2016, Modern Combat)
ACTION / FIGHTING: Elements of Action games include movement (running, jumping, swinging, etc.), exploration, and combat. (Infinity Blade, Assassin’s Creed) This genre also includes Fighting games (Injustice: Gods Among Us) and Action RPGs in which the primary gameplay is real-time combat.
ACTION BUILDER: Emphasis is on exploration, crafting, and building. There may be light combat elements in this sandbox genre. (Minecraft, Terraria)
OTHER
RACING: Allows the user to control a vehicle in a competitive race event. (Need for Speed, Real Racing, CSR Racing, Fast & Furious)
SPORTS: Replicate the gameplay of traditional sporting events or centers around team management. (FIFA 15 Ultimate Team, Madden NFL Mobile, NBA 2k15, Golf Star)

MOBILE GAMING MARKET OVERVIEW

11© COPYRIGHT 2015. ELECTRONIC ENTERTAINMENT DESIGN AND RESEARCH. PROPRIETARY AND CONFIDENTIAL.
SOURCE: EEDAR
2015 MOBILE GAMING MARKETMOBILE GAMING MARKET OVERVIEW
The current global mobile gaming market is estimated at approximately 1.5B PLAYERS, and is forecasted to generate over $25B IN YEARLY REVENUE by the end of 2015.
This represents approximately 30% OF THE TOTAL GLOBAL GAMING MARKET REVENUE, a percentage that has steadily climbed from around 15% in 2011.
APAC continues to represent one of the largest and fastest growing markets globally, supporting approximately 50% of the world’s mobile gamers, and generating 56% of the mobile revenue.
MOBILE GAMING MARKET SIZE
CHINA314.8MM Gamers564.5MM Owners (56%)
NORTH AMERICA136.5MM Gamers180.4MM Owners (76%)
JAPAN45.8MM Gamers66.2MM Owners (69%)
SOUTH KOREA19.3MM Gamers30.9MM Owners (63%)
MOBILE GAMING MARKET REVENUE
$1.37B
$5.01B
$5.16B
$5.41B
* Regional market sizing reflects adult mobile gamers (18 years or older).

12© COPYRIGHT 2015 ELECTRONIC ENTERTAINMENT DESIGN AND RESEARCH. PROPRIETARY AND CONFIDENTIAL.
SOURCE: EEDAR
WHO IS PLAYING?MOBILE GAMING MARKET OVERVIEW
The North American mobile gaming market continues to be driven by a slight majority of female gamers (55%), a trend that is uncommon compared to APAC markets – Japan, South Korea and China all featuring slight male majorities.
Although the gender splits vary by region, the age distributions of mobile gamers tend to be very similar, with the largest age bracket of adult players falling between 25 and 35 years of age.
Average Age 18 - 24 25-45 Over 45
35.1 23% 52% 25%
Average Age 18 - 24 25-45 Over 45
34.2 16% 70% 14%
Average Age 18 - 24 25-45 Over 45
34.4 17% 68% 15%
Average Age 18 - 24 25-45 Over 45
36.3 17% 60% 23%
MALE45%
FEMALE55%
MALE54%
FEMALE46%
MALE58%
FEMALE42%
MALE57%
FEMALE43%
* Regional market sizing reflects adult mobile gamers (18 years or older).

13© COPYRIGHT 2015 ELECTRONIC ENTERTAINMENT DESIGN AND RESEARCH. PROPRIETARY AND CONFIDENTIAL.
SOURCE: EEDAR
WHAT ARE THEY PLAYING ON?MOBILE GAMING MARKET OVERVIEW
Smartphones continue to represent the most commonly used device for mobile gaming across all regions, with approximately 90% of mobile gamers utilizing one.
Tablet use for gaming across regions tends to overlap heavily with Smartphone use – with the majority of Tablet gamers also utilizing Smartphones to play games.
North American mobile gamers are among the most likely to game across both devices – with 60% utilizing both Smartphones and Tablets to play games.
All APAC regions examined still feature primarily single device users.

14© COPYRIGHT 2015 ELECTRONIC ENTERTAINMENT DESIGN AND RESEARCH. PROPRIETARY AND CONFIDENTIAL.
SOURCE: EEDAR
WHAT IS THEIR PRIMARY OS?MOBILE GAMING MARKET OVERVIEW
iOS Android Other OS Multiple OS
31% 49% 2% 18%
iOS Android Other OS Multiple OS
21% 50% 1% 28%
iOS Android Other OS Multiple OS
14% 75% 0% 11%
iOS Android Other OS Multiple OS
45% 45% 1% 9%
NORTH AMERICA
Android continues to claim a majority share (65%) of devices, but iOS commands greater revenue.
Dual-device users are equally split between same OS and mixed OS pairings of devices.
JAPAN
The most divided market, with a 50/50 split between iOS and Android preference.
Mixed OS use is common among all dual-device users – most commonly a combination of an Android Phone and iPad (44% of mixed-OS users).
CHINA
Android commands the market (78% of gaming devices), with a large selection of affordable, regionally manufactured models.
Moderate cross-OS use is primarily driven by these users also utilizing iPads (22%) to play.
SOUTH KOREA
Android dominates overall (86%), with less than a quarter of users making use of other OS’s.
Despite this preference, the majority of dual-device users mix OS’s of their devices (85%) – 62% of this being Android Phone and iPad.
* % represents percentage of mobile gamers.
15© COPYRIGHT 2015 ELECTRONIC ENTERTAINMENT DESIGN AND RESEARCH. PROPRIETARY AND CONFIDENTIAL.
SOURCE: EEDAR
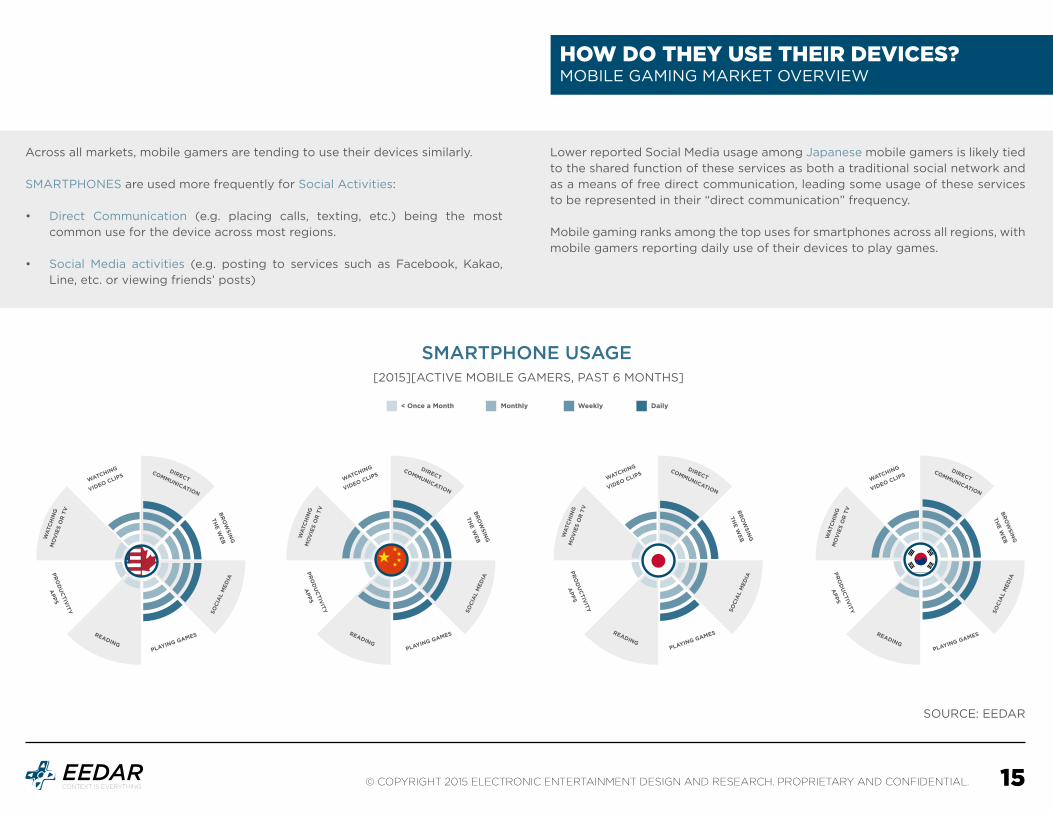
HOW DO THEY USE THEIR DEVICES?MOBILE GAMING MARKET OVERVIEW
Across all markets, mobile gamers are tending to use their devices similarly.
SMARTPHONES are used more frequently for Social Activities:
• Direct Communication (e.g. placing calls, texting, etc.) being the most common use for the device across most regions.
• Social Media activities (e.g. posting to services such as Facebook, Kakao, Line, etc. or viewing friends’ posts)
SMARTPHONE USAGE [2015][ACTIVE MOBILE GAMERS, PAST 6 MONTHS]
< Once a Month Monthly Weekly Daily
DIRECTCOMMUNICATION
BR
OW
SING
THE W
EB
SOC
IAL
MED
IA
PLAYING GAMESREADING
PRO
DU
CTIV
ITY
APPS
WA
TCH
ING
M
OV
IES
OR
TV
WATCHING
VIDEO CLIPSDIRECT
COMMUNICATION
BR
OW
SING
THE W
EB
SOC
IAL
MED
IA
PLAYING GAMESREADING
PRO
DU
CTIV
ITY
APPS
WA
TCH
ING
M
OV
IES
OR
TV
WATCHING
VIDEO CLIPSDIRECT
COMMUNICATION
BR
OW
SING
THE W
EB
SOC
IAL
MED
IA
PLAYING GAMESREADING
PRO
DU
CTIV
ITY
APPS
WA
TCH
ING
M
OV
IES
OR
TV
WATCHING
VIDEO CLIPSDIRECT
COMMUNICATION
BR
OW
SING
THE W
EB
SOC
IAL
MED
IA
PLAYING GAMESREADING
PRO
DU
CTIV
ITY
APPS
WA
TCH
ING
M
OV
IES
OR
TV
WATCHING
VIDEO CLIPS
Lower reported Social Media usage among Japanese mobile gamers is likely tied to the shared function of these services as both a traditional social network and as a means of free direct communication, leading some usage of these services to be represented in their “direct communication” frequency.
Mobile gaming ranks among the top uses for smartphones across all regions, with mobile gamers reporting daily use of their devices to play games.

16© COPYRIGHT 2015 ELECTRONIC ENTERTAINMENT DESIGN AND RESEARCH. PROPRIETARY AND CONFIDENTIAL.
SOURCE: EEDAR
HOW DO THEY USE THEIR DEVICES?MOBILE GAMING MARKET OVERVIEW
DIRECTCOMMUNICATION
BR
OW
SING
THE W
EB
SOC
IAL
MED
IA
PLAYING GAMESREADING
PRO
DU
CTIV
ITY
APPS
WA
TCH
ING
M
OV
IES
OR
TV
WATCHING
VIDEO CLIPSDIRECT
COMMUNICATION
BR
OW
SING
THE W
EB
SOC
IAL
MED
IA
PLAYING GAMESREADING
PRO
DU
CTIV
ITY
APPS
WA
TCH
ING
M
OV
IES
OR
TV
WATCHING
VIDEO CLIPSDIRECT
COMMUNICATION
BR
OW
SING
THE W
EB
SOC
IAL
MED
IA
PLAYING GAMESREADING
PRO
DU
CTIV
ITY
APPS
WA
TCH
ING
M
OV
IES
OR
TV
WATCHING
VIDEO CLIPSDIRECT
COMMUNICATION
BR
OW
SING
THE W
EB
SOC
IAL
MED
IA
PLAYING GAMESREADING
PRO
DU
CTIV
ITY
APPS
WA
TCH
ING
M
OV
IES
OR
TV
WATCHING
VIDEO CLIPS
Where mobile gamers tend to consistently utilize their smartphones, tablet usage tends to be more varied by region.
Across regions, TABLETS are used more frequently than smartphones for Media Consumption, including: • Watching Videos such as TV Shows or Movies (either digital downloads or via
streaming sites), and streaming video clips on sites like YouTube.
• Reading digital books, comics or magazines.
Comparing regions, Chinese and South Korean mobile gamers’ heavier tablet use across all activities suggests that tablets are more likely to serve as primary devices (being cheaper alternatives to traditional computers).
On the other extreme, Japanese and North American mobile gamers’ more focused uses (with most frequent activities being web browsing, gaming and viewing video clips), suggests that tablets are more likely to be “media specialists” in a multi-device ecosystem.
TABLET USAGE [2015][ACTIVE MOBILE GAMERS, PAST 6 MONTHS]
< Once a Month Monthly Weekly Daily

17© COPYRIGHT 2015. ELECTRONIC ENTERTAINMENT DESIGN AND RESEARCH. PROPRIETARY AND CONFIDENTIAL.
SOURCE: EEDAR
WHERE DO THEY PLAY GAMES?MOBILE GAMING MARKET OVERVIEW
Mobile gamers also tend to play games in many of the same locations.
Across regions and devices, mobile gaming most frequently takes place in the Home. This, and the prevalence of gaming in the Bedroom specifically, suggests that a common use of mobile games is as a form of relaxation (a pattern consistent with mobile gamers’ top motivations, see pg. 22).
SMARTPHONES, with their smaller size and access to cellular networks, tend to be more convenient for use in for gaming in a wider range of locations, particularly those Outside of the Home:
• Public Transportation • Work or School• Other Public Locations
Comparing regions, South Korean mobile gamers indicate the most frequent use of their smartphones for gaming across all locations. This likely ties to the widespread availability of free WIFI, which facilitates play of a broader range of games while on-the-go.
Japanese mobile gamers, on the other hand tend to indicate more specified locations for their smartphone gaming, focusing specifically on their Homes, and Transportation.
BEDROOM
HOME (OTHER)
BATHROOM
TRANSPORTATION
WORK / SCHOOL
OTHER PUBLIC LOCATIONS
FRIEND / FAMILY MEMBER’S HOUSE
NEVER RARELY SOMETIMES MOST OF THE TIME
LOCATIONS OF SMARTPHONE GAMING [2015][ACTIVE MOBILE GAMERS, PAST 6 MONTHS]
NORTH AMERICAJAPAN CHINASOUTH KOREA
18© COPYRIGHT 2015 ELECTRONIC ENTERTAINMENT DESIGN AND RESEARCH. PROPRIETARY AND CONFIDENTIAL.
SOURCE: EEDAR
WHERE DO THEY PLAY GAMES?MOBILE GAMING MARKET OVERVIEW
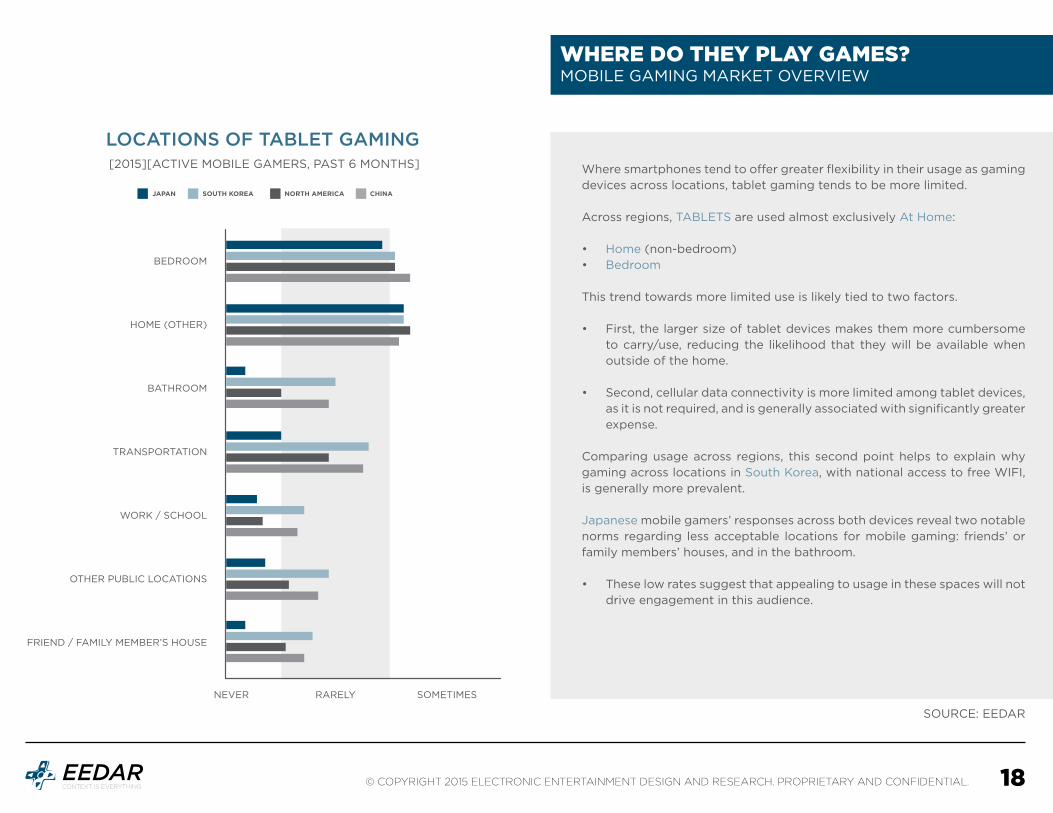
Where smartphones tend to offer greater flexibility in their usage as gaming devices across locations, tablet gaming tends to be more limited.
Across regions, TABLETS are used almost exclusively At Home:
• Home (non-bedroom) • Bedroom
This trend towards more limited use is likely tied to two factors.
• First, the larger size of tablet devices makes them more cumbersome to carry/use, reducing the likelihood that they will be available when outside of the home.
• Second, cellular data connectivity is more limited among tablet devices,
as it is not required, and is generally associated with significantly greater expense.
Comparing usage across regions, this second point helps to explain why gaming across locations in South Korea, with national access to free WIFI, is generally more prevalent.
Japanese mobile gamers’ responses across both devices reveal two notable norms regarding less acceptable locations for mobile gaming: friends’ or family members’ houses, and in the bathroom.
• These low rates suggest that appealing to usage in these spaces will not drive engagement in this audience.
BEDROOM
HOME (OTHER)
BATHROOM
TRANSPORTATION
WORK / SCHOOL
OTHER PUBLIC LOCATIONS
FRIEND / FAMILY MEMBER’S HOUSE
NEVER RARELY SOMETIMES
LOCATIONS OF TABLET GAMING [2015][ACTIVE MOBILE GAMERS, PAST 6 MONTHS]
NORTH AMERICAJAPAN CHINASOUTH KOREA

19© COPYRIGHT 2015. ELECTRONIC ENTERTAINMENT DESIGN AND RESEARCH. PROPRIETARY AND CONFIDENTIAL.
SOURCE: EEDAR
HOW DO THEY PLAY?MOBILE GAMING MARKET OVERVIEW
PLAY SEGMENTATIONS [AVERAGE WEEKLY MOBILE GAMING TIME]
Patterns of mobile play tend to be very similar across regions.
Mobile gamers tend to play moderately – engaging for an average of 3 – 4 hours per week with Smartphone and/or Tablet games.
AVERAGE WEEKLY TIME [HOURS]
3.5
4.3
3.5
3.9
56%MODERATE PLAYER
(1-5 HOUR)
25%LIGHT PLAYER
(< 1 HOUR)
19%HEAVY PLAYER
(> 5 HOUR)
26%LIGHT PLAYER
(< 1 HOUR)
33%HEAVY PLAYER
(> 5 HOUR)
41%MODERATE PLAYER
(1-5 HOUR)
25%HEAVY PLAYER
(> 5 HOUR)
28%LIGHT PLAYER
(< 1 HOUR)
47%MODERATE PLAYER
(1-5 HOUR)
25%HEAVY PLAYER
(> 5 HOUR)
38%MODERATE PLAYER
(1-5 HOUR)
37%LIGHT PLAYER
(< 1 HOUR)

20© COPYRIGHT 2015. ELECTRONIC ENTERTAINMENT DESIGN AND RESEARCH. PROPRIETARY AND CONFIDENTIAL.
SOURCE: EEDAR
HOW DO THEY SPEND?MOBILE GAMING MARKET OVERVIEW
SPEND SEGMENTATIONS [YEARLY SPEND ON MOBILE GAMES]Patterns of mobile spend tend to be more
varied.
Although all regions follow a similar spend curve (with half or more of their players contributing no revenue), the revenue contributed by each player varies dramatically by region.
AVERAGE MONTHLY SPEND [USD]
50%NON-PAYER
5%HEAVY PAYER
(> $100 A YEAR)45%MODERATE PAYER(< $100 A YEAR)
PAYERS OVERALL
$6.61 $3.30
PAYERS OVERALL
$2.88 $1.32
PAYERS OVERALL
$24.06 $9.39
PAYERS OVERALL
$12.83 $5.91
60%NON-PAYER
3%HEAVY PAYER
(> $100 A YEAR)37%
MODERATE PAYER(< $100 A YEAR)
54%NON-PAYER
5%HEAVY PAYER
(> $100 A YEAR)41%MODERATE PAYER(< $100 A YEAR)
61%NON-PAYER
8%HEAVY PAYER
(> $100 A YEAR)31%
MODERATE PAYER(< $100 A YEAR)

21© COPYRIGHT 2015 ELECTRONIC ENTERTAINMENT DESIGN AND RESEARCH. PROPRIETARY AND CONFIDENTIAL.
SOURCE: EEDAR
WHAT IS THEIR OVERALL INVESTMENT?MOBILE GAMING MARKET OVERVIEW
The investment index combines the amount of time and money individual gamers are spending on mobile games to provide a combined measurement of investment (see the table for classifications, and pg. 7 for full explanation of this scale).
Although the exact distribution of gamers varies by region, the general pattern tends to be very similar, with over half of all gamers in each region (55-70%) falling into the midrange (low-to-moderate) investment groups. These gamers are typically non-payers, who play moderate amounts to compensate for their lack of spend.
MINIMAL
LOW
MODERATE
HEAVY
EXTREME
0% 10% 20% 30% 40%
INVESTMENT SEGMENTATIONS [ACTIVE ADULT MOBILE GAMERS, PAST 6 MONTHS]
NORTH AMERICAJAPAN CHINASOUTH KOREA
PERCENTAGE OF MOBILE GAMERS
NON-PAYER($0 / YEAR)
MODERATE PAYER($0.99-$100 / YEAR)
HEAVY PAYER(< $100 / YEAR)
LIGHT PLAYER (< 1 HOUR / WEEK) MINIMAL LOW MODERATE
MODERATE PLAYER (1-5 HOURS / WEEK) LOW MODERATE HEAVY
HEAVY PLAYER (> 5 HOUR / WEEK) MODERATE HEAVY EXTREME

22© COPYRIGHT 2015. ELECTRONIC ENTERTAINMENT DESIGN AND RESEARCH. PROPRIETARY AND CONFIDENTIAL.
SOURCE: EEDAR
WHY DO THEY PLAY MOBILE GAMES?MOBILE GAMING MARKET OVERVIEW
TOP 5 REASONS
1. PASS TIME WHILE WAITING2. AVAILABLE ON A CONVENIENT DEVICE3. CHEAP OR FREE GAMES4. RELAX5. TAKE A BREAK
1. PASS TIME WHILE WAITING2. RELAX3. TAKE A BREAK4. CHEAP OR FREE GAMES5. AVAILABLE ON A CONVENIENT DEVICE
1. RELAX2. PASS TIME WHILE WAITING3. TAKE A BREAK4. HAVE NEW EXPERIENCES5. CAN PLAY WHILE DOING SOMETHING ELSE
Mobile games largely function as a means of low investment entertainment that players utilize to:
• Relax• Take Breaks from other activities • To Pass the Time While Waiting for Something Else
Convenience also plays a major factor for many mobile gamers.
Utility as an “on-the-go” gaming option is extremely important for mobile gamers, as they look for experiences that will facilitate play during short periods of time or when they are multitasking
*For full data by region, please see pg. 62 of each regional report.
JAPAN
SOUTH KOREA
CHINA
CONSISTENT WITH NORTH AMERICA DIFFERS FROM NORTH AMERICA

MOBILE GAMING FUNNEL

24© COPYRIGHT 2015. ELECTRONIC ENTERTAINMENT DESIGN AND RESEARCH. PROPRIETARY AND CONFIDENTIAL.
SOURCE: EEDAR
DISCOVERYMOBILE GAMING FUNNEL
HOW DO MOBILE GAMERS LEARN ABOUT NEW GAMES?
North American mobile gamers seek DIRECT RECOMMENDATIONS from friends or known others, with their top 3 sources including:
• BEING VERBALLY TOLD• SEEING SOMEONE PLAY• FRIENDS SOCIAL MEDIA POSTS
This is then followed by ADVERTISING, likely consumed on their mobile devices:
• SOCIAL MEDIA• IN OTHER GAMES / APPS.
Chinese mobile gamers rely a diverse set of discovery sources, incorporating SOCIAL, STOREFRONT, NEWS and ADVERTISING sources into the mix:
• TOP CHARTS (their most used source overall)• GAMING WEBSITES • TV ADVERTISEMENTS
South Korean mobile gamers indicate that STOREFRONT sources are critical to pointing out which new games are worth playing:
• TOP CHARTS• FEATURED APPS
ADVERTISING presented alongside other media also plays a key role in discovering new games:
• TV ADVERTISEMENTS• ADS IN OTHER APPS
Japanese mobile gamers tend to rely on TELEVISION ADS more so than players from all other regions:
• TELEVISION ADS were the #1 most used source.
Additionally, they tend to be among the heavier users of STOREFRONT sources, such as:
• TOP CHARTS• FEATURED GAMES
DISCOVERY
ENGAGEMENT
VIRALITY
MONETIZATION
CHURN
Most mobile gamers rely on SOCIAL SOURCES to find out about new games –
• SEEING SOMEONE PLAY • BEING TOLD VERBALLY • or via SOCIAL MEDIA CHANNELS
Gamers also respond to ADVERTISING across a variety of platforms (the importance of which varies by region), including:
• SOCIAL MEDIA• IN OTHER GAMES / APPS• ON TELEVISION
*For additional analysis by region, please see pg. 64 of each regional report.

25© COPYRIGHT 2015. ELECTRONIC ENTERTAINMENT DESIGN AND RESEARCH. PROPRIETARY AND CONFIDENTIAL.
SOURCE: EEDAR
DISCOVERYMOBILE GAMING FUNNEL
TOP 5 REASONS
1. TELEVISION ADS2. TOP CHARTS IN THE STORE3. SEEING SOMEONE PLAY4. FEATURE GAMES IN THE STORE5. ADS ON SOCIAL MEDIA
1. SEEING SOMEONE PLAY2. TOP CHARTS IN THE STORE3. FEATURED GAMES IN THE STORE4. TELEVISION ADS5. ADS IN OTHER GAMES / APPS
1. SEEING SOMEONE PLAY2. BEING VERBALLY TOLD3. TOP CHARTS IN THE STORE4. FRIENDS’ POSTS ON SOCIAL MEDIA5. GAMING NEWS / REVIEW WEBSITES
*For full data by region, please see pg. 65 of each regional report.
JAPAN
SOUTH KOREA
CHINA
CONSISTENT WITH NORTH AMERICA DIFFERS FROM NORTH AMERICA
[2015][NORTH AMERICA][ACTIVE ADULT MOBILE GAMERS, PAST 6 MONTHS]

26© COPYRIGHT 2015. ELECTRONIC ENTERTAINMENT DESIGN AND RESEARCH. PROPRIETARY AND CONFIDENTIAL.
SOURCE: EEDAR
ENGAGEMENT MOBILE GAMING FUNNEL
HOW DO MOBILE GAMERS DECIDE WHAT GAMES TO PLAY?
PRICE is key in the North American market – suggesting a need to justify a premium price tag and avoid overt monetization strategies when attracting players.
76% indicate that they are receptive to branding in games – particularly where it is associated with a well-known MOBILE brand.
Although the use of CELEBRITY brands has seen success (as with Kim Kardashian: Hollywood), it was the least attractive to players overall (its success is largely attributed to the fact that it tends to over-index with female gamers and Simulation players).
Chinese mobile gamers emphasize distinct elements of a particular title – GRAPHICAL QUALITY and CONTROLS –when selecting games to play.
83% indicate they are receptive to branding in games (the most among regions). In addition to MOBILE brands, Chinese mobile gamers are most influenced to download by the following brand types:
• MOVIES• PC / CONSOLE GAMES• PRODUCTS
POPULARITY plays a much more important role in game selection for Korean gamers than those in other regions – suggesting that organic virality is particularly important to driving game selection.
77% indicate they are receptive to branding in games. In addition to MOBILE and media brands, Korean mobile gamers are also the most receptive to CELEBRITY branding.
Japanese mobile gamers heavily overlap with other regions in the features they use to select games to play.
44% indicate they are receptive to branding in games (the least among the regions). These are primarily associated with strong MOBILE brands, as well as other media:
• MOVIES• PC / CONSOLE GAMES• OTHER, PHYSICAL GAMES
DISCOVERY
ENGAGEMENT
VIRALITY
MONETIZATION
CHURN
Gaming decisions are largely driven by general indicators of suitability, most especially:
• GENRE• PRICE
This is typically followed by elements that quickly communicate quality:
• GRAPHICAL QUALITY• USER REVIEWS • STAR RATINGS• BEING PART OF A WELL-KNOWN MOBILE BRAND
*For additional analysis by region, please see pg. 64 of each regional report.

27© COPYRIGHT 2015. ELECTRONIC ENTERTAINMENT DESIGN AND RESEARCH. PROPRIETARY AND CONFIDENTIAL.
SOURCE: EEDAR
ENGAGEMENTMOBILE GAMING FUNNEL
TOP 5 REASONS
1. GENRE2. PRICE3. GRAPHICAL QUALITY4. USER REVIEWS5. STAR RATING
1. GENRE2. PRICE3. GRAPHICAL QUALITY4. POPULARITY5. USER REVIEWS
1. GRAPHICAL QUALITY2. CONTROLS3. GENRE4. PRICE5. USER REVIEWS
JAPAN
SOUTH KOREA
CHINA
CONSISTENT WITH NORTH AMERICA DIFFERS FROM NORTH AMERICA
*For full data by region, please see pg. 67 of each regional report.
FACTORS AFFECTING DECISION TO ENGAGE[2015][NORTH AMERICA][ACTIVE ADULT
MOBILE GAMERS, PAST 6 MONTHS]

28© COPYRIGHT 2015. ELECTRONIC ENTERTAINMENT DESIGN AND RESEARCH. PROPRIETARY AND CONFIDENTIAL.
SOURCE: EEDAR
ENGAGEMENTMOBILE GAMING FUNNEL
MOBILE
OTHER, PHYSICAL GAME
PC / CONSOLE VIDEO GAME
MOVIE
TELEVISION
PRODUCT
CELEBRITY
NONE
MOBILE – games from established mobile brands based on well-known publishers, developers, or franchises in the mobile space (e.g. Angry Birds, King’s Saga games, Zynga)
PC / CONSOLE – games featuring characters, gameplay, etc. from existing console / PC franchises. Also includes game ports (e.g. Assassin’s Creed, Final Fantasy, Hitman)
OTHER GAME – games based on well-known physical games (e.g. Monopoly, UNO)
BRAND TYPES
TOP 5 REASONS
1. MOBILE2. MOVIE3. PC / CONSOLE GAME4. PRODUCT5. OTHER GAME
1. MOBILE2. PC / CONSOLE GAME3. MOVIE4. OTHER GAME5. CELEBRITY
1. MOBILE2. MOVIE3. PC / CONSOLE4. PRODUCT5. OTHER GAME
*For full data by region, please see pg. 68 of each regional report.
JAPAN
SOUTH KOREA
CHINA
CONSISTENT WITH NORTH AMERICA DIFFERS FROM NORTH AMERICA
MOVIE and TELEVISION – games featuring characters, locations, etc. based on films or TV shows (e.g. CSI, Downton Abbey, Minions, Star Wars, Avengers)
PRODUCT – branding based on non-entertainment products (e.g. Coca-Cola, McDonalds)
CELEBRITY – games featuring the likeness of a celebrity personality or personalities (e.g. Kim Kardashian, Lindsay Lohan)

29© COPYRIGHT 2015 ELECTRONIC ENTERTAINMENT DESIGN AND RESEARCH. PROPRIETARY AND CONFIDENTIAL.
SOURCE: EEDAR
ENGAGEMENTMOBILE GAMING FUNNEL

30© COPYRIGHT 2015 ELECTRONIC ENTERTAINMENT DESIGN AND RESEARCH. PROPRIETARY AND CONFIDENTIAL.
SOURCE: EEDAR
ENGAGEMENTMOBILE GAMING FUNNEL
How do mobile gamers prefer to play Smartphone games?
Across regions, preferences for screen orientation and number of hands required to play tend to align, such that those who tend to prefer the wider vantage that a landscape screen orientation affords are also more accepting of playing with both hands. Conversely, those who tend to prefer the convenience of one-handed play also prefer the easier navigation that a portrait screen orientation provides.
Although most regions indicated a slight preference for the former (landscape orientation, two hands), Japanese mobile gamers were more likely to seek games that allowed for single-handed/portrait play.

31© COPYRIGHT 2015. ELECTRONIC ENTERTAINMENT DESIGN AND RESEARCH. PROPRIETARY AND CONFIDENTIAL.
SOURCE: EEDAR
VIRALITYMOBILE GAMING FUNNEL
HOW ARE MOBILE GAMERS SHARING ABOUT GAMES?
77% indicate that they share about mobile games.
MOST LIKELY TO SHARE: directly with friends (verbally, showing them games, directly inviting them to play).
LEAST LIKELY TO SHARE: via more taxing methods, such as posting a video or writing a review about a game on the storefront.
82% indicate that they share about mobile games.
MOST LIKELY TO SHARE: across all methods (compared to other regions), especially via social methods.
LEAST LIKELY TO SHARE: via more traditional review methods – e.g. star ratings, posting videos, or writing reviews.
72% indicate that they share about mobile games.
MOST LIKELY TO SHARE: directly with friends (verbally, showing them games, directly inviting or messaging them).
LEAST LIKELY TO SHARE: with a broader community in ways that would single them out as players – e.g. discussing a game in a form, posting about it on social media, or creating videos about a game.
63% indicate that they share about mobile games.
MOST LIKELY TO SHARE: via informal methods, such as showing/telling friends, or giving a star rating in the store.
LEAST LIKELY TO SHARE: with a broader community in ways that would single them out as players – e.g. discussing a game in a forum, posting about it on social media, or creating videos about a game.
DISCOVERY
ENGAGEMENT
VIRALITY
MONETIZATION
CHURN
Consistent with their use of SOCIAL SOURCES when seeking new games, mobile gamers indicate that they are most likely to share about games they enjoy with friends or known others directly, by:
• TELLING THEM VERBALLY• SHOWING THEM A GAME• INVITING A FRIEND TO PLAY• MESSAGING A FRIEND ABOUT A GAME
*For additional analysis by region, please see pg. 71 of each regional report.

32© COPYRIGHT 2015. ELECTRONIC ENTERTAINMENT DESIGN AND RESEARCH. PROPRIETARY AND CONFIDENTIAL.
SOURCE: EEDAR
VIRALITYMOBILE GAMING FUNNEL
TOP 5 REASONS
1. TOLD SOMEONE VERBALLY2. SHOWED SOMEONE A GAME3. GAVE A STAR RATING4. INVITED A FRIEND TO PLAY5. WROTE A REVIEW
1. TOLD SOMEONE VERBALLY2. SHOWED SOMEONE A GAME3. INVITED A FRIEND TO PLAY4. MESSAGED A FRIEND 5. GAVE A STAR RATING
1. TOLD SOMEONE VERBALLY2. INVITED A FRIEND TO PLAY3. MESSAGED A FRIEND4. SHOWED SOMEONE A GAME5. DISCUSSED THE GAME IN A FORUM
JAPAN
SOUTH KOREA
CHINA
CONSISTENT WITH NORTH AMERICA DIFFERS FROM NORTH AMERICA
*For full data by region, please see pg. 72 of each regional report.

33© COPYRIGHT 2015. ELECTRONIC ENTERTAINMENT DESIGN AND RESEARCH. PROPRIETARY AND CONFIDENTIAL.
SOURCE: EEDAR
MONETIZATIONMOBILE GAMING FUNNEL
MOBILE PAYERS are most likely to make purchases aimed at improving their personal experience of the game, affording:
• ACCESS TO NEW CONTENT• ACCESS TO HIGHER QUALITY CONTENT• OPPORTUNITIES TO REACH GOALS• THE ABILITY TO PROGRESS FASTER
Their top purchases reflect these interests:
• CONTENT EXPANSIONS • VIP ACCESS• RESOURCE REPLENISHMENT
HOW AND WHY DO MOBILE GAMERS SPEND MONEY?
45% of North American mobile gamers spend real money on mobile games.
TOP MOTIVATIONS: expand their experience by accessing new or higher quality content, or to move through the content more quickly.
TOP PURCHASES: direct purchases of persistent content (new levels, services, etc.), and via resource replenishment that speeds up progress.
43% spend real money on mobile games.
TOP MOTIVATIONS: quickly progress and remain competitive.
TOP PURCHASES: items that facilitate better performance or faster progress (resources, expanded services, VIP access), or items that help them stand out (permanent cosmetic and game-affecting items).
46% spend real money on mobile games.
TOP MOTIVATIONS: improve their progress toward personal goals.
TOP PURCHASES: items that boost progress, either persistent (expanded services and permanent, game-affecting items), or temporary (boosts, and resources).
39% spend real money on mobile games.
TOP MOTIVATIONS: personal objectives of meeting goals or completing collections.
TOP PURCHASES: permanent game-affecting content (including items or services), and performance boosts which aid in winning tough battles or earning top scores.
DISCOVERY
ENGAGEMENT
VIRALITY
MONETIZATION
CHURN
*For additional analysis by region, please see pg. 73 of each regional report.

34© COPYRIGHT 2015. ELECTRONIC ENTERTAINMENT DESIGN AND RESEARCH. PROPRIETARY AND CONFIDENTIAL.
SOURCE: EEDAR
MONETIZATIONMOBILE GAMING FUNNEL
TOP 5 REASONS
1. IMPROVE / COMPLETE COLLECTION 2. REACH A PERSONAL GOAL3. HIGHER QUALITY EXPERIENCE4. NEW EXPERIENCES OR CONTENT5. PROGRESS MORE QUICKLY
1. PROGRESS MORE QUICKLY2. REACH A PERSONAL GOAL3. HIGHER QUALITY CONTENT4. INCREASE COMPETITIVE ABILITY5. NEW EXPERIENCES OR CONTENT
1. PROGRESS MORE QUICKLY2. HIGHER QUALITY EXPERIENCE3. INCREASE COMPETITIVE ABILITY4. NEW EXPERIENCES OR CONTENT5. REACH A PERSONAL GOAL
*For full data by region, please see pg. 74 of each regional report.
JAPAN
SOUTH KOREA
CHINA
CONSISTENT WITH NORTH AMERICA DIFFERS FROM NORTH AMERICA
[2015][NORTH AMERICA][ADULT MOBILE GAMING PAYERS]

35© COPYRIGHT 2015. ELECTRONIC ENTERTAINMENT DESIGN AND RESEARCH. PROPRIETARY AND CONFIDENTIAL.
SOURCE: EEDAR
MONETIZATIONMOBILE GAMING FUNNEL
TOP 5 REASONS
1. PERMANENT GAME-AFFECTING2. EXPANDED OPTIONS / SERVICES3. PERFORMANCE BOOSTS4. NEW LEVELS / CONTENT5. RESOURCES
1. PERMANENT GAME-AFFECTING2. RESOURCES3. EXPANDED OPTIONS / SERVICES4. NEW LEVELS / CONTENT5. PROGRESS BOOSTS
1. RESOURCES2. VIP ACCESS3. PERMANENT GAME-AFFECTING4. PERMANENT COSEMETIC5. PERFORMANCE BOOSTS
*For full data by region, please see pg. 75 of each regional report.
JAPAN
SOUTH KOREA
CHINA
CONSISTENT WITH NORTH AMERICA DIFFERS FROM NORTH AMERICA
[2015][NORTH AMERICA][ADULT MOBILE GAMING PAYERS]
CONSUMABLE PURCHASES
• RESOURCES – instant replenishment of lives, energy, currency or other resources• PERFORMANCE BOOSTS – items used to temporarily boost stats or score• PROGRESS BOOSTS – items used to temporarily boost the speed of experience or resource gain• WAIT-TIME REDUCTION – purchases that instantly complete a timed activity (such as construction)
PERSISTENT PURCHASES
• NEW LEVELS / CONTENT • PERMANENT GAME-AFFECTING ITEMS – e.g. premium buildings, characters, skills, weapons• PERMANENT COSMETIC ITEMS – e.g. premium outfits, skins, accessories• EXPANDED OPTIONS / SERVICES – e.g. unlocking additional items slots, additional builders• VIP ACCESS – single purchase or subscription based access to higher quality experiences

36© COPYRIGHT 2015. ELECTRONIC ENTERTAINMENT DESIGN AND RESEARCH. PROPRIETARY AND CONFIDENTIAL.
SOURCE: EEDAR
CHURNMOBILE GAMING FUNNEL
LOSS OF INTEREST is the single biggest reason for mobile gamers to stop playing a game.
• Across all regions, it was selected most frequently, and nearly twice as frequently as the next leading motivation for churn.
• This highlights the importance of providing steady content updates that provide not only additional content, but also include new innovations or variations to maintain interest.
WHY DO MOBILE GAMERS STOP PLAYING GAMES?
MOST LIKELY TO CHURN: when they encounter notable friction points (requiring too much effort/time to bypass or spending real money), or when the game fails to meet their expectations.
LEAST LIKELY TO CHURN: based on external factors (including friends stopping play, poor customer service, life changes), or due to negative social experiences.
MOST LIKELY TO CHURN: when they find it difficult to progress through the content due to friction, steep difficulty curves or long loading times.
LEAST LIKELY TO CHURN: based social factors (friends stopping play or poor interactions with other players), or due to poor support in the form of bad customer service or unsatisfying updates.
MOST LIKELY TO CHURN: when games become too difficult, requiring too much time, effort or money to progress.
LEAST LIKELY TO CHURN: based on social factors (friends stopping play, or poor interactions with others), technical issues or poor customer service, or external factors (e.g. change of life, new device, etc.).
MOST LIKELY TO CHURN: when the investment curve is too steep (requiring too much time or money, or when the game feels to difficult), or a game fails to meet their expectations.
LEAST LIKELY TO CHURN: based on external factors (including friends stopping play, poor customer service, life changes), or due to negative in-game experiences (technical issues or poor interactions with others).
DISCOVERY
ENGAGEMENT
VIRALITY
MONETIZATION
CHURN
*For additional analysis by region, please see pg. 76 of each regional report.

37© COPYRIGHT 2015. ELECTRONIC ENTERTAINMENT DESIGN AND RESEARCH. PROPRIETARY AND CONFIDENTIAL.
SOURCE: EEDAR
CHURNMOBILE GAMING FUNNEL
TOP 5 REASONS
1. LOST INTEREST2. ENJOYED OTHER GAMES MORE3. NOT WHAT WAS EXPECTED4. TOO MUCH TIME / EFFORT5. HAD TO PAY REAL MONEY
1. LOST INTEREST2. TOO MUCH TIME / EFFORT3. ENJOYED OTHER GAMES MORE4. HAD TO PAY REAL MONEY5. BECAME TOO DIFFICULT
1. LOST INTEREST2. TOO MUCH TIME / EFFORT3. HAD TO PAY REAL MONEY4. LOADING TIMES TOO LONG5. BECAME TOO DIFFICULT
*For full data by region, please see pg. 77 of each regional report.
JAPAN
SOUTH KOREA
CHINA
CONSISTENT WITH NORTH AMERICA DIFFERS FROM NORTH AMERICA

MOBILE GENRE OVERVIEW

39© COPYRIGHT 2015. ELECTRONIC ENTERTAINMENT DESIGN AND RESEARCH. PROPRIETARY AND CONFIDENTIAL.
SOURCE: EEDAR
MOBILE GENRE SYSTEMMOBILE GENRE OVERVIEW
BROAD / CASUAL
BROAD / CASUAL
NICHE / CORE
PUZZLE
ARCADE
SKILL & CHANCE
SIMULATION
RACING
RPG
STRATEGY
ACTION
SPORTS
MATCHINGBRAINPHYSICS
MUSIC / RYTHM ENDLESS RUNNER GENERAL ARCADE
CASINO SKILL CASINO CHANCE NON-CASINO SKILL & CHANCE
CITY BUILDER/ RESOURCE MANAGMENT
SIMULATION
RACING SIMULATION ARCADE RACING
ROLEPLAYING GAME SOCIAL RPG / CARD BATTLE
TRADITIONAL TCG
SHOOTER
TEAM MANAGEMENT
ACTION / FIGHTING ACTION BUILDER
GENERAL STRATEGY COMBAT CITY BUILDER
SPORT SIMULATION
EEDAR CLASSIFIES GENRES FROM CORE TO
CASUAL BASED ON HOW ACCESSIBLE AND
BROADLY APPEALING THEIR EXPERIENCES ARE.
CASUAL GAMES - BROADLY APPEALING,
HIGHLY ACCESSIBLE EXPERIENCES, REQUIRING
MINIMAL INVESTMENT AND SKILL TO BE
SUCCESSFUL.
CORE GAMES - MORE NICHE IN THEIR APPEAL,
REQUIRING GREATER INVESTMENT, FOCUS, AND
SKILL TO MEANINGFULLY PARTICIPATE.

40© COPYRIGHT 2015. ELECTRONIC ENTERTAINMENT DESIGN AND RESEARCH. PROPRIETARY AND CONFIDENTIAL.
SOURCE: EEDAR
TOP GENRES PLAYEDMOBILE GENRE OVERVIEW
TOP 5 GENRES
1. PUZZLE2. RPG3. SIMULATION4. ARCADE5. ACTION
1. PUZZLE2. ARCADE3. SIMULATION4. STRATEGY5. RACING
1. PUZZLE2. ARCADE3. SKILL & CHANCE4. ACTION5. STRATEGY
*Detailed breakdowns of regional market size, player demographics, and genre overlaps can be found on pgs. 79-92 of each regional report.
JAPAN
SOUTH KOREA
CHINA
CONSISTENT WITH NORTH AMERICA DIFFERS FROM NORTH AMERICA
Genre playership across regions follows roughly the same pattern:
• More accessible, Casual-friendly experiences are among the most played for all regions – esp. Puzzles and Arcade.
• The least popular genres by region tended to be those with more niche appeal, e.g. Sports, and those with a more limited presence in the market.

GENRE SUMMARIES

SUMMARY
From how and where mobile gamers play to their top motivations for spending, EEDAR’s Deconstructing Mobile & Tablet Gaming 2015 report provides the insight that you need to make informed decisions about the mobile gaming market. Data in the 2015 Deconstructing Mobile & Tablet Gaming Report is from a consumer survey measuring the attitudes and behaviors of a representative sample of three thousand North American (USA and CA), one thousand Japanese, one thousand Chinese and one thousand South Korean active adult mobile gamers.
KEY BENEFITS
• Demographic profiles for mobile gamers, including average age and gender breakdowns on a per-genre basis
• Data on how players use their devices, which device category they prefer, and their preferred control methods
• The most common discovery sources for mobile games, along with the most frequent factors related to player churn
• Mobile game genre market sizes, organized by gender, preferred device, and market share
• Segmented response data by player spend, investment, and motivations for gaming
The Industry Standard for Understanding the Mobile Gaming Market
CONTACTFor full report pricing and more information contact Cooper Waddell at [email protected] or visit http://www.eedar.com/Contact.aspx
Gain a holistic understanding of the entire mobile gaming market, with data on game discovery, player engagement, virality, monetization and churn.
See detailed breakdowns of demographics and payer segmentations for each genre on a regional basis, and compare that to worldwide data to provide greater context.
Learn about the most commonly used devices, preferred genres, and purchasing habits of mobile gamers from around the world.
DECONSTRUCTING MOBILE & TABLET GAMING 2015FULL REPORT NOW AVAILABLE FOR PURCHASE!