Decoding the neural drive to muscles from the surface ... · Decoding the neural drive to muscles...
8
Invited review Decoding the neural drive to muscles from the surface electromyogram Dario Farina a, * , Aleš Holobar b,c , Roberto Merletti b , Roger M. Enoka d a Center for Sensory-Motor Interaction (SMI), Department of Health Science and Technology, Aalborg University, Aalborg, Denmark b Laboratory for Engineering of the Neuromuscular System, Department of Electronics, Politecnico di Torino, Torino, Italy c Faculty of Electrical Engineering and Computer Science, University of Maribor, Maribor, Slovenia d Department of Integrative Physiology, University of Colorado at Boulder, CO, USA article info Article history: Accepted 22 October 2009 Available online 4 May 2010 Keywords: EMG Amplitude cancellation Motor unit Decomposition Spike train abstract This brief review discusses the methods used to estimate the neural drive to muscles from the surface electromyogram (EMG). Surface EMG has been classically used to infer the neural activation of muscle by associating its amplitude with the number of action potentials discharged by a population of motor neurons. Although this approach is valuable in some applications, the amplitude of the surface EMG is only a crude indicator of the neural drive to muscle. More advanced methods are now available to esti- mate the neural drive to muscle from the surface EMG. These approaches identify the discharge times of a few motor units by decomposing the EMG signal to determine the relative changes in neural activation. This approach is reliable in several conditions and muscles for isometric contractions of moderate force, but is limited to the few superficial units that can be identified in the recordings. Ó 2010 International Federation of Clinical Neurophysiology. Published by Elsevier Ireland Ltd. All rights reserved. Contents 1. Introduction ........................................................................................................ 1616 2. Amplitude of the surface EMG ......................................................................................... 1617 3. Decomposition ...................................................................................................... 1619 4. Representativeness and accuracy ....................................................................................... 1621 5. Conclusion ......................................................................................................... 1622 Acknowledgements .................................................................................................. 1622 References ......................................................................................................... 1622 1. Introduction The central nervous system controls the force generated by a muscle with recruitment of motor units and adjustments in their discharge rates (Adrian and Bronk, 1929). The number of action potentials discharged by the motor neurons innervating the mus- cle constitutes the neural drive from the spinal cord to the muscle. Due to a high safety margin at the nerve–muscle synapse, action potentials discharged by the motor neurons usually emerge as ac- tion potentials that propagate along the muscle fibers. Thus, the ensemble of electrical activity generated by a muscle is strongly associated with the magnitude of the motor command discharged by the motor neuron pool. The electrical activity in muscle can be recorded with electrodes placed over the skin. The resulting surface electromyogram (EMG) is the sum of the action potentials generated by the motor units and filtered by the volume conductor. The shape of each motor unit action potential depends on the number and anatomical character- istics of the innervated muscle fibers, and on the properties of the recording electrodes (Farina et al., 2002). The magnitude of the neural drive to muscle can be quantified from the surface EMG by identifying the number of motor unit action potentials gener- ated per time unit. Although the amplitude of the surface EMG is often used to esti- mate the magnitude of the neural activation sent to muscle, there are some limitations to this interpretation. First, the size of a motor unit action potential at the surface of the skin is only partly related to motor neuron size (Keenan et al., 2006). Second, the relative 1388-2457/$36.00 Ó 2010 International Federation of Clinical Neurophysiology. Published by Elsevier Ireland Ltd. All rights reserved. doi:10.1016/j.clinph.2009.10.040 * Corresponding author. Address: Center for Sensory-Motor Interaction (SMI), Department of Health Science and Technology, Aalborg University, Fredrik Bajers Vej 7 D-3, DK-9220 Aalborg, Denmark. Tel.: +45 96358821; fax: +45 98154008. E-mail address: [email protected] (D. Farina). Clinical Neurophysiology 121 (2010) 1616–1623 Contents lists available at ScienceDirect Clinical Neurophysiology journal homepage: www.elsevier.com/locate/clinph
Transcript of Decoding the neural drive to muscles from the surface ... · Decoding the neural drive to muscles...
Clinical Neurophysiology 121 (2010) 1616–1623
Contents lists available at ScienceDirect
Clinical Neurophysiology
journal homepage: www.elsevier .com/locate /c l inph
Invited review
Decoding the neural drive to muscles from the surface electromyogram
Dario Farina a,*, Aleš Holobar b,c, Roberto Merletti b, Roger M. Enoka d
a Center for Sensory-Motor Interaction (SMI), Department of Health Science and Technology, Aalborg University, Aalborg, Denmarkb Laboratory for Engineering of the Neuromuscular System, Department of Electronics, Politecnico di Torino, Torino, Italyc Faculty of Electrical Engineering and Computer Science, University of Maribor, Maribor, Sloveniad Department of Integrative Physiology, University of Colorado at Boulder, CO, USA
a r t i c l e i n f o
Article history:Accepted 22 October 2009Available online 4 May 2010
Keywords:EMGAmplitude cancellationMotor unitDecompositionSpike train
1388-2457/$36.00 � 2010 International Federation odoi:10.1016/j.clinph.2009.10.040
* Corresponding author. Address: Center for SensDepartment of Health Science and Technology, AalboVej 7 D-3, DK-9220 Aalborg, Denmark. Tel.: +45 9635
E-mail address: [email protected] (D. Farina).
a b s t r a c t
This brief review discusses the methods used to estimate the neural drive to muscles from the surfaceelectromyogram (EMG). Surface EMG has been classically used to infer the neural activation of muscleby associating its amplitude with the number of action potentials discharged by a population of motorneurons. Although this approach is valuable in some applications, the amplitude of the surface EMG isonly a crude indicator of the neural drive to muscle. More advanced methods are now available to esti-mate the neural drive to muscle from the surface EMG. These approaches identify the discharge times of afew motor units by decomposing the EMG signal to determine the relative changes in neural activation.This approach is reliable in several conditions and muscles for isometric contractions of moderate force,but is limited to the few superficial units that can be identified in the recordings.� 2010 International Federation of Clinical Neurophysiology. Published by Elsevier Ireland Ltd. All rights
reserved.
Contents
1. Introduction . . . . . . . . . . . . . . . . . . . . . . . . . . . . . . . . . . . . . . . . . . . . . . . . . . . . . . . . . . . . . . . . . . . . . . . . . . . . . . . . . . . . . . . . . . . . . . . . . . . . . . . . 16162. Amplitude of the surface EMG . . . . . . . . . . . . . . . . . . . . . . . . . . . . . . . . . . . . . . . . . . . . . . . . . . . . . . . . . . . . . . . . . . . . . . . . . . . . . . . . . . . . . . . . . 16173. Decomposition . . . . . . . . . . . . . . . . . . . . . . . . . . . . . . . . . . . . . . . . . . . . . . . . . . . . . . . . . . . . . . . . . . . . . . . . . . . . . . . . . . . . . . . . . . . . . . . . . . . . . . 16194. Representativeness and accuracy . . . . . . . . . . . . . . . . . . . . . . . . . . . . . . . . . . . . . . . . . . . . . . . . . . . . . . . . . . . . . . . . . . . . . . . . . . . . . . . . . . . . . . . 16215. Conclusion . . . . . . . . . . . . . . . . . . . . . . . . . . . . . . . . . . . . . . . . . . . . . . . . . . . . . . . . . . . . . . . . . . . . . . . . . . . . . . . . . . . . . . . . . . . . . . . . . . . . . . . . . 1622
Acknowledgements . . . . . . . . . . . . . . . . . . . . . . . . . . . . . . . . . . . . . . . . . . . . . . . . . . . . . . . . . . . . . . . . . . . . . . . . . . . . . . . . . . . . . . . . . . . . . . . . . . 1622References . . . . . . . . . . . . . . . . . . . . . . . . . . . . . . . . . . . . . . . . . . . . . . . . . . . . . . . . . . . . . . . . . . . . . . . . . . . . . . . . . . . . . . . . . . . . . . . . . . . . . . . . . 1622
1. Introduction
The central nervous system controls the force generated by amuscle with recruitment of motor units and adjustments in theirdischarge rates (Adrian and Bronk, 1929). The number of actionpotentials discharged by the motor neurons innervating the mus-cle constitutes the neural drive from the spinal cord to the muscle.Due to a high safety margin at the nerve–muscle synapse, actionpotentials discharged by the motor neurons usually emerge as ac-tion potentials that propagate along the muscle fibers. Thus, theensemble of electrical activity generated by a muscle is strongly
f Clinical Neurophysiology. Publish
ory-Motor Interaction (SMI),rg University, Fredrik Bajers8821; fax: +45 98154008.
associated with the magnitude of the motor command dischargedby the motor neuron pool.
The electrical activity in muscle can be recorded with electrodesplaced over the skin. The resulting surface electromyogram (EMG)is the sum of the action potentials generated by the motor unitsand filtered by the volume conductor. The shape of each motor unitaction potential depends on the number and anatomical character-istics of the innervated muscle fibers, and on the properties of therecording electrodes (Farina et al., 2002). The magnitude of theneural drive to muscle can be quantified from the surface EMGby identifying the number of motor unit action potentials gener-ated per time unit.
Although the amplitude of the surface EMG is often used to esti-mate the magnitude of the neural activation sent to muscle, thereare some limitations to this interpretation. First, the size of a motorunit action potential at the surface of the skin is only partly relatedto motor neuron size (Keenan et al., 2006). Second, the relative
ed by Elsevier Ireland Ltd. All rights reserved.
Rettangolo
Rettangolo
Rettangolo
Rettangolo

D. Farina et al. / Clinical Neurophysiology 121 (2010) 1616–1623 1617
contribution of an action potential to the amplitude of the EMGsignal may differ across conditions (Dimitrova and Dimitrov,2003). To circumvent these limitations, an alternative approachis to use the times of occurrence (discharge times) of the actionpotentials of individual motor units, identified by surface EMGdecomposition, to estimate the motor output from the spinal cord.
This brief review discusses the methods used to estimate theneural drive to muscles from the surface EMG. As detailed issuesrelated to classic approaches were reviewed previously (Farinaet al., 2004a), this review focuses on recent developments in inter-preting surface EMG amplitude and in decomposing the surfaceEMG to detect discharge times.
Fig. 1. (A) Surface EMG signal detected from the abductor digiti minimi muscle of ahealthy man during an isometric contraction of 10 s duration at 10% of the maximalforce. Intramuscular EMG signals were concurrently recorded with two pairs ofwire electrodes and single motor unit action potentials were identified bydecomposition (McGill et al. 2005). (B) Smoothed discharge rates were obtainedby filtering the point process representing the inverse of the interspike intervals(high-pass filtered with cut-off frequency 0.75 Hz and smoothed with Hannwindow of 400 ms duration) of the motor units identified from the intramuscularrecordings (n = 9 motor units). The neural activation was estimated by counting thetotal number of action potentials discharged by the 9 units in each 400 ms interval.(C) Comparison between the abduction force exerted by the little finger during thecontraction (grey line) and the neural activation estimated from the count of thenumber of action potentials in each 400 ms interval (black line) after removing theoffset in the two signals. (D) Comparison between the estimated neural activationfrom panel B (black line) and the amplitude of the surface EMG (grey line). Theamplitude of the surface EMG was estimated as the root mean square value in thesame intervals used for estimating the neural activation (400 ms in duration). au,Arbitrary units; pps, pulses per second.
2. Amplitude of the surface EMG
The amplitude of the surface EMG is usually estimated as thestandard deviation of the signal (Clancy and Hogan, 1994). Theaverage rectified value (ARV) and the root mean square (RMS) val-ues of the surface EMG are optimal estimators of amplitude whenthe EMG signal follows Laplacian and Gaussian distributions,respectively (Clancy and Hogan, 1999). These two estimators areequivalent in practical applications (Clancy et al., 2002). The useof signal amplitude as an indicator of the neural activation hastwo major drawbacks. First, the size of surface action potentialsdiffers among motor units and across conditions, which altersthe association between number of motor neuron discharges andsignal amplitude. Second, the sum of the surface action potentialsis less than the sum of the amplitudes of the individual potentials,a phenomenon that has been termed ‘‘amplitude cancellation”(Day and Hulliger, 2001; Keenan et al., 2005), which results inthe amplitude of the surface EMG underestimating the magnitudeof the motor output from the spinal cord and disrupts the associa-tion between changes in the two signals.
The variability in action potential size among motor units andacross conditions has been analyzed in several studies (Farinaet al., 2002; Dimitrova and Dimitrov, 2003; Dimitrov et al.,2008). It seems that the size of a surface action potential is onlymoderately associated with the size of the motor unit (Keenanet al., 2006) and that, conversely, the size depends on factors thatare difficult to control or limit in experimental conditions (e.g., thethickness of the subcutaneous layer; Dimitrov et al., 2002). Thus,the set of surface action potentials that represent the activity of apopulation of motor neurons has a broad distribution of sizes,which differs among subjects, conditions, and muscles. The abso-lute EMG amplitude (without normalization), therefore, providesa poor index of the neural drive to the muscle and absolute com-parisons are not appropriate (Dimitrova and Dimitrov, 2003).Rather, the surface EMG amplitude should be normalized to a valueobtained in a reference contraction, such as a maximal voluntarycontraction (Keenan et al., 2005; Yang and Winter, 1984).
Due to amplitude cancellation of motor unit action potentials insurface EMG recordings, the relation between surface EMG ampli-tude and number of action potentials per time unit would not belinear even if all the action potentials had the same size (Farinaet al., 2004a; Keenan et al., 2005). Amplitude cancellation nega-tively impacts the association between fluctuations in surfaceEMG amplitude and muscle force. Fig. 1 shows that small changesin the neural drive to the abductor digiti minimi muscle at lowcontraction forces, as estimated by counting the number of actionpotentials discharged by nine motor units per unit time (Fig. 1B),were strongly correlated with the exerted force (R = 0.88; Fig. 1C)but not with the surface EMG amplitude (R = 0.21; Fig. 1D). Also,there was a weak correlation between surface EMG amplitudeand force (R = 0.28). This example indicates that the amplitude of
the surface EMG provides only a crude measure of the changes inneural activation.
The amount of amplitude cancellation experienced by individ-ual action potentials can be predicted analytically (Farina et al.,2008a). It is greater for small potentials and increases as the ampli-tude of the interference signal increases (Farina et al., 2008a). Be-cause low-threshold motor units tend to produce smaller surfaceaction potentials than high-threshold units (Keenan et al., 2006),it is the surface action potentials of the low-threshold motor unitsthat are reduced more by amplitude cancellation, especially forhigh levels of muscle activity. As a consequence of this effect, thesurface EMG amplitude can be relatively insensitive to changesin the activity of low-threshold motor units. For example, Mottramet al. (2005) found that the discharge rate of low-threshold motorunits decreased more rapidly during one type of fatiguing contrac-tion compared with another type, whereas the change in theamplitude of the surface EMG was similar during the two tasks.Similarly, indexes of neural drive to the muscle based on EMGamplitude, such as the neuromuscular efficiency (Deschenes
Rettangolo
1618 D. Farina et al. / Clinical Neurophysiology 121 (2010) 1616–1623
et al., 2002), are largely biased toward changes in the activity ofhigh-threshold motor units due to the influence of amplitudecancellation.
The amount of amplitude cancellation may vary during fatigu-ing contractions due to changes in the interference EMG amplitudeand the shapes of the motor unit action potentials. When an indi-vidual sustains a submaximal contraction, the amplitude of thesurface EMG usually increases due to the recruitment of additionalmotor units (Garland et al., 1994; Person and Kudina, 1972; Rileyet al., 2008), the decrease in muscle fiber conduction velocities(Bigland-Ritchie et al., 1981; Merletti et al., 1990), and changesin the shapes of the intracellular action potentials (Dimitrova andDimitrov, 2002; Hanson and Persson, 1971). The adjustments thatoccur during fatiguing contractions change the distribution of ac-tion potential size and the amount of amplitude cancellation,which alters the relation between the neural activation of muscleand surface EMG amplitude, even when this is normalized.
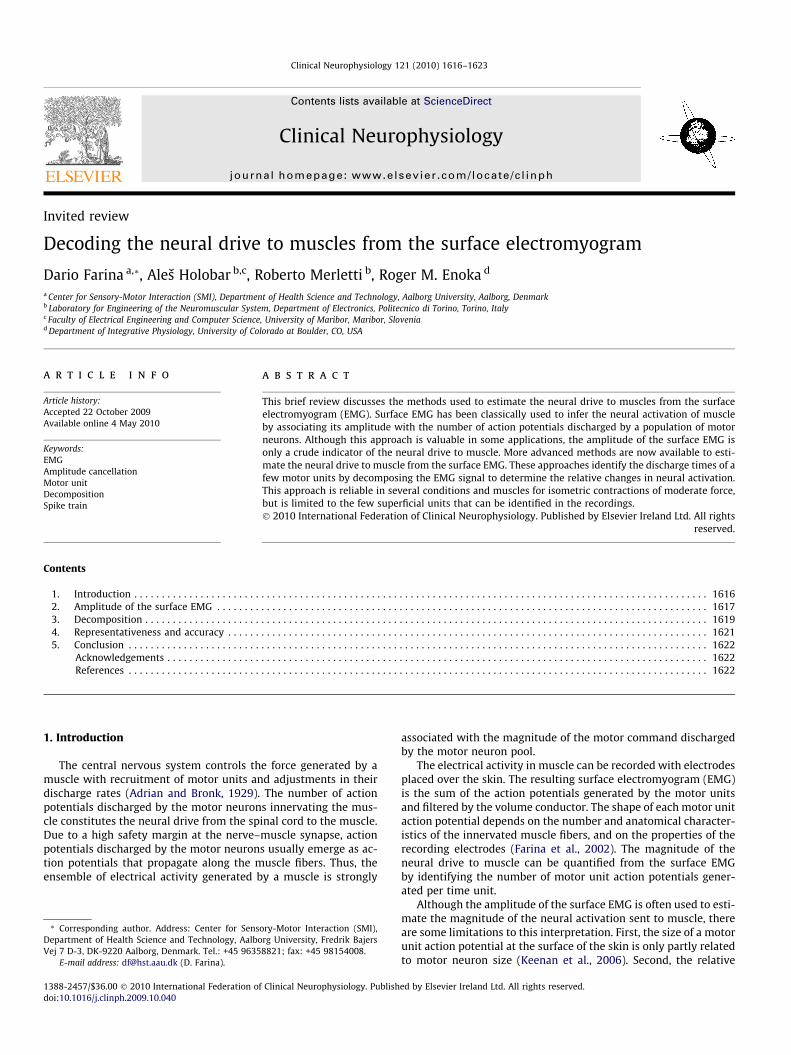
Fig. 2 shows a simulation analysis that exemplifies the limita-tions of surface EMG amplitude as a measure of neural activationduring sustained contractions. In this example, a population of mo-tor neurons was activated (Fuglevand et al., 1993) to sustain con-tractions at 30% and 60% of the maximal voluntary contraction(MVC) force until task failure, which corresponded to a decreasein simulated force by 2% MVC force for more than 2 s. The contrac-tile properties, recruitment, and discharge characteristics of the
Fig. 2. (A) Simulated forces during contractions at 30% and 60% of the maximal voluntarythe times of task failure for the two contractions, which was defined at the time when twith the first dorsal interosseus muscle. The number of motor units in the muscle was 12The other model parameters at the beginning of the tasks were similar to those describedadjustments that occur during fatiguing contractions (Dideriksen et al., 2009). (B) Thpotentials were generated with the EMG model proposed by Farina et al. (2004b). (C) Thenumber of discharges during an MVC contraction for the 30% MVC (filled circles) and thintervals corresponding to 5% of the time to failure for each task. (D) The root mean squa(C). (E) The amount of amplitude cancellation in the simulated surface EMG signals for thdifference in the amplitudes of the rectified and summed action potential trains (Keenanmotor unit.
motor units changed in response to the simulated accumulationof metabolites, according to a model of the intra- and extra-cellularcompartments (Dideriksen et al., 2009). Surface EMG action poten-tials were generated by a validated model (Farina et al., 2004b).The time to task failure in these simulations was 293 s for 30%MVC and 79 s for 60% MVC (Fig. 2A).
The number of action potentials discharged each second by allactive motor units (expressed as % of the number during anMVC) increased from 28% at the beginning of the contraction to61% at the end (30% MVC force) and from 52% to 62% (60% MVCforce) (Fig. 2C). This increase was due to the recruitment of addi-tional motor units during the contraction. Although the numberof action potentials per time unit was greater at the beginning ofthe stronger contraction (52% vs. 28%), it was similar at task failurefor the two tasks. The surface EMG amplitude (RMS) at task failurewas 62% and 88% of the MVC value for the 30% MVC and 60% MVCcontractions, respectively (Fig. 2D), despite a similar number of ac-tion potentials discharged per second. This discrepancy indicatesthat the relative changes in surface EMG amplitude during the sim-ulated contraction failed to represent some significant changes inthe neural drive. The dissociation between the changes in EMGamplitude and number of discharged action potentials were partlydue to differences in the amount of amplitude cancellation(Fig. 2E). Amplitude cancellation was similar at the beginning ofthe tasks (30% and 31%, respectively) but increased more for the
contraction (MVC) force. The open (60% MVC) and filled (30% MVC) circles indicatehe force decreased by 2% MVC force for 2 s. The simulations represent contractions0 and the upper limit of recruitment in the absence of fatigue was �60% MVC force.by Keenan et al. (2005); however, the parameters changed over time to simulate thee simulated surface EMG signals during the two contractions. Motor unit actiontotal number of discharges of all active motor units, expressed as a percentage of thee 60% MVC (open circles) tasks. The number of discharges was computed for time
re (RMS) value of the surface EMG signal computed for the same time intervals as ine same time intervals as in (C) and (D). Amplitude cancellation was computed as theet al., 2005), which is only possible in simulated conditions. au, Arbitrary units; MU,
Rettangolo

D. Farina et al. / Clinical Neurophysiology 121 (2010) 1616–1623 1619
30% MVC (38% at task failure) than for the 60% MVC task (32% attask failure). Although different trends in EMG amplitude can beobtained by choosing other model parameters, this example indi-cates that changes in surface EMG amplitude provide a poor indexof the modulation in neural activation during sustainedcontractions.
3. Decomposition
The main issue when using EMG amplitude to estimate the neu-ral drive to muscles is the influence of differences in action poten-tial shape on the composite signal. The use of EMG amplitude forthis purpose, however, assumes that the distribution of action po-tential shapes does not have a significant influence on the results,but this is not correct. In contrast, identification of the times atwhich action potentials are discharged by individual motor unitsfrom the interference EMG allows more direct access to the neuralcoding. The procedure to determine the discharge times is referredto as decomposition of the EMG signal (De Luca et al., 2006).
The classic approach to identifying motor unit action potentialsis based on intramuscular EMG signals (Adrian and Bronk, 1929) asthey provide greater selectivity than surface EMG signals. Recentadvances, however, have developed the option of decomposingthe surface EMG into its constituent motor unit action potentials
Fig. 3. (A) Surface EMG signals recorded from the abductor pollicis brevis muscle of a heacontraction (MVC) force. The signals were detected as bipolar recordings from an electrobipolar recordings; 5 mm interelectrode distance), with the columns aligned along thelocations at the instant indicated by the small dots and vertical lines in (A). Some of the rechannel surface EMG signal was decomposed (Holobar and Zazula, 2007) to identify 18 min (A) and these contributed to the amplitude of the interference EMG signal at that instaindicated in (A). The amplitude distribution of the interference signal shown in (B) corcommon to all amplitude maps. MU, motor unit.
(Holobar et al., 2009; see Merletti et al. (2008) for a review).Decomposition involves compensating for the shapes of the actionpotentials and identifying the underlying trains of motor unit ac-tion potentials (Holobar and Zazula, 2007). Contrary to simpler ap-proaches (Kallenberg and Hermens, 2006), the methodologyrequires distinguishing the action potentials of different motorunits, which is facilitated by recording the surface EMG from sev-eral locations over the muscle (Farina et al., 2008b; Fig. 3). These‘‘high-density surface EMG” systems (Blok et al., 2002; Merlettiet al., 2008) comprise several, closely spaced surface electrodes.
Fig. 3B shows the amplitude distribution of surface EMG signalsrecorded by 61 electrodes, from which 56 bipolar derivations wereobtained, at one instant in time. The amplitude values were deter-mined from the action potentials of the motor units that were ac-tive at that instant. The amplitude distributions of the motor unitpotentials that contributed to the interference signal at the indi-cated instant were obtained with a decomposition method (Holo-bar and Zazula, 2007). The sum of the motor unit amplitudedistributions (Fig. 3C) corresponds to the amplitude of the interfer-ence signal (Fig. 3B) with small error. These associations are validfor all other time instants and allow unequivocal identification ofthe motor unit discharge times as the initiation of the correspond-ing action potentials (decomposition of the signal). Conversely, theamplitude values of the interference signal recorded from only a
lthy man during an isometric contraction sustained at 10% of the maximal voluntaryde grid of five columns and 13 rows (with four missing electrodes at the corners; 56fiber direction. (B) Amplitude of the multi-channel EMG recording for all electrodecording locations are indicated by numbers corresponding to those in (A). The multi-otor units. Eight of the 18 motor units had action potentials at the instant indicatednt. (C) The amplitude of the action potentials of the eight motor units at the instantresponds closely to the sum of the amplitude distributions in (C). The colorbar is
Rettangolo
1620 D. Farina et al. / Clinical Neurophysiology 121 (2010) 1616–1623
few electrode locations can be described by multiple combinationsof motor unit action potentials, thus the decomposition wouldhave multiple solutions (Farina et al., 2008b).
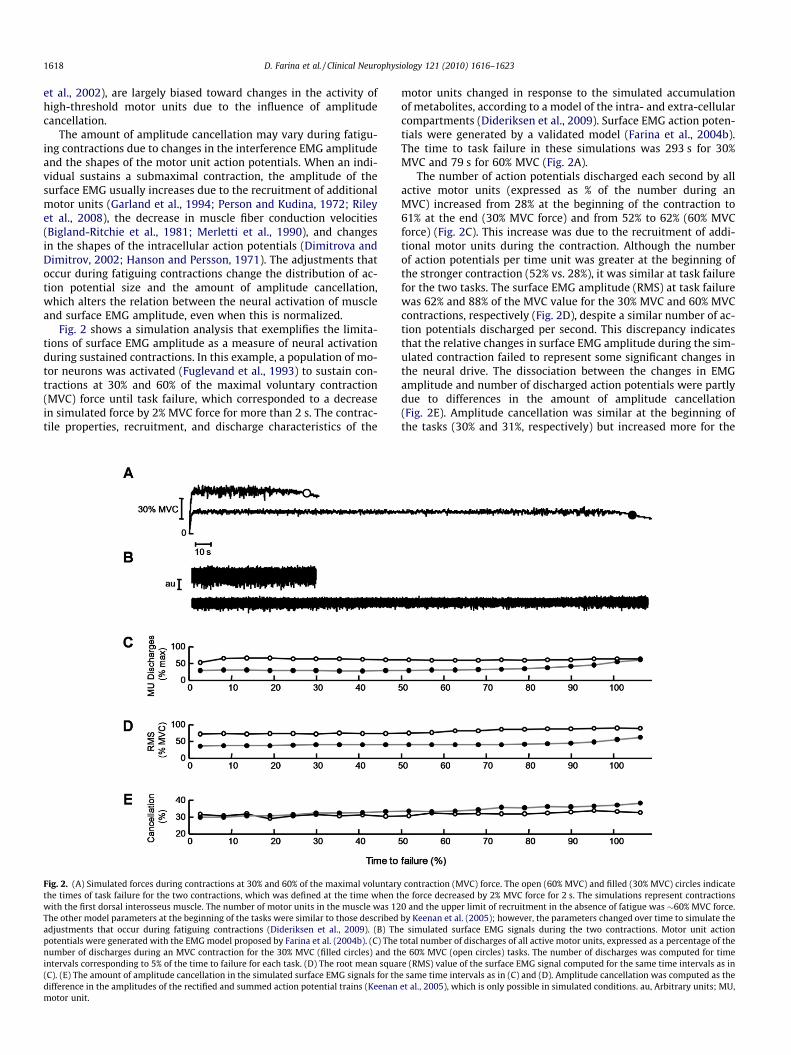
Among the methods developed for decomposing the surfaceEMG, the convolution kernel compensation (CKC) technique (Holo-bar and Zazula, 2007) has been extensively validated with bothsimulated and experimental signals (Holobar et al., 2009). Fig. 4shows an example of this procedure for experimental signals re-corded with a high-density surface EMG system from the bicepsbrachii muscle. Each motor unit is represented by its template ac-tion potential in terms of its shape and location (Fig. 4C). Theshapes of the action potentials usually differ across motor units
Fig. 4. (A) One channel of surface EMG recorded from the biceps brachii muscle of a heacontraction (MVC) force in 10 s, followed by holding the 10% MVC force for 10 s. Thedistance) and was decomposed with the method proposed by Holobar and Zazula (2007)of the surface EMG. (C) The multi-channel action potentials for six representative motorThe amplitude values (RMS) for each channel (5 � 13) are also reported on the right of eaother based on shape and location. MU, motor unit.
due to the high-density EMG recording (Farina et al., 2008b). Evenwhen action potentials of two different motor units have similarshapes on most of the multi-channel recordings (e.g., motor units2 and 8 in Fig 4C), the small but consistent differences on someof the other channels allow the decomposition of the multi-chan-nel EMG to discriminate between the two motor units. The exam-ple shown in Fig. 4 presents the discharge times of motor unitaction potentials identified during a ramp contraction so that therecruitment thresholds of the motor units could be estimated(Farina et al., 2009).
A comparison of decomposition results from concurrently re-corded intramuscular (assumed gold standard) and surface EMG
lthy man during a linear increase in force from 0% to 10% of the maximal voluntarysurface EMG was recorded with a grid of 5 � 13 electrodes (8 mm interelectrode. (B) Discharge times of 11 motor units that were identified from the decompositionunits out of the 11 identified, as averaged over all the discharge times of each unit.
ch action potential. The action potentials for these motor units all differed from each
Rettangolo
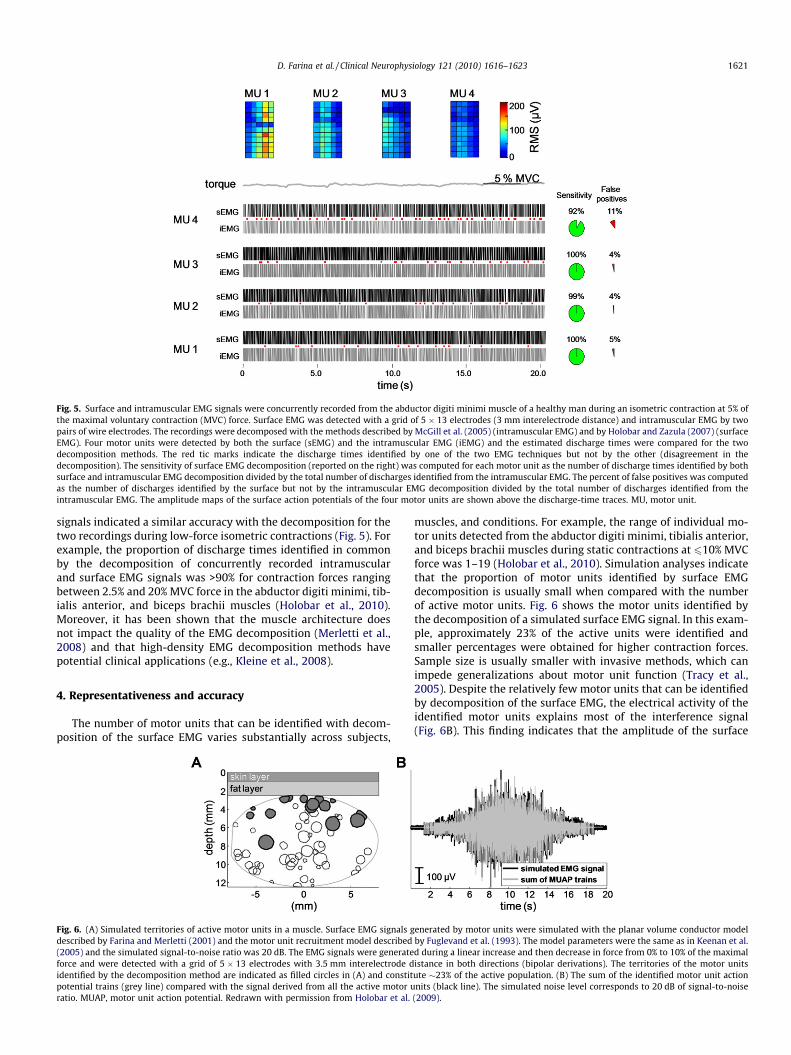
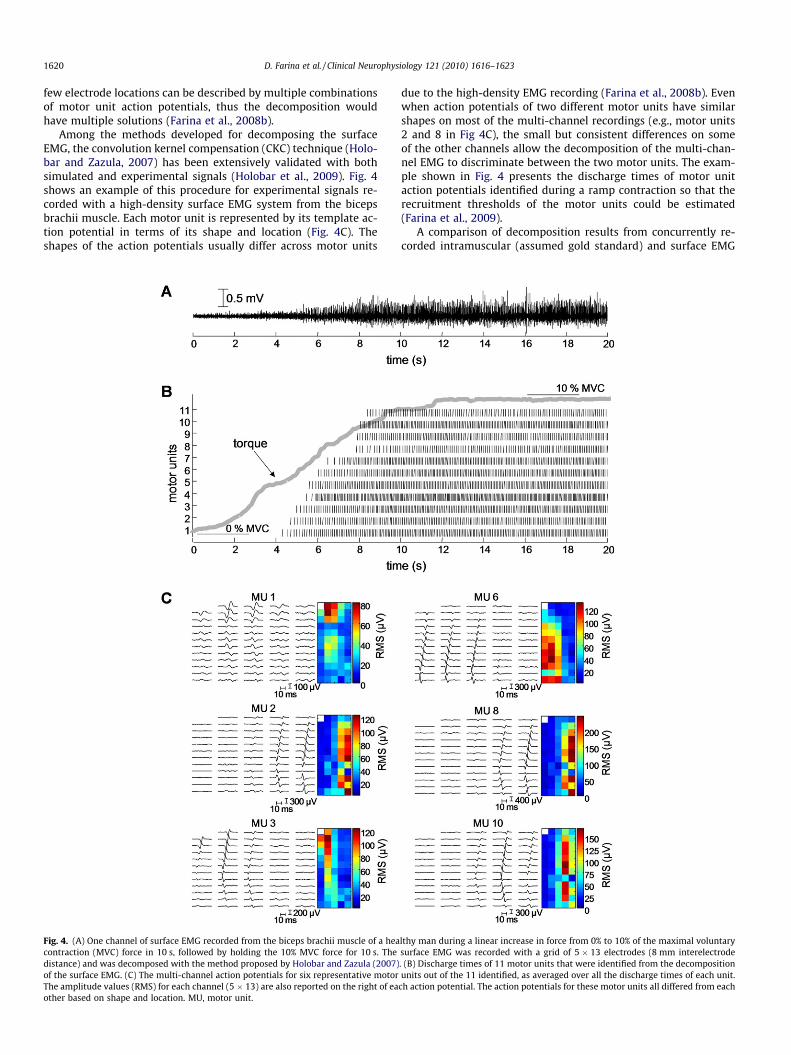
Fig. 5. Surface and intramuscular EMG signals were concurrently recorded from the abductor digiti minimi muscle of a healthy man during an isometric contraction at 5% ofthe maximal voluntary contraction (MVC) force. Surface EMG was detected with a grid of 5 � 13 electrodes (3 mm interelectrode distance) and intramuscular EMG by twopairs of wire electrodes. The recordings were decomposed with the methods described by McGill et al. (2005) (intramuscular EMG) and by Holobar and Zazula (2007) (surfaceEMG). Four motor units were detected by both the surface (sEMG) and the intramuscular EMG (iEMG) and the estimated discharge times were compared for the twodecomposition methods. The red tic marks indicate the discharge times identified by one of the two EMG techniques but not by the other (disagreement in thedecomposition). The sensitivity of surface EMG decomposition (reported on the right) was computed for each motor unit as the number of discharge times identified by bothsurface and intramuscular EMG decomposition divided by the total number of discharges identified from the intramuscular EMG. The percent of false positives was computedas the number of discharges identified by the surface but not by the intramuscular EMG decomposition divided by the total number of discharges identified from theintramuscular EMG. The amplitude maps of the surface action potentials of the four motor units are shown above the discharge-time traces. MU, motor unit.
D. Farina et al. / Clinical Neurophysiology 121 (2010) 1616–1623 1621
signals indicated a similar accuracy with the decomposition for thetwo recordings during low-force isometric contractions (Fig. 5). Forexample, the proportion of discharge times identified in commonby the decomposition of concurrently recorded intramuscularand surface EMG signals was >90% for contraction forces rangingbetween 2.5% and 20% MVC force in the abductor digiti minimi, tib-ialis anterior, and biceps brachii muscles (Holobar et al., 2010).Moreover, it has been shown that the muscle architecture doesnot impact the quality of the EMG decomposition (Merletti et al.,2008) and that high-density EMG decomposition methods havepotential clinical applications (e.g., Kleine et al., 2008).
4. Representativeness and accuracy
The number of motor units that can be identified with decom-position of the surface EMG varies substantially across subjects,
Fig. 6. (A) Simulated territories of active motor units in a muscle. Surface EMG signals gdescribed by Farina and Merletti (2001) and the motor unit recruitment model described(2005) and the simulated signal-to-noise ratio was 20 dB. The EMG signals were generateforce and were detected with a grid of 5 � 13 electrodes with 3.5 mm interelectrode didentified by the decomposition method are indicated as filled circles in (A) and constitpotential trains (grey line) compared with the signal derived from all the active motor uratio. MUAP, motor unit action potential. Redrawn with permission from Holobar et al.
muscles, and conditions. For example, the range of individual mo-tor units detected from the abductor digiti minimi, tibialis anterior,and biceps brachii muscles during static contractions at 610% MVCforce was 1–19 (Holobar et al., 2010). Simulation analyses indicatethat the proportion of motor units identified by surface EMGdecomposition is usually small when compared with the numberof active motor units. Fig. 6 shows the motor units identified bythe decomposition of a simulated surface EMG signal. In this exam-ple, approximately 23% of the active units were identified andsmaller percentages were obtained for higher contraction forces.Sample size is usually smaller with invasive methods, which canimpede generalizations about motor unit function (Tracy et al.,2005). Despite the relatively few motor units that can be identifiedby decomposition of the surface EMG, the electrical activity of theidentified motor units explains most of the interference signal(Fig. 6B). This finding indicates that the amplitude of the surface
enerated by motor units were simulated with the planar volume conductor modelby Fuglevand et al. (1993). The model parameters were the same as in Keenan et al.d during a linear increase and then decrease in force from 0% to 10% of the maximalistance in both directions (bipolar derivations). The territories of the motor unitsute �23% of the active population. (B) The sum of the identified motor unit actionnits (black line). The simulated noise level corresponds to 20 dB of signal-to-noise
(2009).
Rettangolo

1622 D. Farina et al. / Clinical Neurophysiology 121 (2010) 1616–1623
EMG does not represent the activity of a substantially larger num-ber of motor units than it is possible to identify through decompo-sition. Furthermore, both amplitude and EMG decomposition arebiased towards the motor units with the largest surface actionpotentials, i.e., large and superficial motor units.
Although both surface EMG amplitude and EMG decompositionprovide a limited representation of muscle activity and EMGamplitude is a less accurate identification of the neural activation,the decomposition of surface EMG is currently limited to low con-traction forces and to isometric conditions. These limitations donot apply to the analysis of neural activation with surface EMGamplitude that can be easily performed in any conditions.
Due to the relatively few motor units that are identified withdecomposition of the surface EMG, the number of motor neurondischarges is less than the output from the spinal cord. Moreover,it is not possible to estimate the deficit in the estimation of numberof discharges as this depends on factors that cannot be measuredor predicted. Consequently, it is not currently possible to obtainan absolute measure of the neural drive to the muscle by decompo-sition of the surface (or intramuscular) EMG, even at low contrac-tion forces. Nonetheless, relative changes in neural drive can beestimated from the limited sample of motor units if the behaviorof the detected units is representative of the population; that is,if the information contained in the ensemble of discharge patternshas low dimensionality (Negro et al., 2009).
Because the descending and sensory inputs diverge onto alphamotor neurons (Lawrence et al., 1985; Ishizuka et al., 1979), thereis some correlation between the low-frequency oscillations in mo-tor neuron discharge rates (De Luca et al., 1982). The low-fre-quency oscillations in the motor output from the spinal cord canoften be described by a low-dimensional signal extracted fromthe correlated activity of relatively few motor neurons (Negroet al., 2009). For this reason, the number of action potentials dis-charged per second by relatively few units in Fig. 1 was well corre-
Fig. 7. (A) Discharge times for 10 motor units identified in surface and intramus-cular EMG recordings from the abductor digiti minimi muscle during a contractionat 10% of the maximal force of 10 s. (B) Smoothed discharge rates were obtained forthe 10 motor units by filtering the point process representing the inverse of theinterspike intervals (Hann window of 400 ms duration and high-pass filtering at0.75 Hz to remove the mean value). (C) Principal components extracted from thesmoothed discharge rates shown in (B). The procedure for this analysis is describedin Negro et al. (2009). The percent of variance of the smoothed discharge ratesexplained by each principal component is reported on the right. The firstcomponent explained most of the variance. MU, motor unit; PC, principalcomponent.
lated with the force (Fig. 1C) and thus representative of the entireactive population. Fig. 7 shows a representative analysis of thedimensionality of the multivariate smoothed discharge rates of10 motor units in the abductor digiti minimi muscle during an iso-metric contraction at 10% of the maximal force. In this example,one signal represented most of the variance (>70%) in the set oflow-pass filtered discharge rates.
Despite the possibility of inferring changes in the neural activa-tion (mainly low-frequency components) from relatively few mo-tor units in some conditions (Fig. 7), more subtle adjustments inmotor neuron properties cannot be described as common changesin a population. For example, the changes in recruitment thresh-olds and discharge rate during intermittent fatiguing contractionsdiffer substantially among low-threshold motor units (Farinaet al., 2009). These changes cannot be inferred from only a limitednumber of units and require a larger sample. Moreover, thestrength of correlation in low-frequency components of motorneuron discharges may vary across muscles (De Luca and Erim,1994). Currently, there are no validated methods that can identifymost of the active motor units in vivo during a voluntarycontraction.
5. Conclusion
Surface EMG has been classically used to estimate the neuralactivation sent from the spinal cord to muscle by associating itsamplitude to the number of action potentials discharged by a pop-ulation of motor neurons. Although this approach is valuable insome applications, the amplitude of the surface EMG is a relativelycrude index of neural drive and does not detect small fluctuationsin motor unit activity or adjustments during fatiguing contractions.One of the major advances in surface EMG processing in recentyears is the development of techniques to identify the dischargetimes of individual motor units from the interference signal, withan accuracy that is similar to invasive methods. This approach,however, is limited to isometric contractions and to low forces,in contrast to the more widespread applications of surface EMGrecordings. An additional limitation of EMG decomposition is thatit identifies only a small proportion of the active units and thesetend to be located superficially in the muscle. Despite these limita-tions, surface EMG decomposition allows the accurate detection ofrelative changes in neural activation. As it seems unlikely that sur-face EMG methods can be used to identify deep motor units, acomplete decoding of the neural drive to muscle in vivo will likelyrequire joint multi-channel intramuscular and surface EMGrecordings (Farina et al., 2008c; Holobar et al., 2010).
Acknowledgements
The authors are grateful to Francesco Negro and Jakob LundDideriksen at Aalborg University for the help in the preparationof Figs. 1, 2 and 7.
GrantsPartly supported by the European Project TREMOR (Contract #
224051) (DF), a Marie Curie reintegration grant within the 7thEuropean Community Framework Programme (iMOVE, ContractNo. 239216) (AH), Compagnia di San Paolo and Fondazione CRT(RM), and the National Institute on Aging (AG009000; RME).
References
Adrian E, Bronk D. The discharge of impulses in motor nerve fibres. II. The frequencyof discharges in reflex and voluntary contractions. J Physiol 1929;204:231–57.
Bigland-Ritchie B, Donovan EF, Roussos CS. Conduction velocity and EMG powerspectrum changes in fatigue of sustained maximal efforts. J Appl Physiol1981;51:1300–5.
Rettangolo

D. Farina et al. / Clinical Neurophysiology 121 (2010) 1616–1623 1623
Blok JH, van Dijk JP, Drost G, Zwarts MJ, Stegeman DF. A high-density multichannelsurface electromyography system for the characterization of single motor units.Rev Sci Instrum 2002;73:1887–97.
Clancy EA, Hogan N. Single site electromyograph amplitude estimation. IEEE TransBiomed Eng 1994;41:159–67.
Clancy EA, Hogan N. Probability density of the surface electromyogram and itsrelation to amplitude detectors. IEEE Trans Biomed Eng 1999;46:730–9.
Clancy EA, Morin EL, Merletti R. Sampling, noise-reduction and amplitudeestimation issues in surface electromyography. J Electromyogr Kinesiol2002;12:1–16.
Day SJ, Hulliger M. Experimental simulation of cat electromyogram: evidence foralgebraic summation of motor-unit action-potential trains. J Neurophysiol2001;86:2144–58.
De Luca CJ, LeFever RS, McCue MP, Xenakis AP. Control scheme governingconcurrently active human motor units during voluntary contractions. JPhysiol 1982;329:129–42.
De Luca CJ, Erim Z. Common drive of motor units in regulation of muscle force.Trends Neurosci 1994;17:299–305.
De Luca CJ, Adam A, Wotiz R, Gilmore LD, Nawab SH. Decomposition of surface EMGsignals. J Neurophysiol 2006;96:1646–57.
Deschenes MR, Giles JA, McCoy RW, Volek JS, Gomez AL, Kraemer WJ. Neural factorsaccount for strength decrements observed after short-term muscle unloading.Am J Physiol Regul Integr Comp Physiol 2002;282:R578–83.
Dideriksen JL, Bækgaard M, Farina D, Enoka RM. A model of the surface EMGamplitude at task failure. Soc Neurosci; 2009 [abstract].
Dimitrov GV, Disselhorst-Klug C, Dimitrova NA, Trachterna A, Rau G. The presenceof unknown layer of skin and fat is an obstacle to a correct estimation of themotor unit size from surface detected potentials. Electromyogr ClinNeurophysiol 2002;42:231–41.
Dimitrov GV, Arabadzhiev TI, Hogrel JY, Dimitrova NA. Simulation analysis ofinterference EMG during fatiguing voluntary contractions. Part II – changes inamplitude and spectral characteristics. J Electromyogr Kinesiol 2008;18:35–43.
Dimitrova NA, Dimitrov GV. Amplitude-related characteristics of motor unit and M-wave potentials during fatigue. A simulation study using literature data onintracellular potential changes found in vitro. J Electromyogr Kinesiol2002;12:339–49.
Dimitrova NA, Dimitrov GV. Interpretation of EMG changes with fatigue: facts,pitfalls, and fallacies. J Electromyogr Kinesiol 2003;13:13–36.
Farina D, Merletti R. A novel approach for precise simulation of the EMG signalsdetected by surface electrodes. IEEE Trans Biomed Eng 2001;48:637–46.
Farina D, Cescon C, Merletti R. Influence of anatomical, physical, and detection-system parameters on surface EMG. Biol Cybern 2002;86:445–56.
Farina D, Merletti R, Enoka RM. The extraction of neural strategies from the surfaceEMG. J Appl Physiol 2004a;96:1486–95.
Farina D, Mesin L, Martina S, Merletti R. A surface EMG generation model withmultilayer cylindrical description of the volume conductor. IEEE Trans BiomedEng 2004b;51:415–26.
Farina D, Cescon C, Negro F, Enoka RM. Amplitude cancellation of motor-unit actionpotentials in the surface electromyogram can be estimated with spike-triggeredaveraging. J Neurophysiol 2008a;100:431–40.
Farina D, Negro F, Gazzoni M, Enoka RM. Detecting the unique representation ofmotor-unit action potentials in the surface electromyogram. J Neurophysiol2008b;100:1223–33.
Farina D, Yoshida K, Stieglitz T, Koch KP. Multichannel thin-film electrode forintramuscular electromyographic recordings. J Appl Physiol 2008c;104:821–7.
Farina D, Holobar A, Gazzoni M, Zazula D, Merletti R, Enoka RM. Adjustments differamong low-threshold motor units during intermittent, isometric contractions. JNeurophysiol 2009;101:350–9.
Fuglevand AJ, Winter DA, Patla AE. Models of recruitment and rate codingorganization in motor-unit pools. J Neurophysiol 1993;70:2470–88.
Garland SJ, Enoka RM, Serrano LP, Robinson GA. Behavior of motor units in humanbiceps brachii during a submaximal fatiguing contraction. J Appl Physiol1994;76:2411–9.
Hanson J, Persson A. Changes in the action potential and contraction of isolated frogmuscle after repetitive stimulation. Acta Physiol Scand 1971;81:340–8.
Holobar A, Zazula D. Multichannel blind source separation using convolution kernelcompensation. IEEE Trans Signal Process 2007;55:4487–96.
Holobar A, Farina D, Gazzoni M, Merletti R, Zazula D. Estimating motor unitdischarge patterns from high-density surface electromyogram. ClinNeurophysiol 2009;120:551–62.
Holobar A, Minetto MA, Botter A, Negro F, Farina D. Experimental analysis ofaccuracy in the identification of motor unit spike trains from high-densitysurface EMG. IEEE Trans Neural Syst Rehabil Eng 2010. doi:10.1109/TNSRE.2010.2041593.
Ishizuka N, Mannen H, Hongo T, Sasaki S. Trajectory of group is afferent fibersstained with horseradish peroxidase in the lumbosacral spinal cord of the cat:Three dimensional reconstructions from serial sections. J Comp Neurol1979;186:189–211.
Kallenberg LA, Hermens HJ. Behaviour of motor unit action potential rate, estimatedfrom surface EMG, as a measure of muscle activation level. J Neuroeng Rehabil2006;3:15.
Keenan KG, Farina D, Maluf KS, Merletti R, Enoka RM. Influence of amplitudecancellation on the simulated surface electromyogram. J Appl Physiol2005;98:120–31.
Keenan KG, Farina D, Merletti R, Enoka RM. Influence of motor unit properties onthe size of the simulated evoked surface EMG potential. Exp Brain Res2006;169:37–49.
Kleine BU, Stegeman DF, Drost G, Zwarts MJ. Interspike interval analysis in a patientwith peripheral nerve hyperexcitability and potassium channel antibodies.Muscle Nerve 2008;37:269–74.
Lawrence DG, Porter R, Redman SJ. Corticomotoneuronal synapses in the monkey:light microscopic localization upon motoneurons of intrinsic muscles of thehand. J Comp Neurol 1985;232:499–510.
McGill KC, Lateva ZC, Marateb HR. EMGLAB: an interactive EMG decompositionprogram. J Neurosci Methods 2005;149:121–33.
Merletti R, Knaflitz M, De Luca CJ. Myoelectric manifestations of fatigue in voluntaryand electrically elicited contractions. J Appl Physiol 1990;69:1810–20.
Merletti R, Holobar A, Farina D. Analysis of motor units with high-density surfaceelectromyography. J Electromyogr Kinesiol 2008;18:879–90.
Mottram CJ, Jakobi JM, Semmler JG, Enoka RM. Motor-unit activity differs with loadtype during a fatiguing contraction. J Neurophysiol 2005;93:1381–92.
Negro F, Holobar A, Farina D. Fluctuations in isometric muscle force can bedescribed by one linear projection of low-frequency components of motorneuron discharge rates. J Physiol 2009;587:5925–38.
Person RS, Kudina LP. Discharge frequency and discharge pattern of human motorunits during voluntary contraction of muscle. Electroencephalogr ClinNeurophysiol 1972;32:471–83.
Riley ZA, Maerz AH, Litsey JC, Enoka RM. Motor unit recruitment in human bicepsbrachii during sustained voluntary contractions. J Physiol 2008;586:2183–93.
Tracy BL, Maluf KS, Stephenson JL, Hunter SK, Enoka RM. Variability of motor unitdischarge and force fluctuations across a range of muscle forces in older adults.Muscle Nerve 2005;32:533–40.
Yang JF, Winter DA. Electromyographic amplitude normalization methods:improving their sensitivity as diagnostic tools in gait analysis. Arch Phys MedRehabil 1984;65:517–21.
Rettangolo