Deception and Self-Deception - Stanford University · section is split in two parts. Section 5...
33
Deception and Self-Deception Peter Schwardmann * Jo¨ el van der Weele May 10, 2016 Abstract Why are people so often overconfident? We conduct an experiment to test the hypoth- esis that people become overconfident to more effectively persuade or deceive others. After performing a cognitively challenging task, half of our subjects were informed they could earn money by convincing others of their superior performance. The privately elicited beliefs of informed subjects are 50 percent more overconfident and significantly less responsive to objective feedback than the beliefs of subjects in the control con- dition. Using random variation in confidence generated by our feedback mechanism, we also show that more confident subjects are indeed more persuasive in the ensuing face-to-face interactions. JEL-codes: C91, D03, D83. Keywords: Overconfidence, belief formation, self-deception, deception. * University of Munich. Contact: [email protected] University of Amsterdam, Tinbergen Institute. Contact: [email protected] We would like to thank Thomas Buser, Alexander Coutts, Johannes Maier, David de Meza, Klaus Schmidt, Paul Seabright, Amelie Wuppermann, Jeroen van de Ven and seminar audiences at the University of Amster- dam, the Toulouse Institute for Advanced Studies, Maastricht University, the University of Munich, and the TIBER symposium in Tilburg for helpful comments. Jonas Hannane provided excellent research assistance. 1
-
Upload
nguyendung -
Category
Documents
-
view
214 -
download
0
Transcript of Deception and Self-Deception - Stanford University · section is split in two parts. Section 5...
Deception and Self-Deception
Peter Schwardmann ∗ Joel van der Weele �
May 10, 2016
Abstract
Why are people so often overconfident? We conduct an experiment to test the hypoth-
esis that people become overconfident to more effectively persuade or deceive others.
After performing a cognitively challenging task, half of our subjects were informed they
could earn money by convincing others of their superior performance. The privately
elicited beliefs of informed subjects are 50 percent more overconfident and significantly
less responsive to objective feedback than the beliefs of subjects in the control con-
dition. Using random variation in confidence generated by our feedback mechanism,
we also show that more confident subjects are indeed more persuasive in the ensuing
face-to-face interactions.
JEL-codes: C91, D03, D83.
Keywords: Overconfidence, belief formation, self-deception, deception.
∗University of Munich. Contact: [email protected]�University of Amsterdam, Tinbergen Institute. Contact: [email protected]
We would like to thank Thomas Buser, Alexander Coutts, Johannes Maier, David de Meza, Klaus Schmidt,
Paul Seabright, Amelie Wuppermann, Jeroen van de Ven and seminar audiences at the University of Amster-
dam, the Toulouse Institute for Advanced Studies, Maastricht University, the University of Munich, and the
TIBER symposium in Tilburg for helpful comments. Jonas Hannane provided excellent research assistance.
1

“When a person cannot deceive himself the chances are against his being able to
deceive other people.”
Mark Twain, Autobiography of Mark Twain.
“Show me someone without an ego, and I’ll show you a loser.”
Donald Trump, How to Get Rich.
1 Introduction
There is ample evidence that the average person thinks he or she is more skillful, more
beautiful and kinder than others. Hundreds of studies have found such overconfidence in
different domains (Moore and Healy, 2008). At the same time, overconfidence is costly. It
leads financial traders to make less money (Barber and Odean, 2001; Biais and Hilton, 2005),
CEO’s to initiate more value-destroying mergers (Malmendier and Tate, 2008), entrepreneurs
to invest more often in low value projects (Koellinger et al., 2007; Dawson et al., 2015) and
results in excess entry into competition (Camerer and Lovallo, 1999).
In the face of these costs, an important question is whether there are offsetting benefits
that justify the persistence of overconfidence. Social scientists most commonly stress the
affective benefits of overconfidence that are associated with a good self-image, ameliorated
anxiety about an uncertain future, or the savouring of future successes (e.g. Kunda, 1990;
Baumeister, 1998; Brunnermeier and Parker, 2005; Koszegi, 2006; Benabou, 2013). However,
it is unclear why such desires would survive natural or cultural selection.
An alternative theory, which is the focus of this paper, posits that the benefits of over-
confidence are social in nature. In a series of papers and a book, Robert Trivers argues
that overconfidence, or self-deception more generally, makes it easier to convince or deceive
others about one’s qualities as it obviates the need for conscious deception (Trivers, 1985,
2011; Von Hippel and Trivers, 2011). Following George Costanza’s maxim “it’s not a lie
when you believe it”, deceiving yourself may reduce the “tells” associated with lying, as well
as the moral costs of lying that play an important role in communication (Gneezy, 2005).
We experimentally test the hypothesis that overconfidence serves to more effectively
persuade or deceive others. Participants first perform an intelligence test, and receive a
small remuneration depending on their relative performance. Afterwards, a randomly chosen
subset of participants is informed of the possibility to earn money by persuading another
2

participant in a face-to-face interaction that they outperformed their peers on the intelligence
test. Before this interaction takes place, we elicit private beliefs about relative performance,
using monetary incentives for truthful reporting.
Our main hypothesis is that subjects who are informed of a profitable deception op-
portunity will be more (over)confident about their performance. We find that the shadow
of future interactions indeed increases overconfidence by about 50 percent relative to the
control group. We also find an increase in the overconfidence gap between the two groups
following unbiased but noisy feedback on performance, as the control group is more respon-
sive to the feedback. We explore the role of lying aversion and the fear of getting caught as
drivers of such self-deception, using personality measures and experimental variations in the
communication environment.
Our second aim is to test whether self-deception about performance indeed provides the
social benefits conjectured by Trivers. Drawing clear causal inferences about the effects of
confidence on social success is impossible in most datasets, due to potential reverse causality
or unobserved covariates like beauty or extraversion (e.g. Mobius and Rosenblat, 2006).
Our experiment is uniquely designed to solve this problem, as our noisy feedback mechanism
generates exogenous variation in confidence. This allows clean estimation of the causal effect
of confidence on the outcome of the interaction stage.
We first demonstrate that subjects’ communication strategies reflect an implicit apprecia-
tion of the benefits of higher confidence. Subjects condition their message on their confidence,
with higher confidence leading to higher stated confidence. We then show that confidence
indeed raises evaluations in the interaction stage. Specifically, the level of self-deception
observed in our treatment group increases the expected payoffs in the interaction stage by
20 percent, evaluated at the average confidence level.
In a treatment variation in which evaluators follow a short lie-detection tutorial, the ben-
eficial effect of confidence disappears, and actual performance becomes a more important
determinant of earnings. This suggests that self-deception is most beneficial in interac-
tions where the other side finds it difficult to detect true ability. In these settings, our
results provide affirmative evidence for the claims of an enormous popular self-help litera-
ture that presents confidence as the road to success. While self-help books usually point to
correlational evidence that highly successful people are also usually confident, we find that
confidence causes success in our stylized interactions.
To our knowledge, this is the first paper to provide clean evidence from fully incentivized
elicitation procedures that people self-deceive in pursuit of social advantage, and also the first
paper to document clean causal evidence about the advantages of confidence. Understanding
why people self-deceive is important to assess the welfare implications of overconfidence. In
3

particular, whereas self-deception’s affective benefits may increase welfare, its use to obtain
a strategic advantage in a zero sum game may decrease it, and provide a rationale for policy
initiatives that seek to curb overconfidence.
This paper proceeds as follows. In the next section we discuss the existing literature
and our use of concepts like “overconfidence” and “self-deception” in more detail. Section
3 presents our experimental design, before Section 4 describes our hypotheses. The results
section is split in two parts. Section 5 investigates the impact of our main treatment effect on
belief formation and the degree of overconfidence. In Section 6 we ask whether overconfidence
is in fact effective in deceiving others. Section 7 interprets our results and makes some
proposals for future research.
2 Literature and concepts
The first part of our paper addresses the social and strategic origins of overconfidence.
As far as we know, there are no behavioral studies that provide direct evidence for the
social origins of self-deception, although Von Hippel and Trivers (2011) cite multiple studies
showing that people are impressed by confidence in others, and that confidence plays a role
in the selection of leaders. A few recent articles provide suggestive evidence for the social
origins of overconfidence. Burks et al. (2013) find a correlation between overconfidence
about performance on a cognitive test and a measure of social dominance in a sample of
trainee truck drivers. They argue that the data are consistent with overconfidence as a
social bias. Charness et al. (2013) find that experimental participants use public statements
about their own ability strategically to deter others from engaging in competition with
them. Ewers and Zimmermann (2015) show that the desire to impress an audience causes
experimental subjects to state higher confidence. Thoma (2015) demonstrates that when
others can observe their degree of overconfidence about task performance, men strategically
deflate confidence in order to appear more likable. Note that Burks et al. (2013) measure
private beliefs, but don’t vary the strategic context, whereas Charness et al. (2013), Ewers
and Zimmermann (2015) and Thoma (2015) vary the context of the interaction, but don’t
measure private beliefs.1 Our study does both.
Anderson et al. (2012) present an extensive study on the relation between status and
overconfidence. In a series of experiments, they find that overconfident people enjoy higher
status in a group. Moreover, people who are primed with a desire to achieve status rate
themselves higher relative to others on series of skills and abilities relevant for attaining
higher status in a business context. Our study goes beyond this by studying the effects of
1Charness et al. (2013) measure private beliefs, but only in one of their conditions.
4

an actual social interaction rather than a prime, and by providing monetary incentives for
reporting accurate beliefs.2
In economics, a small theoretical literature has developed to explain overconfident or
optimistic beliefs as stemming from a (possibly subconscious) optimization process. In an
early paper, Akerlof and Dickens (1982) bring the concept of cognitive dissonance to eco-
nomics. Benabou and Tirole (2002) explain overconfidence as a strategy to maintain personal
motivation for people who find it difficult to see through their plans. Compte and Postle-
waite (2004) model the optimal degree of confidence under the assumption that confidence
enhances performance. Brunnermeier and Parker (2005) argue that, in the presence of “an-
ticipatory utility”, some degree of overoptimism or overconfidence is optimal. Although it
will lead to slightly worse decisions, starting from realistic beliefs, this effect is second order
relative to the utility from increased hopefulness. Benabou (2013) shows how anticipatory
utility concerns can lead to groupthink in organisations and markets. Koszegi (2006) studies
information preferences and task choice by individuals with self-image concerns. Bodner
and Prelec (2002) and Benabou and Tirole (2011) show how, in the presence of uncertainty
about one’s own preferences, people use actions to influence their own beliefs about their
deep characteristics. Bracha and Brown (2012) provide a model in which affective influences
color risk perceptions, leading to suboptimal decisions.
In Brunnermeier and Parker (2005), as in most of the above models, overconfidence is
predicted to be decreasing in the material costs and increasing in the psychological benefits
associated with biased beliefs. These predictions are vindicated by laboratory evidence in
Mijovic-Prelec and Prelec (2010) and field evidence in Oster et al. (2013), but are not entirely
consistent with the laboratory evidence in Mayraz (2012) and Coutts (2015), who find that
beliefs are not responsive to material costs.
The second part of our paper relates to the literature on lying and lie-detection. There
is a large literature on lie detection in psychology (see Vrij, 2008, for an overview), demon-
strating that non-professionals are generally not very good at detecting lies (e.g. Ekman
and O’Sullivan, 1991; DePaulo, 1994). Nevertheless, there are some physiological clues that
reliably indicate lying, such as pupil dilation (Wang et al., 2010), or fake smiles (Ekman et
al., 1988). Belot and Van de Ven (2016) criticize the psychological literature for lack of in-
centives for deceit and detection, and the lack of contextual richness of the interaction. They
conduct face to face interviews between buyers and sellers and show that buyers are able to
detect fraudulent sellers with a rate that is above chance, although contextual richness does
2Anderson et al. (2012) write on page 731: “[W]e cannot know with certainty whether overconfidentindividuals truly believed that they were highly competent, or whether they were merely reporting whatthey wished to believe.”
5

not seem to matter much in this setting. Our paper uses a similar face to face interaction,
but with a highly structured verbal message.
Finally, we make some remarks on terminology. In the remainder of this paper, “overcon-
fidence” is defined as the overestimation of one’s ability relative to others, or “overplacement”
in the terminology of Moore and Healy (2008). Using belief measurements that incentivize
truthful reporting, several recent studies have documented such overplacement when it comes
to ego-related variables like beauty or intelligence (Eil and Rao, 2011; Grossman and Owens,
2012; Mobius et al., 2014), where the latter is also the focus of this paper.3
Throughout this paper we use “self-deception” to describe strategic shifts in confidence.
The use of the term “self-deception”has been criticized by Kurzban (2011) and Kahan (2016),
amongst others. Kurzban argues that in a modular conception of the brain there is little
space for a “self” that is being deceived, while Kahan points out that treating motivated
cognition as a “bias” obscures the rationality that lies behind motivated belief structures.
We do not take a strong position in this debate, but we think that “self-deception” is a useful
concept for our purposes, as it captures both the strategic nature of beliefs reported by an
individual (the “deception” part) and the fact that people apparently made these beliefs
their own to a sufficient degree that they are willing to bet on them (the “self” part).4
3 Experimental Design
Our experiment was programmed in z-tree (Fischbacher, 2007) and run over the course of a
week in March 2015 at the Munich Experimental Laboratory for Economic and Social Sci-
ences. 288 subjects participated in 18 sessions of exactly 16 subjects each.5 The experiment
lasted slightly over 1 hour and the average subject earned 16.45 Euros (min. 4 Euros, max.
28.5 Euros).6
The experiment had two parts, that we will refer to as the “self-deception stage” and the
3While Benoıt and Dubra (2011) show that overconfidence may result from a rational or Bayesianinterpretation of available evidence, Burks et al. (2013) demonstrates that not all aspects of overconfidencecan be explained by such a model.
4Note that our paper does not satisfy the criterion for self-deception posed in Gur and Sackeim (1979),as we do not show that subjects hold two contradicting beliefs at the same time. Yet, the use of monetaryincentives for truthful reporting of beliefs in own performance shows that strategic considerations can leadsubjects to firmly hold a systematically inflated belief about themselves, which we consider evidence forself-deception.
5We piloted our design with 32 subjects in December 2014. With 16 subjects in either condition, wefound some preliminary, not statistically significant evidence for our main treatment effect (Hypothesis 1),with a difference in privately reported prior beliefs of 11 ppt: average beliefs were 54 in the control, 65 inthe treatment (p = 0.37 MWU test).
6Full instructions can be downloaded from https://www.dropbox.com/s/0eotp4q7qcaa21f/
Instructions.pdf?dl=0.
6

Employers only All subjects Contestants only
• Training in belief elicitation
• Raven intelligence task• Information about interview
Self- • Warning about lie detectionDeception tutorial (TW only)
Stage • Elicitation of prior belief• Noisy performance signal• Elicitation of posterior belief
• Instructions for interactionDeception • Lie detection tutorial
Stage (TW and TnW only)• Face to face interaction
• Elicitation of evaluations • Lying aversion elicitation
• Profit announcements• Questionnaire
Table 1: Timeline of tasks and information by role.
“deception stage”. In the self-deception stage, we investigated whether the announcement
of a profitable deception opportunity had an influence on beliefs about their own perfor-
mance on an intelligence test. To this end, we separated the group into “contestants”, who
were informed about the later deception opportunity, and a “control” group, who was not.
In the deception part, we investigated whether (over)confidence made the contestants more
persuasive, as predicted by the theory. To this end, contestants competed to persuade “em-
ployers” of their performance on the intelligence test in a face to face interaction. Employers
were the same participants who constituted the control group in the self-deception stage of
the experiment. They could earn money by giving accurate assessments of contestants test
results. Contestants could earn money by obtaining high assessments. The sequencing of
experimental tasks is depicted in Figure 3. We now explain the design of the experiment in
more detail.
3.1 Self-deception stage
After coming into the lab, participants were introduced to the belief elicitation mechanism
they would face later. The mechanism consisted of a variation of the Becker-DeGroot-
Marshak procedure, known as “matching probabilities” or “reservation probabilities”. Un-
der this mechanism participants indicate which probability p makes them indifferent between
7

winning a monetary prize with probability p, and winning the same prize when an uncertain
event E occurs. After participants indicated the point of indifference in a list of probabili-
ties, one probability was randomly drawn from the list and participants were awarded their
preferred lottery for that probability. Under this mechanism, reporting the true subjective
probability of E maximizes expected value, regardless of risk preferences.7 We explained
the procedure as well as the fact that truthful reporting maximizes expected value. This
stage took about 15 minutes, and we proceeded only once all subjects correctly answered
four control questions about the belief elicitation.
Participants were then divided into anonymous groups of four and proceeded to the intel-
ligence task. The task consisted of 15 Raven matrices of varying difficulty, and participants
had 10 minutes to solve as many as they could. Participants obtained 2 points for each
correct answer and lost 1 point for each incorrect or omitted answer. The subjects with
the two top scores in their anonymous group of four earned 2 Euros. Their earnings, and
hence their ranking within the group, were only communicated to them at the end of the
experiment.
We administered our main treatment after the intelligence task. Of the four groups of
four in each session, two groups were given the role of “contestants” and two groups were
designated as controls. While the control group was not told anything about the interview
stage at this point, we informed contestants of the following key points:
• In the next part of the experiment you will take the role of contestant.
• You will conduct face to face interviews with 4 subjects in the role of employers, who, after
interviewing every member of your group, are paid for correctly identifying whether your test
score was amongst the best 2 of your group.
• You are paid for one of your interviews that is selected at random
• If the employer in this interview ranks you as being amongst the top 2 of your
group, you will receive an additional 15 Euros.
• Employers are paid for evaluating contestants as accurately as possible.
7The veracity of this claim has been established by different authors, and the mechanism has beenreinvented several times, see Schlag et al. (2015) for an overview.
8

While the difference in information about the interview constitutes our main treatment,
we performed two further treatments. First, two thirds of the employers, were given a
short tutorial in lie-detection during the deception stage of the experiment (see below).
Second, half of the contestants facing employers who did the tutorial (so one third of overall
contestants), were “warned” before the belief elicitation that their employer had received a
“lie-detection tutorial”. These treatment variations were designed to vary the interaction
environment as well as the pressure on contestants to appear credible even when lying.
After contestants received information about the interview stage, participants in both
treatment and control group were asked to submit their beliefs using the incentive compatible
mechanism explained above. The event about which beliefs were elicited was “the probability
that you are amongst the Top 2 performers in your group of four”. In the remainder of the
paper, we will refer to this event as “Top 2”. The prize in the elicitation stage was 3 euros.
The instructions made it very salient that elicited beliefs were strictly confidential and would
never be shown to another subject.
After participants submitted their beliefs, we gave them noisy feedback on their perfor-
mance. Participants were told that they would be shown a ball drawn from one of two virtual
urns containing 20 balls of different colors. If their performance was actually in the Top 2,
the ball would come from an urn with 15 black balls and 5 red balls. If their performance
was not in the Top 2, the ball would come from an urn with 15 red balls and 5 black balls.
Thus, a black ball constituted “good news” about their performance, where the likelihood
ratio was 0.75/0.25 = 3. We will use the fact that the feedback had a random component to
assess the impact of variation in confidence in the second stage. After subjects had observed
the ball, they reported their belief about being in Top2 for a second time, which concluded
the self-deception stage of the experiment.
3.2 Deception stage
The 16 subjects in a session were divided into two groups, each consisting of 4 contestants
and 4 “employers”, where the latter were part of the control group in the first stage of the
experiment. Sessions were equally divided between three experimental conditions, which
differed in the tutorial for lie detection. In condition “No Tutorial” (NT), employers were
not trained in lie detection. In condition “Tutorial no Warnings” (TnW), employers were
trained in lie detection but contestants were not warned about this. In condition “Tutorial
and Warning” (TW), employers were trained and contestants warned about this training.
In treatments TW and TnW, employers proceeded to the lie detection tutorial, which
took several minutes. On the computer screen they observed four tips on how to recognize
9
“tells” associated with lying, namely fidgeting, face-touching, fast breathing and incongruent
facial expressions. In addition, the tutorial explained that avoidance of eye contact is an
unreliable indicator of lying, as it is easily corrected by an experienced liar.
Before the interviews, employers were given a paper evaluation sheet for each contestant
on which to write down the contestant’s message and their evaluations of the contestants rel-
ative performance, honesty, confidence, likability and attractiveness. The interviews followed
a speed dating protocol. Employers left their computer stations and positioned themselves
in front of the contestants. There were four rounds of interviews so that every employer
would get to interview each of the four contestants in the same group. Interviews in any
round took place behind partitions to assure a minimal level of privacy.
On the ring of a bell, contestants said one sentence: “I believe that my performance was
in the top 2 of my group with ... percent probability”. In the blank, the contestants verbally
filled in a number between 0 and 100. In the remainder, we will refer to this number as the
contestant’s “message”. During the interviews, none of the 144 contestants said anything
more than this sentence. After the sentence was said there were a few seconds in which
employers could scrutinize contestants faces and body language, before the bell rang again
to mark the end of a round. Employers were given time to fill in their evaluations, before
moving to the next contestant. The reason we kept the interaction minimalistic is to keep
control over the interview stage as much as possible. This allows us to exploit instrumental
variable techniques for contestant’s confidence, as we will explain below.
After the four rounds of interviews, employers returned to their computer stations and
entered their evaluations as well as contestants’ messages into the computer. Each employer
had to state the probability she attached to each of the contestant’s being in the Top2. The
four elicited probabilities had to add up to 200. One of these evaluations was then selected at
random and the employer was paid for it according to the familiar Becker-DeGroot-Marshak,
with the chance to win 10 euros in the case of a favorable outcome.
Meanwhile, contestants participated in a task that elicited their degree of lying aversion,
based on Gibson et al. (2013). During this task, participants are asked to imagine themselves
in the position of a company CEO, who can earn money by deceiving shareholders about
the companies’ value. Using a Becker-DeGroot-Marshak mechanism, participants are asked
to indicate repeatedly whether they would report deceptively or not, were the amount of
money they could earn from doing so was increased in four steps from 0 cents to 120 cents.
Afterwards, all subjects filled out a questionnaire with background characteristics as well as
the “assertiveness” scale from the Big 5 personality questionnaire.
10

4 Hypotheses
Our main hypothesis is based on Von Hippel and Trivers (2011). It postulates that con-
testants engage in self-deception to become more (over)confident than the control group,
because this helps them convince employers of their relative success. We measure overcon-
fidence on the sample level, as the difference between the average belief that a subject is in
the top 2 of a group of 4 and 50 percent, the true average probability that someone is in the
top 2.
Hypothesis 1 Contestants are on average more overconfident than employers.8
Our next hypothesis relates to the possible reasons for strategic self-deception. Let us
define a lie as the difference between stated confidence and privately held beliefs. Suppose
larger lies have a higher probability of being detected because contestants’ cognitive costs
and give-away cues are increasing in the size of a lie. Then overconfidence may be useful,
because it allows contestants to state higher confidence levels, while keeping the size of the lie
constant, or, alternatively, because it enables them to state the same confidence while lying
less. Here we make the implicit assumption (which is vindicated by our data) that contestants
benefit from higher stated confidence because receivers put some weight on contestants’
messages. As this channel relates to the cognitive technology behind deception, we call this
the “technological motive” for self-deception. We conjecture that its relative importance
is increasing in the probability that a lie is detected and hence, that contestants who are
warned about the employer’s lie detection tutorial should become more overconfident.
Even if lies are never detected, there may be moral costs from deceiving another person
(Gneezy, 2005). A (subconscious) desire to avoid such costs gives a “moral motive” for self-
deception (McKay et al., 2011). For example, Di Tella and Perez-Truglia (2015) show that
people will negatively bias their beliefs about other people in order to avoid feeling obliged
to donate money to them. We therefore hypothesize that more lying-averse individuals, as
measured by the task in Gibson et al. (2013), have a higher incentive to self-deceive.9
Hypothesis 2 Contestants are more overconfident if
a) they are warned about the employer’s lie-detection tutorial, and
8Note that this hypothesis constitutes a stronger test than the theory requires. The theory maintainsthat natural selection has produced the capacity to self-deceive because of its social advantages. This doesnot necessarily imply that this capacity will always, or only, be used when deception possibilities are present.It is compatible with the idea that self-deceivers arrive at overconfidence through heuristics that apply evenwhen the strategic situation does not ask for it.
9Whether this translates into higher degrees of overconfidence depends on whether lying aversion extendsalso to lying to oneself. However, since self-deception seems a largely unconscious process, unlike guilt fromlying to others, we conjecture that higher lying costs increase overconfidence.
11

b) they are more lying averse.
Self-deception may occur in part through the biased processing of information, so it is
important to understand how subjects respond to feedback about their performance. Studies
focusing on affective motives for self-deception have found that people update their beliefs
differently when it comes to ego-related variables (Grossman and Owens, 2012; Eil and Rao,
2011). Mobius et al. (2014) show that subjects attempt to maintain their overconfidence
by updating “asymmetrically” (putting relatively more weight on good signals) and “con-
servatively” (being less responsive to both good and bad signals than Bayesian updating
prescribes). If we observe differences in initial beliefs between the two groups, we conjec-
ture that our contestants, who have an interest in maintaining optimistic beliefs, update
asymmetrically and conservatively to a greater degree than the control group.
Hypothesis 3 Contestants are less responsive to information and place relatively higher
weight on good signals than employers.
Burks et al. (2013), find that socially “dominant” individuals, as measured by the as-
sertiveness scale on the Big 5 questionnaire, exhibit more overconfidence. They go on to
conjecture that this is because socially dominant individuals attribute more importance to
the belief of others about their ability. Following this logic, dominant individuals should
exhibit a greater treatment effect in our experiment, since contestants, unlike our controls,
expect to be exposed to an audience.
Hypothesis 4 Socially dominant individuals are more overconfident, and being a contestant
increases overconfidence more if an individual is socially dominant.
The final set of hypotheses relates to the effect of (over)confidence on persuasiveness.
Whether contestants find it profitable to self-deceive depends on their subjective beliefs
about whether confidence pays. A good indication of whether confidence if perceived as an
asset is whether contestants condition their communication strategies on their confidence.
In particular, we expect higher private beliefs to result in higher stated confidence.
Hypothesis 5 More confident contestants report a higher likelihood of being in the top 2 to
the employer.
One of the core elements of Trivers’ theory is that increased confidence ultimately provides
an advantage to the self-deceiver. In our experiment, this means that additional confidence
increases interview performance, which leads to pecuniary benefits or, more generally, utility
12

from being seen as capable. While distinguishing between these two benefits is beyond the
scope of this paper, we will investigate the causal effect of increased confidence on both
employers’ evaluations and the resulting monetary gains of the contestants.
Hypothesis 6 For a given level of performance, more confident contestants will obtain bet-
ter evaluations.
5 Results of the self-deception stage
5.1 Do deception opportunities increase confidence?
Our first and main hypothesis is that the possibility of deception will lead to greater over-
confidence, as measured by the difference between average beliefs and 50 percent, the actual
probability that the average subject is in the top half. We first look at subject’s beliefs
before they received feedback, i.e. “prior beliefs”, and then turn to post-feedback “posterior
beliefs”. Appendix A provides density plots of the distributions of scores as well as prior
and posterior beliefs by treatment.
Figure 1 shows that prior overconfidence amongst contestants (12.2 ppt) is about 50 per-
cent higher than amongst subjects in the control group (8.3 ppt). Put differently, roughly one
third of contestants’ overconfidence can be attributed to a strategic motive. The difference
in beliefs is significant at the 5 percent level (p = 0.049, Mann-Whitney U test).10
Table 2 presents a series of OLS regressions investigating the determinants of prior be-
liefs. The first column shows that the treatment effect is significant at the 5 percent level,
controlling for individual test scores. In the second column, we restrict our dataset to contes-
tants, and look at the effects of a warning that employers received a lie detection tutorial as
well as the impact of lying aversion. The latter variable is a dummy that takes the value of
1 if the the participant’s aversion to lying is higher than the median, and zero otherwise. In
line with Hypothesis 2, both coefficients are positive. However, neither is close to statistical
significance.
The third column confirms the finding in Burks et al. (2013) that socially dominant
individuals are more overconfident.11 Here, “Dominant” is a dummy variable that takes a
value of 1 if the dominance score on the personality scale is higher than the median. The
coefficient is similar in size to that of being a contestant, but only significant at the 10 percent
10While present our results in terms of overconfidence to highlight the direction of the bias in averagebeliefs, confidence intervals and test statistics are computed based on individual measures confidence.
11For this regression we have 16 fewer observations than in Column 1, because a technical glitch causedus to loose the data of one session’s questionnaire.
13

02
46
810
1214
Aver
age
over
confi
denc
e
Prior beliefs Posterior beliefs
Control Contestant
Figure 1: Average overconfidence by experimental role, as measured by the average stated probabilitythat the contestant is in the top half of performers, minus 50 percent. Bars represent 95 percent confidenceintervals for our confidence measure, and are omitted for posterior beliefs, which are not normally distributed.
level. In the final column, we investigate the hypothesis that dominant individuals exhibit
a more pronounced treatment effect. The insignificant and negative interaction term allows
us to reject Hypothesis 4 and Burks et al. (2013)’s conjecture that dominant individuals
are more driven to impress others. Instead, this suggests that social dominance reflects a
preference over one’s own rather than others’ beliefs about one’s relative standing. This
point receives corroboration in Section 6.2, where we find that the dominance dummy is not
correlated with stated confidence, once we control for private beliefs.
5.2 Does confidence converge after feedback?
Next we investigate the effect of unbiased feedback on overconfidence in control and treat-
ment group. Figure 1 shows that after an unbiased noisy signal overconfidence goes down
in both groups. However, contestants’ post-feedback overconfidence (9.7 ppt) is now more
than twice as high as the control group’s (4.7 ppt). Due to the binary nature of the feed-
back signal, the distribution of posterior beliefs becomes quite dispersed, and the difference
in means of our confidence measure is only significant at the 10 percent level (p = 0.066,
Mann-Whitney U test).12
Figure 2 explains why posterior beliefs in the different conditions do not converge. The
bars show the average shortfall of the belief update relative to the rational Bayesian update,
12Appendix A shows the distribution of posteriors. Posteriors are clearly not normally distributed. There-fore, we omit confidence intervals in Figure 1, which would seem artificially small.
14

(1) (2) (3) (4)Score 0.993*** 0.954*** 0.987*** 0.985***
(0.111) (0.174) (0.119) (0.119)
Contestant (d) 3.737** 4.401** 5.265*(1.885) (1.972) (2.861)
Warned (d) 1.843(2.867)
Lie av. (d) 1.917(2.717)
Dominant (d) 3.937* 4.770(2.017) (2.929)
Contestant * Dominant (d) -1.641(3.951)
Constant 45.47*** 48.05*** 43.42*** 42.94***(2.053) (3.206) (2.246) (2.598)
Observations 288 144 272 272R2 0.211 0.192 0.222 0.223
Table 2: OLS regressions of confidence on task scores and treatment dummies. “Dominant” and “Lie av.”are dummy variables that takes the value 1 if the personality score is above the median. Robust standarderrors in parentheses. ∗p < 0.10,∗∗ p < 0.05,∗∗∗ p < 0.01.
where the latter is computed for each participant on the basis of the prior belief and the
strength of the noisy signal. After every signal, participants update less than Bayesianism
prescribes, so both control and treatment group exhibit conservatism. In line with Hypothesis
3, updates are lower in the contestant’s sample, with marginal statistical significance (p =
0.099, two-sided MWU). Contestants are therefore slightly less responsive to information
than the control group, which allows them to preserve their optimistic beliefs. When we
separately graph the belief updates following positive and negative signals, we observe the
same difference, although it is more pronounced for positive signals (p = 0.0264, two-sided
MWU) than negative signals (p = 0.635, two-sided MWU). This latter result is not in line
with the part of Hypothesis 3 that states that contestants place relatively more weight on
positive signals. Note however, that both within the contestant and control group, average
conservatism is not significantly different between good and bad signals.13
A potential caveat to these results is that differences in updating reflect differences in
priors for the two groups, or accidental differences in the proportion of good and bad signals
13Part of the difference in conservatism between the two groups is driven by subjects who update irreg-ularly. There is a small number (17, or 6 percent) of participants who update in the wrong direction, anda larger number (65, or 22.6 percent) who don’t update at all. Combined, these “irregular” updates aremore frequent amongst the contestants than amongst the control group (p = 0.089, 2-sided Fisher Exacttest), driving part, but not all, of the finding that contestants are more conservative. Note that the failureto update may itself be motivated and consistent with our hypotheses.
15

05
1015
| Bay
esia
n up
date
- ac
tual
upd
ate
|
All signals Good signal Bad signal
Control Contestant
Figure 2: Conservatism by information condition and signal. Conservatism is measured as the average ofthe absolute value of the Bayesian update minus the actual update.
received, which, based on the experimental design, should be equal across groups. To check
this we run logistic regressions, i.e. linearized versions of Bayes’ rule, which allow us to
control for the prior belief and the signal’s direction Mobius et al. (see 2014). The results,
reported in Appendix B, show that contestants are indeed more conservative than the control
group. Over the whole sample, we do not replicate the result by Mobius et al. (2014) that
participants update asymmetrically. In fact, we find the opposite, as participants put slightly
more weight on low signals, a tendency that is somewhat more pronounced for contestants.
Finally, when we replicate Table 2 for the posterior beliefs, reported in Appendix B, we find
that the quantitative effects of both being warned about the employers’ tutorial and being
lying averse on overconfidence have increased, with the latter almost achieving significance.
Summary 1 Participants that are informed about a profitable deception opportunity are
initially about 50 percent more overconfident about their performance on the intelligence task.
The provision of feedback reduces overconfidence across the board, but contestants are less
responsive to feedback than the control group. After the self-deception stage of the experiment,
contestants are on average more than twice as overconfident as the control group.
6 Results of the deception stage
In the previous section we showed that the shadow of profitable deception opportunities
increases overconfidence amongst participants. We now investigate how confidence influences
16
contestants’ communication strategies and whether higher confidence pays off by raising the
probability that a contestant gets hired.
6.1 Identification strategy
We cannot rely on mere correlations to establish a causal relationship between contestant
confidence and the messages sent by the contestant or the evaluations by the employer.
Such correlations may be spurious as contestants’ confidence may correlate with many unob-
served determinants of contestants’ messages and employers’ evaluations. For example, more
beautiful people may be more confident, experience positive discrimination in evaluations
(Mobius and Rosenblat, 2006) and, other things equal, be less likely to lie because they are
more able to achieve favorable social outcomes without inflating their stated confidence.
Instead, we make use of the random, exogenous variation in contestants’ confidence re-
sulting from the noise component of the feedback signal. By keeping the interactions mini-
malistic, we were able to assure that subjects were not able to communicate their feedback
signal during the interviews. The variation in signals therefore could not affect evaluations in
any other way than through confidence, making it a valid instrument. As far as we are aware,
the exogenous variation inherent in our signal allows us to provide the first unambiguously
causal evidence linking confidence to outcomes in competitive environments.
In the first stage of the 2SLS regressions that follow, we regress contestants’ posterior
beliefs about their relative performance on a dummy variable that takes a value of 1 if the
subject saw a black ball (the favorable signal) as well as a dummy that takes a value of 1 if
the contestant was in fact in the top 2 to (perfectly) control for the non-random component
of the signal and further assure the instrument’s validity. All first stage regressions (which
we omit to save space) feature an instrument that is significant at the 0.5 percent level and
R-squared values of 0.3. The first stage F-statistic is reported in our second stage regression
tables.
In the following analysis, we distinguish between three conditions: the NT condition
where employers were not trained in lie-detection and contestants were not warned, the
TnW condition where there was training but no warning, and the TW condition in which
there was training and a warning to contestants.
6.2 Do more confident contestants send higher messages?
A prerequisite for a social advantage of self-deception is that increased confidence is used
to communicate a high performance more convincingly to the employer. Thus, contestants
should increase the verbal estimate of their performance to the employer (“the message”)
17

Condition All contestants NT & TnW TW(1) (2) (3)
Posterior (Signal) 0.308*** 0.486*** 0.053(0.10) (0.14) (0.15)
Top 2 -1.280 -3.148 -0.312(2.53) (3.67) (3.40)
Lying aversion (d) -2.013 -5.768* 2.161(2.29) (3.24) (2.91)
Dominant (d) 0.702 -1.214 1.240(1.98) (2.87) (2.92)
Female 1.656 1.446 1.037(2.41) (3.51) (2.68)
Round 0.243 0.283 0.169(0.20) (0.28) (0.25)
Warned (d) 4.630**(2.09)
Constant 55.078*** 48.557*** 73.295***(6.21) (8.24) (8.58)
First-stage F-statistic 32.42 25.91 12.93Observations 544 352 192
Table 3: Determinants of contestant message. IV regressions with Posterior instrumented by Black Ball,standard errors (in parentheses) are clustered at the subject level, ∗p < 0.10,∗∗ p < 0.05,∗∗∗ p < 0.01.
if this raises their evaluation, a fact that we will verify below. Alternatively, subjects may
choose to more convincingly communicate a message of a given size, in which case we would
expect to see a lower probability of lying when confidence increases (this strategy is explored
in Appendix C). The relative attraction of these two strategies depends on how both persua-
sion and lying costs are influenced by the size of a lie, an interesting but difficult question
which is beyond the scope of this paper.
Table 3 shows the result of two stage least square regressions of the message on the
posteriors, instrumented by the noisy signal, and a series of control variables. Column 1
indicates that over all conditions, a 1ppt increase in posterior beliefs increases the message
by 0.31 ppt. Interestingly, receiving a warning increases the message by about 5ppt. This is a
large difference, that we explore in more detail by running separate regressions for unwarned
(Column 2) and warned subjects (Column 3). Since unwarned contestants cannot ascertain
whether or not employers were trained, observations from the NT and TnW conditions can
be pooled in Column 2.
One plausible interpretation for higher messages in the TW condition is that the warning
causes the participants to perceive the interview as a “game”, in which lying is seen as
an optimal strategy rather than a norm violation. This interpretation is supported by the
fact that subjects condition their message on their beliefs when they are unwarned but not
18

when they are warned. In addition, higher lying aversion decreases messages for unwarned
subjects, but not for warned subjects. In general, the large difference in communication
strategy between warned and unwarned subjects suggests that unwarned subjects have moral
constraints of lying. Since contestants who were warned do not seem to send higher messages
when they have higher beliefs, the strategic benefits of having overconfidence are likely to
be limited in this condition. It is then not surprising that the warning failed to significantly
increase beliefs in the first place.
Summary 2 Unwarned subjects condition their message on confidence. We find suggestive
evidence that moral concerns constrain their degree of lying. Warned subjects generally choose
high messages, independent of their confidence.
These results suggest that contestants are aware that a) higher messages are strategically
advantageous, and b) such messages are constrained by confidence for unwarned subjects.
Together, this provides a motive for the self-deception that we observed in the first stage of
the experiment.
6.3 Does higher confidence cause better evaluations?
There are two ways in which higher contestant posteriors could lead to higher employer
evaluations. First, as we have seen above, higher confidence leads (unwarned) contestants to
send higher messages. If employers do not discount the truth-content of messages too steeply,
e.g. because they expect some subjects to be honest, higher messages may lead to higher
evaluations. Second, more confident individuals may be able to more convincingly deliver
a message of a given size, e.g. by avoiding suspicious non-verbal cues. While we can pin
down the effect of posteriors on evaluations, we will not be able to disentangle the relative
importance of these channels with any certainty, because we lack exogenous variation in the
message that is independent from the posterior.14 When we report regressions that control
for the message a contestant sent, these should therefore be interpreted with caution.
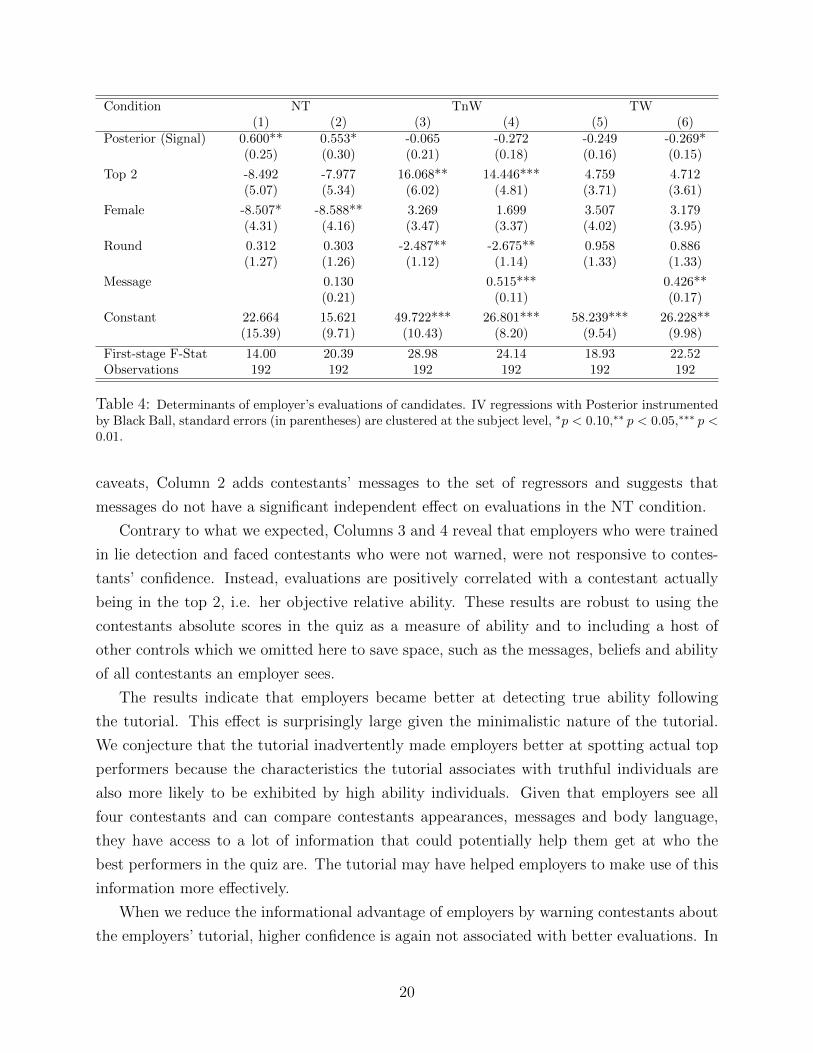
Table 4 shows the determinants of employer evaluations in the NT, TnW and TW con-
ditions respectively. Column 1 tells us that higher confidence resulted in a large increase in
evaluations when employers did not participate in the lie detection tutorial (NT condition).
In addition, untrained employers appear to discriminate against women.15 Under the above
14We implemented a treatment designed to generate such variation by inducing an exogenous shift inmessages. We informed half of the contestants that higher messages lead to better payments on average -information that we based on our pilot sessions. However, this treatment failed to influence contestants’messages. Since we did not have any independent hypotheses about this treatment, it is not included in theanalysis.
15Further analysis, not reported here, indicates that this effect is driven equally by female and maleemployers.
19
Condition NT TnW TW(1) (2) (3) (4) (5) (6)
Posterior (Signal) 0.600** 0.553* -0.065 -0.272 -0.249 -0.269*(0.25) (0.30) (0.21) (0.18) (0.16) (0.15)
Top 2 -8.492 -7.977 16.068** 14.446*** 4.759 4.712(5.07) (5.34) (6.02) (4.81) (3.71) (3.61)
Female -8.507* -8.588** 3.269 1.699 3.507 3.179(4.31) (4.16) (3.47) (3.37) (4.02) (3.95)
Round 0.312 0.303 -2.487** -2.675** 0.958 0.886(1.27) (1.26) (1.12) (1.14) (1.33) (1.33)
Message 0.130 0.515*** 0.426**(0.21) (0.11) (0.17)
Constant 22.664 15.621 49.722*** 26.801*** 58.239*** 26.228**(15.39) (9.71) (10.43) (8.20) (9.54) (9.98)
First-stage F-Stat 14.00 20.39 28.98 24.14 18.93 22.52Observations 192 192 192 192 192 192
Table 4: Determinants of employer’s evaluations of candidates. IV regressions with Posterior instrumentedby Black Ball, standard errors (in parentheses) are clustered at the subject level, ∗p < 0.10,∗∗ p < 0.05,∗∗∗ p <0.01.
caveats, Column 2 adds contestants’ messages to the set of regressors and suggests that
messages do not have a significant independent effect on evaluations in the NT condition.
Contrary to what we expected, Columns 3 and 4 reveal that employers who were trained
in lie detection and faced contestants who were not warned, were not responsive to contes-
tants’ confidence. Instead, evaluations are positively correlated with a contestant actually
being in the top 2, i.e. her objective relative ability. These results are robust to using the
contestants absolute scores in the quiz as a measure of ability and to including a host of
other controls which we omitted here to save space, such as the messages, beliefs and ability
of all contestants an employer sees.
The results indicate that employers became better at detecting true ability following
the tutorial. This effect is surprisingly large given the minimalistic nature of the tutorial.
We conjecture that the tutorial inadvertently made employers better at spotting actual top
performers because the characteristics the tutorial associates with truthful individuals are
also more likely to be exhibited by high ability individuals. Given that employers see all
four contestants and can compare contestants appearances, messages and body language,
they have access to a lot of information that could potentially help them get at who the
best performers in the quiz are. The tutorial may have helped employers to make use of this
information more effectively.
When we reduce the informational advantage of employers by warning contestants about
the employers’ tutorial, higher confidence is again not associated with better evaluations. In
20

fact, negative coefficients in Columns 5 and 6 suggests that it may backfire. Furthermore,
trained employers do worse at gaging contestants’ true ability when contestants are warned.
Finally, whether candidates were warned or not, the trained employers in Columns 4 and 6
seem to put more stock in the contestants’ messages.
Higher-order polynomials of posterior and message do not have significant coefficients if
we include them in the regressions of Table 4. Results are also robust to including employers’
beliefs about their own performance.
Summary 3 Controlling for actual ability, an increase in confidence by 10ppt increases
evaluations by about 6ppt. This is no longer the case when employers are trained, in which
case true ability is a more important determinant of evaluations. When contestants are
warned, neither true ability nor confidence has a significant effect on evaluations.
Our data are suggestive of an “arms race” between employers and contestants. As long
as employers have no training, they can be fooled by the (over)confidence of contestants.
As soon as employers are aware of potentially deceptive strategies, they become better at
spotting true ability. When warnings to contestants give away the employer’s training,
neither side seems able to gain an advantage over the other.
6.4 Does self-deception pay?
To understand whether self-deception pays, we investigate whether increased confidence
leads to a higher chance of getting “hired” by employers. Once again, we use the exogenous
variation in confidence to provide clean evidence for this question. Table 5 shows the result
of probit regressions, in which the posterior is instrumented by the signal. The table reports
marginal effects, evaluated at the average participant’s confidence level.
Column 1 of Table 5 shows that the marginal effect of higher confidence on the probability
of being hired is positive in the case of untrained employers. An increase in the posterior
by 1 percentage point raises the probability of being hired by 2.7 percent. Given that the
average increase in confidence amongst contestants relative to the control group was about
4ppt, this means that the average contestant increased her probability of getting hired by
roughly 10 percent as a consequence of self-deception. This increases expected payoffs by
about 0.1*15=1.5 euros, or 20 percent of expected interview payoffs (7.50 euros). Thus,
according to this back-of-the-envelope calculation, self-deception is quite profitable, if the
employer has not followed a lie detection training.
However, in line with the results on employers’ evaluations, this effect disappears when
employers have followed a lie-detection tutorial (Column 2). In that case, it is the actual
21

Condition NT TnW TW NT&TnW(1) (2) (3) (4)
Posterior (Signal) 0.027** 0.005 -0.012 0.019**(0.01) (0.01) (0.01) (0.01)
Top 2 -0.420 0.781** 0.178 0.045(0.32) (0.33) (0.26) (0.23)
Female -0.401 0.254 0.059 -0.206(0.27) (0.21) (0.24) (0.16)
Round -0.029 -0.210*** -0.052 -0.110**(0.06) (0.07) (0.08) (0.05)
Constant -1.068 -0.331 0.764 -0.725(0.83) (0.57) (0.59) (0.48)
Observations 192 192 192 384
Table 5: Determinants of employer’s hiring decision (a dummy that takes a value of 1 if a contestant ishired). IV probit regressions with Posterior instrumented by Black Ball, standard errors (in parentheses)are clustered at the subject level, ∗p < 0.10,∗∗ p < 0.05,∗∗∗ p < 0.01.
performance that determines the probability of being hired. When employers were trained
and contestants were warned (Column 3), neither true ability nor confidence have an effect
on the hiring decision.
Column 4 pools observations for all unwarned subjects, regardless of employer train-
ing. Across the two conditions, confidence, but not actual performance, is profitable. This
indicates that the social benefits of confidence we hypothesize might be a more robust phe-
nomenon than the employer’s ability-spotting skills the training seems to have produced.
Summary 4 An increase in confidence by 4ppt, our average treatment effect, increases the
chance of getting hired for the average contestant by about 10ppt and raises expected payoffs
of the interaction stage by 20 percent. This effect disappears when employers are trained in
lie detection.
7 Discussion and conclusion
The results of our experiment demonstrate that the strategic environment matters for cogni-
tion about the self. We observe that deception opportunities increase average overconfidence,
and that, under the right circumstances, increased confidence can pay off. Our data thus
support the the idea that overconfidence is strategically employed for social gain.
Our results do not allow for decisive statements about the exact cognitive channels or
motives underlying such self-deception. While we find some indications that an aversion to
22

lying (moral motive) increases overconfidence, the evidence is not particularly strong.16
When it comes to the ability to deceive others (technology motive), we find that even
when we control for the message, confidence leads to higher evaluations in some conditions.
This is consistent with the idea that self-deception improves the deception technology of
contestants, possibly by eliminating non-verbal give-away cues. However, we are unable to
say with certainty whether or not this technology motive causes contestants to self-deceive
in the first place. Warnings about the employer’s training in lie-detection do not induce
additional self-deception. But this may be because the warnings also reduce moral objections
to lying, rather than because the technology motive is absent. To see this, recall that, unlike
their unsuspecting counterparts, warned contestants do not condition their messages on their
confidence and their lying aversion. The moral and technology motives for self-deception thus
appear to be intertwined and isolating their marginal influence on overconfidence will require
a subtle empirical strategy.
Our results have ramifications in the fields of both economics and psychology. In eco-
nomics, we provide new evidence to a debate about the sources of overconfidence. Our results
suggest that employee overconfidence may arise in employer-employee relationships because
of its strategic benefits in job interviews and wage negotiations. Arguably, confidence may
be even more valuable amongst the self-employed, whose economic survival often depends
more immediately on persuading investors and customers. While several studies provide evi-
dence for the selection of overconfident individuals into entrepreneurship (see e.g. Dawson et
al., 2014, for an overview), our results suggest a reverse causality by which self-employment
may encourage overconfidence. Consistent with this argument, Dawson et al. (2014) find
that in addition to the selection effect of overconfidence, becoming self-employed is followed
by a boost in confidence. Taking this reasoning one step further, we conjecture that over-
confidence is likely to be more pronounced in industries where it is likely to be more of a
strategic asset, i.e. where measures of true ability are noisy, job competition is high and
persuasion is an important part of success. Accordingly, we would expect overconfidence to
be rife amongst high level professionals in finance, politics and law.
Our results also indicate that asymmetric information can spur arms races between de-
tection and bias, not dissimilar to the investments in deception and detection we observe
between different species in the animal world (Trivers, 2011). If people deceive themselves to
better deceive others, mechanisms devised by a principal trying to screen high-ability agents
16Our measure of lying aversion is negatively correlated with the message sent by unwarned contestants.It is also positively, though not significantly, correlated with prior overconfidence. Posterior beliefs werea sizable 5.5 percentage points higher for participants above the median split for our measure of lyingaversion, a difference that just falls short of statistical significance. Future work could vary the moral motiveexperimentally and achieve more power than we are able to with our noisy proxy.
23
may themselves trigger cognitive investments in overconfidence. It is not clear whether prin-
cipal or agent would win out in such an arms race; in our experiment screening trumped
self-deception in the condition with trained employers and unwarned employees.
In psychology, our results support the idea that cognition did not evolve only to generate
accurate representations of the world (McKay and Dennett, 2009). Instead, faulty represen-
tations can be optimal reactions to an individual’s environment. In the physical world, our
senses probably evolved to gather a version of reality that serves us in our daily activities.
A similar argument can be applied to the social world, where our cognition has evolved to
generate representations that serve us in our daily interactions. Self-confidence appears to be
a form of cognition where inaccurate representations can sometimes provide higher benefits
than accurate ones.
When it comes to welfare implications, overconfidence has been associated with personal
and social costs.17 In deciding whether policy should actively attempt to curb overconfidence,
it is crucial to understand its benefits as well. If overconfidence serves to reduce anxiety or
to provide motivation, it may well be socially beneficial. If, as we document in this paper,
overconfidence is the result of a privately optimal cognitive strategy that can lead to the
misallocation of talent in a zero sum game, it is more likely to be socially harmful. The
exact welfare implications of strategic self-deception are likely to be subtle and depend
on the environment as well as agents’ private information. Characterizing these welfare
implications of self-deception constitutes an important research agenda.
Future work could also look into the robustness of our affirmative results across settings
in the field and lab. In particular, future experimental research could vary the strategic
environment (e.g. by considering bargaining or contests) and the variable subject to self-
deception (e.g. by considering absolute past performance, future performance or non-ego-
related variables) to pin down the scope of strategic self-deception.
References
Akerlof, George A. and William T. Dickens, “The economic consequences of cognitive dis-
sonance,” The American Economic Review, 1982, 72 (3), 307–319.
Anderson, Cameron, Sebastien Brion, Don A. Moore, and Jessica A. Kennedy, “A
status-enhancement account of overconfidence.,” Journal of Personality and Social Psychology,
2012, 103 (4), 718–35.
17In an interview in 2015, Kahneman says that overconfidence is probably the most damaging cognitivebias and the one he would eliminate first if he had a magic wand. See http://www.theguardian.com/
books/2015/jul/18/daniel-kahneman-books-interview.
24

Barber, BM and Terrance Odean, “Boys Will be Boys: Gender, Overconfidence, and Common
Stock Investment,” Quarterly Journal of Economics, 2001, 116 (1), 261–292.
Baumeister, Roy, “The Self,” in David Gilbert, Susan Fiske, and Gardner Lindzsey, eds., The
Handbook of Social Psychology, McGraw-Hill, 1998.
Belot, Michele and Jeroen Van de Ven, “How private is private information? The ability to
spot deception in an economic game,” Experimental Economics, 2016, In press.
Benabou, Roland, “Groupthink: Collective Delusions in Organizations and Markets,” The Re-
view of Economic Studies, 2013, 80 (2), 429–462.
and Jean Tirole, “Self-Confidence and Personal Motivation,” The Quarterly Journal of Eco-
nomics, 2002, 117 (3), 871–915.
and , “Identity, Morals, and Taboos: Beliefs as Assets,” The Quarterly Journal of Economics,
2011, 126 (2), 805–855.
Benoıt, Jean-Pierre and Juan Dubra, “Apparent Overconfidence,” Econometrica, 2011, 79
(5), 1591–1625.
Biais, Bruno and Denis Hilton, “Judgemental overconfidence, self-monitoring, and trading
performance in an experimental financial market,” The Review of Economic Studies, 2005, 72
(2), 287–312.
Bodner, Ronit and Drazen Prelec, “Self-signaling and diagnostic utility in everyday deci-
sion making,” in Isabelle Brocas and Juan D Carillo, eds., Collected Essays in Psychology and
Economics, Oxford University Press, 2002.
Bracha, Anat and Donald J. Brown, “Affective decision making: A theory of optimism bias,”
Games and Economic Behavior, 2012, 75 (1), 67–80.
Brunnermeier, Markus K. and Jonathan A. Parker, “Optimal expectations,” American
Economic Review, 2005, 95 (4), 1092–1118.
Burks, Stephen V., Jeffrey P. Carpenter, Lorenz Goette, and Aldo Rustichini, “Over-
confidence and Social Signalling,” The Review of Economic Studies, 2013, 80 (3), 949–983.
Camerer, Colin and Dan Lovallo, “Overconfidence and excess entry: An experimental ap-
proach,” The American Economic Review, 1999, 89 (1), 306–318.
Charness, Gary, Aldo Rustichini, and Jeroen van de Ven, “Self-Confidence and Strategic
Behavior,” SSRN Electronic Journal, 2013.
25

Compte, Olivier and Andrew Postlewaite, “Confidence-enhanced performance,” American
Economic Review, 2004, 94 (5), 1536–1557.
Coutts, Alexander, “Testing Models of Belief Bias: An Experiment,” Mimeo, Nova School of
Business and Economics, 2015.
Dawson, Christopher, David de Meza, Andrew Henley, and G. Reza Arabsheibani,
“Entrepreneurship: Cause and Consequence of Financial Optimism,” Journal of Economics and
Management Strategy, 2014, 23 (4), 717–742.
, , , and , “The Power of (Non) Positive Thinking: Self-Employed Pessimists Earn More
than Optimists,” IZA working paper, 2015, (9242).
DePaulo, Bella M., “Spotting Lies: Can Humans Learn to Do Better?,” Current Directions in
Psychological Science, 1994, 3 (3), 83–86.
Di Tella, Rafael and Ricardo Perez-Truglia, “Conveniently Upset: Avoiding Altruism by
Distorting Beliefs About Others,” American Economic Review, 2015, 105 (11), 3416–3442.
Eil, David and Justin M. Rao, “The Good News-Bad News Effect: Asymmetric Processing of
Objective Information about Yourself,” American Economic Journal: Microeconomics, 2011, 3
(2), 114–138.
Ekman, Paul and Maureen O’Sullivan, “Who can catch a liar?,” American Psychologist, 1991,
46 (9), 913.
, Wallace V. Friesen, and Maureen O’Sullivan, “Smiles when lying.,” Journal of Person-
ality and Social Pscyhology, 1988, 54 (3), 414.
Ewers, Mara and Florian Zimmermann, “Image and misreporting,” Journal of the European
Economic Association, 2015, 13 (2), 363–380.
Fischbacher, Urs, “z-Tree: Zurich Toolbox for Ready-made Economic Experiments,” Experimen-
tal Economics, 2007, 10 (2), 171–178.
Gibson, Rajna, Carmen Tanner, and Alexander F. Wagner, “Preferences for truthfulness:
Heterogeneity among and within individuals,” American Economic Review, 2013, 103 (1), 532–
548.
Gneezy, Uri, “Deception: The role of consequences,” The American Economic Review, 2005, 95
(1), 384–394.
Grossman, Zachary and David Owens, “An unlucky feeling: Overconfidence and noisy feed-
back,” Journal of Economic Behavior and Organization, 2012, 84 (2), 510–524.
26

Gur, Ruben C. and Harold A. Sackeim, “Self-Deception: A Concept in Search of a Phe-
nomenon,” Journal of Personality and Social Pscyhology, 1979, 37 (2).
Kahan, Dan M, “The Expressive Rationality of Inaccurate Perceptions,” Behavioral and Brain
Sciences, 2016, In press.
Koellinger, Philipp, Maria Minniti, and Christian Schade, “I think I can, I think I can”:
Overconfidence and Entrepreneurial Behavior,” Journal of Economic Psychology, 2007, 28 (4),
502–527.
Koszegi, Botond, “Ego Utility, Overconfidence, and Task Choice,” Journal of the European
Economic Association, 2006, 4 (4), 673–707.
Kunda, Ziva, “The case for motivated reasoning,” Psychological Bulletin, 1990, 108 (3), 480–498.
Kurzban, Roy, “Two problems with self-deception: No self and no deception,” Behavioral and
Brain Sciences, 2011, 34 (1), 32–33.
Malmendier, Ulrike and Geoffrey Tate, “Who makes acquisitions? CEO overconfidence and
the market’s reaction,” Journal of Financial Economics, 2008, 89 (1), 20–43.
Mayraz, Guy, “The optimism bias: model and evidence,” Mimeo, University of British Columbia,
2012, pp. 1–40.
McKay, Ryan, Danica Mijovic-Prelec, and Drazen Prelec, “Protesting too much: Self-
deception and Self-signaling,” Behavioral and Brain Sciences, 2011, 34 (1), 34–35.
McKay, Ryan T. and Daniel C. Dennett, “The evolution of misbelief,” The Behavioral and
Brain Sciences, 2009, 32 (6), 493–510; discussion 510–561.
Mijovic-Prelec, Danica and Drazen Prelec, “Self-deception as self-signalling: a model and
experimental evidence,” Philosophical transactions of the Royal Society of London. Series B,
Biological sciences, 2010, 365 (1538), 227–40.
Mobius, Markus M. and Tanya S. Rosenblat, “Why beauty matters,” The American Eco-
nomic Review, 2006, 96 (1), 222–235.
Mobius, Markus M., Muriel Niederle, Paul Niehaus, and Tanya S. Rosenblat, “Manag-
ing Self-Confidence,” Mimeo, 2014.
Moore, Don A. and Paul J. Healy, “The trouble with overconfidence,” Psychological Review,
2008, 115 (2), 502–17.
Oster, Emily, Ira Shoulson, and E. Ray Dorsey, “Optimal expectations and limited medical
testing: evidence from Huntington disease,” American economic review, 2013, 103 (2), 804–830.
27

Schlag, Karl H., James Tremewan, and Joel J. Van der Weele, “A Penny for Your
Thoughts: A Survey of Methods for Eliciting Beliefs,” Experimental Economics, 2015, 18 (3),
457–490.
Thoma, Carmen, “Under- versus overconfidence: an experiment on how others perceive a biased
self-assessment,” Experimental Economics, 2015, 19 (1), 218–239.
Trivers, Robert, “Deceit and self-deception,” in “Social Evolution,” Benjamin/Cummings, 1985,
pp. 395–420.
, The Folly of Fools: The Logic of Deceit and Self-Deception in Human Life, Basic Books, 2011.
Von Hippel, William and Robert Trivers, “The evolution and psychology of self-deception,”
The Behavioral and brain sciences, 2011, 34 (1), 1–16; discussion 16–56.
Vrij, Aldert, Detecting lies and deceit: Pitfalls and opportunities, John Wiley and Sons, 2008.
Wang, Joseph Tao Yi, Michael Spezio, and Colin F. Camerer, “Pinocchio’s Pupil: Using
Eyetracking and Pupil Dilation To Understand Truth-telling and Deception in Games,” American
Economic Review, 2010, 100 (3), 984–1007.
28

A Additional Figures
0.0
1.0
2.0
3.0
4D
ensi
ty
-20 -10 0 10 20 30Score
Control Contestant
Score, by role
Figure A.1: Performance in the intelligence task by information condition. The densitiesindicate that control and treatment had identical scores.
0.0
05.0
1.0
15.0
2D
ensi
ty
0 20 40 60 80 100Prior Belief
Control Contestant
Prior density, by role
(a)
0.0
05.0
1.0
15D
ensi
ty
0 20 40 60 80 100Posterior Belief
Control Contestant
Posterior density, by role
(b)
Figure A.2: Belief distribution density by treatment group. Panel a) depicts prior beliefs,Panel (b) depicts posterior beliefs.
29

B Bayesian updating regressions
We reproduce the regressions in Mobius et al. (2014), based on a linearized version of Bayes’
formula. The model is given by
logit(µi,post) = δlogit(µi,prior) + βHI(si = H)λH + βLI(si = L)λL + εi. (1)
Here, µi,prior and µi,post represent the prior and the posterior belief of person i respectively.
λH = −λL is the log of the likelihood ratio, which in our case is 0.75/0.25 = 3. I(si = H)
and I(si = L) are indicator variables for a high and low signal respectively.
As explained in more detail in Mobius et al. (2014), perfect Bayesian updating implies
δ, βH , βL = 1. Several different deviations from perfect Baysian updating can be distin-
guished. If both βH < 1 and βL < 1, this implies that subjects are “conservative”, i.e.
they place too little weight on new information. If βH > βL, this implies “asymmetry”, i.e.
subjects place more weight on good signals compared to bad signals. Finally, δ < 1 implies
what we call “centrism”, an updating bias towards 50 percent.
Full sample Restricted sampleAll Control Contestants All Employers Contestants
δ 0.824*** 0.696*** 0.937 0.886* 0.791** 0.988(0.0517) (0.0688) (0.0673) (0.0585) (0.0829) (0.0742)
βH 0.513*** 0.627*** 0.407*** 0.689*** 0.719*** 0.635***(0.0513) (0.0691) (0.0689) (0.0461) (0.0620) (0.0626)
βL 0.591*** 0.619*** 0.582*** 0.914 0.916* 0.929(0.0626) (0.0885) (0.0877) (0.0616) (0.0849) (0.0884)
Obs. 279 137 142 199 104 95R2 0.685 0.643 0.740 0.800 0.755 0.852
Table B.1: Belief updating regressions. Columns (1)-(3) reflect the entire sample, whereas Columns (4)-(6) exclude subjects with “irregular updates”, i.e. either zero updates or updates in the wrong direction. Atthe top of each column we indicate the sample (control, contestant, all) under consideration. H0: coefficientequals 1. Standard errors in parentheses ∗p < 0.10,∗∗ p < 0.05,∗∗∗ p < 0.01.
Table B.1 shows the results of OLS regressions, where stars indicate rejections of the
Null hypothesis that the coefficient is 1 at different levels of confidence. Columns (1)-(3)
reflect the entire sample, whereas Columns (4)-(6) exclude subjects with “irregular updates”,
i.e. either zero updates or updates in the wrong direction. At the top of each column we
indicate the sample (control, contestant, all) under consideration. Table B.2 shows the same
regressions with interaction terms for the treatment group, making it possible to directly
compare treatment effects between the two groups.
30

(1) (2)Full Sample Restricted
δ 0.696*** 0.791***(0.0688) (0.0830)
βH 0.627*** 0.719***(0.0691) (0.0620)
βL 0.619*** 0.916***(0.0885) (0.0850)
δ * contestant 0.241** 0.198*(0.0962) (0.111)
βH * contestant -0.220** -0.0838(0.0976) (0.0881)
βL * contestant -0.0370 0.0131(0.125) (0.123)
Observations 279 199R2 0.694 0.803
Table B.2: Belief updating regressions. Column (1) includes the entire sample, whereas Column (2)exclude subjects with “irregular updates”, i.e. either zero updates or updates in the wrong direction. H0:coefficient equals 1. Standard errors in parentheses ∗p < 0.10,∗∗ p < 0.05,∗∗∗ p < 0.01.
Our main findings are the following:
• Centrism: We find δ < 1, for employers, but not for contestants. This implies a bias
towards 50 percent. Since the average belief is over 50 percent, this implies employers
have a downward updating bias compared to contestants.
• Conservatism: we reject βH = 1 for all specifications, and reject βL = 1 for the full
sample only. Subjects are conservative on average.
• (Anti-)asymmetry: in the restricted sample, βH < βL. I.e. both groups respond
more to bad signals. This effect is stronger for contestants.
In Table B.3, we repeat the regressions of Table 2 with posterior as the dependent variable.
The statistical relationships we see are similar. It is noteworthy that, in Column 2, the
coefficients of the warned and lying aversion dummies have increased. Especially, lying
aversion is almost significant at the 10 percent level and actually achieves significance upon
including controls such as age. The dominance dummy in Columns 2 and 4 is no longer
significant.
31

(1) (2) (3) (4)Score 1.218*** 1.121*** 1.169*** 1.166***
(0.149) (0.209) (0.153) (0.154)
Contestant (d) 5.003* 5.028* 6.996*(2.637) (2.755) (4.090)
Warned (d) 4.435(3.828)
Lying av. (d) 5.511(3.656)
Dominant (d) 2.780 4.677(2.776) (4.009)
Contestant * Dominant (d) -3.737(5.535)
Constant 38.94*** 40.75*** 38.80*** 37.73***(2.751) (4.344) (3.213) (3.688)
Observations 288 144 272 272R2 0.172 0.160 0.164 0.165
Table B.3: OLS regressions of confidence after signal on task scores and treatment dummies. “Dominant”and “Lie av.” are dummy variables that takes the value 1 if the personality score is above the median.Robust standard errors in parentheses. ∗p < 0.10,∗∗ p < 0.05,∗∗∗ p < 0.01.
C The incidence of lying
We define a lie as a message that is higher than the posterior. Thus, we do not count
untruthful understatements of one’s beliefs as lies. Instrumental variable probit regressions
on the incidence of lying are reported in Table C.1. The results in Column 1 clearly indicate
that a higher posterior reduces the incidence of a lie. This is consistent with the idea that
higher confidence obviates the need for lying. This effect occurs only for the warned subjects,
which suggests that the effect is likely to be mechanical: Since warned subjects all choose
relatively high messages independent of the posterior, a higher posterior simply reduces the
scope for lying. Interestingly, unwarned subjects do not lie significantly less when they have
a higher posterior, consistent with the finding in Table 3 that these subjects increase their
messages with their posterior.
32

Condition All contestants NT & TnW TW(1) (2) (3)
Posterior (signal) -0.039*** -0.026 -0.080***(0.01) (0.02) (0.02)
Top 2 -0.034 -0.419 0.616(0.32) (0.38) (0.54)
Lying aversion (d) 0.070 -0.266 0.566(0.25) (0.30) (0.41)
Dominant (d) -0.147 -0.201 -0.119(0.23) (0.27) (0.43)
Female 0.539** 0.616* 0.258(0.26) (0.33) (0.41)
Round 0.049* 0.023 0.117**(0.03) (0.03) (0.06)
Warned (d) 0.252(0.23)
Constant 2.388*** 2.008** 4.932***(0.79) (0.93) (1.67)
Observations 544 352 192
Table C.1: Determinants of whether contestant lies. IV probit regressions with Posterior instrumented byBlack Ball, standard errors (in parentheses) are clustered at the subject level, ∗p < 0.10,∗∗ p < 0.05,∗∗∗ p <0.01.
33