Decentralization in Bitcoin and Ethereum Networks · Decentralization in Bitcoin and Ethereum...
18
Decentralization in Bitcoin and Ethereum Networks Adem Efe Gencer 1,2 , Soumya Basu 1,2 , Ittay Eyal 1,3 , Robbert van Renesse 1,2 , and Emin Gün Sirer 1,2 1 Initiative for Cryptocurrencies and Contracts (IC3) 2 Computer Science Department, Cornell University 3 Electrical Engineering Department, Technion Abstract. Blockchain-based cryptocurrencies have demonstrated how to securely implement traditionally centralized systems, such as curren- cies, in a decentralized fashion. However, there have been few measure- ment studies on the level of decentralization they achieve in practice. We present a measurement study on various decentralization metrics of two of the leading cryptocurrencies with the largest market capitaliza- tion and user base, Bitcoin and Ethereum. We investigate the extent of decentralization by measuring the network resources of nodes and the interconnection among them, the protocol requirements affecting the op- eration of nodes, and the robustness of the two systems against attacks. In particular, we adapted existing internet measurement techniques and used the Falcon Relay Network as a novel measurement tool to obtain our data. We discovered that neither Bitcoin nor Ethereum has strictly better properties than the other. We also provide concrete suggestions for improving both systems. 1 Introduction Cryptocurrencies are emerging as a new asset class, with a market capitalization of about $150B as of Sept 2017 [15], a growing ecosystem, and a diverse commu- nity. The most prominent platforms that account for over 70% of this market are Bitcoin [57] and Ethereum [28,70]. The underlying technology, the blockchain, achieves consensus in a decentralized, open system and enables innovation in industries that conventionally relied upon trusted authorities. Some examples of such services include land record management [3], domain name registration [51], and voting [55]. The key feature that empowers such services and makes these platforms interesting is decentralization. Without it, such services are technolog- ically easy to construct but require trust in a centralized administrator. Decentralization is a property regarding the fragmentation of control over the protocol. In the Bitcoin and Ethereum protocols, users submit transactions for miners to sequence into blocks. Better decentralization of miners means higher resistance against censorship of individual transactions. For communication, Bit- coin and Ethereum also have a peer-to-peer network for disseminating block and transaction information. Both Bitcoin and Ethereum also contain full nodes, arXiv:1801.03998v2 [cs.CR] 29 Mar 2018
-
Upload
nguyenkiet -
Category
Documents
-
view
216 -
download
2
Transcript of Decentralization in Bitcoin and Ethereum Networks · Decentralization in Bitcoin and Ethereum...
Decentralization in Bitcoin and EthereumNetworks
Adem Efe Gencer1,2, Soumya Basu1,2, Ittay Eyal1,3, Robbert van Renesse1,2,and Emin Gün Sirer1,2
1 Initiative for Cryptocurrencies and Contracts (IC3)2 Computer Science Department, Cornell University
3 Electrical Engineering Department, Technion
Abstract. Blockchain-based cryptocurrencies have demonstrated howto securely implement traditionally centralized systems, such as curren-cies, in a decentralized fashion. However, there have been few measure-ment studies on the level of decentralization they achieve in practice.We present a measurement study on various decentralization metrics oftwo of the leading cryptocurrencies with the largest market capitaliza-tion and user base, Bitcoin and Ethereum. We investigate the extent ofdecentralization by measuring the network resources of nodes and theinterconnection among them, the protocol requirements affecting the op-eration of nodes, and the robustness of the two systems against attacks.In particular, we adapted existing internet measurement techniques andused the Falcon Relay Network as a novel measurement tool to obtainour data. We discovered that neither Bitcoin nor Ethereum has strictlybetter properties than the other. We also provide concrete suggestionsfor improving both systems.
1 Introduction
Cryptocurrencies are emerging as a new asset class, with a market capitalizationof about $150B as of Sept 2017 [15], a growing ecosystem, and a diverse commu-nity. The most prominent platforms that account for over 70% of this market areBitcoin [57] and Ethereum [28, 70]. The underlying technology, the blockchain,achieves consensus in a decentralized, open system and enables innovation inindustries that conventionally relied upon trusted authorities. Some examples ofsuch services include land record management [3], domain name registration [51],and voting [55]. The key feature that empowers such services and makes theseplatforms interesting is decentralization. Without it, such services are technolog-ically easy to construct but require trust in a centralized administrator.
Decentralization is a property regarding the fragmentation of control over theprotocol. In the Bitcoin and Ethereum protocols, users submit transactions forminers to sequence into blocks. Better decentralization of miners means higherresistance against censorship of individual transactions. For communication, Bit-coin and Ethereum also have a peer-to-peer network for disseminating block andtransaction information. Both Bitcoin and Ethereum also contain full nodes,
arX
iv:1
801.
0399
8v2
[cs
.CR
] 2
9 M
ar 2
018
which serve two critical roles: (1) to relay blocks and transactions to miners(2) and to answer queries for end users about the state of the blockchain. Un-derstanding the network properties of full nodes is crucial for protocol design andanalysis of each network’s resilience to attacks. Ongoing research explores waysto make the Bitcoin and Ethereum networks more decentralized without mea-surements on the underlying network. Hence, debates and decisions about theunderlying networks are often based on assumptions rather than measurement.
In this paper, we present a comprehensive measurement study on decentral-ization metrics in these operational systems and shed light on whether or notexisting assumptions are satisfied in practice. We adapt prior Internet measure-ment techniques for Bitcoin and Ethereum and use novel approaches to obtainapplication layer data. Our main data sources are (1) direct measurements ofthese networks from multiple vantage points, (2) a Bitcoin relay network calledFalcon that we deployed and operated for a year, and (3) blockchain historiesof Bitcoin and Ethereum. Our study presents findings regarding the networkproperties, impact of protocol requirements, security, and client interactions.
This paper makes three contributions. First, it provides new tools and tech-niques for measuring blockchain-based cryptocurrency networks. The key toolintroduced here is the Falcon relay network that we built to serve as a backbonefor ferrying blocks. This network was deployed for Bitcoin across five continents,providing a unique vantage point on pruned blocks. Second, we perform a com-parative study of decentralization metrics in Bitcoin and Ethereum. Our keyfindings are: (1) the Bitcoin network can increase the bandwidth requirementsfor nodes by a factor of 1.7 and keep the same level of decentralization as 2016,(2) the Bitcoin network is geographically more clustered than Ethereum, withmany nodes likely residing in datacenters. (3) Ethereum has lower mining powerutilization than Bitcoin and would benefit from a relay network, and (4) smallminers experience more volatility in block rewards in Bitcoin than Ethereum.
2 Bitcoin and Ethereum
Bitcoin and Ethereum use Nakamoto consensus [5–7, 57, 38] to regulate transac-tion serialization in their blockchains. While architecturally very similar, thesesystems differ significantly in terms of their API, abstractions, and wire protocol.
2.1 The Bitcoin Protocol
Bitcoin is a protocol that sequences transactions into groups called blocks. Theprotocol targets a block production interval of 10 minutes with a maximum sizeof 1 MB. At the time of our measurements, the last 100 blocks had a 0.99 MBmedian block size and a 9.8 minute mean interval. The wire protocol implementsa peer-to-peer network based on flooding block and transaction announcements.
The peer to peer network is formed through point to point links. To form alink, clients establish a TCP connection and perform a protocol-level three-wayhandshake. The protocol-level handshake exchanges the state of each client, suchas the height of the blockchain and a version string associated with the software
being run. When a client discovers or receives a new block, it floods the networkwith the hash of the block. If a neighboring client needs the block, it requeststhe block based on the hash value. There are many different block formats, suchas compact [17] and Merkle [44] blocks, but we focus on retrieval of full blocks.
2.2 The Ethereum Protocol
The Ethereum protocol [28] focuses on providing a platform to facilitate buildingdecentralized applications on its blockchain. To sequence transactions, Ethereumadopts a design inspired by Nakamoto consensus and the GHOST protocol [64].
Ethereum adopts a chain selection rule to harness the residual mining powerin pruned blocks for improved security. The protocol includes such blocks, calleduncles, in its blockchain and rewards the corresponding miners [70]. Ethereumtargets a block interval between 10 to 20 seconds [41]. The block size is indirectlydetermined by an execution fee, called gas, that fluctuates over time. At the timeof our measurements, the last 100 blocks were generated with a 2.9 KB medianblock size and a 16.3 second average interval.
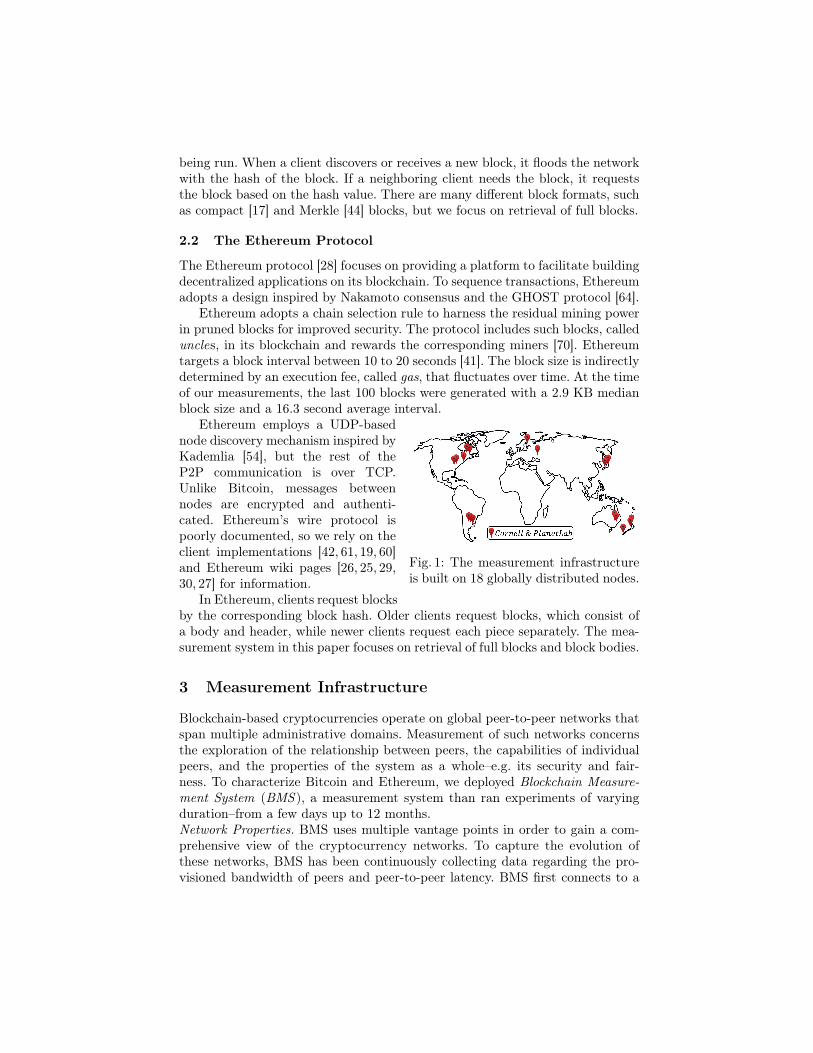
Fig. 1: The measurement infrastructureis built on 18 globally distributed nodes.
Ethereum employs a UDP-basednode discovery mechanism inspired byKademlia [54], but the rest of theP2P communication is over TCP.Unlike Bitcoin, messages betweennodes are encrypted and authenti-cated. Ethereum’s wire protocol ispoorly documented, so we rely on theclient implementations [42, 61, 19, 60]and Ethereum wiki pages [26, 25, 29,30, 27] for information.
In Ethereum, clients request blocksby the corresponding block hash. Older clients request blocks, which consist ofa body and header, while newer clients request each piece separately. The mea-surement system in this paper focuses on retrieval of full blocks and block bodies.
3 Measurement Infrastructure
Blockchain-based cryptocurrencies operate on global peer-to-peer networks thatspan multiple administrative domains. Measurement of such networks concernsthe exploration of the relationship between peers, the capabilities of individualpeers, and the properties of the system as a whole–e.g. its security and fair-ness. To characterize Bitcoin and Ethereum, we deployed Blockchain Measure-ment System (BMS ), a measurement system than ran experiments of varyingduration–from a few days up to 12 months.Network Properties. BMS uses multiple vantage points in order to gain a com-prehensive view of the cryptocurrency networks. To capture the evolution ofthese networks, BMS has been continuously collecting data regarding the pro-visioned bandwidth of peers and peer-to-peer latency. BMS first connects to a
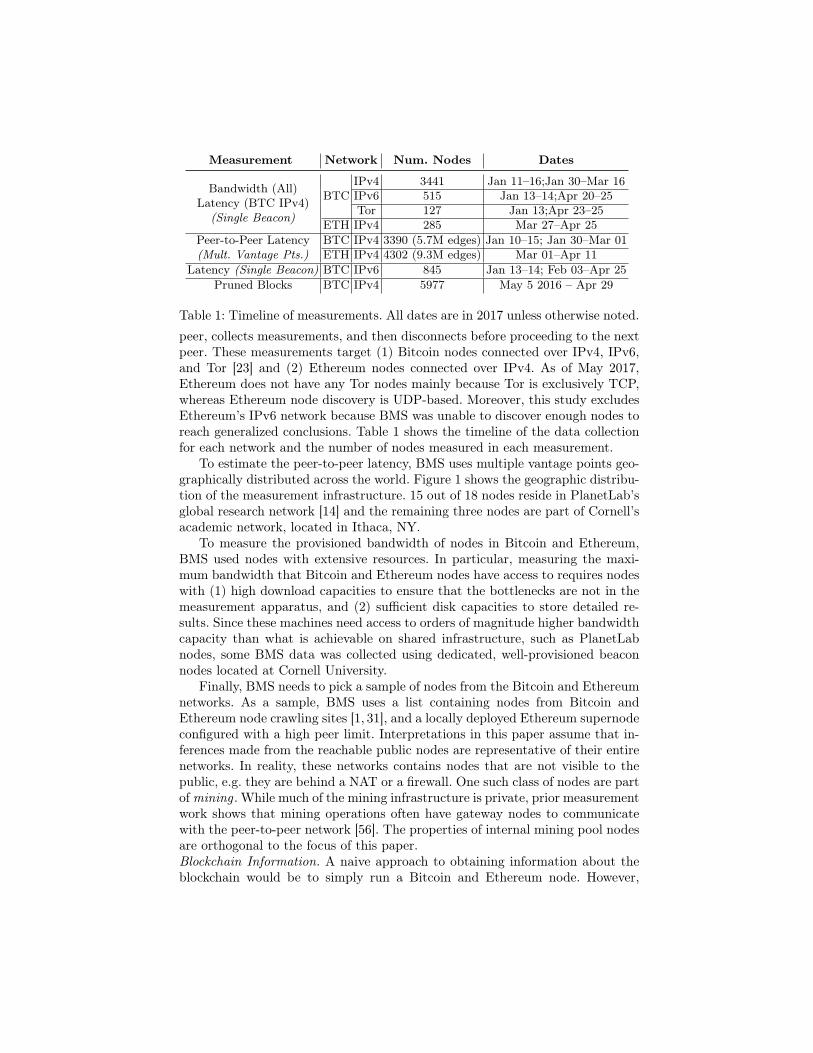
Measurement Network Num. Nodes Dates
Bandwidth (All)Latency (BTC IPv4)
(Single Beacon)
BTCIPv4 3441 Jan 11–16;Jan 30–Mar 16IPv6 515 Jan 13–14;Apr 20–25Tor 127 Jan 13;Apr 23–25
ETH IPv4 285 Mar 27–Apr 25Peer-to-Peer Latency(Mult. Vantage Pts.)
BTC IPv4 3390 (5.7M edges) Jan 10–15; Jan 30–Mar 01ETH IPv4 4302 (9.3M edges) Mar 01–Apr 11
Latency (Single Beacon) BTC IPv6 845 Jan 13–14; Feb 03–Apr 25Pruned Blocks BTC IPv4 5977 May 5 2016 – Apr 29
Table 1: Timeline of measurements. All dates are in 2017 unless otherwise noted.peer, collects measurements, and then disconnects before proceeding to the nextpeer. These measurements target (1) Bitcoin nodes connected over IPv4, IPv6,and Tor [23] and (2) Ethereum nodes connected over IPv4. As of May 2017,Ethereum does not have any Tor nodes mainly because Tor is exclusively TCP,whereas Ethereum node discovery is UDP-based. Moreover, this study excludesEthereum’s IPv6 network because BMS was unable to discover enough nodes toreach generalized conclusions. Table 1 shows the timeline of the data collectionfor each network and the number of nodes measured in each measurement.
To estimate the peer-to-peer latency, BMS uses multiple vantage points geo-graphically distributed across the world. Figure 1 shows the geographic distribu-tion of the measurement infrastructure. 15 out of 18 nodes reside in PlanetLab’sglobal research network [14] and the remaining three nodes are part of Cornell’sacademic network, located in Ithaca, NY.
To measure the provisioned bandwidth of nodes in Bitcoin and Ethereum,BMS used nodes with extensive resources. In particular, measuring the maxi-mum bandwidth that Bitcoin and Ethereum nodes have access to requires nodeswith (1) high download capacities to ensure that the bottlenecks are not in themeasurement apparatus, and (2) sufficient disk capacities to store detailed re-sults. Since these machines need access to orders of magnitude higher bandwidthcapacity than what is achievable on shared infrastructure, such as PlanetLabnodes, some BMS data was collected using dedicated, well-provisioned beaconnodes located at Cornell University.
Finally, BMS needs to pick a sample of nodes from the Bitcoin and Ethereumnetworks. As a sample, BMS uses a list containing nodes from Bitcoin andEthereum node crawling sites [1, 31], and a locally deployed Ethereum supernodeconfigured with a high peer limit. Interpretations in this paper assume that in-ferences made from the reachable public nodes are representative of their entirenetworks. In reality, these networks contains nodes that are not visible to thepublic, e.g. they are behind a NAT or a firewall. One such class of nodes are partof mining . While much of the mining infrastructure is private, prior measurementwork shows that mining operations often have gateway nodes to communicatewith the peer-to-peer network [56]. The properties of internal mining pool nodesare orthogonal to the focus of this paper.Blockchain Information. A naive approach to obtaining information about theblockchain would be to simply run a Bitcoin and Ethereum node. However,
this precludes information that cannot be obtained through the respective wireprotocols. Many important decentralization metrics center around the analysisof blocks that are not part of the main blockchain. In Ethereum, many of theseblocks become uncles which can simply be requested through the wire protocol.
In Bitcoin, however, a block that is not part of the main blockchain simplybecomes pruned. Pruned blocks in Bitcoin have no effect on the state of thesystem, they are deleted by clients without impacting correctness. Thus, it iscrucial to connect directly to miners to capture pruned blocks.
A critical component of BMS to observe pruned blocks is the Falcon RelayNetwork, which relays blocks between Bitcoin miners. The Falcon Relay Net-work uses cut-through routing to quickly disseminate blocks worldwide, whichincentivizes miners to connect to Falcon. Indeed, Falcon is directly connected toat least 36.4% of the entire hashpower in Bitcoin. Since there is just one otheroperational relay network for Bitcoin [18, 16], Falcon has observed blocks thathave not been seen on other well-connected nodes [8].
4 Measurements
In this section, we present the measurements taken by BMS. In each measure-ment, we describe the methodology, followed by the results of our analysis. Aswith any measurement study of a large-scale, uninstrumentable artifact, mea-surements are not perfect; we conclude each section by addressing some potentialsources of error and their mitigation.
4.1 Provisioned Bandwidth
Provisioned bandwidth is an estimate on a node’s transmission capacity charac-terizing how much bandwidth the node has to communicate with the rest of thecryptocurrency network. Greater provisioned bandwidth helps miners to propa-gate/collect blocks to/from the network faster. Thus, it becomes more difficultfor a malicious miner to situate themselves in the network to achieve the rushingproperty [35] and attack the blockchain. Knowledge of provisioned bandwidthalso aids in setting protocol parameters, such as the block size and frequency.Methodology. BMS measures the provisioned bandwidth of each peer by re-questing a large amount of data from each peer and seeing how fast the peerscan stream the data to BMS’s measurement nodes. BMS does this by asking forblocks that were first seen over a year ago – similar to how a stale node asksfor blocks to sync state. Each request asks for the same set of blocks in Bitcoinand blocks or the corresponding bodies in Ethereum. Next, BMS divides thetime into epochs and records the number of bytes received during each epoch.This process continues until either BMS receives all data or a predefined timeoutof 30 seconds is reached. A long timeout helps BMS eliminate effects from TCPslow start and other initialization noise as well as identify and eliminate spuriousspikes in throughput caused by buffering in the kernel by BMS. Finally, BMSprocesses the collected data to determine the provisioned bandwidth. To do so,first, it identifies the independent data streams by combining successive epochs
containing active data transfers. Then, it eliminates streams that are shorterthan 500 milliseconds to mitigate initialization artifacts such as TCP slow start.BMS then outputs the maximum observed throughput among the remainingdistinct continuous streams as the provisioned bandwidth of the remote peer.
The experiments in this paper are run on servers with 1 Gbps links at CornellUniversity. This has not changed from 2016 to 2017, which allows us to makecomparisons to a previous study in 2016 [20].
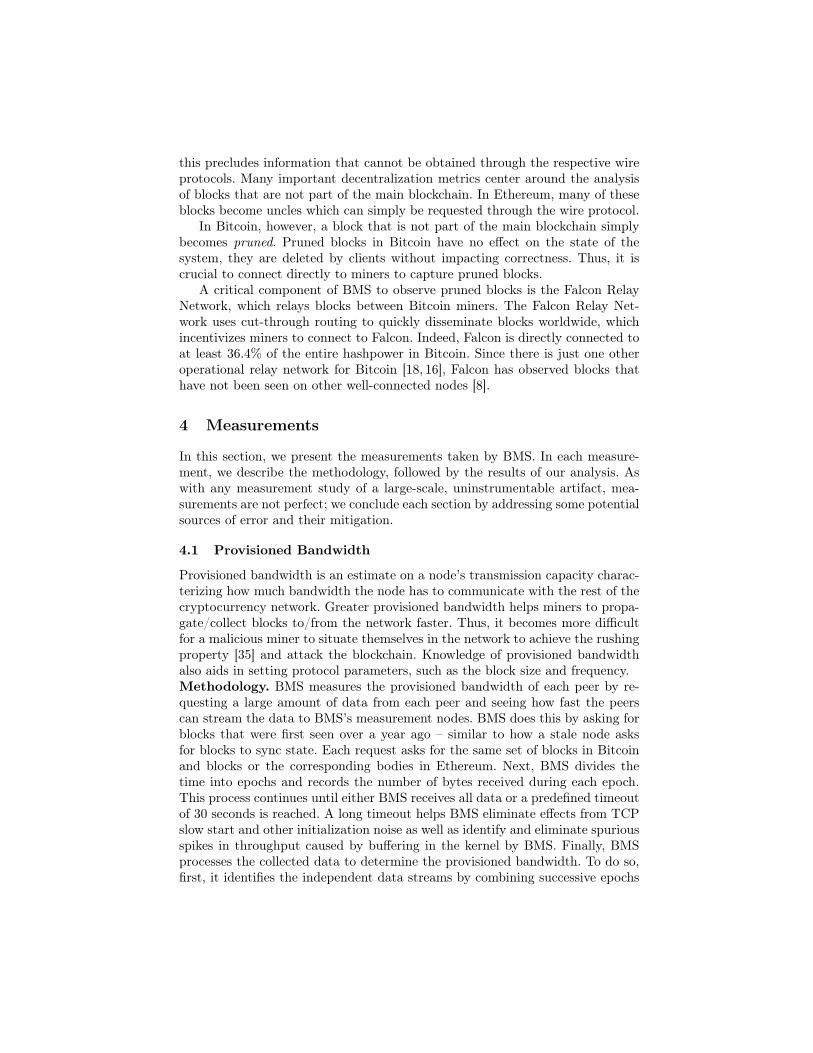
Bitcoin Eth.IPv4 IPv6 Tor IPv4[Mbps] [Mbps] [Mbps] [Mbps]
10% 5.7 11.0 2.1 3.433% 23.3 45.2 3.1 11.250% 56.1 78.2 4.1 29.467% 91.1 94.3 5.6 68.390% 177.0 207.9 8.1 144.4Avg. 73.1 86.5 4.7 55.0
Std. Dev. 68.4 66.9 2.4 58.8
(a) Provisioned bandwidth statistics. (b) CDF
Fig. 2: Statistics on distribution of provisioned bandwidth and the CDF.
Results. Table 2a summarizes per-node bandwidth results that BMS has col-lected. We see that Bitcoin nodes in both IPv4 and IPv6 networks have consis-tently higher bandwidth compared to Ethereum IPv4 nodes. In particular, themedian Bitcoin IPv4 and IPv6 nodes have about 1.9× and 2.7× the bandwidth ofthe typical Ethereum IPv4 node. In contrast, Bitcoin Tor nodes have an order ofmagnitude lower bandwidth compared to directly connected nodes, though theyare not unusable – e.g. 90% has more than 2 Mbit/s. Ongoing research exploresalternatives to the Tor network that also provide efficient communication [50].
Figure 2b shows the cumulative distribution of the bandwidth measurements.Steep increases in the Bitcoin IPv4/IPv6 curves at around 10 Mbps and 100Mbps regions represent typical bandwidth capacities of a home user, and a typ-ical Amazon EC2 Bitcoin instance. For Ethereum, we observe a similar accu-mulation around 10 Mbps region, but the bandwidth is more evenly distributedover the remaining nodes. As the long tailed distribution and higher standarddeviation indicates, bandwidth of Bitcoin IPv4/IPv6 nodes are spread out overa wider range of values compared to Ethereum nodes. While the most well pro-visioned Bitcoin nodes have around 300 Mbps of spare bandwidth, the highestEthereum node capacity that BMS has observed is limited to 250 Mbps.
One of the most interesting discoveries of this study is that the Bitcoin net-work has improved tremendously in terms of its provisioned bandwidth. The re-sults show that Bitcoin IPv4 nodes, which used to be connected to the networkwith a median bandwidth of 33 Mbit/s in 2016 [20], have a median bandwidthof 56 Mbit/s, as of February 2017. In other words, the provisioned bandwidth ofa typical full node is now 1.7× of what it was in 2016.
Critical system parameters, such as the maximum block size and block fre-quency, can be increased when the provisioned bandwidth increases. The increasein provisioned bandwidth suggests that the block size can be increased by a fac-tor of 1.7 without increasing centralization beyond its de facto level in 2016.Caveats. As with every measurement technique in the real world, our resultsabove are subject to experimental limitations and expected errors. The accu-racy of the measurements may drop under certain circumstances, including thecases where: (1) the network bottleneck lies on the side of the measurementbeacon rather than the remote peer, (2) network traffic on the side of BMSinterferes with the collected results, (3) the remote peer intentionally shapesthe traffic to selectively limit the bandwidth available to BMS, for instance viabandwidth throttling, and (4) different steady state bandwidth between Bitcoinand Ethereum, skewing the numbers for one system over another The setup ofour bandwidth infrastructure helps minimize potential inaccuracies due to thefirst two issues. Moreover, analysis of popular Bitcoin [5] and Ethereum clientimplementations [42, 61, 19, 60] shows that the third case is not supported by thissoftware and would require additional, potentially non-trivial, work to set up. Toverify the impact of the last issue, we ran an Ethereum and Bitcoin client andsaw that their bandwidth consumption differed by 0.2 Mbps, which introducesabout a 1% error on our measurements above.
In addition to our analysis above, we also expect to see certain artifacts in ourdata. As noted above, we see clusters of nodes around 10 Mbps and 100 Mbps,which are typical bandwidth capacities of home and EC2 users, respectively.
4.2 Network Structure
The structure of the peer-to-peer network impacts the security and performancefor cryptocurrencies. A geographically clustered network can quickly propagatea new block to many other nodes. This makes it more difficult for a maliciousminer to propagate conflicting blocks/transactions quicker than honest nodes.However, a less clustered network may mean that full nodes are being run by awider variety of users which is also good for decentralization.Methodology. Since it is not possible to obtain direct measurements betweenpeers we do not control, we use the state of the art estimation techniques toestablish bounds and gain insights into network structure.
Single Beacon Latency. We first collect direct ICMP ping measurements fromBMS nodes to all peers in the network. We report the minimum observed pinglatency, as it provides a physical bound on the distance to the BMS beacon.
Peer-to-Peer Latency. Measuring the peer-to-peer latency requires access tothe end points. In both Bitcoin and Ethereum, peers do not reveal their neigh-bors. Hiding the network structure boosts privacy and security [45, 56], but alsomakes it harder to infer properties about the network. BMS provides latencyestimates for a superset of the actual links between known peers. We do notnormalize for the slightly different network sizes, 3390 for Bitcoin and 4302 forEthereum, as our samples from both networks were very similar. Since measuringpeer-to-peer latencies directly is not feasible, we establish bounds from observed

latencies from multiple beacons, using techniques from prior literature [37]. BMSstarts with the measurements taken from a single beacon. Then, it uses the tri-angle inequality to estimate the upper and lower bounds for the latency betweenpeers. Repeating this process from other vantage points yields a set of boundsfor each pair of peers. Finally, BMS determines a range for latency estimates be-tween each peer by picking the maximum lower bound and the minimum upperbound. The paper also presents the average of the lower bound and upper boundlatency between peers. In this study, BMS includes nodes that do not supportthe DAO fork [10] in its measurements for Ethereum.
Geographical Distance. BMS takes the minimum of repeated latency measure-ments to eliminate transient network effects and capture the geographic distancebetween two nodes [43, 13, 69]. BMS also uses IP geolocation data to calculatedistances between peer nodes as an additional validation on our results. To cal-culate distances, BMS applies the Haversine formula [63] using the coordinatevalues gathered from an IP-based geolocation service [46].
Single Beacon Peer-to-PeerBitcoin Bitcoin Eth.
IPv4 IPv6 IPv4 IPv4[ms] [ms] [ms] [ms]
10% 29 40 48 9233% 78 80 79 12550% 89 95 109 15267% 98 95 152 20090% 201 165 286 276Avg. 97 103 135 171
Std. Dev. 59 62 88 76
Table 2: Min single beacon latencies ob-served and P2P latency estimates.
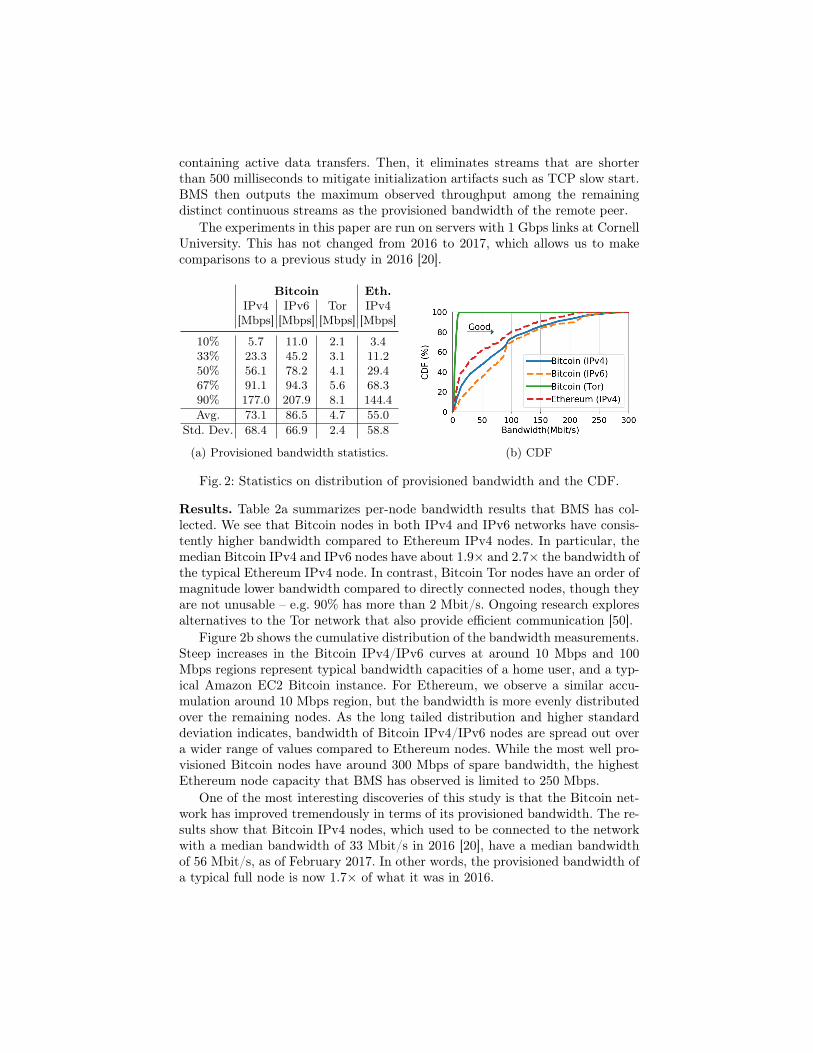
Results. Our measurements indicateconsiderable differences between P2Platencies of Bitcoin and EthereumIPv4 networks, summarized in Table 2and PDF graphed in Figure 3.
We find that Bitcoin has manymore nodes that are closer geograph-ically than Ethereum. Figure 3 showsthat Ethereum’s most likely laten-cies are centered around 120ms, whileBitcoin nodes tend to be clusteredaround 50ms. Only 13% of Ethereumlatencies are under 100ms, while Bit-coin has a surprisingly high 46%. Ad-ditionally, the estimated peer-to-peerlatency between Ethereum nodes is 26.7% higher than Bitcoin on average. Thisgeographic proximity between nodes, along with the observation that Bitcoin hasmany nodes with 100 Mbps of provisioned bandwidth (see Section 4.1), seems toindicate that many Bitcoin nodes are run in datacenters. 56% of Bitcoin’s nodesand 28% of Ethereum’s nodes belong to an autonomous system that providesdedicated hosting services, a difference significant at the 1% significance level.
Indeed Ethereum nodes are not accumulated in a single geographical region,but are more evenly distributed around the world. Figure 3c shows the CDF ofdistances between peer to peer nodes based on IP geolocation information. Theresults corroborate our findings based on network latency measurements andshow that Ethereum nodes are geographically further apart than Bitcoin. Asadditional evidence, when we use geolocation on the P2P distances and plot theCDF in Figure 3c, we see that Ethereum nodes are further apart than Bitcoin.Sanity Checks. The first two columns of Table 2 present single beacon latencyin Bitcoin IPv4/IPv6 networks. The results indicate that both the median and
(a) (b) (c)
Fig. 3: The histogram of P2P latencies in Ethereum (Fig 3a) and Bitcoin (Fig 3b),as well as the CDF of geographical distances (Fig 3c).
the average latency to IPv4 nodes are smaller than IPv6 nodes. As there arefewer IPv6 nodes than IPv4 nodes, we expect this result since IPv4 nodes aremore likely to be closer to our beacons.
While there has been a large body of work showing the prevalence of triangleinequality violations in the Internet [52, 67, 12], there are several reasons BMS’smeasurements are not affected significantly. First, such violations were shownto occur less than 5% of network snapshots [52]. Since we take the minimumlatency observed from a beacon, triangle inequality violations will only occur inour dataset less than 1% of the time [52]. TIVs are also significantly less prevalentwhen dealing with latencies less than 300 ms, which includes almost our entiredataset [67]. To ensure that the above results hold for our dataset as well, weused a geolocation service as ground truth to verify our results.
One other limitation in our study is that it is impossible to collect measure-ments using ICMP pings from nodes that block ICMP traffic and from Tor nodesthat only communicate over TCP.
4.3 Distribution of Mining Power
Mining on cryptocurrency networks is a complex process that typically requireslarge computation power. With the current mining difficulty of Bitcoin andEthereum, using commodity hardware to generate blocks is not feasible [21]which centralizes the mining process somewhat. However, as long as there aremany different entities mining, the system is still decentralized. We compare thedecentralization of the mining process between Bitcoin and Ethereum.Methodology. To identify the power of miners in Bitcoin and Ethereum, weexamined their weekly distribution over the last 10 months starting on July 15,2016. Our mining power estimations are based on the ratio of main chain blocksgenerated by distinct entities. Hence, pruned blocks in Bitcoin and uncles inEthereum do not affect these estimations. In both networks, miners voluntarilydisclose their identity as part of each block they mine. We gathered this datafrom a public API for Bitcoin [9] and a blockchain explorer for Ethereum [32].In Bitcoin, 1.8% of the blocks were unidentified, which we treated as if theywere generated by distinct individual miners. Finally, we manually processedidentities to detect and merge duplicates. This includes pools operated by thesame administrator [47] and multiple identities representing the same pool, whichwe identified by looking for the same pool name with a corresponding tag, e.g.’DwarfPool1’ and ’DwarfPool2’. While it is important to note that miners can be

5
15
25 Ethereum
Rati
o o
f M
inin
g P
ow
er
(%)
5
15
25
1 2 3 4 5 6 7 8 9 10 11 12 13 14 15 16 17 18 19 20
Bitcoin
Miner Index (Descending Mining Power)
Fig. 4: Distribution of mining power in Bitcoin and Ethereum networks. Barsindicate observed standard deviation from the average.
either solo miners or mining pools, this distinction is immaterial for the purposesof this analysis. The argument that mining pools provide a degree of decentral-ization due to mining pool participants having a check on pool operator behaviorhas no empirical support. For instance, censorship attacks by pool operators areare difficult, if not impossible, to detect by pool participants. Additionally, whenminers exceeded the 51% threshold on three separate occasions in Bitcoin’s his-tory, the pool participants did not disband the pool despite clear evidence of abehavior widely understood to be unacceptable. Most crucially, whether miningpools provide a degree of decentralization is inconsequential for the purposes ofthis paper, which provides an accurate historical account. We report what hap-pened at the time the blocks were mined, as recorded on the blockchain. As such,it is immaterial whether the miners were part of a pool or whether they weresolo miners. At the time a block was committed to the chain, pool participantswere plaintively cooperating as part of the same mining entity.Results. For each week of the analysis period, we calculated the correspondingmining power of entities and ranked each miner accordingly. Figure 4 shows thetop 20 weekly mining power distribution in the Ethereum and Bitcoin networks.Each group of bars represents a chronologically ordered collection of weeklymining power ratios, defined as the fraction of blocks contributed by a miner.
Figure 4 illustrates that, in Bitcoin, the weekly mining power of a single entityhas never exceeded 21% of the overall power. In contrast, the top Ethereum minerhas never had less than 21% of the mining power. Moreover, the top four Bitcoinminers have more than 53% of the average mining power. On average, 61% ofthe weekly power was shared by only three Ethereum miners. These observationssuggest a slightly more centralized mining process in Ethereum.
Although miners do change ranks over the observation period, each spotis only contested by a few miners. In particular, only two Bitcoin and threeEthereum miners ever held the top rank. The same mining pool has been atthe top rank for 29% of the time in Bitcoin and 14% of the time in Ethereum.Over 50% of the mining power has exclusively been shared by eight miners inBitcoin and five miners in Ethereum throughout the observed period. Even 90%of the mining power seems to be controlled by only 16 miners in Bitcoin and
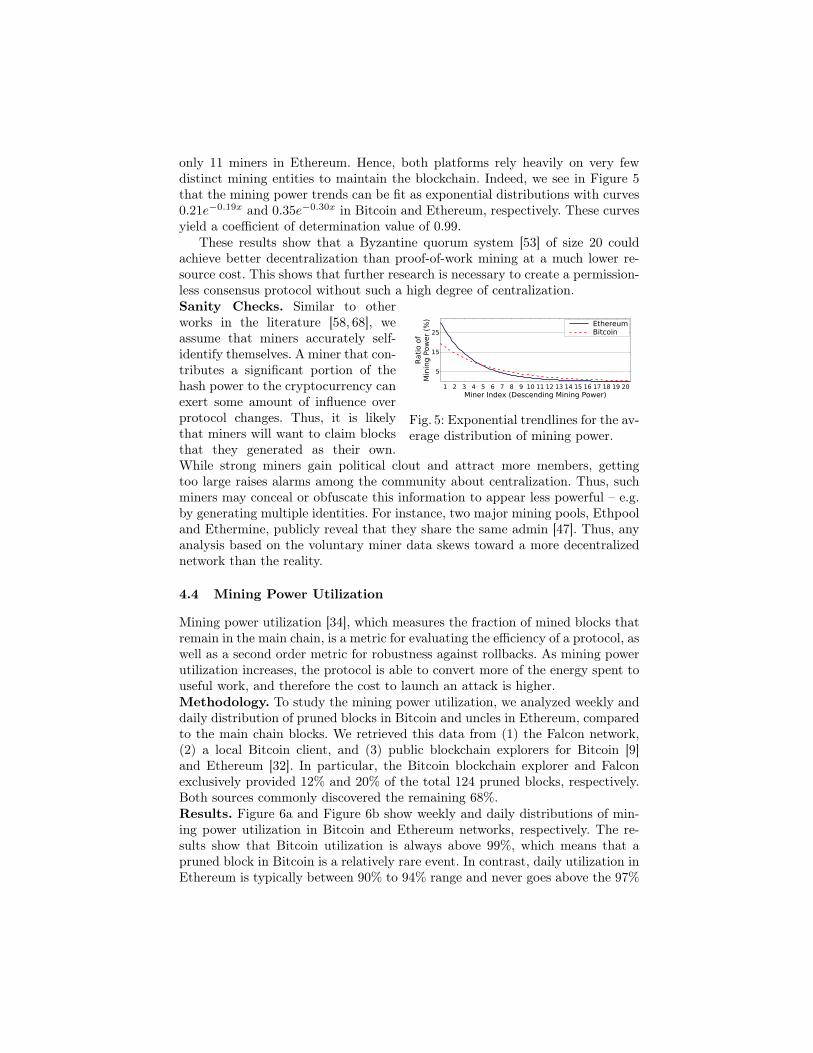
only 11 miners in Ethereum. Hence, both platforms rely heavily on very fewdistinct mining entities to maintain the blockchain. Indeed, we see in Figure 5that the mining power trends can be fit as exponential distributions with curves0.21e−0.19x and 0.35e−0.30x in Bitcoin and Ethereum, respectively. These curvesyield a coefficient of determination value of 0.99.
These results show that a Byzantine quorum system [53] of size 20 couldachieve better decentralization than proof-of-work mining at a much lower re-source cost. This shows that further research is necessary to create a permission-less consensus protocol without such a high degree of centralization.
5
15
25
1 2 3 4 5 6 7 8 9 10 11 12 13 14 15 16 17 18 19 20
Rati
o o
fM
inin
g P
ow
er
(%)
Miner Index (Descending Mining Power)
EthereumBitcoin
Fig. 5: Exponential trendlines for the av-erage distribution of mining power.
Sanity Checks. Similar to otherworks in the literature [58, 68], weassume that miners accurately self-identify themselves. A miner that con-tributes a significant portion of thehash power to the cryptocurrency canexert some amount of influence overprotocol changes. Thus, it is likelythat miners will want to claim blocksthat they generated as their own.While strong miners gain political clout and attract more members, gettingtoo large raises alarms among the community about centralization. Thus, suchminers may conceal or obfuscate this information to appear less powerful – e.g.by generating multiple identities. For instance, two major mining pools, Ethpooland Ethermine, publicly reveal that they share the same admin [47]. Thus, anyanalysis based on the voluntary miner data skews toward a more decentralizednetwork than the reality.
4.4 Mining Power Utilization
Mining power utilization [34], which measures the fraction of mined blocks thatremain in the main chain, is a metric for evaluating the efficiency of a protocol, aswell as a second order metric for robustness against rollbacks. As mining powerutilization increases, the protocol is able to convert more of the energy spent touseful work, and therefore the cost to launch an attack is higher.Methodology. To study the mining power utilization, we analyzed weekly anddaily distribution of pruned blocks in Bitcoin and uncles in Ethereum, comparedto the main chain blocks. We retrieved this data from (1) the Falcon network,(2) a local Bitcoin client, and (3) public blockchain explorers for Bitcoin [9]and Ethereum [32]. In particular, the Bitcoin blockchain explorer and Falconexclusively provided 12% and 20% of the total 124 pruned blocks, respectively.Both sources commonly discovered the remaining 68%.Results. Figure 6a and Figure 6b show weekly and daily distributions of min-ing power utilization in Bitcoin and Ethereum networks, respectively. The re-sults show that Bitcoin utilization is always above 99%, which means that apruned block in Bitcoin is a relatively rare event. In contrast, daily utilization inEthereum is typically between 90% to 94% range and never goes above the 97%
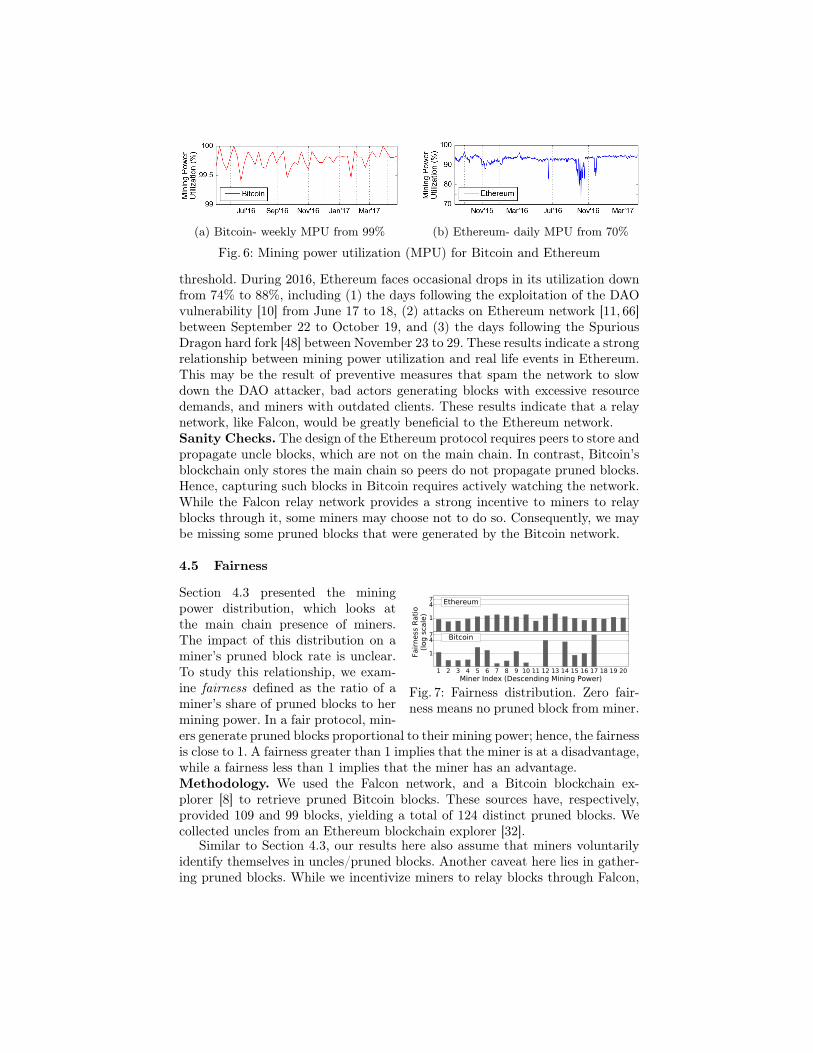
(a) Bitcoin- weekly MPU from 99% (b) Ethereum- daily MPU from 70%
Fig. 6: Mining power utilization (MPU) for Bitcoin and Ethereum
threshold. During 2016, Ethereum faces occasional drops in its utilization downfrom 74% to 88%, including (1) the days following the exploitation of the DAOvulnerability [10] from June 17 to 18, (2) attacks on Ethereum network [11, 66]between September 22 to October 19, and (3) the days following the SpuriousDragon hard fork [48] between November 23 to 29. These results indicate a strongrelationship between mining power utilization and real life events in Ethereum.This may be the result of preventive measures that spam the network to slowdown the DAO attacker, bad actors generating blocks with excessive resourcedemands, and miners with outdated clients. These results indicate that a relaynetwork, like Falcon, would be greatly beneficial to the Ethereum network.Sanity Checks. The design of the Ethereum protocol requires peers to store andpropagate uncle blocks, which are not on the main chain. In contrast, Bitcoin’sblockchain only stores the main chain so peers do not propagate pruned blocks.Hence, capturing such blocks in Bitcoin requires actively watching the network.While the Falcon relay network provides a strong incentive to miners to relayblocks through it, some miners may choose not to do so. Consequently, we maybe missing some pruned blocks that were generated by the Bitcoin network.
4.5 Fairness
1
47 Ethereum
Fair
ness
Rati
o(l
og s
cale
)
1
47
1 2 3 4 5 6 7 8 9 10 11 12 13 14 15 16 17 18 19 20
Bitcoin
Miner Index (Descending Mining Power)
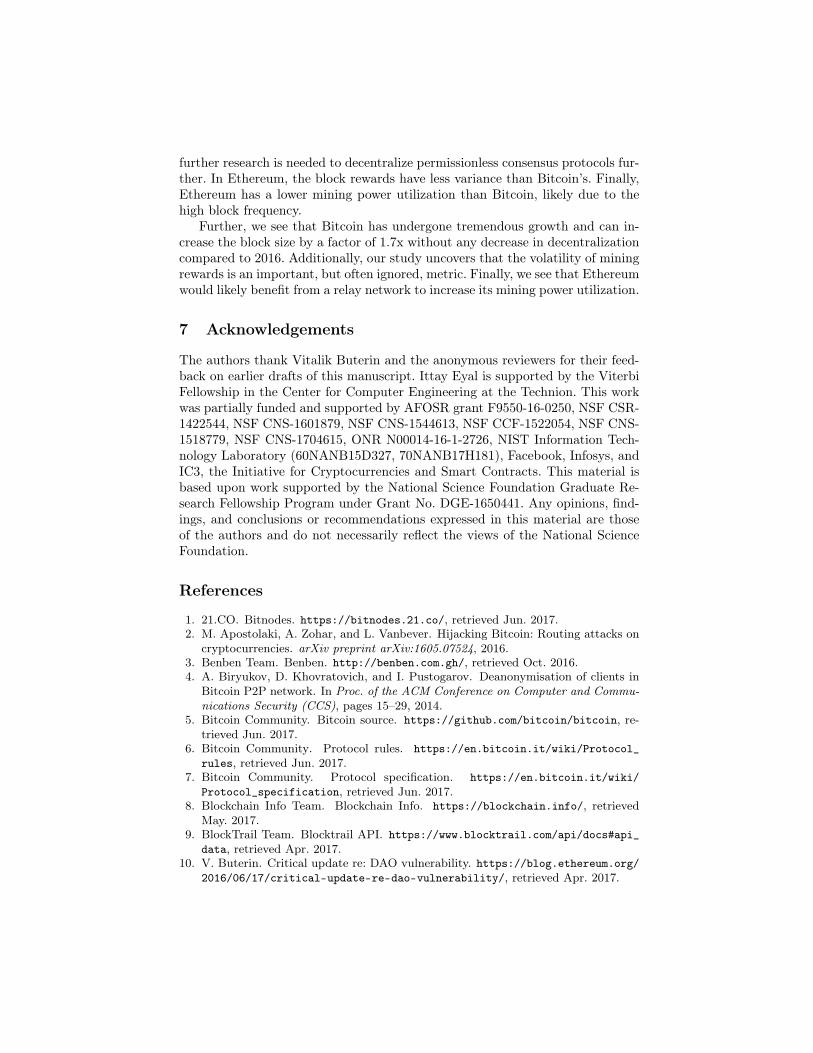
Fig. 7: Fairness distribution. Zero fair-ness means no pruned block from miner.
Section 4.3 presented the miningpower distribution, which looks atthe main chain presence of miners.The impact of this distribution on aminer’s pruned block rate is unclear.To study this relationship, we exam-ine fairness defined as the ratio of aminer’s share of pruned blocks to hermining power. In a fair protocol, min-ers generate pruned blocks proportional to their mining power; hence, the fairnessis close to 1. A fairness greater than 1 implies that the miner is at a disadvantage,while a fairness less than 1 implies that the miner has an advantage.Methodology. We used the Falcon network, and a Bitcoin blockchain ex-plorer [8] to retrieve pruned Bitcoin blocks. These sources have, respectively,provided 109 and 99 blocks, yielding a total of 124 distinct pruned blocks. Wecollected uncles from an Ethereum blockchain explorer [32].
Similar to Section 4.3, our results here also assume that miners voluntarilyidentify themselves in uncles/pruned blocks. Another caveat here lies in gather-ing pruned blocks. While we incentivize miners to relay blocks through Falcon,

there is no guarantee that they necessarily will do so. We suspect that explicitstorage of uncles in Ethereum captures a larger proportion of pruned blocks.Results. Figure 7 shows the distribution of fairness of 20miners with the highestmining power. The results indicate that, in both networks, the top four minersgenerally are more successful at appending blocks to the main chain. We runthe Kolmogorov-Smirnov goodness of fit test with a p-value of 0.01 to comparethe fairness distributions of Bitcoin and Ethereum. Perhaps surprisingly, we seethat the fairness of Ethereum and Bitcoin differ significantly from each otherkeeping a constant time period. The reason for this difference is a much largerstandard deviation in Bitcoin’s miner fairness compared to Ethereum (1.72 ver-sus 0.25). The mean of both fairness distributions, however, are very similar,with Ethereum at 1.08 and Bitcoin at 1.22.
A high variance results in centralization pressure since smaller miners willhave a more difficult time affording the loss of revenue due to a transientlyhigh fairness score. This high variance is a direct result of a significantly smallernumber of blocks being generated in Bitcoin. Since Ethereum has a higher blockfrequency than Bitcoin, smaller miners have a more predictable payoff than largerminers. This makes Ethereum more predictable to mine for smaller miners dueto the lower variance in block rewards. Thus, it is important for blockchainprotocols to take variance of the block rewards in addition to the mean.
Simply increasing the block frequency may not be the solution to decrease thevariance of block rewards since the mining power distribution may be affectedas well. The increased block frequency in Ethereum may be part of the cause ofthe slightly more centralized mining power distribution (see Section 4.3).
Sanity Checks. Similar to Section 4.4, our results here also assume thatminers voluntarily identify themselves in uncles/pruned blocks. As before, ifthe miners are lying, they are likely to present a more fair system than reality.Another caveat here lies in gathering pruned blocks. While we incentivize minersto relay blocks through Falcon, there is no guarantee that they will. We suspectthat explicit storage of uncles in Ethereum allows for more accurate analysis.
Finally, Bitcoin has a significantly lower block generation frequency thanEthereum. On top of that, Bitcoin also has a lower pruned block rate thanEthereum does, which means it has significantly fewer pruned blocks. Thus, thisfairness metric is much noisier in Bitcoin compared to Ethereum.
5 Related Work
Network measurements in blockchain-based systems have mainly focused on Bit-coin. One such study [22] demonstrated that the latency is the dominating factorin propagation of blocks smaller than 20 KB. Following work [20] has shown that(1) this limit has increased to 80 KB and (2) nodes are provisioned with sub-stantially higher bandwidth capacity than what the protocol demands. Feld etal. [36] pointed out a strong AS-level centralization that may impact Bitcoinnetwork’s connectivity – i.e. 10 ASes contain over 30% of peers. Recent work [2]presented the level of vulnerability, showing that 13 ASes cover the same fraction
of peers, but only 39 IP prefixes host half of the overall mining power. Ours isthe first work that does a similar type of study on Ethereum as well.
Other work studied various aspects of the Bitcoin overlay network. Miller etal. [56] found that a small fraction of the network, containing around 100 nodes,represents more than 75% of the mining power. The study conjectured that thesenodes are well-connected to major mining pools; hence, provide higher efficiencyin broadcasting blocks. Biryukov et al. [4] examined how peer neighbors discoverIP addresses that correspond to pseudonymous identities. Another study [49]deanonymized peers by observing anomalous relaying behavior in network. Pap-palardo et al. [59] observed that low value transactions may experience waitingtimes of over a month. Other work measured churn and geolocated peers [24].Gervais et al. [40] discussed centralization concerns regarding the client develop-ment process, distribution of mining power, and spendable coins. Most of theseworks focus on attacks and the structure of the overlay network, while this workfocuses on the resource capabilities of the nodes used in the overlay network.
Recent work presented ways to reduce resource requirements to participate inblockchain systems. Such solutions enhance decentralization by increasing the di-versity of participants. Aspen [39] achieves this through sharding the blockchain.In this system, users store, process, and propagate only the data that is relevantto them, hence need fewer resources to join the network. Another approach [62]relies on authenticated data structures to reduce load on nodes. Relay net-works increase network efficiency through faster block propagation. The firstsuch system [16] achieved this by avoiding full block verification and retransmit-ting known transactions. Falcon, the source of pruned block data in the Bitcoinnetwork in this paper, relies on cut-through routing for faster block propagation.Finally, FIBRE incorporates cut-through routing with compact blocks [17] andforward error correction over UDP. The novelty in our work was utilizing Falcondata in order to gain insights into transient application layer information.
Blockchain explorers [65, 8, 32, 33] provide a variety of data on cryptocurrencynetworks, including online blockchain history; statistics on blockchain compo-nents, transaction fees, and market value; and node information. While thesesources of information are useful to the community, this work scientifically testswhether the intuitions provided by these sources of information indeed hold.
6 Conclusion
Decentralization in blockchain-based platforms is a component of the valueproposition these systems offer. This work presents a comparative assessment ofdecentralization in two most popular cryptocurrencies, Bitcoin and Ethereum.To do so, it relies on novel measurement techniques to obtain application layerinformation using the Falcon Network and the application of well-establishedinternet measurement techniques.
Our observations show that Bitcoin has a higher capacity network thanEthereum,but with more clustered nodes likely in datacenters. We also observethat Bitcoin and Ethereum have fairly centralized mining processes and that
further research is needed to decentralize permissionless consensus protocols fur-ther. In Ethereum, the block rewards have less variance than Bitcoin’s. Finally,Ethereum has a lower mining power utilization than Bitcoin, likely due to thehigh block frequency.
Further, we see that Bitcoin has undergone tremendous growth and can in-crease the block size by a factor of 1.7x without any decrease in decentralizationcompared to 2016. Additionally, our study uncovers that the volatility of miningrewards is an important, but often ignored, metric. Finally, we see that Ethereumwould likely benefit from a relay network to increase its mining power utilization.
7 Acknowledgements
The authors thank Vitalik Buterin and the anonymous reviewers for their feed-back on earlier drafts of this manuscript. Ittay Eyal is supported by the ViterbiFellowship in the Center for Computer Engineering at the Technion. This workwas partially funded and supported by AFOSR grant F9550-16-0250, NSF CSR-1422544, NSF CNS-1601879, NSF CNS-1544613, NSF CCF-1522054, NSF CNS-1518779, NSF CNS-1704615, ONR N00014-16-1-2726, NIST Information Tech-nology Laboratory (60NANB15D327, 70NANB17H181), Facebook, Infosys, andIC3, the Initiative for Cryptocurrencies and Smart Contracts. This material isbased upon work supported by the National Science Foundation Graduate Re-search Fellowship Program under Grant No. DGE-1650441. Any opinions, find-ings, and conclusions or recommendations expressed in this material are thoseof the authors and do not necessarily reflect the views of the National ScienceFoundation.
References
1. 21.CO. Bitnodes. https://bitnodes.21.co/, retrieved Jun. 2017.2. M. Apostolaki, A. Zohar, and L. Vanbever. Hijacking Bitcoin: Routing attacks on
cryptocurrencies. arXiv preprint arXiv:1605.07524, 2016.3. Benben Team. Benben. http://benben.com.gh/, retrieved Oct. 2016.4. A. Biryukov, D. Khovratovich, and I. Pustogarov. Deanonymisation of clients in
Bitcoin P2P network. In Proc. of the ACM Conference on Computer and Commu-nications Security (CCS), pages 15–29, 2014.
5. Bitcoin Community. Bitcoin source. https://github.com/bitcoin/bitcoin, re-trieved Jun. 2017.
6. Bitcoin Community. Protocol rules. https://en.bitcoin.it/wiki/Protocol_rules, retrieved Jun. 2017.
7. Bitcoin Community. Protocol specification. https://en.bitcoin.it/wiki/Protocol_specification, retrieved Jun. 2017.
8. Blockchain Info Team. Blockchain Info. https://blockchain.info/, retrievedMay. 2017.
9. BlockTrail Team. Blocktrail API. https://www.blocktrail.com/api/docs#api_data, retrieved Apr. 2017.
10. V. Buterin. Critical update re: DAO vulnerability. https://blog.ethereum.org/2016/06/17/critical-update-re-dao-vulnerability/, retrieved Apr. 2017.

11. V. Buterin. Transaction spam attack: Next steps. https://blog.ethereum.org/2016/09/22/transaction-spam-attack-next-steps/, retrieved Apr. 2017.
12. F. Cangialosi, D. Levin, and N. Spring. Ting: Measuring and exploiting latenciesbetween all Tor nodes. In Proc. of the ACM SIGCOMM Conference on InternetMeasurement (IMC), pages 289–302, 2015.
13. B. Chandrasekaran, M. Bai, M. Schoenfield, A. Berger, N. Caruso, G. Economou,S. Gilliss, B. Maggs, K. Moses, D. Duff, et al. Alidade: Ip geolocation withoutactive probing. Technical report, Duke University, 2015.
14. B. Chun, D. Culler, T. Roscoe, A. Bavier, L. Peterson, M. Wawrzoniak, andM. Bowman. PlanetLab: an overlay testbed for broad-coverage services. ACMSIGCOMM CCR, 33(3):3–12, 2003.
15. CoinMarketCap. Cryptocurrency market capitalizations. https://coinmarketcap.com/, retrieved May. 2017.
16. M. Corallo. The Bitcoin relay network. BIP 152, http://bitcoinrelaynetwork.org/, retrieved May. 2017.
17. M. Corallo. Compact block relay. BIP 152, https://github.com/bitcoin/bips/blob/master/bip-0152.mediawiki, retrieved Jun. 2017.
18. M. Corallo. FIBRE: Fast internet Bitcoin relay engine. https://github.com/bitcoinfibre/bitcoinfibre, retrieved Apr. 2017.
19. Cpp-ethereum Authors. Ethereum C++ client. https://github.com/ethereum/cpp-ethereum, retrieved Apr. 2017.
20. K. Croman, C. Decker, I. Eyal, A. E. Gencer, A. Juels, A. Kosba, A. Miller, P. Sax-ena, E. Shi, E. G. Sirer, D. Song, and R. Wattenhofer. On scaling decentralizedblockchains (a position paper). In Proc. of the Workshop on Bitcoin and BlockchainResearch (BITCOIN), Barbados, 2016.
21. Cryptocompare Team. Cryptocurrency mining calculator. https://www.cryptocompare.com/mining/calculator, retrieved Jun. 2017.
22. C. Decker and R. Wattenhofer. Information propagation in the Bitcoin network.In Proc. of the IEEE International Conference on Peer-to-Peer Computing, pages1–10, Trento, Italy, 2013.
23. R. Dingledine, N. Mathewson, and P. Syverson. Tor: The second-generation onionrouter. In Proc. of the USENIX Security Symposium, 2004.
24. J. A. D. Donet, C. Pérez-Sola, and J. Herrera-Joancomartí. The Bitcoin P2Pnetwork. In Proc. of the International Financial Cryptography and Data SecurityConference, pages 87–102, Barbados, 2014.
25. Ethereum Community. devp2p forward compatibility requirements for home-stead. https://github.com/ethereum/EIPs/blob/master/EIPS/eip-8.md, re-trieved Apr. 2017.
26. Ethereum Community. DΞVp2p wire protocol. https://github.com/ethereum/wiki/wiki/%C3%90%CE%9EVp2p-Wire-Protocol, retrieved Apr. 2017.
27. Ethereum Community. Ethereum wire protocol. https://github.com/ethereum/wiki/wiki/Ethereum-Wire-Protocol, retrieved Apr. 2017.
28. Ethereum Community. A next generation smart contract and decentralized ap-plication platform. https://github.com/ethereum/wiki/wiki/White-Paper, re-trieved Apr. 2017.
29. Ethereum Community. RLPx: Cryptographic network & transport proto-col. https://github.com/ethereum/devp2p/blob/master/rlpx.md, retrievedApr. 2017.
30. Ethereum Community. RLPx encryption. https://github.com/ethereum/go-ethereum/wiki/RLPx-Encryption, retrieved Apr. 2017.
31. EthereumJ. The Ethereum nodes explorer. https://www.ethernodes.org/, re-trieved Jun. 2017.
32. Etherscan Team. Etherscan: The Ethereum block explorer. https://etherscan.io/, retrieved Jun. 2017.
33. Ethstats Team. Ethstats. https://ethstats.net/, retrieved Jun. 2017.34. I. Eyal, A. E. Gencer, E. G. Sirer, and R. van Renesse. Bitcoin-NG: A scalable
blockchain protocol. In Proc. of the USENIX Symposium on Networked SystemsDesign and Implementation (NSDI), pages 45–59, Santa Clara, CA, USA, 2016.
35. I. Eyal and E. G. Sirer. Majority is not enough: Bitcoin mining is vulnerable. InProc. of the International Financial Cryptography and Data Security Conference,Barbados, 2014.
36. S. Feld, M. Schönfeld, and M. Werner. Analyzing the deployment of Bitcoin’s P2Pnetwork under an AS-level perspective. Proc. of the International Workshop onSecure Peer-to-Peer Intelligent Networks and Systems, 32:1121–1126, 2014.
37. P. Francis, S. Jamin, C. Jin, Y. Jin, D. Raz, Y. Shavitt, and L. Zhang. Idmaps:A global internet host distance estimation service. IEEE/ACM Transactions onNetworking (TON), pages 525–540, 2001.
38. J. A. Garay, A. Kiayias, and N. Leonardos. The Bitcoin backbone protocol: Anal-ysis and applications. In Proc. of the International Conference on the Theoryand Applications of Cryptographic Techniques (EUROCRYPT), pages 281–310.Springer, 2015.
39. A. E. Gencer, R. van Renesse, and E. G. Sirer. Short paper: Service-orientedsharding for blockchains. In Proc. of the International Financial Cryptography andData Security Conference, Sliema, Malta, 2017.
40. A. Gervais, G. O. Karame, V. Capkun, and S. Capkun. Is Bitcoin a decentralizedcurrency? Proc. of the IEEE Symposium on Security and Privacy, 3(12):54–60,2014.
41. A. Gervais, G. O. Karame, K. Wüst, V. Glykantzis, H. Ritzdorf, and S. Capkun.On the security and performance of proof of work blockchains. In Proc. of theACM Conference on Computer and Communications Security (CCS), pages 3–16,Vienna, Austria, 2016.
42. Go-ethereum Authors. Official Go implementation of the Ethereum protocol.https://github.com/ethereum/go-ethereum, retrieved Apr. 2017.
43. S. Guha, R. Murty, and E. G. Sirer. Sextant: A unified framework for node andevent localization in sensor networks. In Proc. of the ACM International Sympo-sium on Mobile Ad Hoc Networking and Computing, pages 205–216. ACM, 2005.
44. M. Hearn and M. Corallo. Connection bloom filtering. BIP 37, https://github.com/bitcoin/bips/blob/master/bip-0037.mediawiki, retreived Sept. 2017.
45. E. Heilman, A. Kendler, A. Zohar, and S. Goldberg. Eclipse attacks on Bitcoin’speer-to-peer network. In Proc. of the USENIX Security Symposium, pages 129–144,Washington, D.C., USA, 2015.
46. IP Info Team. IP Info. http://ipinfo.io/, retrieved Apr. 2017.47. jackwinters. Ethpool & Ethermine voting on the soft fork. https://
forum.daohub.org/t/ethpool-ethermine-voting-on-the-soft-fork/5364, re-trieved Apr. 2017.
48. H. Jameson. Hard fork no. 4: Spurious Dragon. https://blog.ethereum.org/2016/11/18/hard-fork-no-4-spurious-dragon/, retrieved Apr. 2017.
49. P. Koshy, D. Koshy, and P. McDaniel. An analysis of anonymity in Bitcoin usingP2P network traffic. In Proc. of the International Financial Cryptography andData Security Conference, pages 469–485, Barbados, 2014.
50. A. Kwon, D. Lazar, S. Devadas, and B. Ford. Riffle: An efficient communica-tion system with strong anonymity. Proc. of the Privacy Enhancing TechnologiesSymposium (PETS), 2016.
51. A. Loibl. Namecoin. namecoin.info, 2014.52. C. Lumezanu, R. Baden, N. Spring, and B. Bhattacharjee. Triangle inequality
variations in the internet. In Proc. of the ACM SIGCOMM Conference on InternetMeasurement (IMC), pages 177–183, 2009.
53. D. Malkhi and M. Reiter. Byzantine quorum systems. Journal of DistributedComputing, 11(4):203–213, 1998.
54. P. Maymounkov and D. Mazieres. Kademlia: A peer-to-peer information systembased on the XOR metric. In Proc. of the International Workshop on Peer-to-PeerSystems, pages 53–65. Springer, 2002.
55. P. McCorry, S. Shahandashti, and F. Hao. A smart contract for boardroom votingwith maximum voter privacy. In Proc. of the International Financial Cryptographyand Data Security Conference, Sliema, Malta, 2017.
56. A. Miller, J. Litton, A. Pachulski, N. Gupta, D. Levin, N. Spring, and B. Bhat-tacharjee. Discovering Bitcoin’s public topology and influential nodes, 2015.
57. S. Nakamoto. Bitcoin: A peer-to-peer electronic cash system, 2008.58. K. Nayak, S. Kumar, A. Miller, and E. Shi. Stubborn mining: Generalizing selfish
mining and combining with an eclipse attack. IACR Cryptology ePrint Archive,2015:796, 2015.
59. G. Pappalardo, T. Di Matteo, G. Caldarelli, and T. Aste. Blockchain inefficiencyin the Bitcoin peers network. arXiv preprint arXiv:1704.01414, 2017.
60. Parity Authors. Ethereum Rust client. https://github.com/paritytech/parity,retrieved Apr. 2017.
61. Pyethapp Authors. Python based client implementing the Ethereum protocol.https://github.com/ethereum/pyethapp/, retrieved Apr. 2017.
62. L. Reyzin, D. Meshkov, A. Chepurnoy, and S. Ivanov. Improving authenticateddynamic dictionaries, with applications to cryptocurrencies. In Proc. of the In-ternational Financial Cryptography and Data Security Conference, Sliema, Malta,2017.
63. R. W. Sinnott. Virtues of the haversine. Sky and Telescope, 1984.64. Y. Sompolinsky and A. Zohar. Secure high-rate transaction processing in Bitcoin.
In Proc. of the International Financial Cryptography and Data Security Conference,pages 507–527, Puerto Rico, 2015.
65. Statoshi Team. Statoshi info. http://statoshi.info/, retrieved May. 2017.66. M. Swende. Announcement of imminent hard fork for EIP150 gas cost
changes. https://blog.ethereum.org/2016/10/13/announcement-imminent-hard-fork-eip150-gas-cost-changes/, retrieved Apr. 2017.
67. G. Wang, B. Zhang, and T. Ng. Towards network triangle inequality violationaware distributed systems. In Proc. of the ACM SIGCOMM Conference on InternetMeasurement (IMC), pages 175–188. ACM, 2007.
68. L. Wang and Y. Liu. Exploring miner evolution in Bitcoin network. In Proc. ofthe International Workshop on Passive and Active Network Measurement, pages290–302. Springer, 2015.
69. Y. Wang, D. Burgener, M. Flores, A. Kuzmanovic, and C. Huang. Towards street-level client-independent ip geolocation. In Proc. of the USENIX Symposium onNetworked Systems Design and Implementation (NSDI), pages 365–379. USENIXAssociation, 2011.
70. G. Wood. Ethereum: A secure decentralised generalised transaction ledger.Ethereum Project Yellow Paper, 2014.