December 2019 - Alchemy Capital · Hindustan Unilever 98,520 92,340 7% 24,430 20,190 21% 18,480...
9
December 2019 1
Transcript of December 2019 - Alchemy Capital · Hindustan Unilever 98,520 92,340 7% 24,430 20,190 21% 18,480...
D e c e m b e r 2 0 1 9
1
EQUITY OUTLOOK
2
Markets pausing for breath…
The markets remained resilient through November 2019 with the Nifty rising 2.2% and the NSE Midcap rising 5.7%. The NSE Bank was one of the key sectoral indices, rising >8% this month. The concurrent indicators for the economy remained weak. Industrial growth was sluggish and the Index of Industrial Production (IIP) delivered a negative print for October 2019. Exports also remained sluggish with a 1.1% contraction for October 2019. The worrying sign is that bank credit growth remains stubbornly low at 8.1% y/y. Compounded with the weak growth for NBFCs and the bond market; this remains an impediment to growth. This weakness is reflected in the GDP growth for 2QFY20, which came in at 4.5%. Some positives are, however, coming through. As we discussed last month, interest rates are continuing to head southwards, aided by both RBI rate cuts and transmission. The monsoons have been strong and this should aid a recovery in rural sentiment. The reflation of food prices would also help in improving cash flows to the farming and rural segments. Additionally, you may also read the views from HDFC Bank in The Print (https://theprint.in/economy/hdfc-bank-sees-signs-of-economy-reviving-in-rural-and-semi-urban-areas/329435/) * The policy environment is improving with some significant events this month. • The Supreme Court judgment on the Essar Steel insolvency was a major positive for the
banking sector. It resolves many of the uncertainties surrounding the IBC process, and this will help banks recover future NPAs faster, with lower losses. This should be positive for corporate banks like ICICI Bank and Axis Bank.
• The Cabinet approved the privatization of Air India and BPCL this month. These have twin benefits – not only does the stressed fiscal get a boost but it also helps improve efficiencies in the economy as ownership transitions from the state to private hands. There are still some obstacles in execution but the intent of the government is a good sign.
• The Lok Sabha took up the Industrial Relations Code Bill – this could form the basis for significant labour reform. Rigid labour laws are seen as an impediment to the investment cycle.
The key risks remain unchanged. The real estate sector is a pain point and the source for much of the stress in the financial sector. The government’s proposed Alternative Investment Fund (AIF) is a good step but would take time to impact. The other source of pain is the fiscal deficit – weak growth is translating to sluggish revenues, which are now lagging behind the budget forecasts.
* The information contained in this link has been obtained from public domain and is for informational purposes only. Alchemy does not make any representations or warranty, express or implied, that such information is accurate or complete.

EQUITY OUTLOOK
3
We are slowing our deployment as the post-September 2019 rally has stretched valuations for the portfolio companies. On the other hand, the continued weakness in the economy does not give us confidence to go down the quality curve. We will watch the market till the next Budget in end-January 2020 for further cues.
Seshadri Sen Head of Research Alchemy Capital Management Pvt. Ltd Source-Alchemy Research
Q2FY20 Performance of Portfolio Companies
4
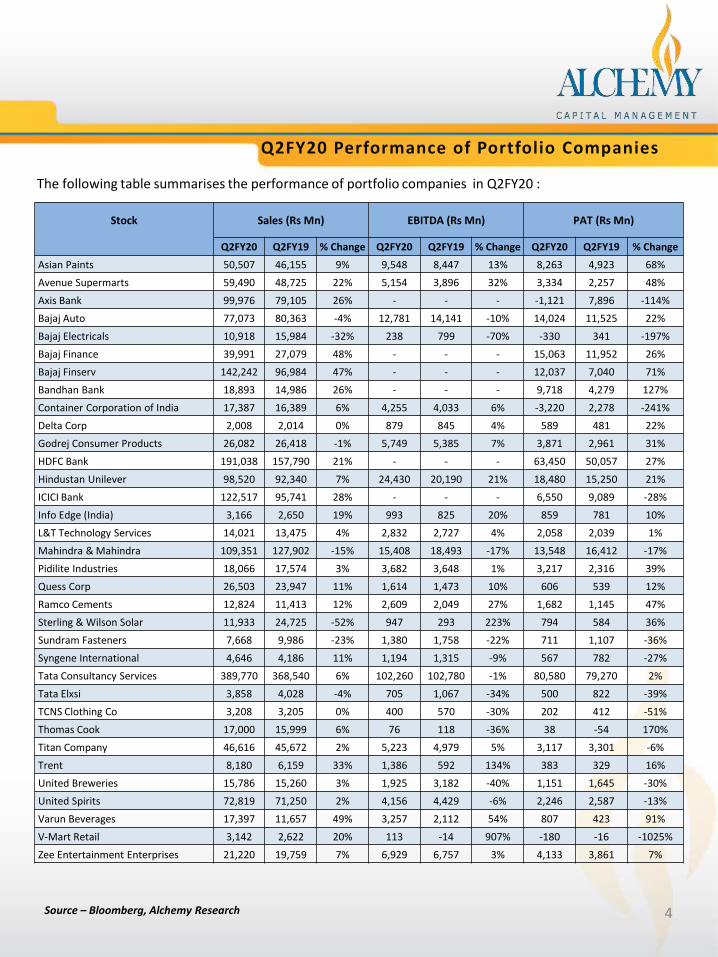
The following table summarises the performance of portfolio companies in Q2FY20 :
Source – Bloomberg, Alchemy Research
Stock Sales (Rs Mn) EBITDA (Rs Mn) PAT (Rs Mn)
Q2FY20 Q2FY19 % Change Q2FY20 Q2FY19 % Change Q2FY20 Q2FY19 % Change
Asian Paints 50,507 46,155 9% 9,548 8,447 13% 8,263 4,923 68%
Avenue Supermarts 59,490 48,725 22% 5,154 3,896 32% 3,334 2,257 48%
Axis Bank 99,976 79,105 26% - - - -1,121 7,896 -114%
Bajaj Auto 77,073 80,363 -4% 12,781 14,141 -10% 14,024 11,525 22%
Bajaj Electricals 10,918 15,984 -32% 238 799 -70% -330 341 -197%
Bajaj Finance 39,991 27,079 48% - - - 15,063 11,952 26%
Bajaj Finserv 142,242 96,984 47% - - - 12,037 7,040 71%
Bandhan Bank 18,893 14,986 26% - - - 9,718 4,279 127%
Container Corporation of India 17,387 16,389 6% 4,255 4,033 6% -3,220 2,278 -241%
Delta Corp 2,008 2,014 0% 879 845 4% 589 481 22%
Godrej Consumer Products 26,082 26,418 -1% 5,749 5,385 7% 3,871 2,961 31%
HDFC Bank 191,038 157,790 21% - - - 63,450 50,057 27%
Hindustan Unilever 98,520 92,340 7% 24,430 20,190 21% 18,480 15,250 21%
ICICI Bank 122,517 95,741 28% - - - 6,550 9,089 -28%
Info Edge (India) 3,166 2,650 19% 993 825 20% 859 781 10%
L&T Technology Services 14,021 13,475 4% 2,832 2,727 4% 2,058 2,039 1%
Mahindra & Mahindra 109,351 127,902 -15% 15,408 18,493 -17% 13,548 16,412 -17%
Pidilite Industries 18,066 17,574 3% 3,682 3,648 1% 3,217 2,316 39%
Quess Corp 26,503 23,947 11% 1,614 1,473 10% 606 539 12%
Ramco Cements 12,824 11,413 12% 2,609 2,049 27% 1,682 1,145 47%
Sterling & Wilson Solar 11,933 24,725 -52% 947 293 223% 794 584 36%
Sundram Fasteners 7,668 9,986 -23% 1,380 1,758 -22% 711 1,107 -36%
Syngene International 4,646 4,186 11% 1,194 1,315 -9% 567 782 -27%
Tata Consultancy Services 389,770 368,540 6% 102,260 102,780 -1% 80,580 79,270 2%
Tata Elxsi 3,858 4,028 -4% 705 1,067 -34% 500 822 -39%
TCNS Clothing Co 3,208 3,205 0% 400 570 -30% 202 412 -51%
Thomas Cook 17,000 15,999 6% 76 118 -36% 38 -54 170%
Titan Company 46,616 45,672 2% 5,223 4,979 5% 3,117 3,301 -6%
Trent 8,180 6,159 33% 1,386 592 134% 383 329 16%
United Breweries 15,786 15,260 3% 1,925 3,182 -40% 1,151 1,645 -30%
United Spirits 72,819 71,250 2% 4,156 4,429 -6% 2,246 2,587 -13%
Varun Beverages 17,397 11,657 49% 3,257 2,112 54% 807 423 91%
V-Mart Retail 3,142 2,622 20% 113 -14 907% -180 -16 -1025%
Zee Entertainment Enterprises 21,220 19,759 7% 6,929 6,757 3% 4,133 3,861 7%
Investment Objective*: The objective is to generate long-term returns by investing in equities and equity related instruments across market capitalizations, but with a strong mid-cap bias.
Fund Manager: A Chartered Accountant by profession, Mr. Amit Nadekar has worked across equity research, corporate strategy, taxation and audit over the last one and a half decades. He started his career on the sell side, tracking the US banking & financial sector; later moving on to the corporate side as a part of the Corporate Strategy team at Raymond. He has been a part of the Alchemy investment team since 2005.
Strategy* at a glance: Category: Equity Diversified Fund Style: Multi-cap Growth Type: Open Ended Launch Date: 8th May, 2002 Benchmark: S&P BSE 500 Min investment: Rs. 25 lacs
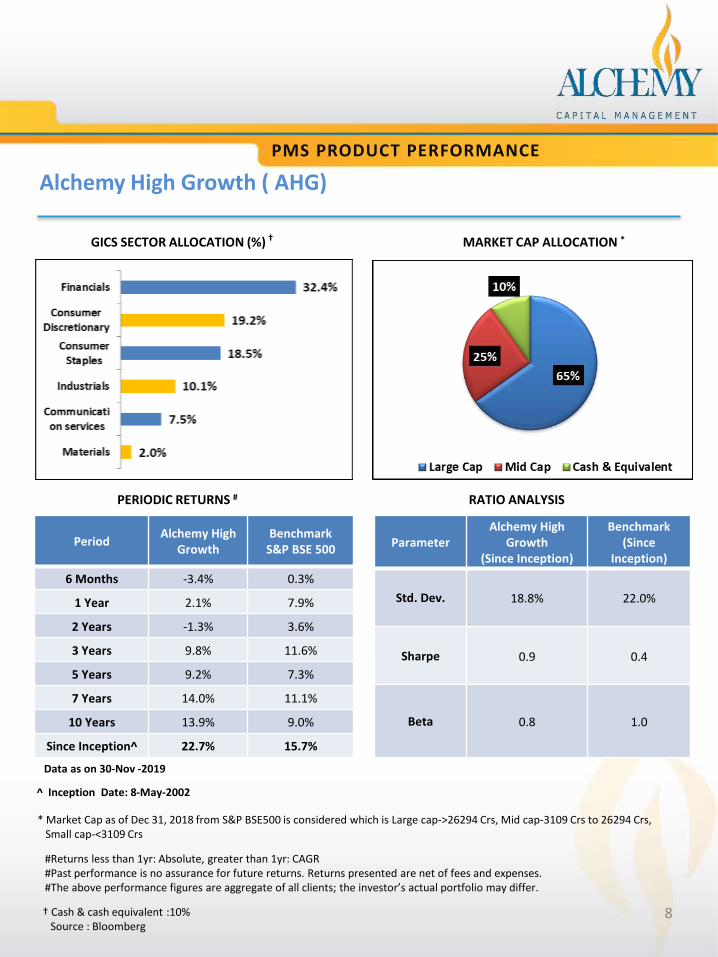
PMS PRODUCT PERFORMANCE
Alchemy High Growth ( AHG)
Portfolio Action: In November 2019, the portfolio exited from Mahindra CIE , Greaves Cotton, Dishman Carbogen and BASF India Mahindra CIE: Investment hypothesis was that the company through diversification in product portfolio and customer profile would
be able to grow faster than market and also keep improving its margin profile leading to higher ROE/ROCE which in turn would have led to a re-rating of the valuation multiples.
While sales growth has been better than industry even during downturns, it has an adverse impact on the margin improvement trajectory which gets delayed by a few quarters.
Auto market has slowed down in recent quarters both in India and Europe. The outlook is not positive either; at least in next few quarters. This in turn leads to muted earnings growth over the next few years.
Greaves Cotton: Investment hypothesis was that the company’s earnings would grow at a steady CAGR of 15-20%+ over the next few
years based on diversification into high margin after sales business and entry into 4W diesel engines for LCVs. However, that thesis hasn’t played out as producing diesel LCVs has become cost-prohibitive post BS6 emission
norms. In addition, 3W diesel engine business faces challenges with growing electrification leading to lesser demand for 3W in
general.
* The product’s objective and strategy are merely a target and there are no assurance that it would be achieved. * Please read the Disclosure Document/ Client Agreement for complete details 5
6
Dishman Carbogen Investment hypothesis was that the company’s revenues would grow at a CAGR of 12%+ over the
next few years given commercialization of 2 to 3 molecules every year and capacity expansion for early phase development pipeline. This along with strong operating cash-flows & lower capex levels will improve overall return ratios.
However, return ratios (from 12% to 5% on adjusted basis) have deteriorated sharply due to unusually high capex levels. We are disappointed with continuous overshooting of capital expenditure in last 18 months (incurred Rs 528 Cr capex & Rs 220 Cr in 1HFY20). In a way, Dishman has added 32% capacity to its base capacity, which was already running at very low utilization. This has led to increase in net debt levels (by Rs 1.28 bn to Rs 9.15 bn) in 1HFY20.
BASF India: Investment hypothesis was that the company’s earnings would grow at a CAGR of 20%+ over the next
few years based on improvement in margins due to higher manufacturing in India at the new Dahej plant and reduced imports.
However, that thesis hasn’t played out with import intensity remaining high while production at domestic units for certain products didn’t scale up because of lack of demand growth and hence EBITDA margins remained subdued. This is unlikely to change significantly.
PMS PRODUCT PERFORMANCE
Alchemy High Growth ( AHG)
PMS PRODUCT PERFORMANCE
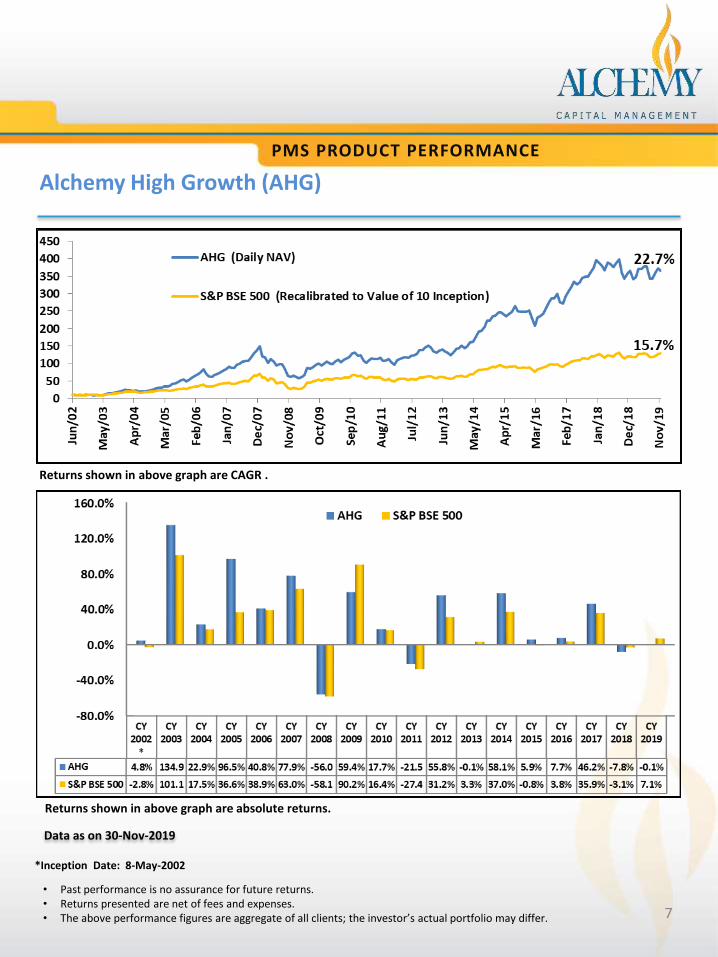
*Inception Date: 8-May-2002
Alchemy High Growth (AHG)
• Past performance is no assurance for future returns. • Returns presented are net of fees and expenses. • The above performance figures are aggregate of all clients; the investor’s actual portfolio may differ.
7
Returns shown in above graph are absolute returns.
Data as on 30-Nov-2019
Returns shown in above graph are CAGR .
PMS PRODUCT PERFORMANCE
Alchemy High Growth ( AHG)
GICS SECTOR ALLOCATION (%) † MARKET CAP ALLOCATION *
RATIO ANALYSIS PERIODIC RETURNS #
Data as on 30-Nov -2019
^ Inception Date: 8-May-2002
* Market Cap as of Dec 31, 2018 from S&P BSE500 is considered which is Large cap->26294 Crs, Mid cap-3109 Crs to 26294 Crs, Small cap-<3109 Crs
Period Alchemy High
Growth Benchmark
S&P BSE 500
6 Months -3.4% 0.3%
1 Year 2.1% 7.9%
2 Years -1.3% 3.6%
3 Years 9.8% 11.6%
5 Years 9.2% 7.3%
7 Years 14.0% 11.1%
10 Years 13.9% 9.0%
Since Inception^ 22.7% 15.7%
Parameter Alchemy High
Growth (Since Inception)
Benchmark (Since
Inception)
Std. Dev. 18.8% 22.0%
Sharpe 0.9 0.4
Beta 0.8 1.0
#Returns less than 1yr: Absolute, greater than 1yr: CAGR #Past performance is no assurance for future returns. Returns presented are net of fees and expenses. #The above performance figures are aggregate of all clients; the investor’s actual portfolio may differ.
8 † Cash & cash equivalent :10% Source : Bloomberg
DISCLAIMER
General Risk factors All investment products attract various kinds of risks. Please read the relevant Disclosure Document / Client Agreement carefully before investing. General Disclaimers The information and opinions contained in this report/ presentation have been obtained from sources believed to be reliable, but no representation or warranty, express or implied, is made that such information is accurate or complete. Information and opinions contained in the report/ presentation are disseminated for the information of authorized recipients only, and are not to be relied upon as advisory or authoritative or taken in substitution for the exercise of due diligence and judgement by any recipient. The information and opinions are not, and should not be construed as, an offer or solicitation to buy or sell any securities or make any investments. Nothing contained herein, including past performance, shall constitute any representation or warranty as to future performance. The client is solely responsible for consulting his/her/its own independent advisors as to the legal, tax, accounting and related matters concerning investments and nothing in this document or in any communication shall constitutes such advice. The client is expected to understand the risk factors associated with investment & act on the information solely on his/her/its own risk. As a condition for providing this information, the client agrees that Alchemy Capital Management Pvt. Ltd., its Group or affiliates makes no representation and shall have no liability in any way arising to them or any other entity for any loss or damage, direct or indirect, arising from the use of this information. This document and its contents are proprietary information of Alchemy Capital Management Pvt. Ltd and may not be reproduced or otherwise disseminated in whole or in part without the written consent.
Alchemy Capital Management Pvt. Ltd., B-4, Amerchand Mansion, 16 Madame Cama Road, Mumbai 400 001.
Ph: +91-22-66171700 CIN- U67120MH1999PTC119811, Email ID: [email protected]
9