December 2017 - NBG · Substantially lower CoR vs persistently high levels of 1H.17 ELA...
46
Corporate presentation December 2017
Transcript of December 2017 - NBG · Substantially lower CoR vs persistently high levels of 1H.17 ELA...

Corporate presentation
December 2017

1 Corporate Presentation – December 2017
No representation or warranty, express or implied, is or will be made in relation to, and no responsibility is or will be
accepted by National Bank of Greece (the Group) as to the accuracy or completeness of the information contained in
this presentation and nothing in this presentation shall be deemed to constitute such a representation or warranty.
Although the statements of fact and certain industry, market and competitive data in this presentation have been
obtained from and are based upon sources that are believed to be reliable, their accuracy is not guaranteed and any
such information may be incomplete or condensed. All opinions and estimates included in this presentation are
subject to change without notice. The Group is under no obligation to update or keep current the information
contained herein.
In addition, certain of these data come from the Group’s own internal research and estimates based on knowledge
and experience of management in the market in which it operates. Such research and estimates and their underlying
methodology have not been verified by any independent source for accuracy or completeness. Accordingly, you
should not place undue reliance on them.
Certain statements in this presentation constitute forward-looking statements. Such forward looking statements are
subject to risks and uncertainties that may cause actual results to differ materially. These risks and uncertainties
include, among other factors, changing economic, financial, business or other market conditions. As a result, you are
cautioned not to place any reliance on such forward-looking statements. Nothing in this presentation should be
construed as a profit forecast and no representation is made that any of these statement or forecasts will come to
pass. Persons receiving this presentation should not place undue reliance on forward-looking statements and are
advised to make their own independent analysis and determination with respect to the forecast periods, which reflect
the Group’s view only as of the date hereof.
Legal
Important Notice – Forward Looking Information

Table of Contents
1 Overview
2 Financial Highlights
3 Profitability
4 Asset Quality
5 Liquidity
6 Macro
7 Appendix I
Appendix II: Financials

Overview
1

4 Corporate Presentation – December 2017
Comprehensive strategy to tap the Greek recovery potential
Utilize high coverage and capital levels to work through NPLs
Deploy liquidity to support the recovery of the Greek economy
Improve profitability to allow for strong organic capital
generation
Overview

5 Corporate Presentation – December 2017
Successfully completed all major strategic objectives since the 2015 recapitalization
Completed divestments in line
with the restructuring plan
Increased loan loss coverage
to the highest levels among
peers
Set the basis for OPEX
reduction
Optimized collateral and
liquidity management
Significantly improved
financial performance across
key metrics
Exceeded NPE and NPL
reduction targets
2016
9m.17 Group PPI increases by
+9% yoy
9m.17 Group OpEx declines by
8% yoy
Exceeded 2017 NPE reduction
targets
Ongoing divestments on track
– expected to enhance further
capital and liquidity position
Clear path towards ELA
exposure elimination in the
short term
€1.1b loan disbursements to
corporates during 9m.17
Loan & Deposit balances lag
RP predictions by c.€4b and
c.€5b respectively, due to
extended economic
uncertainty
2017 9m
Consistently delivering on all strategic objectives
2015
Recapitalization
following the AQR
results
Restructuring plan
approval by EC
Revised strategy and
changed leadership
Overview
Higher NII on funding benefits
and positive growth in
corporate loans offsetting
lower NPL accruals
Substantially lower CoR vs
persistently high levels of
1H.17
ELA elimination; liquidity to be
channeled towards healthy
corporates
Enhancing outperformance
buffer on NPE reduction
>€2.0b in new corporate
disbursements
2018E

6 Corporate Presentation – December 2017
Positioning to take advantage of gradual economic recovery in the following years
- Satisfy healthy corporate credit
demand induced by a growing
macroeconomic environment,
benefiting NIM through mix
improvement and NII through
levering up
- Capitalize on leading debit card
position to increase POS fees and
e-banking transaction fees
- Further improve efficiency
- Utilize high coverage and capital
levels to work through NPLs
reduction
- Achieve all asset quality KPIs
agreed with SSM
- Increase restructuring efforts,
containing re-defaults
- Disengage from ELA funding
- Establish a recurring presence in
the primary wholesale funding
markets
- Capitalize on leading franchise
position to attract deposit inflows
Enhance core income growthA
Improve asset qualityB
Normalize the liquidity positionC
Strategic objectives going forward
Overview

7 Corporate Presentation – December 2017
C) Efficiency Improvement
A) Funding Cost Improvement
1. 2Q15 figures include the Ethniki Insurance Company
2. Down due to restructuring impact
3. Excludes the Ethniki Insurance company agreed to be sold
4. Expected NBG inflows in the 2 years following the imposition of capital controls at c.€3-4b, actual experienced at €1.3b
NBG has delivered most of medium term targets envisaged in the 2015 capital raise
Overview
D) CoR Evolution
B) Business Mix Optimization & Income growth
Greece
2Q15 3Q17 Δ
Time deposits repricing (bps) 185 90 -95
Reduction of ELA (€ b) 17.6 2.3 -15.3
Elimination of Pillar bonds (€ b) 8.7 0.0 -8.7
Deposit inflows (€ b)4 3-4 1.3
Greece
2Q151 3Q173 Δ
Gross Corporate loans / Total
loans (%)39.7 40.0 +30bps ●
Lending yield2 (bps) 411 388 -23 ●
Net Interest Income (€ m) 379 352 -27
Net Interest Margin (bps) 249 305 +56
Fee Income / Assets (bps) 30 43 +13 ●
Greece
2Q151 3Q173 Δ
# of employees (in 000s) 12.4 9.8 -2.6
Employee wage bill (€ m, ann.) 664 544 -120
Cost-to-Core income (%) 62 54 -8ppts
Greece
FY14A FY16A 3Q17A
CoR (bps) 270 212 198 ●
P&L charge (€ m, annualized) 1,000 683 604 ●

8 Corporate Presentation – December 2017
Remaining NPE reduction at €4.9b (€ b)
2017 NPE operational performance ahead of targets Parent NPE reduction targets (SSM perimeter) (€ b)
21.5
-3.5
-4.9 13.1
FY15 Done Remaining FY19
NPEs decline for a 6th quarter in a row adding up to a total reduction of €3.5b since
end 2015
Asset quality
• Operational targets submitted to the SSM contain a
reduction of NPLs and NPEs by €7.4b and €8.5b over the
period 2016-2019, equal to a reduction of c.50% and 40%
respectively; slight revision of targets relating to the timing
of reduction until 2019
• Upon achieving these targets in 2019, NPL and NPE ratios
will have been reduced by c.15ppts, with NPE coverage
around 50%
• Reduction of €3.5b so far, exceeding the 2017 target
15.2 15.3 15.0 15.0
14.0 13.913.6 13.6
12.9
7.7
6.4 0.0 6-0.9 5.6
-1.04.7
-0.9 4.7-0.2 4.6
-0.3 -0.2 0.1
5.0 5.4
21.5 21.5
20.6
19.618.7 18.5 18.2 18.0 18.1
13.1
-8.5
NPLs
NPEs
NPE reduction target
Total targeted:
-€8.5b
FY.17 target exceeded

9 Corporate Presentation – December 2017
1. Latest available data
NBG stands out in asset quality
Coverage
ratio
90dpd
ratio
TBV less
net NPLs
(€b)
TBV (€b)
Unprovided
NPLs (€b)
74% 70% 69%
66%
34%
36%37%
35%
NBG Peer 1 Peer 2 Peer 3
Peer Group1: 90dpd & Coverage (Group) Peer Group1: NPE & Coverage (Group)
56%45%
48%
52%
45%
55%54%
45%
NBG Peer 1 Peer 2 Peer 3
Coverage
ratio
NPE ratio
6.77.3
9.0
5.8
-3.8
-6.7-6.9
-5.8
NBG Peer 1 Peer 2 Peer 3
€2.8b €0.6b €2.1b -€0.1b
Peer Group1: net NPLs vs TBV (Group)

10 Corporate Presentation – December 2017
CET 1 ratio
Acceleration of divestiture plan enhances capital and liquidity substantially and
underlines NBG’s commitment to the successful implementation of the RP
Profitability
Divestments: latest developments
RWAs
(€ bn)39.0 38.5 38.5
16.5% 16.8% 16.6%
2Q17 3Q17 2017 Regulatory
Requirement
CRD IV fully
loaded
CET1:
€6.4bn
CET1:
€6.5bn
CET1:
8.75%
OCR:
12.25%
CET1:
€6.5bn
DTC:
€4.7b
• Ethniki Insurance closing expected in 1Q.18; impact
of: c110bps in capital and c€770m in liquidity
• Following the transaction NBG retains a 25% stake
along with an exclusive bancassurance agreement
• Vojvodjanska and NBG Leasing (Serbia) to close by
YE, Banca Romaneasca in early 2018; RWA
deconsolidation impact of c75bps in capital; liquidity
impact of c€1b

11 Corporate Presentation – December 2017
Selected digital and premium initiatives
Strong digital channels
Source: Company disclosureNotes: (1) Based on C.A.P.I. tracking study during the period April-June 2015*9M annualized
(2) Based on the sum of the four systemic banks
Technology and innovation provide new value added services
Overview
Deeply rooted customer relationships
Reputational excellence in Greece: “premium brand of choice”
Bank of reference in Greece for over 170 years
33%28%
22%17%
NBG Peer 1 Peer 2 Peer 3
33%
26%22%
19%
NBG Peer 1 Peer 2 Peer 3
Best Reputation (Survey) (1) Most Trustworthy (Survey)(1)
30.9% 30.6%
21.5%
17.0%
NBG Peer 1 Peer 2 Peer 3
Core deposit market share (3Q17)(2)
Total deposits/
branch€75.5m €62.2m €58.2m €60.6m
Modern and sophisticated bank offering premium cashless and digital
services
Strategic emphasis on developing and upgrading the i-bank platform
has resulted in significant transaction growth
Extensive e-banking platform with ancillary value adding services (e.g.
money transfers, share trading, payment of dues to tax authorities
and other companies and organizations)
Highly innovative i-bank store platform targeting young age groups
Premium banking provides a personalized service to the affluent
segment
Upgrading digital infrastructure a key priority
First full banking relationship loyalty program:
Number of customers at 175K
Wide network of participating merchants including super markets, gas stations and department stores
14.7m 17.6m
Electronic transactions
28.9m
870K
1,123K
1,340K
1,549K
2014 2015 2016 9M17
€25.0bn €25.8bn
€40.3bn
€50.8bn
2014 2015 2016 9M17*
35.6m
E-banking users

Financial Highlights
2

13 Corporate Presentation – December 2017
NPE reduction continues, ELA disengagement is imminent, agreed capital actions
to provide a buffer against regulatory exercises
Liquidity, Asset Quality & Capital Highlights Key Ratios - Group
9M17 1H17 1Q17 9M16
Liquidity
Loans-to-Deposits ratio 83% 86% 87% 89%
ELA exposure (€ bn) 2.3 3.8 5.6 5.2
Profitability
NIM (bps) 307 306 302 280
Cost-to-Core income 51% 50% 49% 55%
Asset quality
NPE ratio 45.2% 45.0% 44.9% 46.6%
NPE coverage ratio 55.9% 55.7% 56.0% 55.5%
Cost of Risk (bps) 238 260 278 189
Capital
CET1 phased-in 16.8%1 16.5%1 16.0%2 16.4%3
CET1 ratio CRD IV FL 16.6%1 16.3%1 15.8%2 15.9%3
RWAs (€ bn) 38.51 39.01 41.32 40.33
Highlights
Domestic NPE stock reduction continues for a 6th consecutive quarter
• NPE reduction continues in 3Q17, with the stock reduced by €0.2b, reflecting
negative formation of €119m and fully provided write offs of €105m
• Net NPE reduction achieved since end-2015 at €3.5b, exceeding the FY.17 SSM
target
• Group NPE and NPL coverage at sector leading levels (56% and 74%), combined
with the lowest NPL and NPE levels among domestic banks
ELA close to elimination
• ELA exposure reduced by €2.8b since 2Q17, standing at €1.0b in October ‘17
• 1st covered bond transaction since 2009 completed in October, raising €750m at a
yield of 2.90%; 85% of the issue was covered from international investors
• Short term completion of agreed capital transactions of Ethniki Insurance, Banca
Romanesca and Vodvodjanska to provide an additional €1.7b in liquidity
• Superior liquidity position and lowest funding cost among local peers, imply NBG is
best positioned to satisfy future corporate credit demand
CET 1 ratio at 16.8% or 16.6% on a CRD IV FL basis
• Group RWAs at €38.5b of which €34.4b in Greece
• Agreed capital actions expected to complete by early 2018, providing additional
capital buffer ahead of upcoming regulatory exercises
1. Excludes the impact from the agreed sales of S.A.B.A., Ethniki Insurance, Banca Romaneasca and Vojvodjanska Banka
2. Excludes the impact from the agreed sales of UBB, Interlease & S.A.B.A.
3. Excludes CoCos

14 Corporate Presentation – December 2017
€ m 9M17 9M16 YoY 3Q17 2Q17 QoQ
NII 1 193 1 252 -5% 378 405 -7%
Net Fees & Commissions 176 123 +43% 57 59 -4%
Core Income 1 369 1 375 -0% 435 464 -6%
Trading & other income (155) (96) +61% (81) (73) +11%
Income 1 214 1 279 -5% 354 391 -9%
Operating Expenses (701) (762) -8% (238) (232) +3%
Core PPI 667 613 +9% 196 232 -15%
PPI 513 517 -1% 116 159 -27%
Provisions (589) (487) +21% (156) (200) -22%
Operating Profit (77) 30 n/m (40) (41) -3%
Other impairments (4) (59) -93% 2 (1) n/m
PBT (81) (29) >100% (38) (42) -10%
Taxes (23) (11) >100% (6) (10) -41%
PAT (cont. ops) (104) (40) >100% (44) (52) -16%
PAT (discont. ops) (48) (2 891) -98% 19 (97) n/m
Minorities (26) (28) -6% (10) (7) +42%
PAT1 (178) (2 959) -94% (35) (156) -78%
P&L Highlights
1. 9m.17 PAT incorporates a capital loss of €94m and €56m form the agreed sales of the Romanian and Serbian
businesses which have not yet completed. Upon completion capital will benefit from RWA deconsolidation.
9m17 Group core PPI increases by +9% yoy; Q317 provisions level off
Highlights
Group P&L
9m17 group PPI at €513m, flat yoy, on the back of:
• Flat group core income reflecting sustained deleveraging offset by
lower funding costs
• Lower group OpEx (-8% yoy equal to c€60m yoy)
• Increased non core income losses of €155m in 9m.17
More specifically in 3Q:
• NII down by 7% qoq or -€27m qoq, reflects continuing deleverage of
the loan portfolio, as well as reducing exposure to high yielding GGBs
• Net fees and commissions (-4% qoq) are up +43% yoy in the 9m,
benefitting from the elimination of Pillar funding costs and a pick up in
retail and other banking related fee income
• Group OpEx reduction (-8.0% yoy), is driven by domestic personnel
costs (-12.4% yoy), reflecting the 2016 VES
• Domestic credit risk charges are down by 24% qoq, but remain
conservative with a CoR ratio of 198bps; NPE coverage increases by
40bps qoq to 56.6%, the highest among domestic peers

Profitability
3

16 Corporate Presentation – December 2017
231 269 241
-189 -238 -192
9M16 9M17 3Q17
Group Core Operating margin1 (bps)
Group Core PPI bridge (€ m)Group Core PPI decomposition by region (€ m)
1. Core PPI margin and CoR are calculated over net loans
9m17 domestic core PPI +10% yoy, as funding cost benefits and cost savings
outweigh NII pressure
Profitability
198220
185
573
633
1312
11
40
34
211232
196
613
667
3Q16 2Q17 3Q17 9M16 9M17
GRE SEE & Other
613
-60
+53
+61 667
9M16 ΔNII Δfees ΔOpEx 9M17
Group Core
PPI margin
Group
CoR
+10.5%
-14.1%
YoY
42 31 49Group Core
operating
margin
-6.6%
-15.4%
YoY
NII drop reflects mainly
sustained deleveraging
and lower NPL accruals
partially offset by NII
funding cost benefits
On lower NII due to
GGBs (-€14m)
o/w: P2
funding
benefit
€42m

17 Corporate Presentation – December 2017
SEE & Other
Greece
389 383 384 379 352
282 287300 309 305
3Q16 4Q16 1Q17 2Q17 3Q17
NII (€m) NIM (bps)
Domestic NIM maintained north of 300bps
Profitability
Evolution of domestic net loans (€ b)
Domestic NII breakdown
31.9
-0.8 -0.1 -0.2 -0.5
30.3
9M16 Mortgages Consumer SBLs Corporate 9M17
28 23 26 26 26
345
299
338 340 339
3Q16 4Q16 1Q17 2Q17 3Q17
NII (€m) NIM (bps)
3Q16 4Q16 1Q17 2Q17 3Q17 9M16 9M17
Loans 379 361 370 352 339 1,157 1,061
Deposits -44 -40 -37 -37 -36 -144 -110
Bonds 79 81 81 88 74 247 243
Eurosystem
& wholesale-18 -18 -21 -20 -15 -94 -56
Subs &
other-7 -1 -9 -5 -8 2 -21
Total 389 383 384 379 352 1,168 1,116
Reduction of c.€1.6b
in eop net balances in
12months

18 Corporate Presentation – December 2017
17.7 18.0 17.8 17.9 18.1
7.2 7.6 7.0 7.2 7.5
11.1 11.3 11.3 11.1 11.1
36.036.8 36.1 36.2 36.7
3Q16 4Q16 1Q17 2Q17 3Q17
Time
Sight &
other
Savings
+1.3% qoq
Greek deposit yields (bps)
2018 17 17
14
103
95
89 89 90
4744
41 40 39
3Q16 4Q16 1Q17 2Q17 3Q17
Domestic deposits pick up by €0.5b qoq, while time deposit yields bottom out
Profitability
Greek deposits evolution (€ b)
Time
Total
New production
yield
at c75 bps
69% 69% 69% 69% 68% Core deposits/total
Mkt share 37%,
+1.0 ppts yoy
Core

19 Corporate Presentation – December 2017
Greek lending yields1 (bps)
256 257 255 256 254
947933 932 934 935
648 643631 627 625
414403 404 398 390
3Q16 4Q16 1Q17 2Q17 3Q17
1: Calculated on performing loans including FNPEs<90dpd
2: Performing loans derived after deducting 90dpd loans
Domestic deleveraging continues, driven mainly be retail exposures; lending yields
are down slightly but remain at high levels supporting NIM at a +300bps level
Profitability
Greek loan evolution (€ b)
11.7 11.5 11.2 11.0 10.9
2.3 2.3 2.2 2.2 2.2
1.4 1.4 1.4 1.4 1.3
12.6 13.0 13.0 12.8 12.5
28.0 28.2 27.8 27.4 26.9
3Q16 4Q16 1Q17 2Q17 3Q17
Corporate
SBL
Consumer
Mortgages
Consumer
SBLs
Corporate
Mortgages
Total lending yield (bps)
-1.8% qoq
31.9 31.7 31.3 30.8 30.3 Net loans
Performing loans2
402 396 395 393 388

20 Corporate Presentation – December 2017
21 20 21
64 6821 23 20
6465
814 11
27
35
5057
53
155
167
3Q16 2Q17 3Q17 Column1 9M16 9M17
Fund
mgm,
Brokerage
& other
Wholesale
Banking
Fees
Retail
Banking
Fees
5057 53
155167
66
6
13
13
5663
59
168
180
3Q16 2Q17 3Q17 Column1 9M16 9M17
Group fee income by region excl. ELA fees (€ m)
9m17 domestic fee income up by +8% yoy, driven by retail and other banking
related fee income; including PII fee impact, fees are up by +52% yoy
Profitability
Domestic fee decomposition excl. ELA fees (€ m)
Fees/Assets1
Total
SEE &
Other
0.31%
Greece+5%
0.38%0.38%
YoY
+28%
+8%
+2%
0.31%
-1%
YoY
+34%
+5%
-2%
0.38%
+8%
YoY
+0%
+7%
+5%
YoY
+0%
+4%
1: Excluding assets held for sale
ELA cost6 23 51 9 ELA cost 6 23 51 9

21 Corporate Presentation – December 2017
55%
50%
54%
9M16 9M17 3Q17
Domestic OpEx evolution (€ m)
Group OpEx by category (€ m)
9m17 personnel costs decline 12% yoy, leading total costs down by 9% yoy and
cost-to-core income to 50%
Profitability
Headcount evolution (‘000)
Domestic cost-to-core income evolution
Greece Group
9M17 9M16 yoy 9M17 9M16 Yoy
Personnel 399 455 -12.4% 433 489 -11.5%
G&As 175 179 -2.0% 198 203 -2.2%
Depreciation 66 66 +0.2% 70 70 +0.1%
Total 640 700 -8.6% 701 762 -8.0%
154 147 131 132 136
82 8879 81 82
237 235210 213 217
3Q16 4Q16 1Q17 2Q17 3Q17
15.012.2 12.0
9.9 9.9 9.8 9.8
10.1
7.9 7.8
1.9 1.9 2.0 2.0
25.1
20.1 19.8
11.8 11.8 11.8 11.8
FY09 1 FY14 FY15 FY16 1Q17 2Q17 3Q17
G&A &
other
Staff
SEE &
Other
Greece
1. Excludes Ethniki Insurance Company, UBB, BROM & Vojvo employees
111 1
€2.5m one off
due to employee
promotions

Asset quality
4

23 Corporate Presentation – December 2017
15.3 14.4 14.3 13.9 13.9
4.84.8 4.7 4.8 4.6
20.119.2 19.0 18.7 18.5
3Q16 4Q16 1Q17 2Q17 3Q17
FNPEs & other
impaired
90dpd
Domestic NPE stock evolution (€ b)
Domestic NPE stock movement (€ b)Domestic NPE stock per category – 3Q17 (€ b)
Despite low write offs in 3Q, negative formation of -€119m allows the NPE stock to
keep declining
Asset quality
46.4% 45.1% 45.1% 45.2% 45.3%NPE ratio
5.6
2.3 2.2
3.8
1.5
0.3 0.3
2.5
7.0
2.6 2.5
6.3
Mortgages Consumer SBL Corporate
FNPE & other
impaired
90dpd
13.9
18.5
22.0
-0.6-0.3
21.1
-0.7-0.2
20.1
-0.2-0.7
19.2+0.04
-0.2
19.0
-0.01-0.3
18.7
-0.1 -0.1
18.5
+4bps reported
basis,
-59bps qoq ex
deleveraging

24 Corporate Presentation – December 2017
Mortgages (€ m)
* SSM perimeter
Asset quality
NPE formation remains negative in 3Q17, improving to -€119m qoq
Consumer (€ m) NPE formation* (€ m)
SBLs (€ m) Corporate (€ m)
-609
-131
66 43 30
3Q16 4Q16 1Q17 2Q17 3Q17
-101
-50 -34-42 -20
3Q16 4Q16 1Q17 2Q17 3Q17
-81
-4
925
-12
3Q16 4Q16 1Q17 2Q17 3Q17
32
-20
13
-40
-116
3Q16 4Q16 1Q17 2Q17 3Q17-759
-205
54
-14
-119
3Q16 4Q16 1Q17 2Q17 3Q17
25 Corporate Presentation – December 2017
Mortgages (€ m)
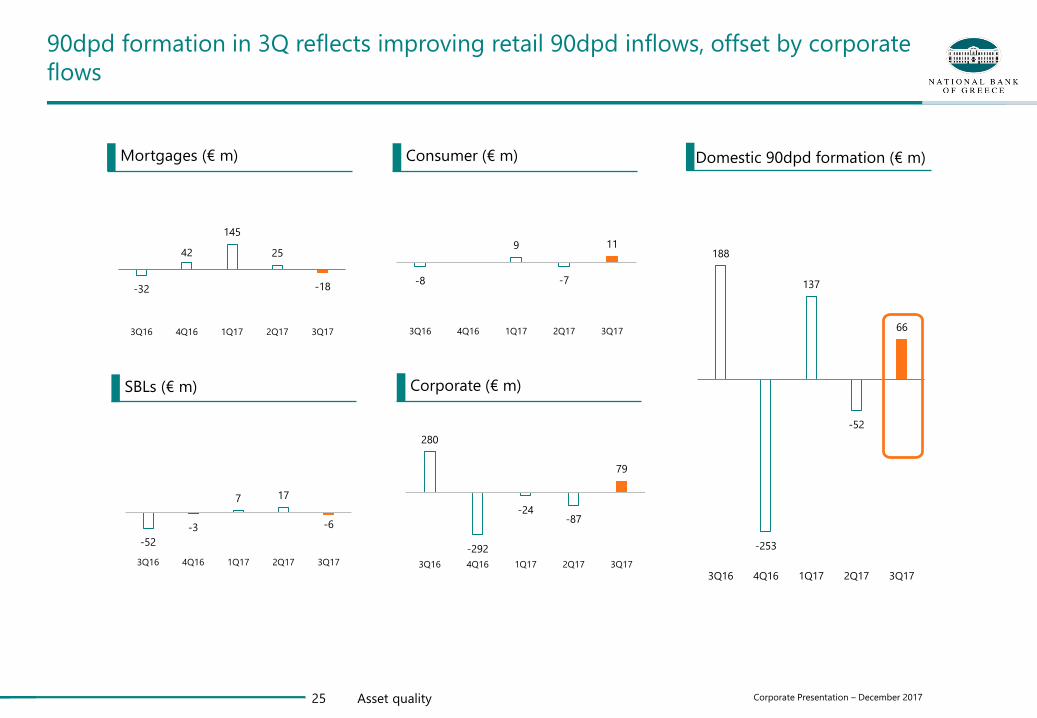
Asset quality
90dpd formation in 3Q reflects improving retail 90dpd inflows, offset by corporate
flows
Consumer (€ m) Domestic 90dpd formation (€ m)
SBLs (€ m) Corporate (€ m)
-32
42
145
25
-18
3Q16 4Q16 1Q17 2Q17 3Q17
-8
0 9
-7
11
3Q16 4Q16 1Q17 2Q17 3Q17
-52
-3
7 17
-6
3Q16 4Q16 1Q17 2Q17 3Q17
280
-292
-24-87
79
3Q16 4Q16 1Q17 2Q17 3Q17
188
-253
137
-52
66
3Q16 4Q16 1Q17 2Q17 3Q17
26 Corporate Presentation – December 2017
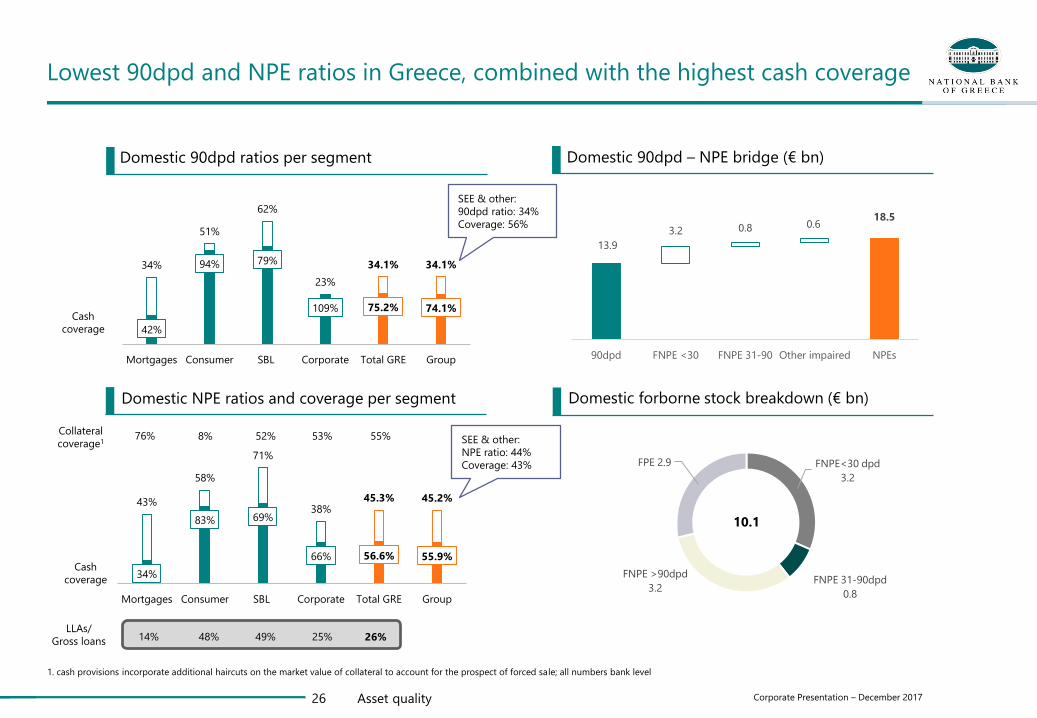
Domestic NPE ratios and coverage per segment
Domestic 90dpd ratios per segment
1. cash provisions incorporate additional haircuts on the market value of collateral to account for the prospect of forced sale; all numbers bank level
Lowest 90dpd and NPE ratios in Greece, combined with the highest cash coverage
Asset quality
Domestic forborne stock breakdown (€ bn)
Domestic 90dpd – NPE bridge (€ bn)
Cash
coverage
Cash
coverage
14% 48% 49% 25% 26%LLAs/
Gross loans
13.9
3.2 0.8 0.618.5
90dpd FNPE <30 FNPE 31-90 Other impaired NPEs
42%
94% 79%
109% 75.2% 74.1%
34%
51%
62%
23%
34.1% 34.1%
Mortgages Consumer SBL Corporate Total GRE Group
34%
83% 69%
66% 56.6% 55.9%
43%
58%
71%
38%45.3% 45.2%
Mortgages Consumer SBL Corporate Total GRE Group
FNPE<30 dpd
3.2
FNPE 31-90dpd
0.8
FNPE >90dpd
3.2
FPE 2.9
10.1
Collateral
coverage176% 8% 52% 53% 55%
SEE & other:
90dpd ratio: 34%
Coverage: 56%
SEE & other:
NPE ratio: 44%
Coverage: 43%
27 Corporate Presentation – December 2017
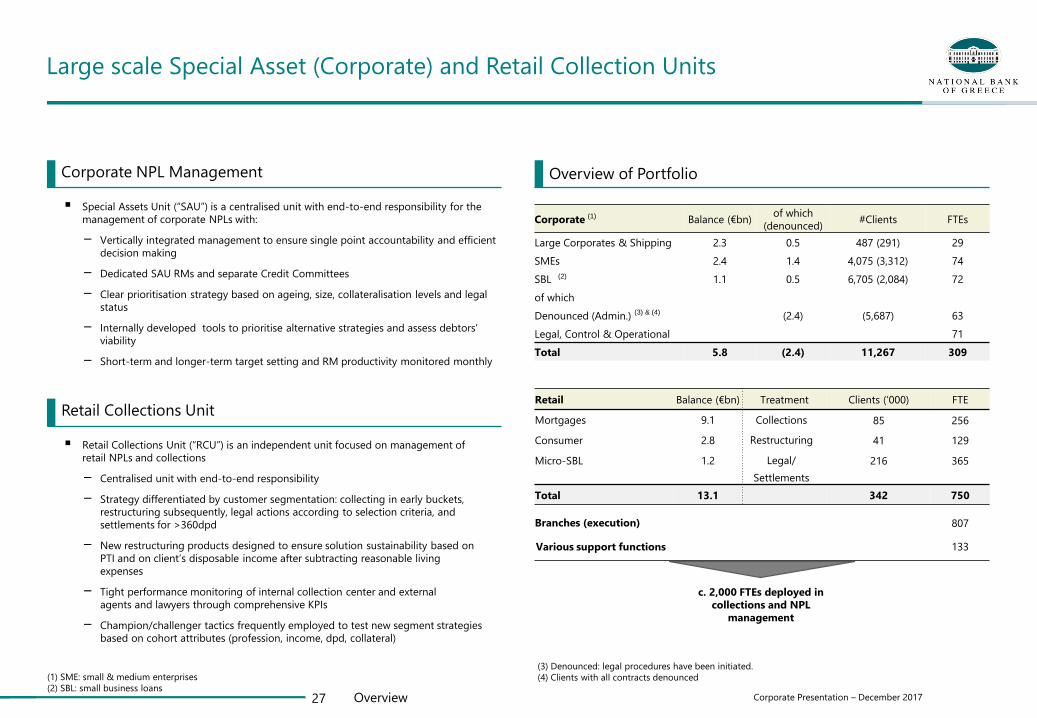
Large scale Special Asset (Corporate) and Retail Collection Units
Corporate NPL Management
Special Assets Unit (“SAU”) is a centralised unit with end-to-end responsibility for the
management of corporate NPLs with:
− Vertically integrated management to ensure single point accountability and efficient
decision making
− Dedicated SAU RMs and separate Credit Committees
− Clear prioritisation strategy based on ageing, size, collateralisation levels and legal
status
− Internally developed tools to prioritise alternative strategies and assess debtors’
viability
− Short-term and longer-term target setting and RM productivity monitored monthly
Overview of Portfolio
Retail Collections Unit
Retail Collections Unit (“RCU”) is an independent unit focused on management of
retail NPLs and collections
− Centralised unit with end-to-end responsibility
− Strategy differentiated by customer segmentation: collecting in early buckets,
restructuring subsequently, legal actions according to selection criteria, and
settlements for >360dpd
− New restructuring products designed to ensure solution sustainability based on
PTI and on client’s disposable income after subtracting reasonable living
expenses
− Tight performance monitoring of internal collection center and external
agents and lawyers through comprehensive KPIs
− Champion/challenger tactics frequently employed to test new segment strategies
based on cohort attributes (profession, income, dpd, collateral)
Retail Balance (€bn) Treatment Clients (‘000) FTE
Mortgages 9.1 Collections 85 256
Consumer 2.8 Restructuring 41 129
Micro-SBL 1.2 Legal/ 216 365
Settlements
Total 13.1 342 750
Branches (execution) 807
Various support functions 133
c. 2,000 FTEs deployed in
collections and NPL
management
(1) SME: small & medium enterprises
(2) SBL: small business loansOverview
Corporate Balance (€bn)of which
(denounced)#Clients FTEs
Large Corporates & Shipping 2.3 0.5 487 (291) 29
SMEs 2.4 1.4 4,075 (3,312) 74
SBL 1.1 0.5 6,705 (2,084) 72
of which
Denounced (Admin.) (2.4) (5,687) 63
Legal, Control & Operational 71
Total 5.8 (2.4) 11,267 309
(1)
(3) Denounced: legal procedures have been initiated.
(4) Clients with all contracts denounced
(3) & (4)
(2)

Liquidity
5

29 Corporate Presentation – December 2017Liquidity
17.6
1
3.2
3.3
2.25
1.969
2.291.3
1.1
0.7410.8
0.4 0.1 0.85
ELA June 2015 Divestment
Plan
Net Loans Net Intragroup
Funding
Net Interbank
Repos
(Corellated)
Net Deposits Net Bond
Redemptions
Waiver
Reinstatement
Net Cash Recapitalization Cash Collateral Other Covered Bond
Maturity
ELA October
2017
ELA reduction – Key items (all amounts in €bn and cash equivalents)
10.0 10.012.5 11.8
8.9 8.2 6.74.6 4.6 3.7
17.615.6 11.5
11.0
6.1 5.1
5.6
5.6 3.8
1
0.9
4.03.8 4.7
5.2
4.4
2.7
27.6
25.624 23.7
1917.1 17
15.4
12.8
7.4
Dec-15 Mar-16 Jun-16 Sep-16 Dec-16 Mar-17
ECB
ELA
Interbank
Eurosystem and Interbank funding evolution (all amounts in €bn and cash equivalents)
Waiver
Reinstatement
Pillars
cancellation
Collateral
optimization Interbank funding
-4,0bn Eurosystem
exposure Sinepia
+0,3bn cash
Correlated assets
repos
-1,2bn Eurosystem
exposure
Jun-17Sep-15Jun-15
Increase of
correlated assets
repos
Oct-17
Total Eurosystem exposure reduced by c. €20b; ELA reduced by c. €16b; on the back of the
divestment plan, interbank access and deleveraging

30 Corporate Presentation – December 2017
Peer group analysis: liquidity position (Group)
1: Excl. EFSF & ESM bonds
2: Estimated based on latest available funding balances & yields
3: Peer average data excluding NBG, based on latest available data
Best in class liquidity and lowest cost of funding place NBG at an advantageous
position vs peers to satisfy demand for credit from healthy corporates
Liquidity
NBG domestic deposit flows per quarter (€ b)
-2.2
-4.8-3.6
0.3 0.8
-0.9
0.0 0.3 0.9
-0.8
0.2 0.5
4Q14 1Q15 2Q15 3Q15 4Q15 1Q16 2Q16 3Q16 4Q16 1Q17 2Q17 3Q17
-€10.6 b +€1.3 b
Peer Group: Domestic funding cost2
0.47%0.56%
0.66% 0.63%
NBG Peer 1 Peer 2 Peer 3
91% 91% 89%86% 87% 85%
83%
141% 138%134%
130% 130% 128%124%
1Q16 2Q16 3Q16 4Q16 1Q17 2Q17 3Q17
Peer domestic
L:D ratio3
NBG Greece
L/D ratio
provides
upside for
selective
credit
growth
Domestic L:D ratio evolution
1.0
6.07.3 7.5
NBG Peer 1 Peer 2 Peer 3
2% 12%12%9%ELA/
Assets1

Macro
6
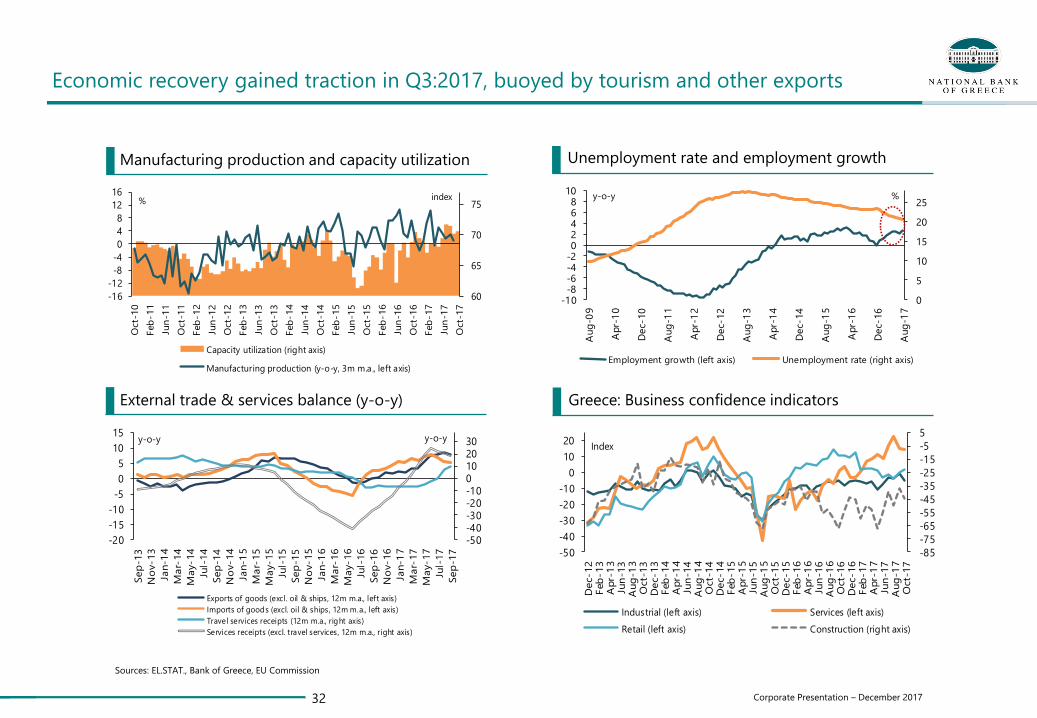
32 Corporate Presentation – December 2017
Sources: EL.STAT., Bank of Greece, EU Commission
60
65
70
75
-16
-12
-8
-4
0
4
8
12
16
Oct-
10
Feb
-11
Jun
-11
Oct-
11
Feb
-12
Jun
-12
Oct-
12
Feb
-13
Jun
-13
Oct-
13
Feb
-14
Jun
-14
Oct-
14
Feb
-15
Jun
-15
Oct-
15
Feb
-16
Jun
-16
Oct-
16
Feb
-17
Jun
-17
Oct-
17
Capacity utilization (right axis)
Manufacturing production (y-o-y, 3m m.a., left axis)
% index
-85
-75
-65
-55
-45
-35
-25
-15
-5
5
-50
-40
-30
-20
-10
0
10
20
Dec-12
Feb
-13
Apr-
13
Jun
-13
Aug
-13
Oct-
13
Dec-13
Feb
-14
Apr-
14
Jun
-14
Aug
-14
Oct-
14
Dec-14
Feb
-15
Apr-
15
Jun
-15
Aug
-15
Oct-
15
Dec-15
Feb
-16
Apr-
16
Jun
-16
Aug
-16
Oct-
16
Dec-16
Feb
-17
Apr-
17
Jun
-17
Aug
-17
Oct-
17
Industrial (left axis) Services (left axis)
Retail (left axis) Construction (right axis)
Index
Greece: Business confidence indicators
Economic recovery gained traction in Q3:2017, buoyed by tourism and other exports
External trade & services balance (y-o-y)
Unemployment rate and employment growth
0
5
10
15
20
25
-10-8-6-4-202468
10
Aug
-09
Apr-
10
Dec-
10
Aug
-11
Apr-
12
Dec-
12
Aug
-13
Apr-
14
Dec-
14
Aug
-15
Apr-
16
Dec-
16
Aug
-17
Employment growth (left axis) Unemployment rate (right axis)
%y-o-y
-50-40-30-20-100102030
-20
-15
-10
-5
0
5
10
15
Sep
-13
No
v-13
Jan-1
4
Mar-
14
May-14
Jul-
14
Sep
-14
No
v-14
Jan-1
5
Mar-
15
May-15
Jul-
15
Sep
-15
No
v-15
Jan-1
6
Mar-
16
May-16
Jul-
16
Sep
-16
No
v-16
Jan-1
7
Mar-
17
May-17
Jul-
17
Sep
-17
Exports of goods (excl. oil & ships, 12m m.a., left axis)
Imports of goods (excl. oil & ships, 12m m.a., left axis)
Travel services receipts (12m m.a., right axis)
Services receipts (excl. travel services, 12m m.a., right axis)
y-o-y y-o-y
Manufacturing production and capacity utilization

33 Corporate Presentation – December 2017
2
5
8
11
14
1000
1500
2000
2500
3000
3500
Jun
-15
Jul-
15
Aug
-15
Sep
-15
Oct-
15
No
v-15
Dec-15
Jan-1
6Feb
-16
Mar-
16
Apr-
16
May-16
Jun
-16
Jul-
16
Aug
-16
Sep
-16
Oct-
16
No
v-16
Dec-16
Jan-1
7Feb
-17
Mar-
17
Apr-
17
May-17
Jun
-17
Jul-
17
Aug
-17
Sep
-17
Oct-
17
No
v-17*
FTSE/ATHEX Large Cap (left axis)
10yr Greek Government bond yield (right axis)
Greek non-financial corp. bond yield (BoG Composite Index, right axis)
index %
*as of November 20, 2017
3rd
MoUCap
ital c
on
tro
ls
The fiscal performance remains solid and increasing credibility is gradually factoring into
financial market conditions
Greece: Gen. Gov. Primary balance (as % of GDP) State budget Primary balance (as % of GDP)
Greek Sovereign, corporate bond yields & stock market
-9
-6
-3
0
3
6
-9
-6
-3
0
3
6
Jan
Feb
Mar
Apr
May Jun
Jul
Aug
Sep
Oct
Nov
Dec
2009 2010 2012 2013
2014* 2015* 2016* 2017*
% GDPsurplus
deficit
*excluding SMP &
ANFA revenue
4,6
4,8
5,0
5,2
5,4
5,6
5,8
6,0
2,2
2,6
3,0
3,4
3,8
4,2
4,6
25/9
/20
17
29/9
/20
17
3/1
0/2
01
7
7/1
0/2
01
7
11/1
0/2
017
15/1
0/2
017
19/1
0/2
017
23/1
0/2
017
27/1
0/2
017
31/1
0/2
017
4/1
1/2
01
7
8/1
1/2
01
7
12/1
1/2
017
16/1
1/2
017
20/1
1/2
017
5yr GGB (left axis) 2yr GGB (left axis)
6m T-bill (left axis) 10yr GGB (right axis)
%%
-16
-12
-8
-4
0
4
-16
-12
-8
-4
0
4
200
9
201
0
201
1
201
2
201
3
201
4
201
5
201
6
201
7e
201
8f
Gen.Gov. total balance Gen.Gov. primary balance
Primary balance (Programme target) Primary balance (Budget 2018)
% GDP
Greek Sovereign bond yields
Sources: EL.STAT., Greek MinFin, Bloomberg, PDMA, EU Commission

34 Corporate Presentation – December 2017
Consumer confidence & household income
The economic recovery will be supported in the near term by higher public investment and an
improving corporate performance, but the adjustment of households and less competitive
firms remains slow. Residential and commercial real estate prices are stabilizing
Real estate prices (y-o-y)
Households assessment of economic conditions
-110
-90
-70
-50
-30
-10
-105-100
-95-90-85-80-75-70-65-60
Q3:2
007
Q1:2
008
Q3:2
008
Q1:2
009
Q3:2
009
Q1:2
010
Q3:2
010
Q1:2
011
Q3:2
011
Q1:2
012
Q3:2
012
Q1:2
013
Q3:2
013
Q1:2
014
Q3:2
014
Q1:2
015
Q3:2
015
Q1:2
016
Q3:2
016
Q1:2
017
Q3:2
017
Intention for home improvements (left axis)
Intention to purchase or build a home (left axis)
Financial situation over the next 12 months (right axis)
Index
IndexConsumer Survey data
-16
-12
-8
-4
0
4
-16
-12
-8
-4
0
4
H1
:200
9
H2
:200
9
H1
:201
0
H2
:201
0
H1
:201
1
H2
:201
1
H1
:201
2
H2
:201
2
H1
:201
3
H2
:201
3
H1
:201
4
H2
:201
4
H1
:201
5
H2
:201
5
H1
:201
6
H2
:201
6
H1
:201
7
Q3:2
017
Office prices (Athens, y-o-y) Retail prices (Athens, y-o-y)
House prices (total, y-o-y)
y-o-y
2017Q3: -0.6% yoy
0,0
0,5
1,0
1,5
2,0
2,5
3,0
Q2:2
016
Q3:2
016
Q4:2
016
Q1:2
017
Q2:2
017
Q3:2
017
Q4:2
017
Payments for arrears clearance (incl. tax refunds, % GDP)
Public investment budget expenditure (% GDP)
as % of GDP
-75
-70
-65
-60
-55
-50
-45
-40
-10
-8
-6
-4
-2
0
2
4
200
9
201
0
201
1
201
2
201
3
201
4
201
5
201
6
201
7e*
Household disposable income (left axis)
Consumer confidence (total, right axis)
y-o-y index
*2017: Ameco & NBG estimates
Oct: -54
Sources: EL.STAT., Greek MinFin, EU Commission, Bank of Greece, Ameco & NBG estimates
Government arrears clearance and public investment
Appendix I
7

36 Corporate Presentation – December 2017
Capital controls framework
• 100% of cash deposited after 22.07.16 can be withdrawn
• €840 equivalent per fortnight per customer (applicable up to
31.08.2017)
• €1.800 equivalent per month per customer (applicable from
1.09.2017)
• Allowed for existing (as of 11.03.16) customers
• Subject to specific criteria, e.g. primary payroll account, for new
customers
• Private individuals can transfer up to €1,000 per month
• Allowed
• Allowed
• Allowed
• Proceeds can be re-invested
• Prohibited when changing to foreign custodian
• Allowed
• < €350k approval at bank level
• Weekly limit for bank-level committee at €112mn
• > €350k approval by the Banking Transactions Approval
Committee
Cash
withdrawal
limit
New account
opening
• Allowed for existing (as of 11.03.16) customers
• Prohibited for new customers
Additional
account
beneficiary
• 100% of incoming funds can be re-transferred abroad
• 10% of incoming funds received before 22.07.16 can be withdrawn
• 30% of incoming funds received between 22.07.16 and 31.08.17
can be withdrawn
• 50% of incoming funds received after 01.09.2017 can be withdrawn
Transfers from
abroad
Outgoing wire
transfers
abroad
Time deposit
break
Purchase of
Greek mutual
funds
Greek capital
market
instruments
Foreign
investments
liquidation
Change of
Custodian Bank
Trade related
payments
Early loan
repayment
Appendix I

37 Corporate Presentation – December 2017
Evolution of RWAs (€ b)
Overview
RWA Evolution | Asset-liability mix
Asset mix (€ b) Liability mix (€ b)
Other,
13.5
DTA, 4.9
SEE & Other net
loans, 2.0
Domestic net
loans; 30.3
EFSF/ESM
bonds; 2.0
Securities;
10.1
Interbank
placements; 1.9Cash; 1.2
65.8
Assets
Total equity and
minorities; 6.8
Other Liabilities;
10.0
Debt securities;
0.5
SEE & Other
deposits; 2.1
Time & Other;
11.1
Current & Sight;
7.5
Savings; 18.1
ELA, 2.3ECB, 3.8
Interbank liabilities,
3.8
65.8
Liabilities
Domestic
deposits 36.0
61.8
-20.7
41.1
-2.6
38.5
-5.0
RWAs
2015
RWAs
2016
RWAs
9M17
Planned
Divestments

38 Corporate Presentation – December 2017
NBG is the first bank that has repaid State aid
Source: Latest company filings
Outstanding Outstanding Outstanding Outstanding
Pillar I (State Preference Shares)
Pillar II
(State Guaranteed Bonds)
Pillar III
(Greek Government Bonds)
CoCos not issued not issued
: outstanding
: repaid
Appendix I
39 Corporate Presentation – December 2017Appendix I
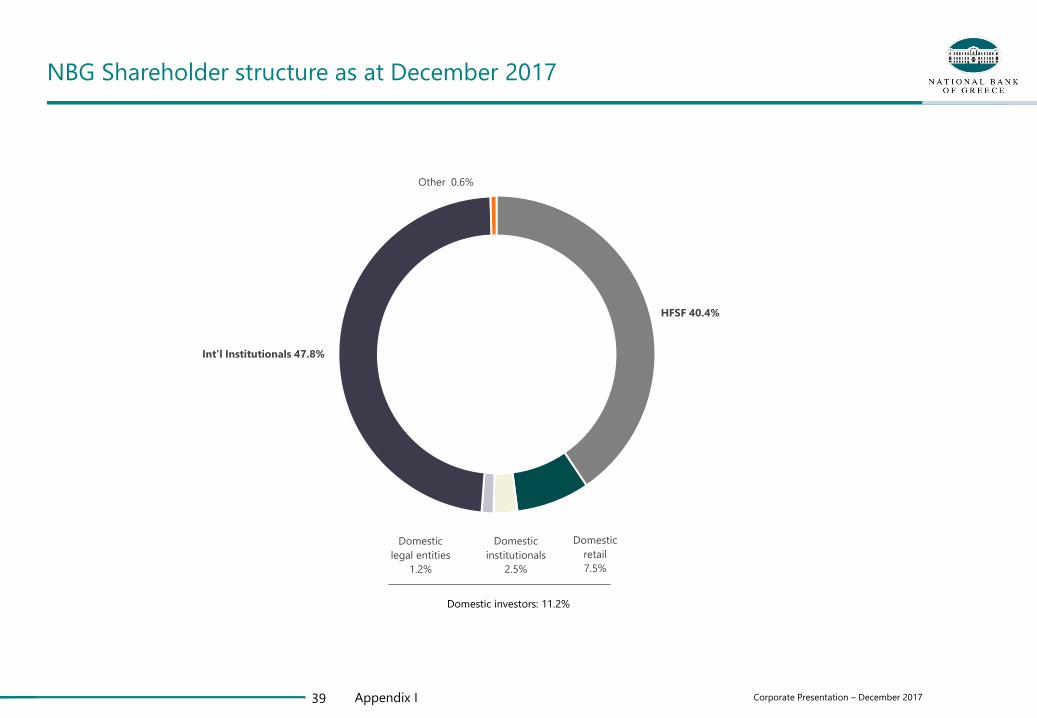
NBG Shareholder structure as at December 2017
HFSF 40.4%
Domestic
retail
7.5%
Domestic
institutionals
2.5%
Domestic
legal entities
1.2%
Int'l Institutionals 47.8%
Other 0.6%
Domestic investors: 11.2%

Appendix II: Financials

41 Corporate Presentation – December 2017
Balance Sheet | Group
Group Balance Sheet & P&L
P&L | Group
€ m 3Q17 2Q17 1Q17 4Q16 3Q16
Cash & Reserves 1 208 1 231 1 218 1 182 1 187
Interbank placements 1 886 2 032 1 975 2 087 2 554
Securities 12 043 15 369 16 679 18 530 19 921
Loans (Gross) 43 174 43 749 44 482 45 046 45 837
Provisions (10 900) (10 968) (11 176) (11 301) (11 867)
Goodwill & intangibles 123 123 115 117 113
Tangible assets 1 076 1 085 1 114 1 111 1 107
DTA 4 917 4 917 4 918 4 918 4 917
Other assets 6 506 6 654 6 772 7 458 8 305
Assets held for sale 5 810 5 681 9 459 9 382 9 669
Total assets 65 843 69 873 75 557 78 531 81 742
Interbank liabilities 9 855 13 945 16 522 18 167 17 753
Due to customers 38 795 38 324 38 132 38 924 38 071
Debt securities 461 523 550 663 1 508
Other liabilities 5 182 5 564 5 862 6 322 7 746
Hybrids - - - - -
Liabilities held for sale 4 122 4 095 6 889 6 870 6 857
Minorities 669 660 689 680 708
Equity 6 757 6 762 6 913 6 909 9 099
Total liabilities and
equity65 843 69 873 75 557 78 531 81 742
Appendix
€ m 3Q17 2Q17 1Q17 4Q16 3Q16
NII 378 405 410 406 417
Net fees 57 59 60 56 51
Core Income 435 464 470 462 468
Trading & other income1 (81) (73) (1) 104 (27)
Income 354 391 469 566 441
Operating Expenses (238) (232) (231) (255) (257)
Core Pre-Provision Income 196 232 239 208 211
Pre-Provision Income 116 159 238 311 184
Provisions (156) (200) (233) (210) (161)
Operating Profit (40) (41) 5 101 23
Other impairments 2 (1) (6) (28) (15)
PBT (38) (42) (1) 74 8
Taxes (6) (10) (7) (9) (6)
PAT (cont. ops) (44) (52) (8) 65 2
PAT (discount. ops) 19 (97) 30 7 21
Minorities (10) (7) (9) 1 (7)
PAT (35) (156) 13 73 16
1. 4Q16 includes €150m gain from the sale of Astir Pallas,

42 Corporate Presentation – December 2017
Greece
Regional P&L: Greece, SEE & other
Appendix
SEE & Other
€ m 3Q17 2Q17 1Q17 4Q16 3Q16
NII 352 379 384 383 389
Net fees 51 53 54 50 45
Core Income 403 432 439 433 434
Trading & other income1 (81) (71) (1) 99 (27)
Income 322 361 438 532 407
Operating Expenses (217) (213) (210) (235) (237)
Core Pre-Provision Income 185 220 228 198 198
Pre-Provision Income 104 149 228 297 171
Provisions (151) (199) (232) (200) (162)
Operating Profit (47) (51) (4) 96 9
Other impairments 3 0 (6) (27) (15)
PBT (44) (50) (10) 70 (6)
Taxes (5) (8) (5) (7) (4)
PAT (cont. ops) (49) (58) (15) 62 (10)
PAT (discount. ops) 18 22 12 14 4
Minorities (10) (7) (9) 2 (7)
PAT (40) (43) 12 77 12
€ m 3Q17 2Q17 1Q17 4Q16 3Q16
NII 26 26 26 23 28
Net fees 6 6 6 6 6
Core Income 32 32 32 30 34
Trading & other income (0) (2) (1) 5 0
Income 32 30 31 35 34
Operating Expenses (21) (19) (21) (20) (21)
Core Pre-Provision Income 11 12 11 10 13
Pre-Provision Income 11 10 10 15 13
Provisions (5) (1) (1) (10) 1
Operating Profit 6 9 9 5 14
Other impairments (0) (1) (0) (1) -
PBT 6 9 9 4 14
Taxes (1) (2) (2) (1) (2)
PAT (cont. ops) 5 6 7 3 12
1. 4Q16 includes €150m gain from the sale of Astir Pallas,.

43 Corporate Presentation – December 2017
Name Abbreviation Definition
Common Equity / Book Value BVEquity attributable to NBG shareholders less minorities (non-controlling interests) and contingent convertible
securities (CoCos)
Common Equity Tier 1 Ratio CET1 ratio CET1 capital, as defined by Regulation No 575/2013 and based on the transitional rules over RWAs
Common Equity Tier 1 Ratio Fully
LoadedCET1 ratio, CRD IV FL CET1 capital as defined by Regulation No 575/2013, without the application of the transitional rules over RWAs
Core Income CI Net Interest Income (“NII”) + Net fee and commission income + Earned premia net of claims and commissions
Core Operating Result (Profit / (Loss)) - Core income less operating expenses and provisions (credit provisions and other impairment charges)
Core Operating Margin - Core operating profit / (loss) annualized over average net loans
Core Pre-Provision Income Core PPI Core Income less operating expenses, before provisions (credit provisions and other impairment charges)
Core Pre-Provision Margin Core PPI margin Core PPI annualized over average net loans
Cost of Risk / Provisioning Rate CoR Credit provisions of the period annualized over average net loans
Cost-to-Core Income Ratio C:CI Operating expenses over core Income
Cost-to-Income Ratio C:I Operating expenses over total income
Deposit Yields - Annualized interest expense on deposits over deposit balances
Forborne -Exposures for which forbearance measures have been extended according to EBA ITS technical standards on
Forbearance and Non-Performing Exposures
Forborne Non-Performing Exposures FNPEsExposures with forbearance measures that meet the criteria to be considered as non performing according to EBA
ITS technical standards on Forbearance and Non-Performing Exposures
Forborne Performing Exposures FPEs
Exposures with forbearance measures that do not meet the criteria to be considered as non performing according
to EBA ITS technical standards on Forbearance and Non-Performing Exposures and forborne exposures under
probation period
Funding cost - The blended cost of deposits, ECB refinancing, repo transactions and ELA funding
Gross Loans -Loans and advances to customers before allowance for impairment, excluding the loan to the Greek State of
€6.0bn
Loan Yield - Annualized loan interest income over gross performing loan balances
Loans-to-Deposits Ratio L:D Net loans over total deposits, period end
Definition of financial data & ratios used

44 Corporate Presentation – December 2017
Name Abbreviation DefinitionNet Interest Margin NIM NII annualized over average interest earning assets
Net Loans - Loans and advances to customers, excluding the loan to the Greek State of €6.0bn
Net Profit / (Loss) - Profit / (loss) for the period attributable to NBG equity shareholders
Non-Performing Exposures NPEs
Non-performing exposures are defined according to EBA ITS technical standards on Forbearance and Non-
Performing Exposures as exposures that satisfy either or both of the following criteria:
a) Material exposures which are more than 90 days past due
b) The debtor is assessed as unlikely to pay its credit obligations in full without realization of collateral, regardless
of the existence of any past due amount or of the number of days past due.
Non-Performing Exposures Coverage Ratio NPE coverage Stock of provisions (allowance for impairment for loans and advances to customers) over non-performing
exposures, period end
Non-Performing Exposures Ratio NPE ratio Non-performing exposures over gross loans, period end
Non-Performing Loans NPLs Loans and advances to customers in arrears for 90 days or more
90 Days Past Due Coverage Ratio 90dpd coverage Stock of provisions over loans and advances to customers in arrears for 90 days or more, period end
90 Days Past Due Formation 90dpd formationNet increase / (decrease) of loans and advances to customers in arrears for 90 days or more, before write-offs and
after restructurings
90 Days Past Due Ratio 90dpd ratio Loans and advances to customers in arrears for 90 days or more over gross loans, period end
Operating Expenses OpEx, costsPersonnel expenses + General, administrative and other operating expenses (“G&As”) + Depreciation and
amortisation on investment property, property & equipment and software & other intangible assets
Operating Profit / (Loss) - Total income less operating expenses and provisions (credit provisions and other impairment charges)
Pre-Provision Income PPI Total income less operating expenses, before provisions (credit provisions and other impairment charges)
Profit / (loss) after tax PAT (cont. ops) Profit / (loss) for the period from continuing operations
Risk Weighted Assets RWAsAssets and off-balance-sheet exposures, weighted according to risk factors based on Regulation (EU) No
575/2013
Tangible Equity / Book Value TBV Common equity less goodwill & intangibles (goodwill, software and other intangible assets)
Total deposits - Due to customers
Definition of financial data & ratios used

This presentation is not an offer to buy or sell or a solicitation of an offer to buy or sell any security or instrument or to participate in any trading strategy. No part of
this presentation may be construed as constituting investment advice or recommendation to enter into any transaction. No representation or warranty is given with
respect to the accuracy or completeness of the information contained in this presentation, and no claim is made that any future to transact any securities will
conform to any terms that may be contained herein. Before entering into any transaction, investors should determine any economic risks and benefits, as well as
any legal, tax, accounting consequences of doing so, as well as their ability to assume such risks, without reliance on the information contained in this presentation.