December, 2010. NEED FOR VALIDATED BIOMARKERS FOR AD TRIALS Biomarkers useful in Phase 2 to make...
32
ALZHEIMER’S DISEASE NEUROIMAGING INITIATIVE December, 2010
-
Upload
laurel-alday -
Category
Documents
-
view
218 -
download
2
Transcript of December, 2010. NEED FOR VALIDATED BIOMARKERS FOR AD TRIALS Biomarkers useful in Phase 2 to make...

ALZHEIMER’S DISEASE NEUROIMAGING INITIATIVE
December, 2010
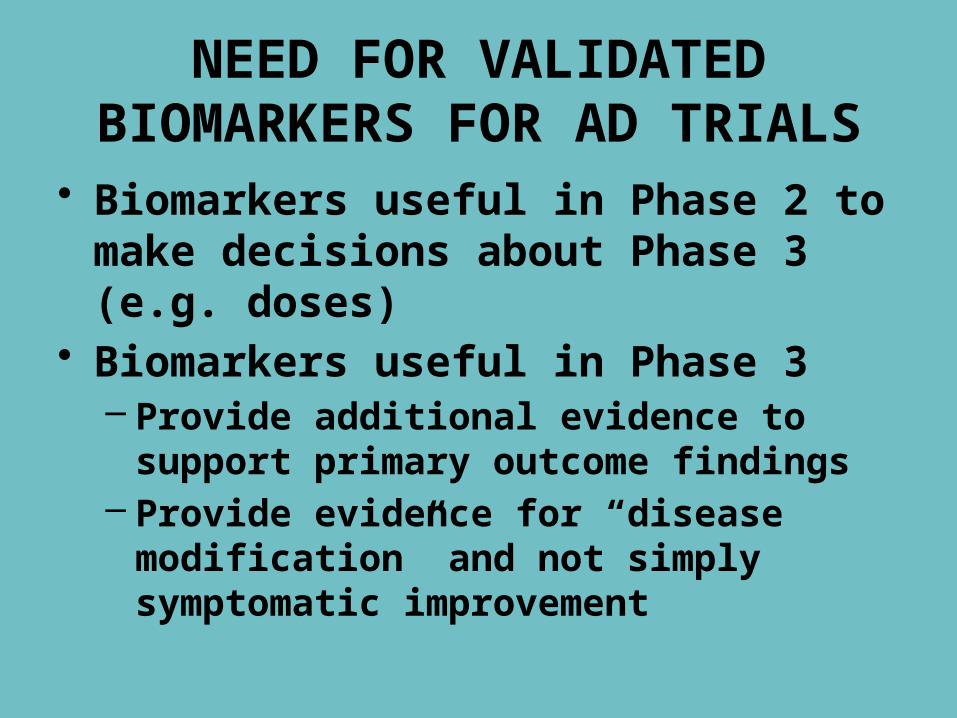
NEED FOR VALIDATED BIOMARKERS FOR AD TRIALS
• Biomarkers useful in Phase 2 to make decisions about Phase 3 (e.g. doses)
• Biomarkers useful in Phase 3– Provide additional evidence to support
primary outcome findings– Provide evidence for “disease
modification” and not simply symptomatic improvement
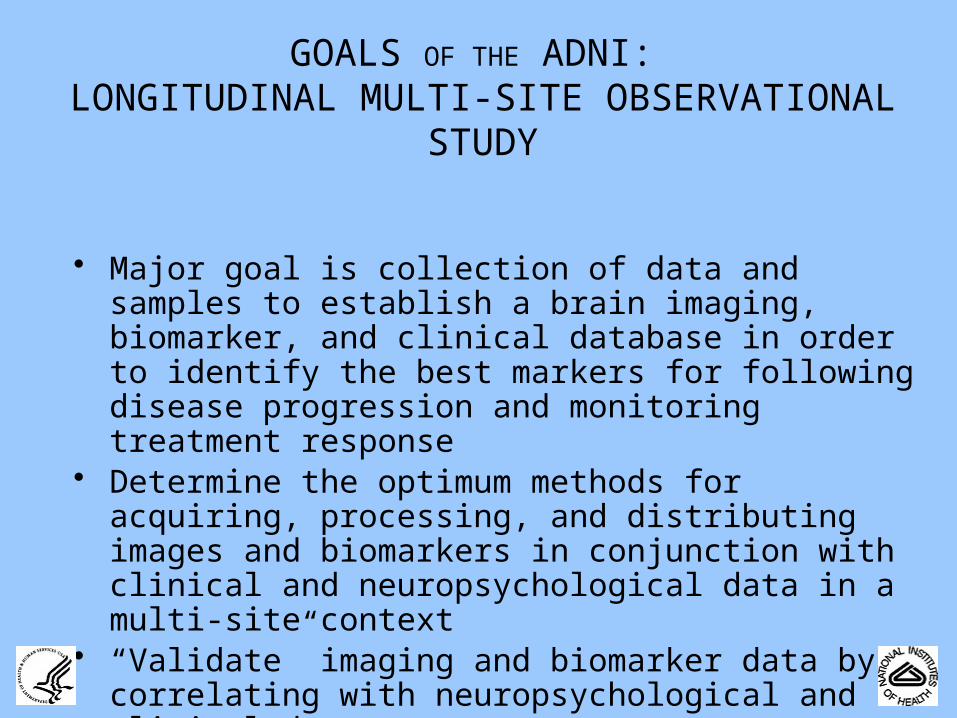
GOALS OF THE ADNI: LONGITUDINAL MULTI-SITE OBSERVATIONAL
STUDY
• Major goal is collection of data and samples to establish a brain imaging, biomarker, and clinical database in order to identify the best markers for following disease progression and monitoring treatment response
• Determine the optimum methods for acquiring, processing, and distributing images and biomarkers in conjunction with clinical and neuropsychological data in a multi-site context
• “Validate” imaging and biomarker data by correlating with neuropsychological and clinical data.
• Rapid public access of all data and access to samples
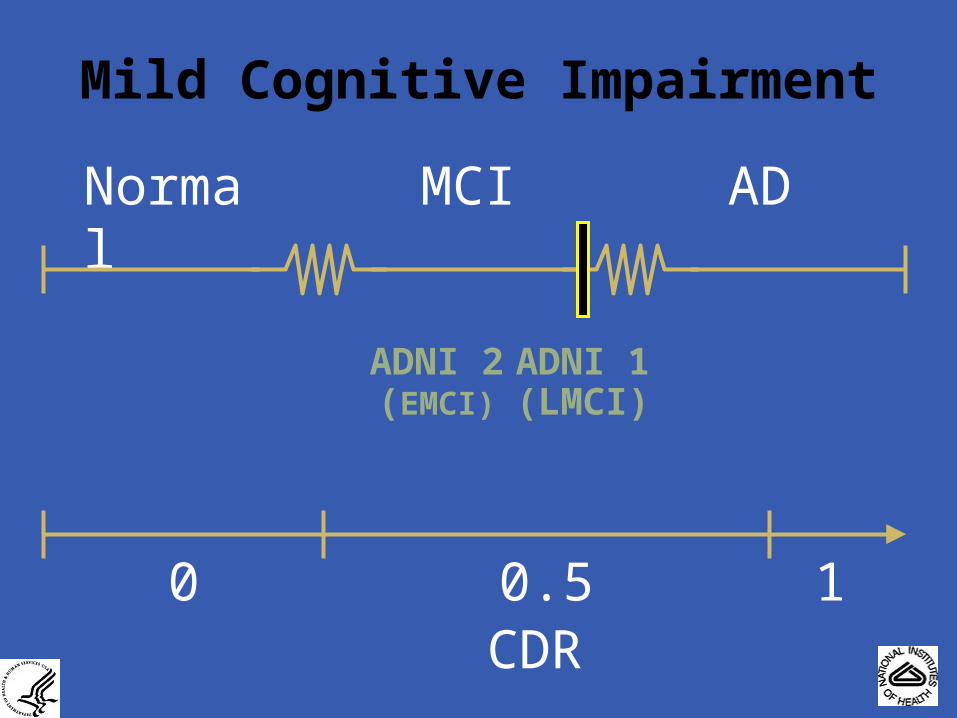
Mild Cognitive Impairment
Normal MCI AD
0 0.5 1CDR
3004153-1
ADNI 1(LMCI)
ADNI 2(EMCI)

STUDY DESIGN-ADNI1
• MCI (n= 400): 0, 6, 12, 18, 24, 36 months• AD (n= 200): 0, 6, 12, 24 months• Controls (n= 200): 0, 6, 12, 24, 36 months• Clinical/neuropsychological evaluations, MRI (1.5 T)
at all time points• FDG PET at all time points in 50% • 3 T MRI at all time points in 25%• PIB sub-study on 120 subjects• Blood and urine at all time points from all subjects;
CSF from 50% of subjects 0, 1 yr, 2 yr (subset); DNA and immortalized cell lines from all subjects
• GWAS study
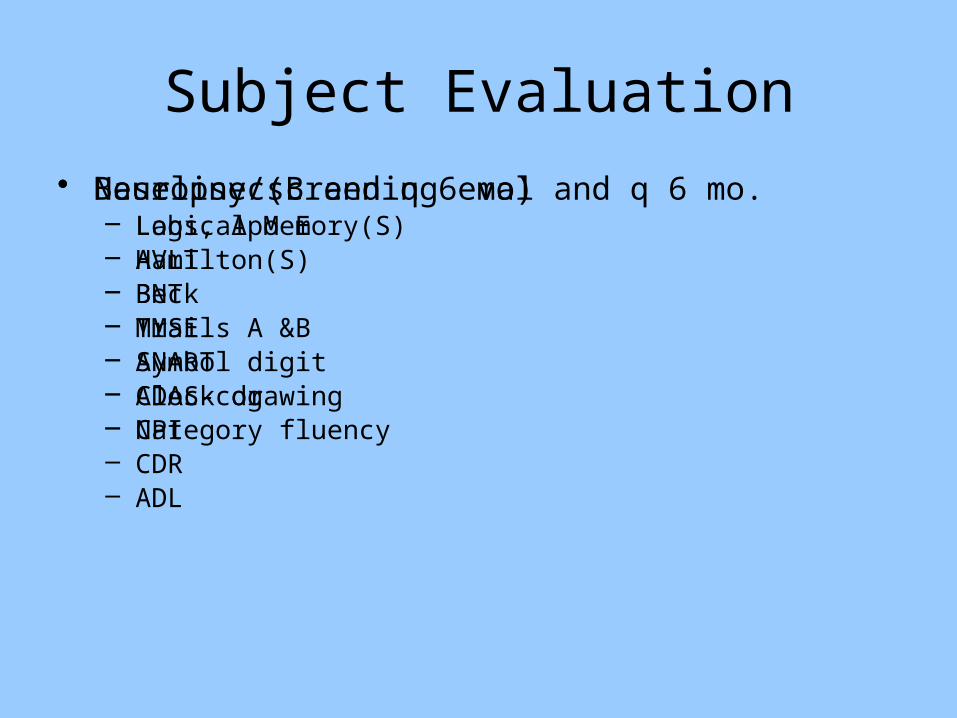
Subject Evaluation
• Baseline/screening eval and q 6 mo.– Labs, Apo E– Hamilton(S)– Beck– MMSE– ANART– ADAS-cog– NPI– CDR– ADL
• Neuropsyc(B and q 6 mo)– Logical Memory(S)– AVLT– BNT– Trails A &B– Symbol digit– Clock drawing– Category fluency
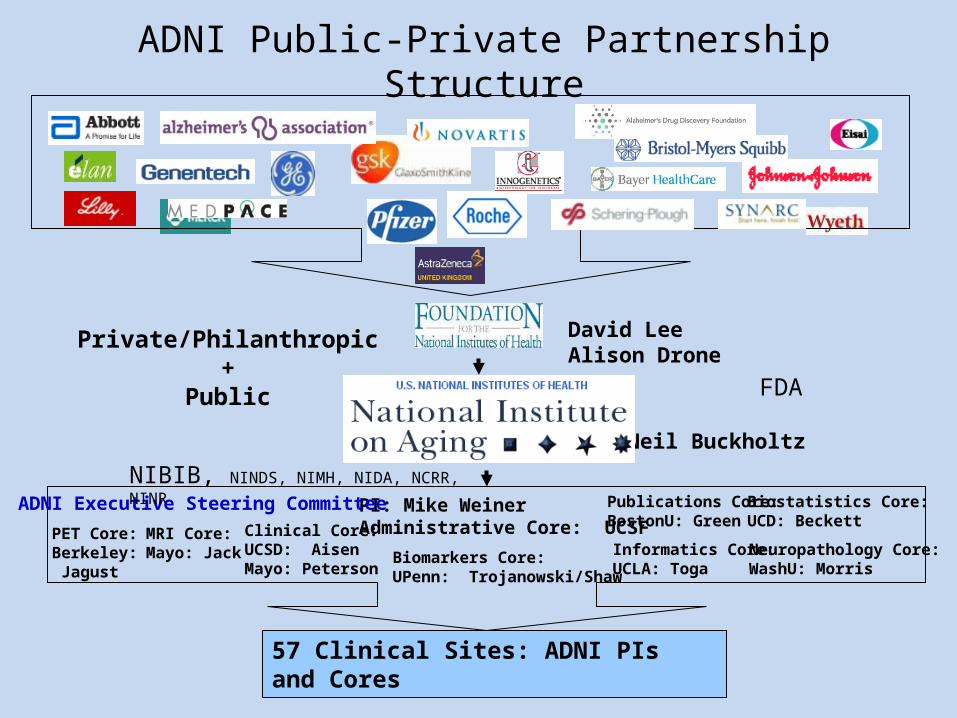
ADNI Public-Private Partnership Structure
Neil Buckholtz
PI: Mike WeinerAdministrative Core: UCSF
David LeeAlison Drone
Biostatistics Core:UCD: Beckett
Biomarkers Core:UPenn: Trojanowski/Shaw
MRI Core:Mayo: Jack
Clinical Core:UCSD: AisenMayo: Peterson
PET Core:Berkeley: Jagust
Informatics Core:UCLA: Toga
Publications Core:BostonU: Green
Neuropathology Core:WashU: Morris
57 Clinical Sites: ADNI PIs and Cores
ADNI Executive Steering Committee
Private/Philanthropic+
Public
NIBIB, NINDS, NIMH, NIDA, NCRR, NINR
FDA
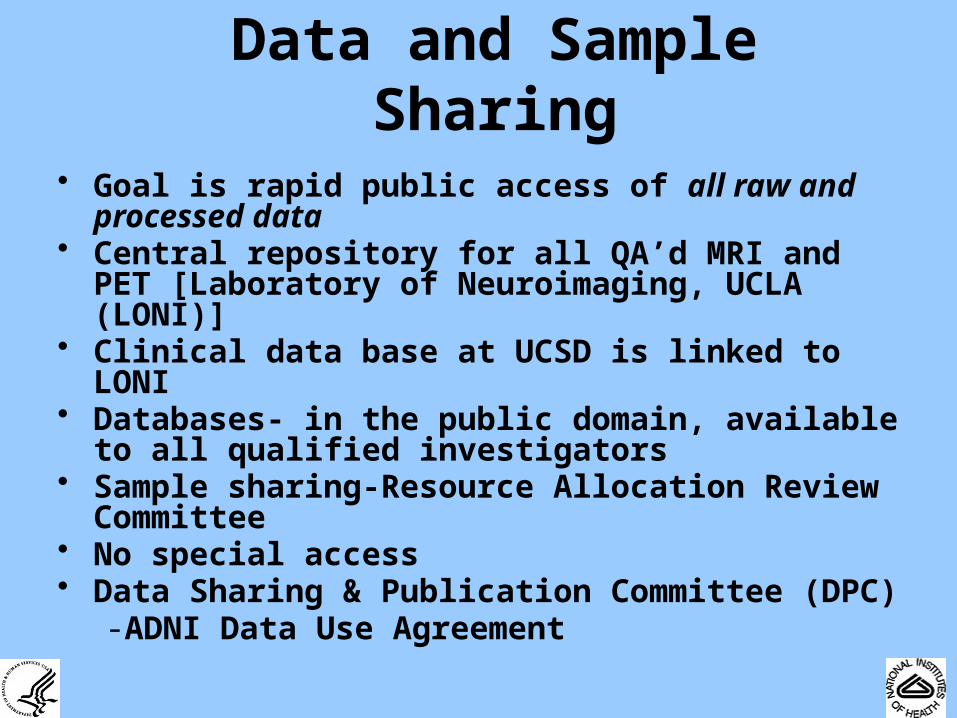
Data and Sample Sharing
• Goal is rapid public access of all raw and processed data
• Central repository for all QA’d MRI and PET [Laboratory of Neuroimaging, UCLA (LONI)]
• Clinical data base at UCSD is linked to LONI• Databases- in the public domain, available to all
qualified investigators• Sample sharing-Resource Allocation Review
Committee• No special access• Data Sharing & Publication Committee (DPC)
-ADNI Data Use Agreement
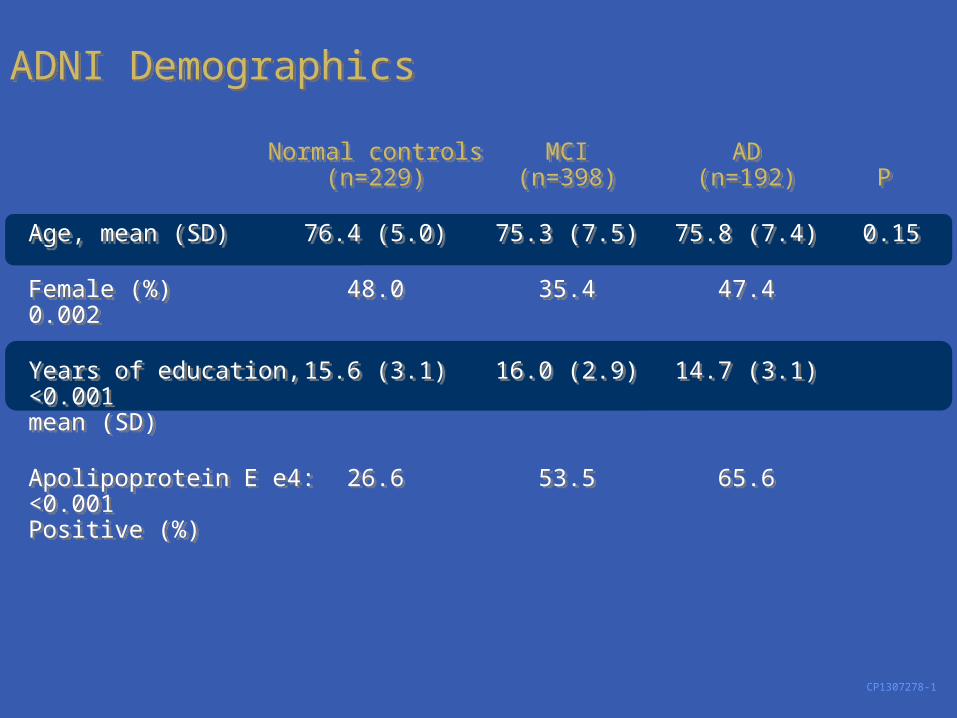
ADNI DemographicsADNI Demographics
CP1307278-1
Normal controls MCI AD(n=229) (n=398) (n=192) P
Age, mean (SD) 76.4 (5.0) 75.3 (7.5) 75.8 (7.4) 0.15
Female (%) 48.0 35.4 47.4 0.002
Years of education, 15.6 (3.1) 16.0 (2.9) 14.7 (3.1) <0.001mean (SD)
Apolipoprotein E e4: 26.6 53.5 65.6 <0.001Positive (%)
Normal controls MCI AD(n=229) (n=398) (n=192) P
Age, mean (SD) 76.4 (5.0) 75.3 (7.5) 75.8 (7.4) 0.15
Female (%) 48.0 35.4 47.4 0.002
Years of education, 15.6 (3.1) 16.0 (2.9) 14.7 (3.1) <0.001mean (SD)
Apolipoprotein E e4: 26.6 53.5 65.6 <0.001Positive (%)
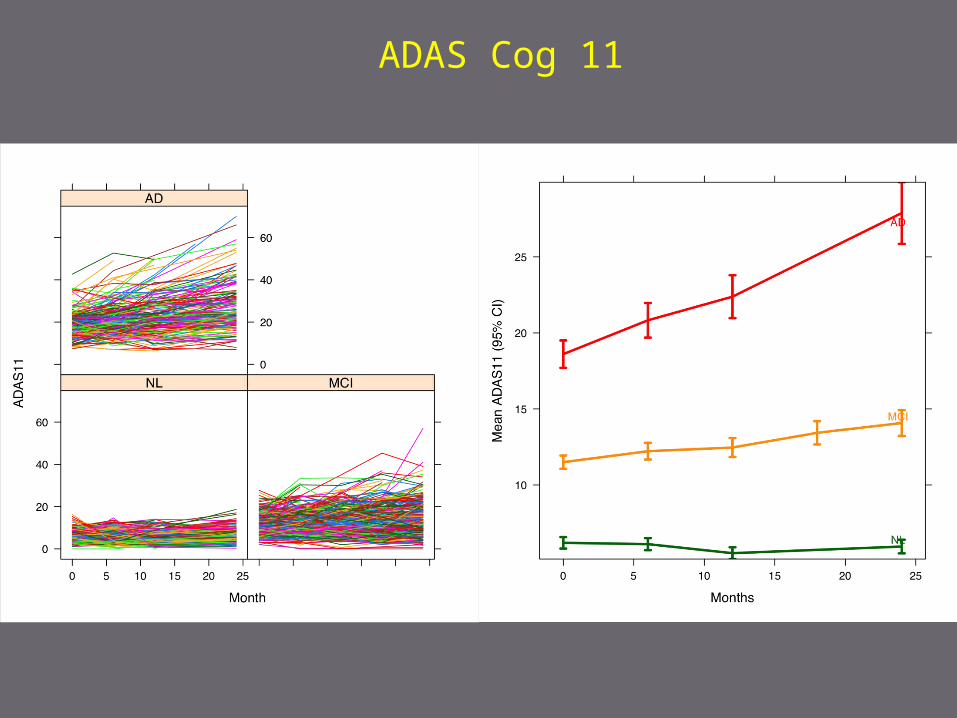
ADAS Cog 11
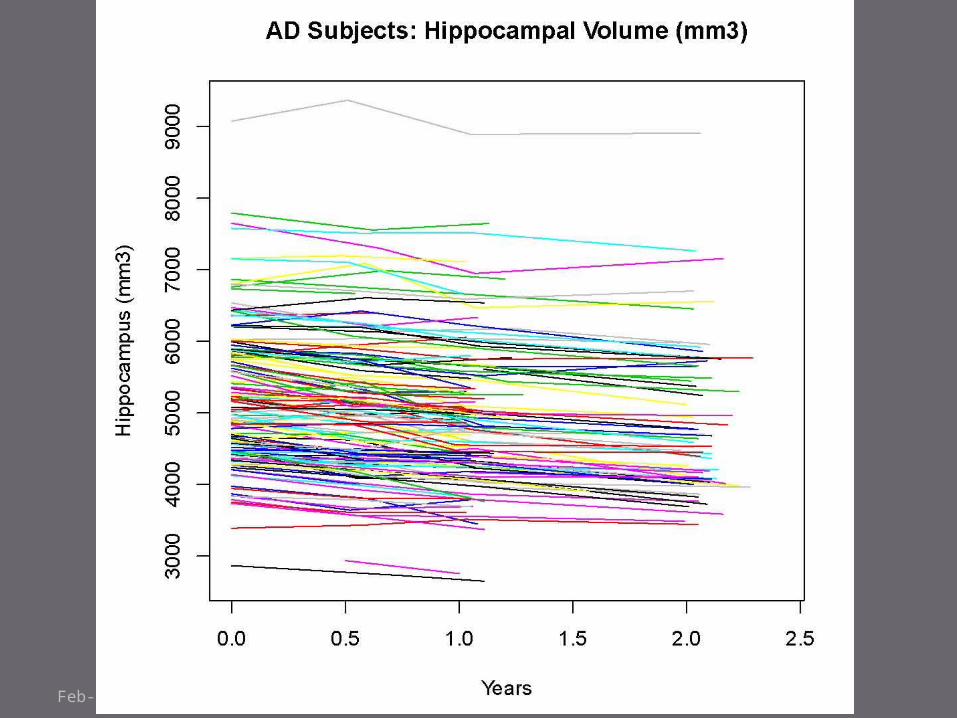
Feb-09; N. Schuff
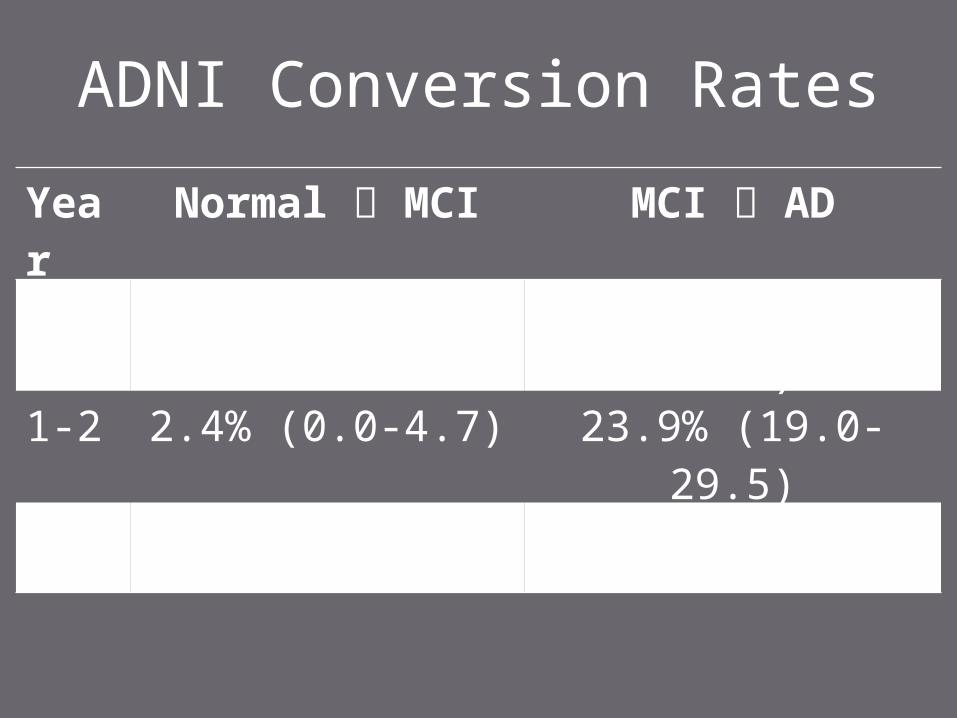
ADNI Conversion Rates
Year Normal MCI MCI AD
0-1 1.4% (0.0-3.2) 16.0% (11.3-20.4)
1-2 2.4% (0.0-4.7) 23.9% (19.0-29.5)
2-3 0.0% (0.0-3.4) 9.1% (5.8-13.5)
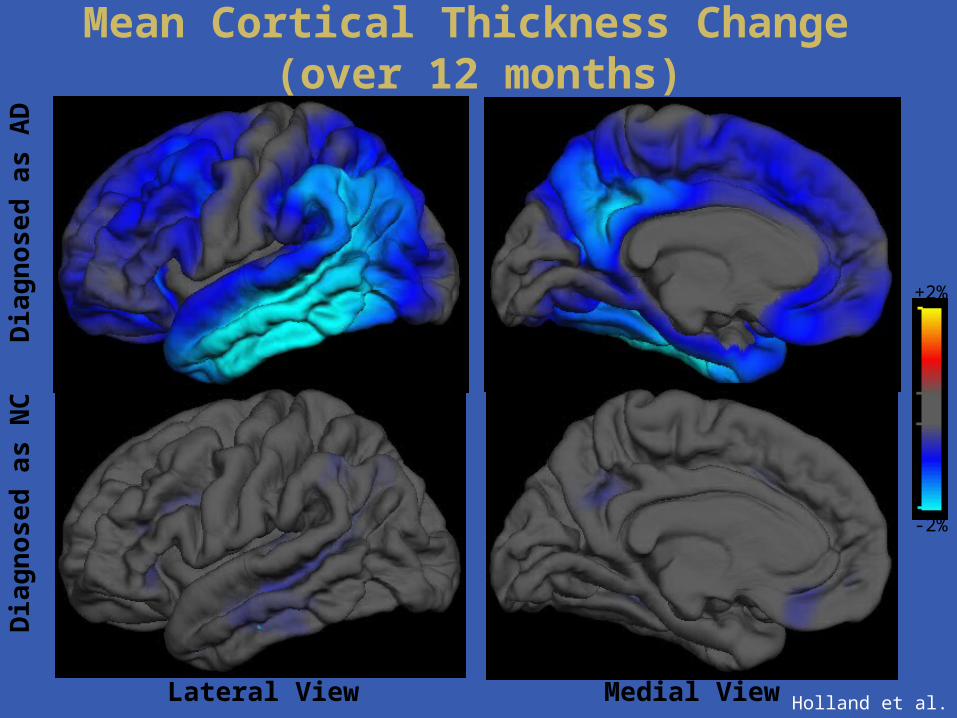
Mean Cortical Thickness Change (over 12 months)
Holland et al.
Dia
gn
os
ed a
s N
CD
iag
no
sed
as
AD
+2%
-2%
Lateral View Medial View
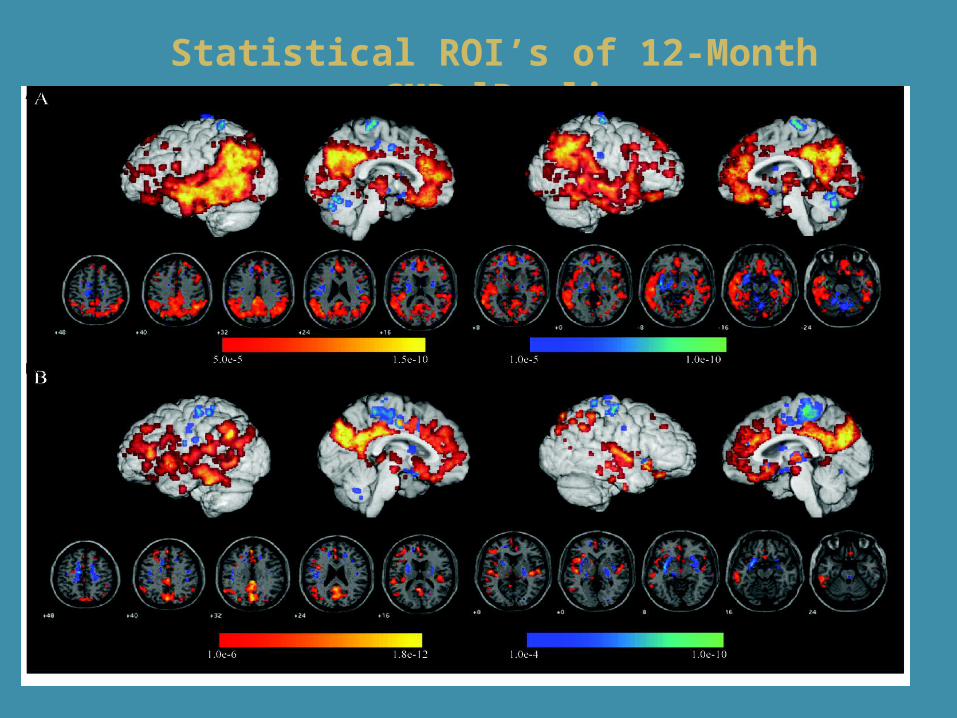
Statistical ROI’s of 12-Month CMRglDeclineAD
MCI
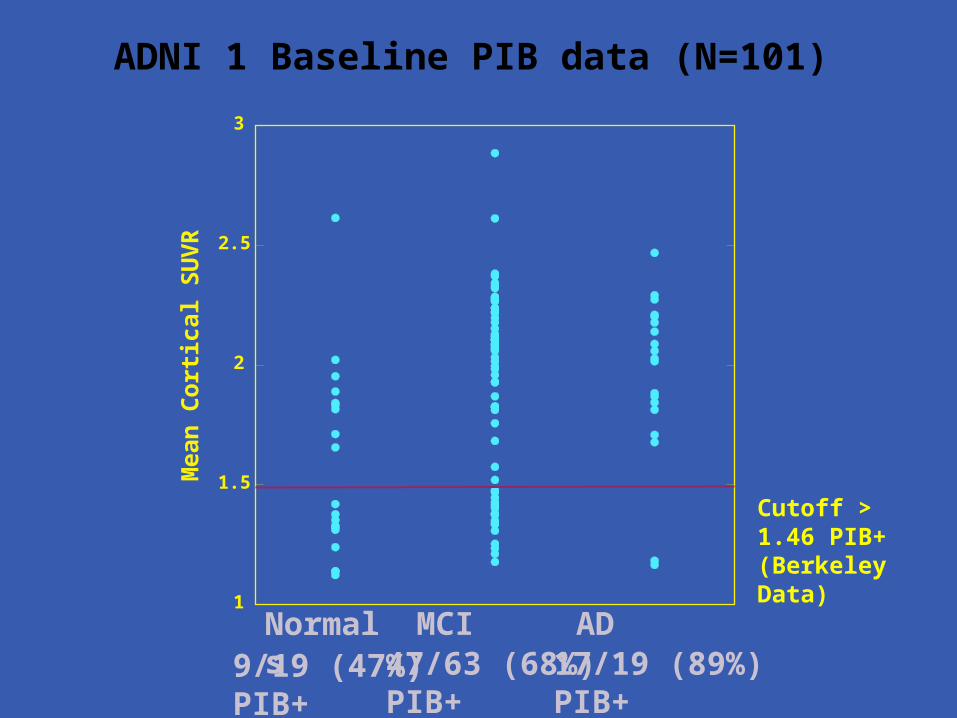
ADNI 1 Baseline PIB data (N=101)
1
1.5
2
2.5
3
Mea
n C
ort
ical
SU
VR
Cutoff > 1.46 PIB+(Berkeley Data)
Normals9/19 (47%)PIB+
MCI47/63 (68%) PIB+
AD17/19 (89%) PIB+
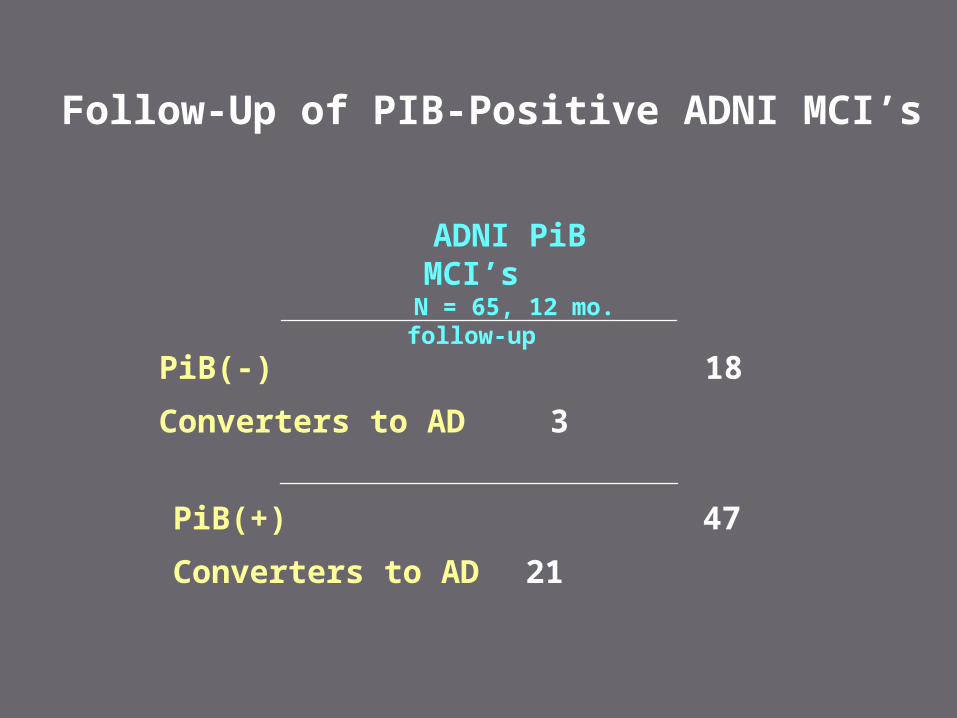
Follow-Up of PIB-Positive ADNI MCI’s
PiB(+) 47
Converters to AD 21
PiB(-) 18
Converters to AD 3
ADNI PiB MCI’s N = 65, 12 mo. follow-up
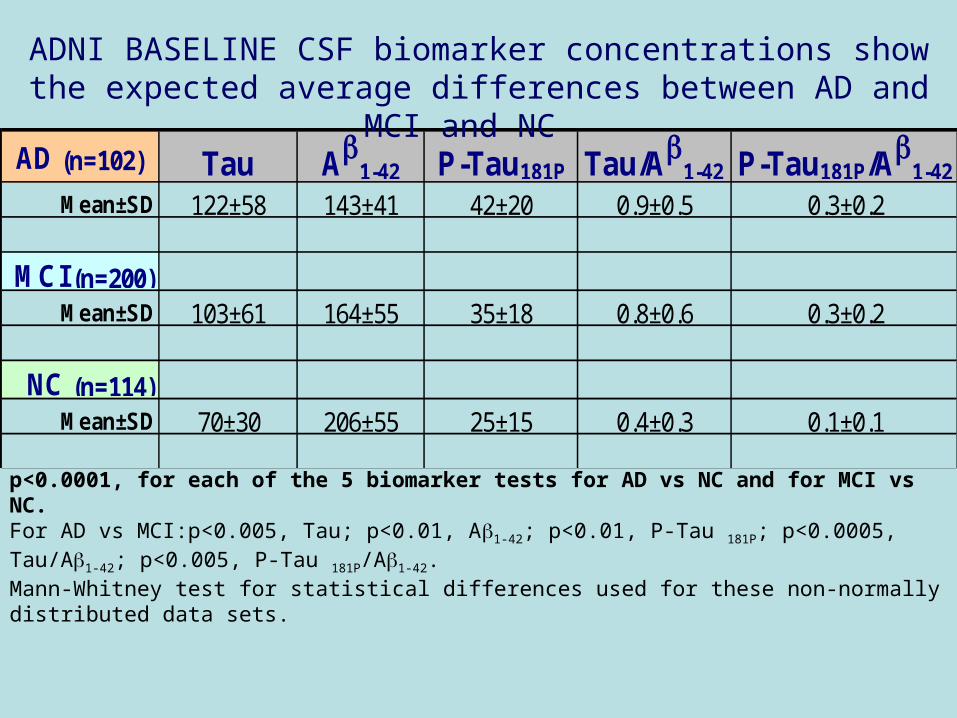
AD (n=102) Tau Ab1-42 P-Tau181P Tau/Ab
1-42 P-Tau181P/Ab1-42
Mean±SD 122±58 143±41 42±20 0.9±0.5 0.3±0.2
MCI (n=200)Mean±SD 103±61 164±55 35±18 0.8±0.6 0.3±0.2
NC (n=114)Mean±SD 70±30 206±55 25±15 0.4±0.3 0.1±0.1
ADNI BASELINE CSF biomarker concentrations show the expected average differences between AD and MCI and NC
p<0.0001, for each of the 5 biomarker tests for AD vs NC and for MCI vs NC. For AD vs MCI:p<0.005, Tau; p<0.01, Ab1-42; p<0.01, P-Tau 181P; p<0.0005, Tau/Ab1-42; p<0.005, P-Tau 181P/Ab1-42.Mann-Whitney test for statistical differences used for these non-normally distributed data sets.
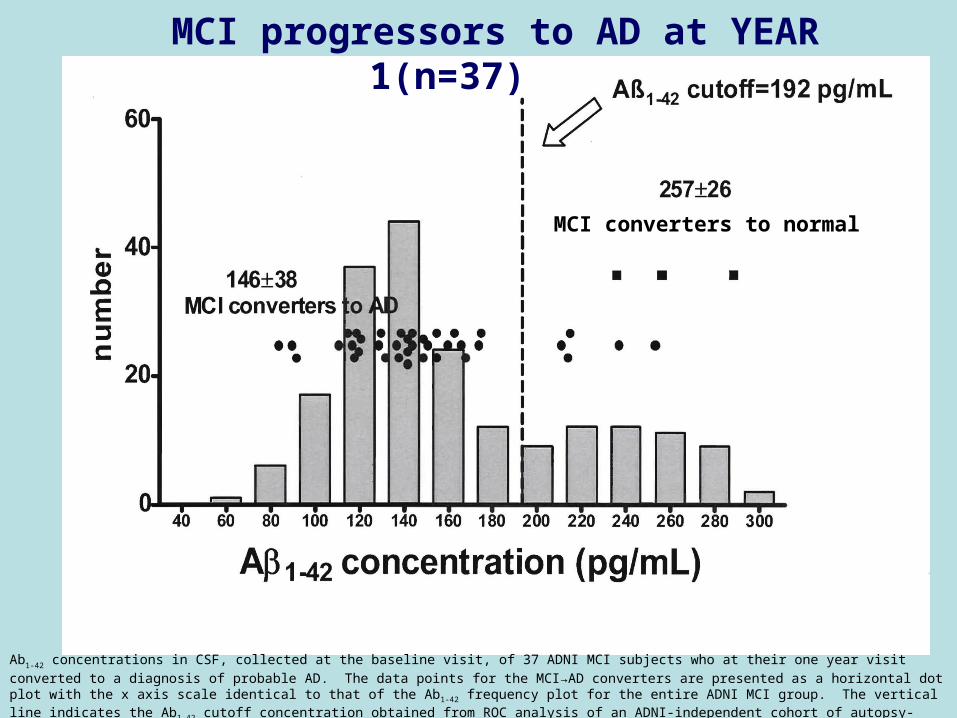
Ab1-42 concentrations in CSF, collected at the baseline visit, of 37 ADNI MCI subjects who at their one year visit converted to a diagnosis of probable AD. The
data points for the MCI→AD converters are presented as a horizontal dot plot with the x axis scale identical to that of the Ab1-42 frequency plot for the entire ADNI MCI group. The vertical line indicates the Ab1-42 cutoff concentration obtained from ROC analysis of an ADNI-independent cohort of autopsy-based AD subjects’ CSF.
MCI progressors to AD at YEAR 1(n=37)
MCI converters to normal
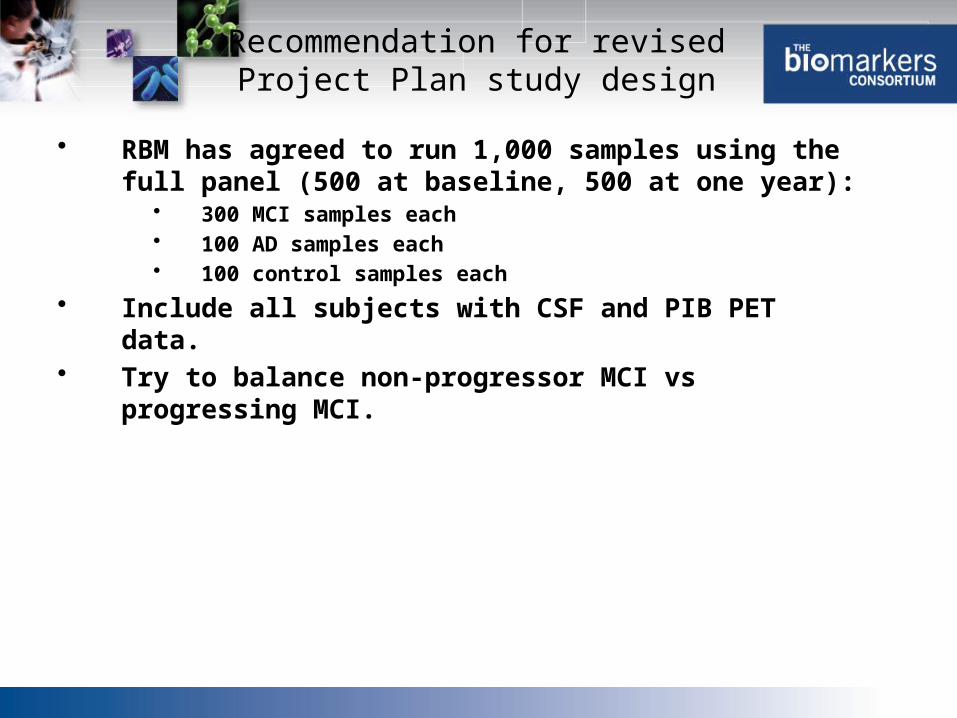
• RBM has agreed to run 1,000 samples using the full panel (500 at baseline, 500 at one year):
• 300 MCI samples each • 100 AD samples each• 100 control samples each
• Include all subjects with CSF and PIB PET data. • Try to balance non-progressor MCI vs progressing MCI.
Recommendation for revisedProject Plan study design
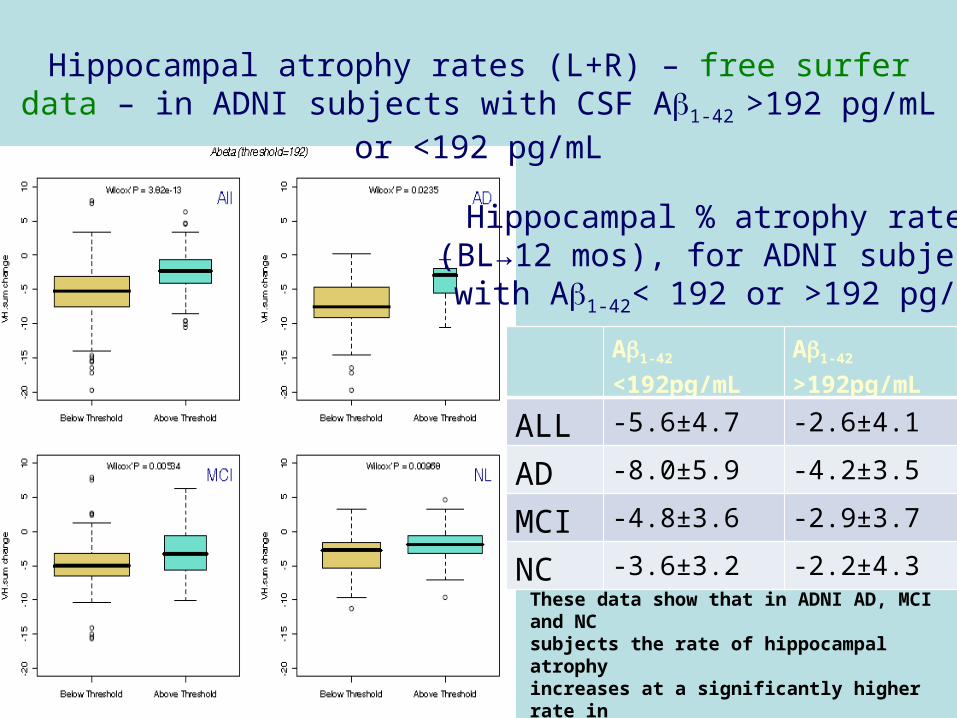
Hippocampal atrophy rates (L+R) – free surfer data – in ADNI subjects with CSF Ab1-42 >192 pg/mL or <192 pg/mL
Ab1-42
<192pg/mLAb1-42
>192pg/mL
ALL -5.6±4.7 -2.6±4.1
AD -8.0±5.9 -4.2±3.5
MCI -4.8±3.6 -2.9±3.7
NC -3.6±3.2 -2.2±4.3
Hippocampal % atrophy rates(BL→12 mos), for ADNI subjectswith Ab1-42< 192 or >192 pg/mL
These data show that in ADNI AD, MCI and NCsubjects the rate of hippocampal atrophyincreases at a significantly higher rate in subjects with Ab1-42 <192 pg/mL cutoff concentration compared to those >192 pg/mL
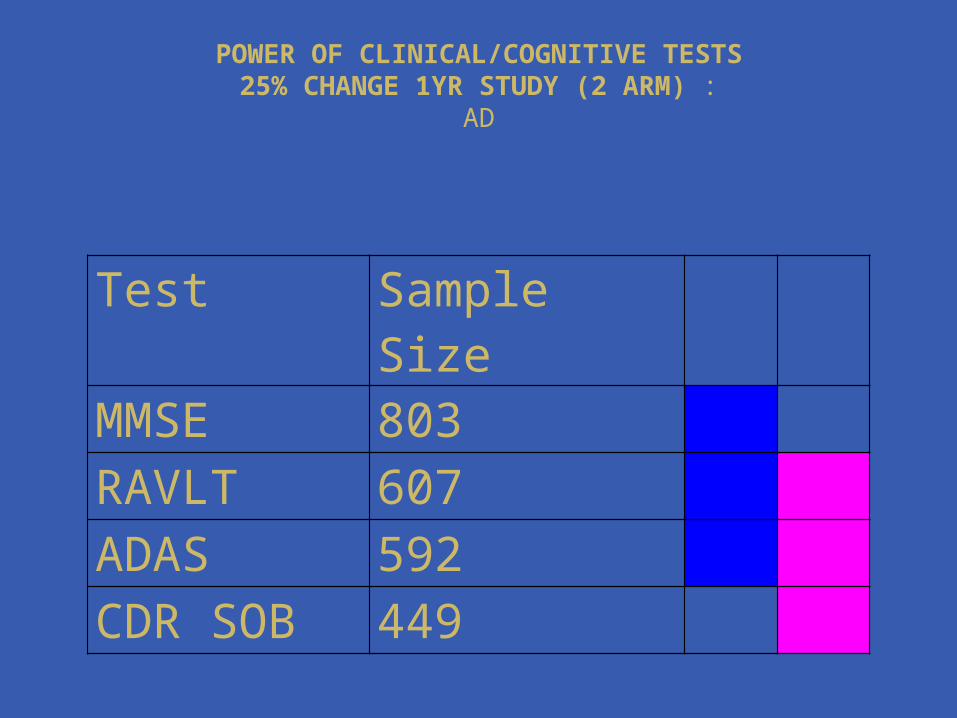
Test Sample Size
MMSE 803
RAVLT 607
ADAS 592
CDR SOB 449
POWER OF CLINICAL/COGNITIVE TESTS25% CHANGE 1YR STUDY (2 ARM) :
AD

22
1.5T MRI Comparisons - AD (n=69)
Lab Variable SS/arm
Alexander L. Hippo. Formation 334
Dale Whole Brain 207
Schuff - FS Hippocampus 201
Dale Ventricles 132
Dale Hippocampus 126
Studholme Temporal lobe % change
123
Schuff - FS Ventricles 119
Studhome CV - % change 106
Fox VBSI % change 105
Fox BSI % change 71
Thompson CV - % change 54

ADNI Genotyping• Initial goal: high density genome wide scan
– Identified major microarray platforms for GWAS• Compared marker selection strategies, HapMap
coverage of genome, performance & reliability, as well as cost/sample
– Illumina platform was selected by consensus of the Genetics Committee & ISAB for this project
– TGen (Phoenix, AZ) was selected to perform the assays– Illumina Human 610-Quad

Shen et al 2010: Overview Ba
selin
e M
RI S
cans
FreeSurfer: 56 volume orcortical thickness measures
VBM: 86 GM density measures
QC’ed genotyping data
GWAS of Imaging Phenotypes
Strong associations represented by heat maps
R L L R
R L R
GWAS of candidate QT VBM of candidate SNPRefined modeling of candidate association
530,992 SNPs142 QTs
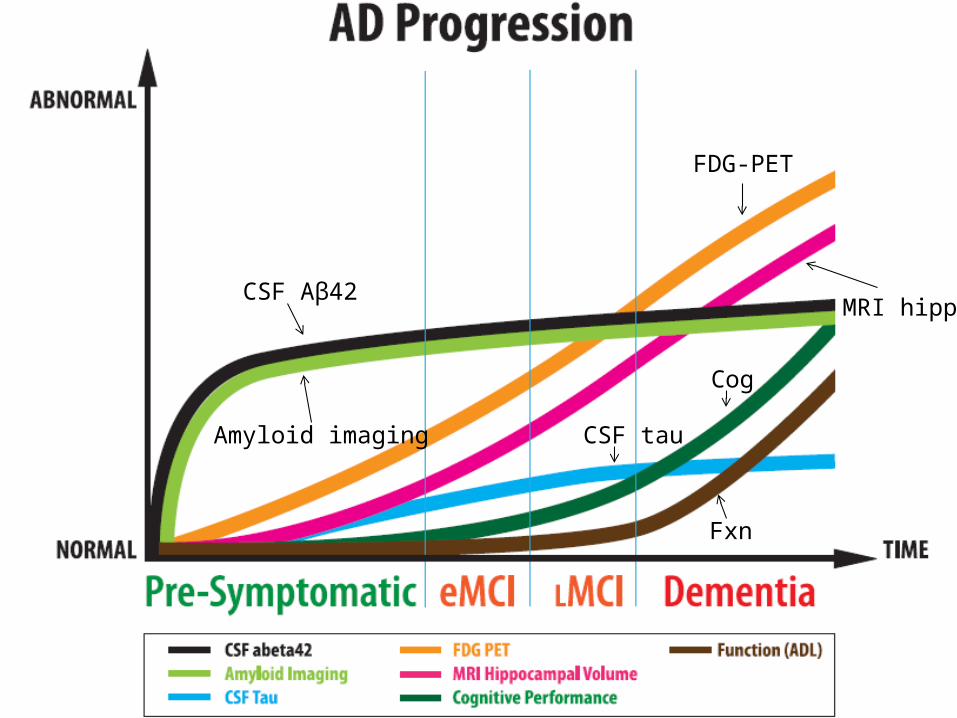
CSF Aβ42
Amyloid imaging
FDG-PET
MRI hipp
CSF tau
Cog
Fxn
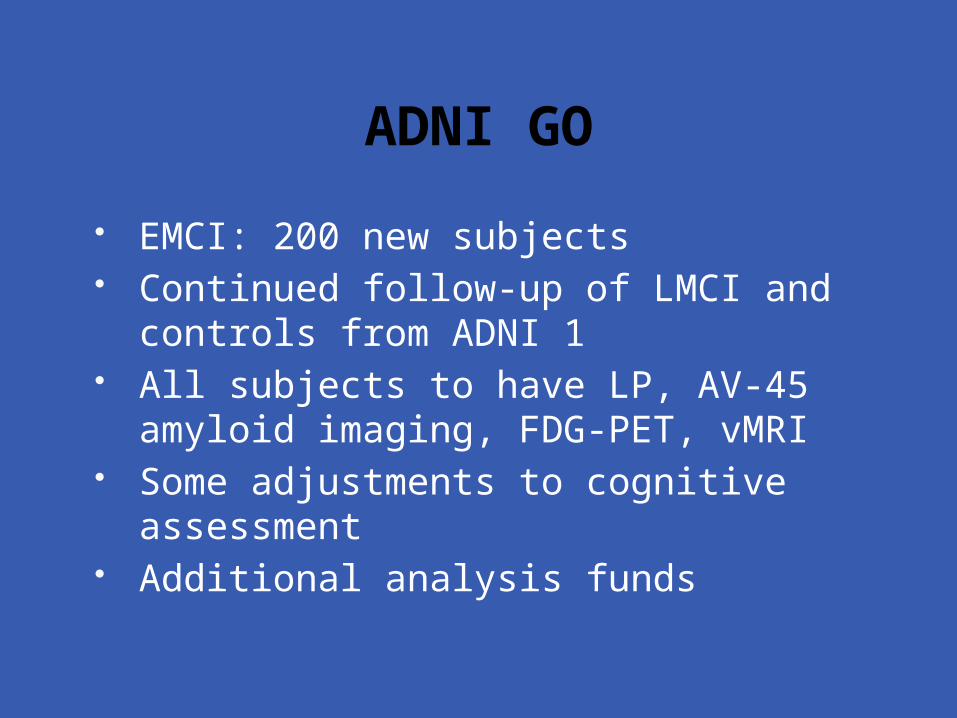
ADNI GO
EMCI: 200 new subjects Continued follow-up of LMCI and
controls from ADNI 1 All subjects to have LP, AV-45 amyloid
imaging, FDG-PET, vMRI Some adjustments to cognitive
assessment Additional analysis funds
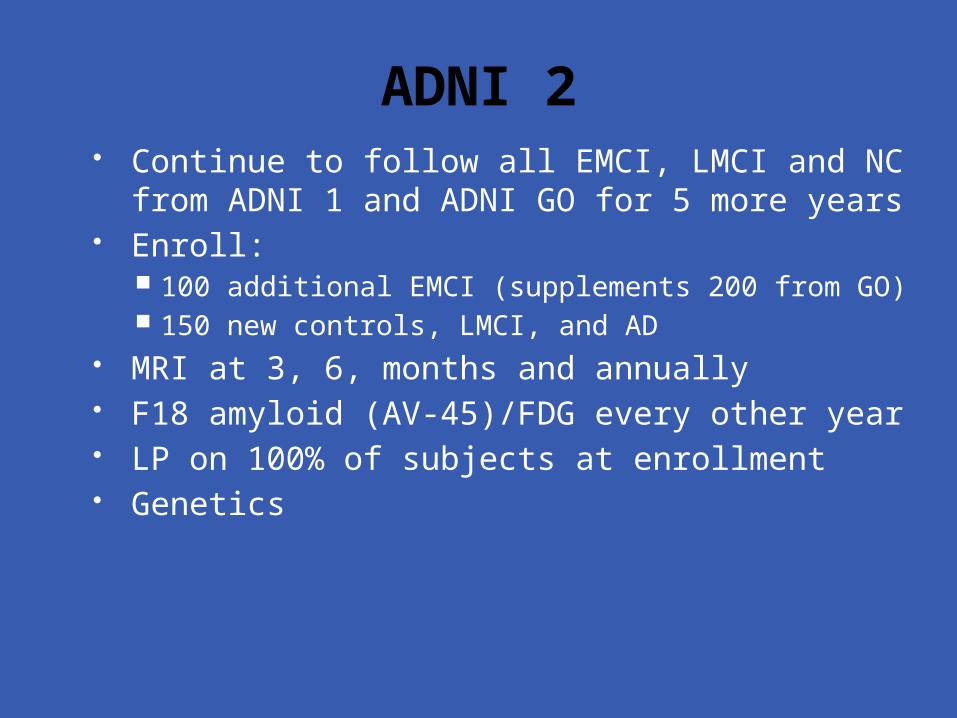
ADNI 2 Continue to follow all EMCI, LMCI and NC
from ADNI 1 and ADNI GO for 5 more years Enroll:
100 additional EMCI (supplements 200 from GO) 150 new controls, LMCI, and AD
MRI at 3, 6, months and annually F18 amyloid (AV-45)/FDG every other year LP on 100% of subjects at enrollment Genetics
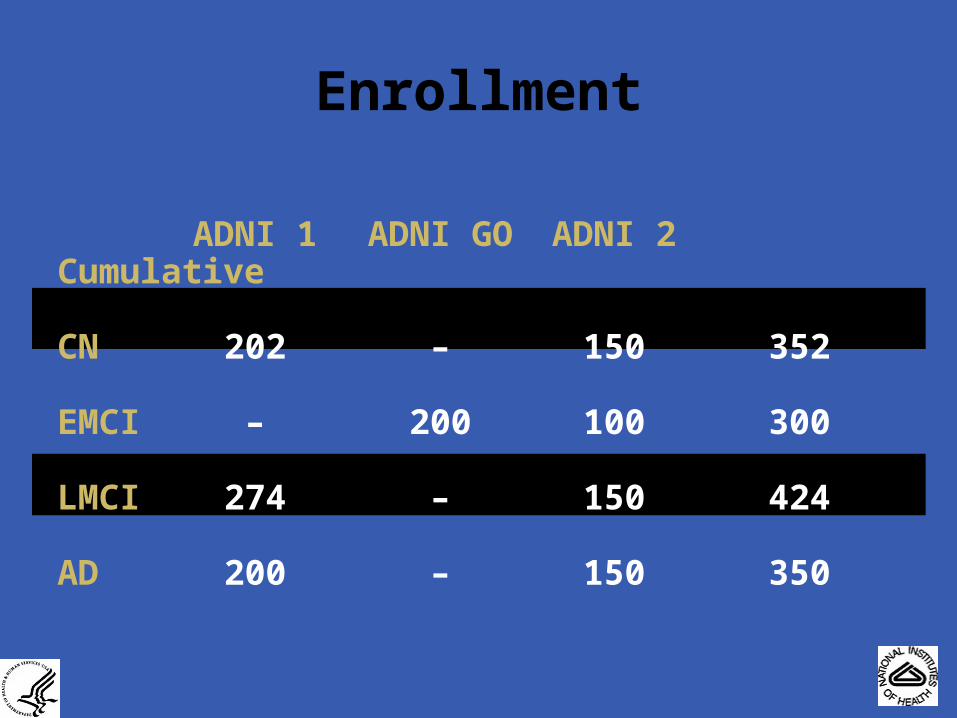
Enrollment
ADNI 1 ADNI GO ADNI 2 Cumulative
CN 202 – 150 352
EMCI – 200 100 300
LMCI 274 – 150 424
AD 200 – 150 350
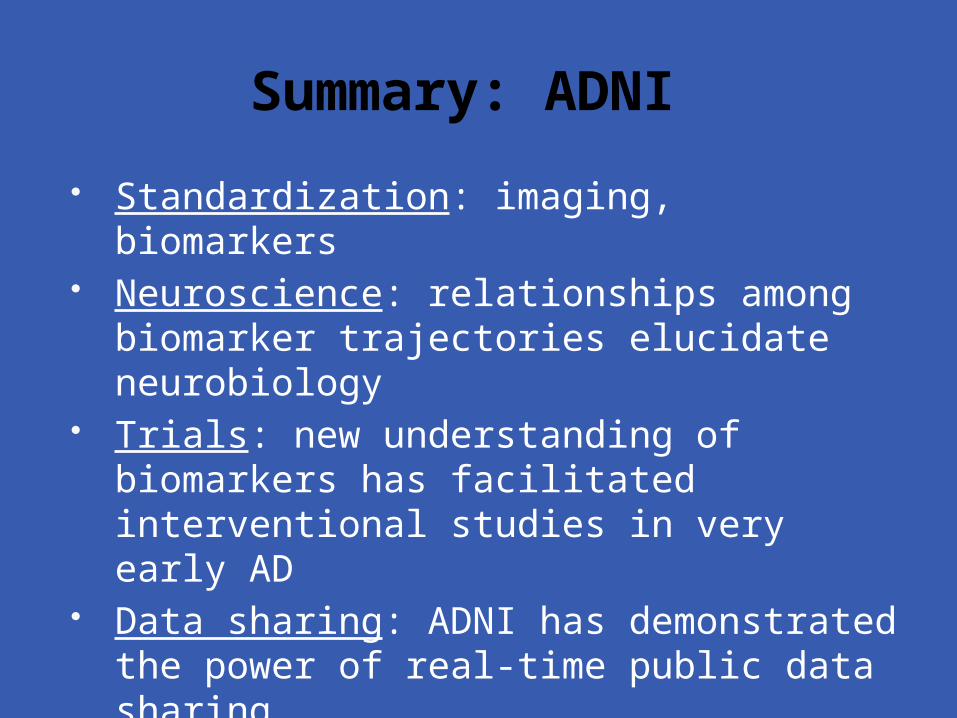
Summary: ADNI
Standardization: imaging, biomarkers Neuroscience: relationships among
biomarker trajectories elucidate neurobiology
Trials: new understanding of biomarkers has facilitated interventional studies in very early AD
Data sharing: ADNI has demonstrated the power of real-time public data sharing
Collaboration: academia, industry, non-profits, regulatory agencies world-wide
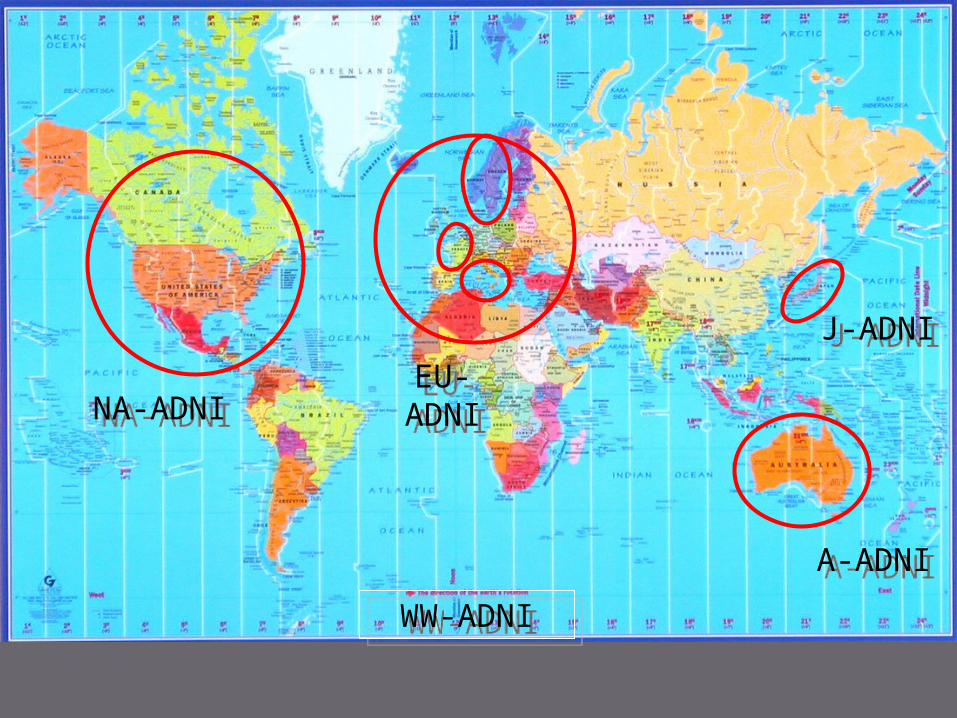
NA-ADNINA-ADNI
J-ADNIJ-ADNI
EU-ADNIEU-ADNI
WW-ADNIWW-ADNI
A-ADNIA-ADNI

ADNI as a model for other diseases
Parkinson’s disease FTD Atherosclerosis Interaction with Wellcome Trust UK
Biobank Project through NCI
http://www.adni-info.orghttp://www.loni.ucla.edu/ADNI