
December 2010 Market Action Report
4
MARKET ACTION REPORT December 2010 City: Rancho Santa Fe Coldwell Banker, Rancho Santa Fe Price Range: ALL | Properties: Single Family Home, Townhome, Condo Based on information from Sandicor, Inc. for the period 1/1/2008 through 12/31/2010. Due to MLS reporting methods and allowable reporting policy, this data is only informational and may not be completely accurate. Therefore, Coldwell Banker Residential Brokerage does not guarantee the data accuracy. Data maintained by the MLS's may not reflect all real estate activity in the market. Trending Versus*: Trending Versus*: Market Profile & Trends Overview Month LM L3M PYM LY YTD PriorYTD PriorYear Median List Price of all Current Listings $2,895,000 0% -2% Average List Price of all Current Listings $3,784,499 0% -1% December Median Sales Price $1,900,000 4% -3% 0% -9% $1,900,000 -9% -9% December Average Sales Price $2,584,805 24% 6% 18% 7% $2,268,098 -3% -6% Total Properties Currently for Sale (Inventory) 257 -11% -16% December Number of Properties Sold 19 12% 12% 231 51% December Average Days on Market (Solds) 135 -7% -8% -12% -12% 145 -1% -5% Asking Price per Square Foot (based on New Listings) $422 -16% -13% -7% -30% $561 -6% -6% December Sold Price per Square Foot $423 -5% 0% 13% -3% $422 -3% -3% December Month's Supply of Inventory 13.5 -20% -11% -25% -61% 18.1 -48% -48% December Sale Price vs List Price Ratio 90.4% -0.4% 3% 0% 1.6% 88.9% -0.3% -0.1% * LM=Last Month / L3M=Last 3 Months / PYM=Same Month Prior Year / LY=Last Year / YTD = Year-to-date Property Sales December Property sales were 19, up 11.8% from 17 in December of 2009 and 11.8% higher than the 17 sales last month. December 2010 sales were at their highest level compared to December of 2009 and 2008. December YTD sales of 231 are running 51.0% ahead of last year's year-to-date sales of 153. Prices The Median Sales Price in December was $1,900,000, equal to $1,900,000 in December of 2009 and up 4.1% from $1,825,000 last month. The Average Sales Price in December was $2,584,805, up 17.8% from $2,193,549 in December of 2009 and up 24.2% from $2,081,212 last month. December 2010 ASP was at a mid range compared to December of 2009 and 2008.
-
Upload
coldwell-banker-residential-brokerage -
Category
Documents
-
view
213 -
download
0
description
December 2010 Market Action Report
Transcript of December 2010 Market Action Report
MARKET ACTION REPORT
December 2010
City: Rancho Santa FeColdwell Banker, Rancho Santa Fe
Price Range: ALL | Properties: Single Family Home, Townhome, Condo
Based on information from Sandicor, Inc. for the period 1/1/2008 through 12/31/2010. Due to MLS reporting methods and allowable reporting policy, this data is onlyinformational and may not be completely accurate. Therefore, Coldwell Banker Residential Brokerage does not guarantee the data accuracy. Data maintained bythe MLS's may not reflect all real estate activity in the market.
Trending Versus*: Trending Versus*:Market Profile & Trends Overview Month LM L3M PYM LY YTD PriorYTD PriorYear
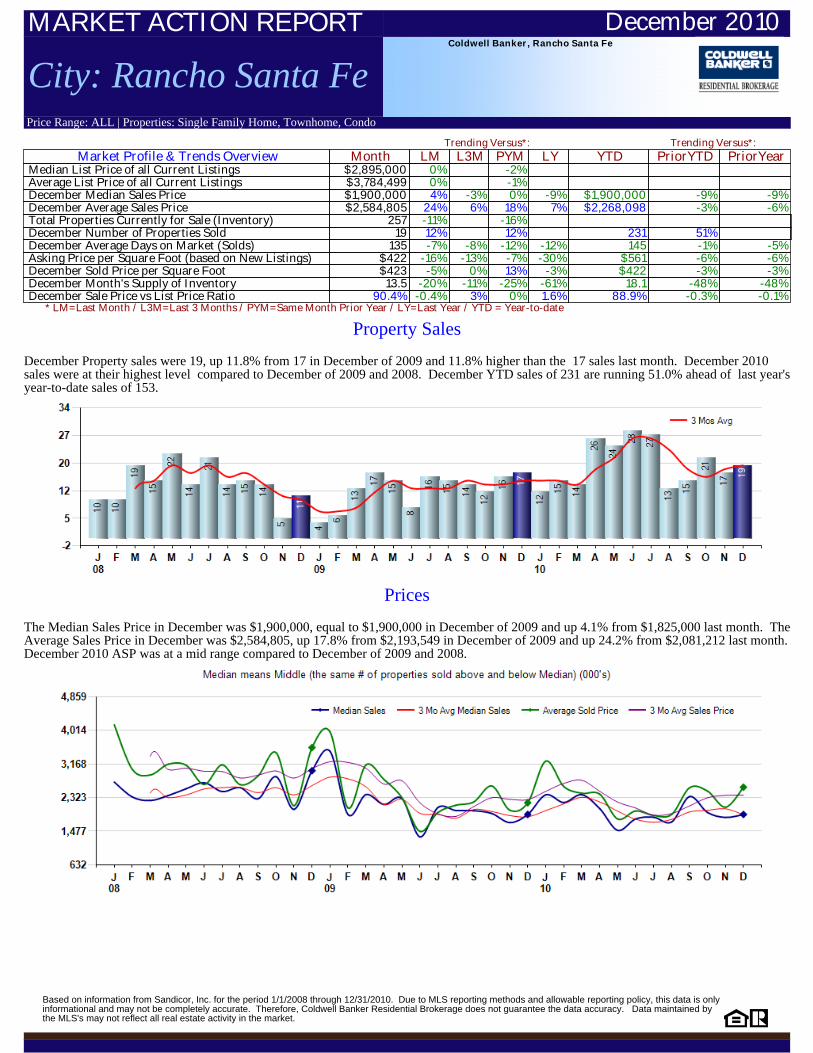
Median List Price of all Current Listings $2,895,000 0% � -2% � � � �Average List Price of all Current Listings $3,784,499 0% � -1% � � � �December Median Sales Price $1,900,000 4% -3% 0% -9% $1,900,000 -9% -9%December Average Sales Price $2,584,805 24% 6% 18% 7% $2,268,098 -3% -6%Total Properties Currently for Sale (Inventory) 257 -11% � -16% � � � �December Number of Properties Sold 19 12% � 12% � 231 51% �December Average Days on Market (Solds) 135 -7% -8% -12% -12% 145 -1% -5%Asking Price per Square Foot (based on New Listings) $422 -16% -13% -7% -30% $561 -6% -6%December Sold Price per Square Foot $423 -5% 0% 13% -3% $422 -3% -3%December Month's Supply of Inventory 13.5 -20% -11% -25% -61% 18.1 -48% -48%December Sale Price vs List Price Ratio 90.4% -0.4% 3% 0% 1.6% 88.9% -0.3% -0.1%
* LM=Last Month / L3M=Last 3 Months / PYM=Same Month Prior Year / LY=Last Year / YTD = Year-to-date
Property Sales December Property sales were 19, up 11.8% from 17 in December of 2009 and 11.8% higher than the 17 sales last month. December 2010sales were at their highest level compared to December of 2009 and 2008. December YTD sales of 231 are running 51.0% ahead of last year'syear-to-date sales of 153.
Prices The Median Sales Price in December was $1,900,000, equal to $1,900,000 in December of 2009 and up 4.1% from $1,825,000 last month. TheAverage Sales Price in December was $2,584,805, up 17.8% from $2,193,549 in December of 2009 and up 24.2% from $2,081,212 last month.December 2010 ASP was at a mid range compared to December of 2009 and 2008.
MARKET ACTION REPORT
December 2010
City: Rancho Santa FeColdwell Banker, Rancho Santa Fe
Price Range: ALL | Properties: Single Family Home, Townhome, Condo
Based on information from Sandicor, Inc. for the period 1/1/2008 through 12/31/2010. Due to MLS reporting methods and allowable reporting policy, this data is onlyinformational and may not be completely accurate. Therefore, Coldwell Banker Residential Brokerage does not guarantee the data accuracy. Data maintained bythe MLS's may not reflect all real estate activity in the market.
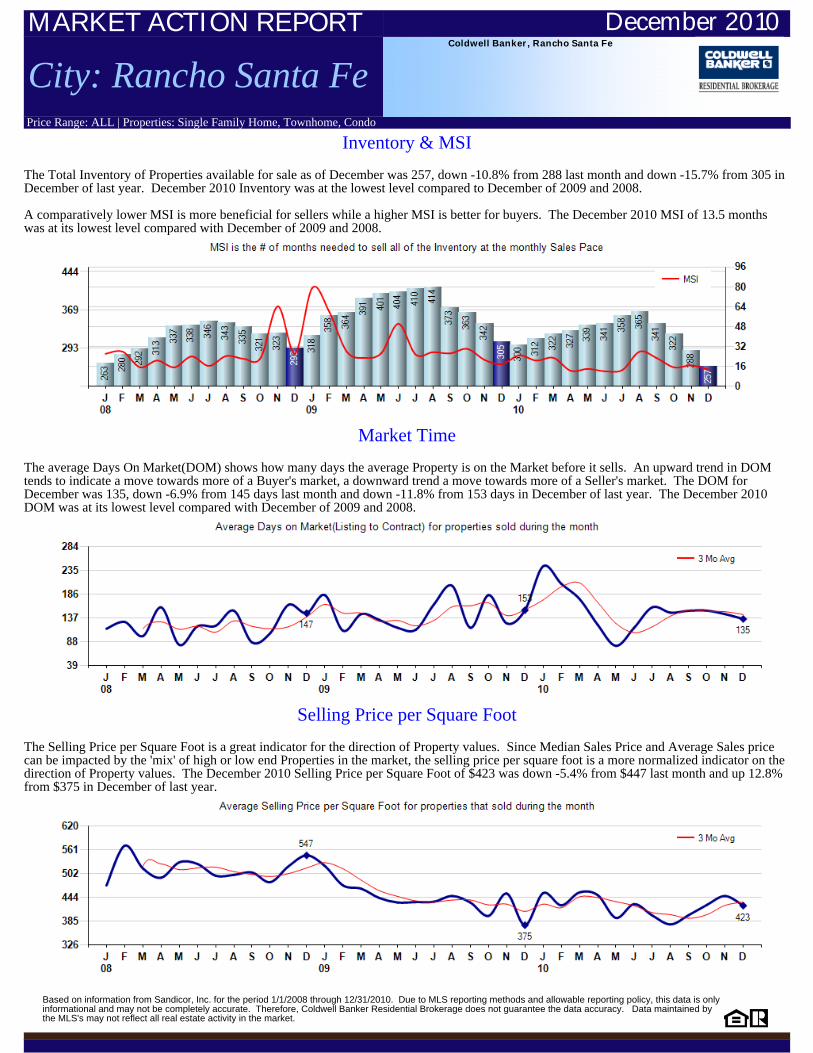
Inventory & MSI The Total Inventory of Properties available for sale as of December was 257, down -10.8% from 288 last month and down -15.7% from 305 inDecember of last year. December 2010 Inventory was at the lowest level compared to December of 2009 and 2008. A comparatively lower MSI is more beneficial for sellers while a higher MSI is better for buyers. The December 2010 MSI of 13.5 monthswas at its lowest level compared with December of 2009 and 2008.
Market Time The average Days On Market(DOM) shows how many days the average Property is on the Market before it sells. An upward trend in DOMtends to indicate a move towards more of a Buyer's market, a downward trend a move towards more of a Seller's market. The DOM forDecember was 135, down -6.9% from 145 days last month and down -11.8% from 153 days in December of last year. The December 2010DOM was at its lowest level compared with December of 2009 and 2008.
Selling Price per Square Foot The Selling Price per Square Foot is a great indicator for the direction of Property values. Since Median Sales Price and Average Sales pricecan be impacted by the 'mix' of high or low end Properties in the market, the selling price per square foot is a more normalized indicator on thedirection of Property values. The December 2010 Selling Price per Square Foot of $423 was down -5.4% from $447 last month and up 12.8%from $375 in December of last year.
MARKET ACTION REPORT
December 2010
City: Rancho Santa FeColdwell Banker, Rancho Santa Fe
Price Range: ALL | Properties: Single Family Home, Townhome, Condo
Based on information from Sandicor, Inc. for the period 1/1/2008 through 12/31/2010. Due to MLS reporting methods and allowable reporting policy, this data is onlyinformational and may not be completely accurate. Therefore, Coldwell Banker Residential Brokerage does not guarantee the data accuracy. Data maintained bythe MLS's may not reflect all real estate activity in the market.
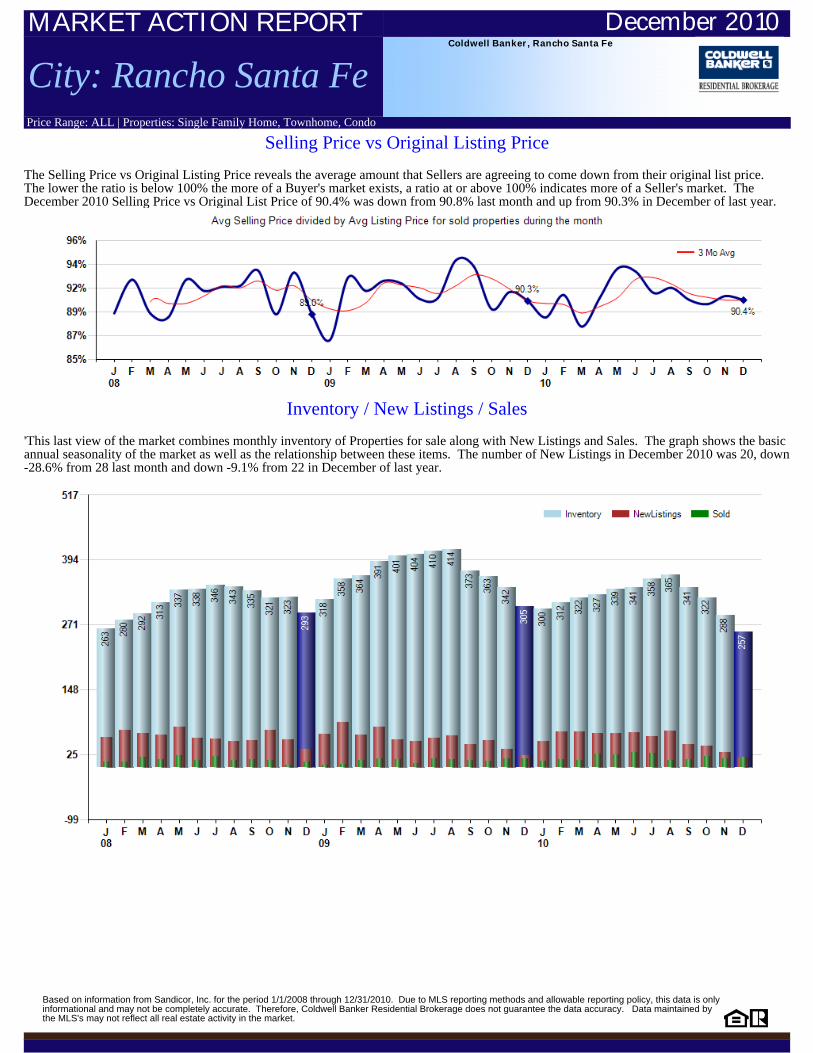
Selling Price vs Original Listing Price The Selling Price vs Original Listing Price reveals the average amount that Sellers are agreeing to come down from their original list price. The lower the ratio is below 100% the more of a Buyer's market exists, a ratio at or above 100% indicates more of a Seller's market. TheDecember 2010 Selling Price vs Original List Price of 90.4% was down from 90.8% last month and up from 90.3% in December of last year.
Inventory / New Listings / Sales 'This last view of the market combines monthly inventory of Properties for sale along with New Listings and Sales. The graph shows the basicannual seasonality of the market as well as the relationship between these items. The number of New Listings in December 2010 was 20, down-28.6% from 28 last month and down -9.1% from 22 in December of last year.
MARKET ACTION REPORT
December 2010
City: Rancho Santa FeColdwell Banker, Rancho Santa Fe
Price Range: ALL | Properties: Single Family Home, Townhome, Condo
Based on information from Sandicor, Inc. for the period 1/1/2008 through 12/31/2010. Due to MLS reporting methods and allowable reporting policy, this data is only informational and may not be completely accurate. Therefore, Coldwell Banker Residential Brokerage does not guarantee the data accuracy. Data maintained by the MLS's may not reflect all real estate activity in the market.
J 08 F M A M J J A S O N D J 09 F M A M J J A S O N D J 10 F M A M J J A S O N D
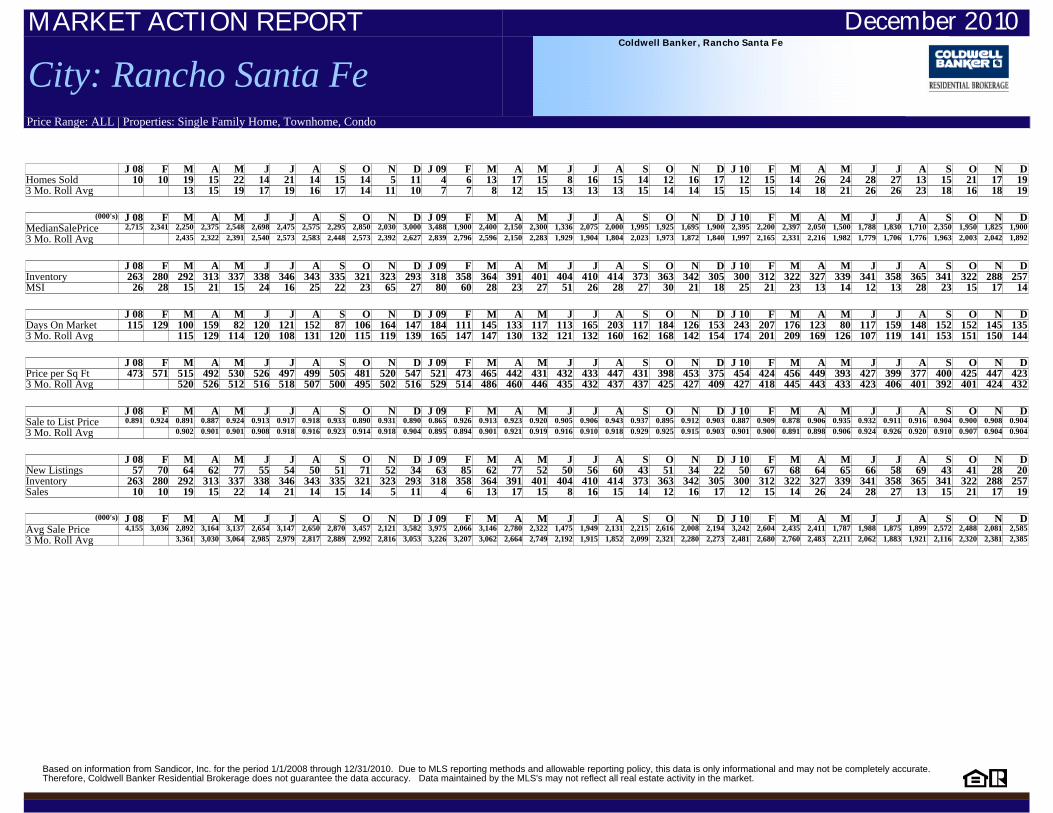
Homes Sold 10 10 19 15 22 14 21 14 15 14 5 11 4 6 13 17 15 8 16 15 14 12 16 17 12 15 14 26 24 28 27 13 15 21 17 193 Mo. Roll Avg 13 15 19 17 19 16 17 14 11 10 7 7 8 12 15 13 13 13 15 14 14 15 15 15 14 18 21 26 26 23 18 16 18 19
(000's) J 08 F M A M J J A S O N D J 09 F M A M J J A S O N D J 10 F M A M J J A S O N DMedianSalePrice 2,715 2,341 2,250 2,375 2,548 2,698 2,475 2,575 2,295 2,850 2,030 3,000 3,488 1,900 2,400 2,150 2,300 1,336 2,075 2,000 1,995 1,925 1,695 1,900 2,395 2,200 2,397 2,050 1,500 1,788 1,830 1,710 2,350 1,950 1,825 1,900
3 Mo. Roll Avg 2,435 2,322 2,391 2,540 2,573 2,583 2,448 2,573 2,392 2,627 2,839 2,796 2,596 2,150 2,283 1,929 1,904 1,804 2,023 1,973 1,872 1,840 1,997 2,165 2,331 2,216 1,982 1,779 1,706 1,776 1,963 2,003 2,042 1,892
J 08 F M A M J J A S O N D J 09 F M A M J J A S O N D J 10 F M A M J J A S O N D
Inventory 263 280 292 313 337 338 346 343 335 321 323 293 318 358 364 391 401 404 410 414 373 363 342 305 300 312 322 327 339 341 358 365 341 322 288 257MSI 26 28 15 21 15 24 16 25 22 23 65 27 80 60 28 23 27 51 26 28 27 30 21 18 25 21 23 13 14 12 13 28 23 15 17 14
J 08 F M A M J J A S O N D J 09 F M A M J J A S O N D J 10 F M A M J J A S O N DDays On Market 115 129 100 159 82 120 121 152 87 106 164 147 184 111 145 133 117 113 165 203 117 184 126 153 243 207 176 123 80 117 159 148 152 152 145 1353 Mo. Roll Avg 115 129 114 120 108 131 120 115 119 139 165 147 147 130 132 121 132 160 162 168 142 154 174 201 209 169 126 107 119 141 153 151 150 144
J 08 F M A M J J A S O N D J 09 F M A M J J A S O N D J 10 F M A M J J A S O N DPrice per Sq Ft 473 571 515 492 530 526 497 499 505 481 520 547 521 473 465 442 431 432 433 447 431 398 453 375 454 424 456 449 393 427 399 377 400 425 447 4233 Mo. Roll Avg 520 526 512 516 518 507 500 495 502 516 529 514 486 460 446 435 432 437 437 425 427 409 427 418 445 443 433 423 406 401 392 401 424 432
J 08 F M A M J J A S O N D J 09 F M A M J J A S O N D J 10 F M A M J J A S O N DSale to List Price 0.891 0.924 0.891 0.887 0.924 0.913 0.917 0.918 0.933 0.890 0.931 0.890 0.865 0.926 0.913 0.923 0.920 0.905 0.906 0.943 0.937 0.895 0.912 0.903 0.887 0.909 0.878 0.906 0.935 0.932 0.911 0.916 0.904 0.900 0.908 0.904
3 Mo. Roll Avg 0.902 0.901 0.901 0.908 0.918 0.916 0.923 0.914 0.918 0.904 0.895 0.894 0.901 0.921 0.919 0.916 0.910 0.918 0.929 0.925 0.915 0.903 0.901 0.900 0.891 0.898 0.906 0.924 0.926 0.920 0.910 0.907 0.904 0.904
J 08 F M A M J J A S O N D J 09 F M A M J J A S O N D J 10 F M A M J J A S O N D
New Listings 57 70 64 62 77 55 54 50 51 71 52 34 63 85 62 77 52 50 56 60 43 51 34 22 50 67 68 64 65 66 58 69 43 41 28 20Inventory 263 280 292 313 337 338 346 343 335 321 323 293 318 358 364 391 401 404 410 414 373 363 342 305 300 312 322 327 339 341 358 365 341 322 288 257Sales 10 10 19 15 22 14 21 14 15 14 5 11 4 6 13 17 15 8 16 15 14 12 16 17 12 15 14 26 24 28 27 13 15 21 17 19
(000's) J 08 F M A M J J A S O N D J 09 F M A M J J A S O N D J 10 F M A M J J A S O N DAvg Sale Price 4,155 3,036 2,892 3,164 3,137 2,654 3,147 2,650 2,870 3,457 2,121 3,582 3,975 2,066 3,146 2,780 2,322 1,475 1,949 2,131 2,215 2,616 2,008 2,194 3,242 2,604 2,435 2,411 1,787 1,988 1,875 1,899 2,572 2,488 2,081 2,585
3 Mo. Roll Avg 3,361 3,030 3,064 2,985 2,979 2,817 2,889 2,992 2,816 3,053 3,226 3,207 3,062 2,664 2,749 2,192 1,915 1,852 2,099 2,321 2,280 2,273 2,481 2,680 2,760 2,483 2,211 2,062 1,883 1,921 2,116 2,320 2,381 2,385