
December 2001 - Asian Development Bank · (31 December 2001) Currency Unit – Taka (Tk) $1.00 =...
36
CER: BAN 2002-02 December 2001
-
Upload
dinhnguyet -
Category
Documents
-
view
214 -
download
1
Transcript of December 2001 - Asian Development Bank · (31 December 2001) Currency Unit – Taka (Tk) $1.00 =...

CER: BAN 2002-02
December 2001
CURRENCY EQUIVALENTS
(31 December 2001) Currency Unit – Taka (Tk) $1.00 = Tk57.00 Tk1.00 = $0.0175
ABBREVIATIONS
ACU – Asian Clearing Union ADP – Annual Development Program DFI – development finance institution GDP – gross domestic product FDI – foreign direct investment LGED – Local Government Engineering Department MFA – Multi Fiber Arrangement NCB – nationalized commercial bank NPL – nonperforming loan RHD – Roads and Highways Department RMG – ready-made garments SME – small and medium enterprise SOE – state-owned enterprise VAT – value-added tax
NOTES
(i) The fiscal year (FY) of the Government ends on 30 June. FY before a calendar year denotes the year in which the fiscal year ends. For example, FY2001 begins on 1 July 2000 and ends on 30 June 2001.
(ii) In this report, “$” refers to US dollars.

CONTENTS MAP EXECUTIVE SUMMARY i I. RECENT ECONOMIC DEVELOPMENTS 1
A. Growth, Employment, Savings, and Investment 1 B. Fiscal Developments 9 C. Monetary Developments and Prices 14 D. External Sector and Balance of Payments 16
II. SHORT- AND MEDIUM-TERM ECONOMIC PROSPECTS AND
POLICY ISSUES 18 STATISTICAL APPENDIX Table A.1 Key Macroeconomic Indicators Table A.2 Gross Domestic Product at Current Prices Table A.3 Gross Domestic Product at Constant Prices Table A.4 Sector Growth Rates of GDP at Constant Prices Table A.5 Balance of Payments Table A.6 Revenue and Expenditure of the Government Table A.7 Consumer Price Index, National Table A.8 Major Social Indicators BRM’s Economics Unit prepared this CER.


EXECUTIVE SUMMARY
During FY2001 (ending 30 June), Bangladesh maintained robust economic growth with record low inflation despite lingering external and fiscal pressures. Successive bumper harvests and a rebounding industry sector contributed to the strong economic growth during FY2001. During the previous two years, the country succeeded in breaking the 5 percent growth barrier that persisted in the 1990s. Economic growth in Bangladesh over past two years exceeded the average of South and Southeast Asian countries. However, per capita income in Bangladesh is at the lower end among these countries, and extensive poverty continues to afflict around half of the population.
The gross domestic product (GDP) growth rate in FY2001 was about 6 percent, close to the 5.9 percent achieved in FY2000. As in last few years, the agriculture sector accounted for 25 percent of GDP and continued to show strong performance particularly the foodgrain subsector. The industry sector grew by 8.7 percent in FY2001 compared with 6.2 percent in FY2000, due mainly to a surge in manufacturing output. The recovery in manufacturing output from prolonged recession is encouraging, given the lingering political disruption and mounting infrastructure constraints in the country. During FY2001, growth in the services sector was 5.2 percent as against 5.5 percent in the previous year. In this sector, transport, communications, financial, public administration, defense, health, and social work services recorded notable progress.
Despite the strong revenue outcomes for FY2001, the budget deficit of the central
Government remained high at 6.0 percent of GDP on account of a surge in expenditure. Monetary policy remained expansionary during FY2001 due to a spurt in domestic credit, notwithstanding deceleration in broad money (M2) growth to 16.6 percent in June 2001 from 18.6 percent in June 2000. Although the growth of government credit from the banking system declined, it still remained high and crowded out private sector access to credit at lower interest rates.
The inflation rate, based on the consumer price index, declined from 3.4 percent in
FY2000 to 1.5 percent in FY2001. A decline in food prices due to increased availability of foodgrains and somewhat depressed demand for nonfood items contributed to this decline. Food inflation declined from 4.1 percent in FY2000 to 0.95 percent in FY2001, while nonfood inflation remained unchanged at around 2.7 percent. Declining food prices outweighed the inflationary impact of monetary expansion. Although the relationship between broad money and inflation is complex in Bangladesh, the expansionary monetary policy may ultimately imperil price stability.
Exports grew at a rate of 12.4 percent in FY2001 compared with 8.2 percent in the previous year. However, export growth decelerated sharply as the year progressed. The export structure of Bangladesh is narrow–concentrating on ready-made garments and knitwear for around 75 percent of total exports. For maintaining a high level of exports, especially after the phase-out of the Multi Fiber Arrangement by the end of 2004, the Government needs to adopt appropriate policy measures to diversify the export base as well as markets; maintain external competitiveness; and improve infrastructure including transport, telecommunication, and port facilities. In FY2001, import growth increased to 11.4 percent from 4.8 percent in the previous year. Trade deficit increased by 9.3 percent in FY2001 over the previous fiscal year. Along with this, a decline in private current transfers including remittances created a current account deficit of $1,034 million (2.1 percent of GDP) compared with $441 million (1 percent of GDP) in FY2000. Despite mild improvement in the capital account, the overall balance deteriorated,

ii
resulting in an erosion of foreign exchange reserves, which were only $1.3 billion (1.7 months’ equivalent of imports) at the end of FY2001 compared with $1.6 billion (2.3 months’ equivalent) at the end of FY2000.
The slowdown in the global economy and heightened external pressures have
aggravated Bangladesh’s macroeconomic performance since the beginning of FY2002. In addition, the tragic incident of 11 September 2001 and subsequent developments have added further to the downside risks. The weakening external environment has considerably undermined the country’s short- and medium-term prospects for economic growth and consequent poverty reduction. The decline in exports and erosion in confidence of domestic and foreign investors point to a continuing economic downturn.
Given the weakening global environment and emerging domestic developments, the
GDP growth rate during FY2002 is expected to be around 4.0-4.5 percent compared with 6 percent achieved during FY2001, mainly due to mounting external pressures and lower growth in the agriculture sector. Heightened external pressures will particularly affect export-oriented manufacturing production, export trade-related services, remittances, and foreign direct investment. During FY2002, the current account deficit is likely to increase to 2.3 percent of GDP from 2.1 percent last year on the assumption of an 8 percent decline in exports, a 5 percent decline in imports, and tapering off of the recent spurt in remittances. The budget deficit is expected to remain high at 6 percent of GDP, mainly on account of shortfall in revenue collection. Over the medium term, i.e., in FY2003 and FY2004, the economic growth prospects of the country should improve, depending on recovery in the global economy, development in the external environment, and progress in the country’s structural and economic reforms.
Bangladesh is confronting considerable external and domestic risks over the short to medium term which could imperil macroeconomic stability, thereby seriously undermining economic growth prospects and consequent poverty reduction. If the downturn in the global economy lingers, the adverse impact on the country’s real and external sectors could be severe. The overall balance of payments situation may deteriorate substantially with a rapid slide in foreign exchange reserves. There could be more severe pressures on the fiscal balance as a result of lower economic activity and reduced imports. The policy measures announced by the Government may prove inadequate to address the slippage in the external and fiscal balances. On the domestic front, there are considerable risks that political instability and law and order problems, as in the past few years, may continue to undermine the economic growth prospects in the country. Consensus between the ruling and opposition political parties on substantive national issues will be extremely important if the Government is to carry out much-needed critical reform measures.

I. RECENT ECONOMIC DEVELOPMENTS
A. Growth, Employment, Savings, and Investment
1. Aggregate Growth 1. During FY2001 (ending 30 June), Bangladesh maintained robust economic growth with record low inflation despite lingering external and fiscal pressures. However, the weakening global environment and emerging external imbalance put mounting pressures on economic performance towards the end of FY2001. Successive bumper harvests and a rebounding industry sector contributed to the strong economic growth during FY2001. Foodgrain self-sufficiency is no longer a dream: For two consecutive years, the country has produced foodgrains in excess of domestic requirements (Figure 2). The manufacturing sector has also recovered sharply from the lackluster performance of the preceding two years. During the previous two years, the country succeeded in breaking the 5 percent growth barrier that persisted in the 1990s by achieving around a 6 percent average growth rate. Economic growth in Bangladesh over the past two years exceeded the average of South and Southeast Asian countries. However, per capita income in Bangladesh is at the lower end among these countries, and extensive poverty continues to afflict around half of the population.
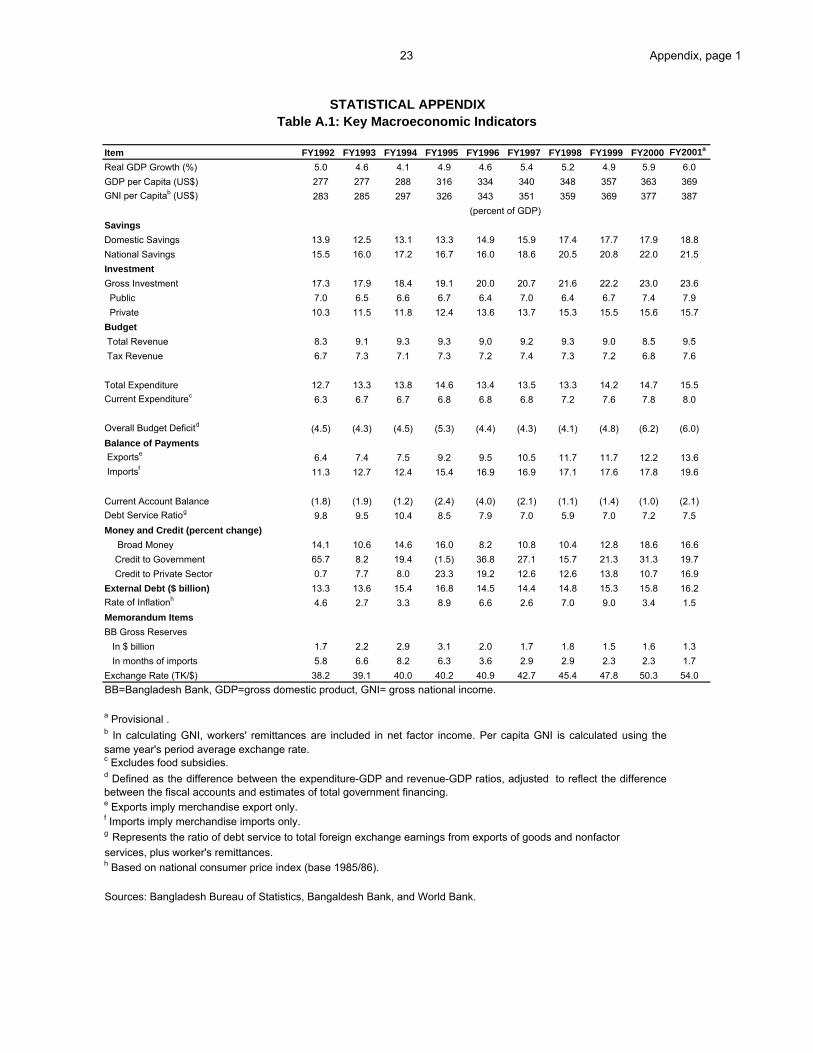
2. At the beginning of FY2001, the growth prospect for the year appeared somewhat bleak because of serious flooding. Although the floods caused extensive damage to standing crops and physical infrastructure in the southwestern region, the overall impact on the national economy was limited. The economy remained robust, and gross domestic product (GDP) growth rate in FY2001 was about 6 percent (Table 1 and Figure 1), close to the 5.9 percent achieved in FY2000.1 As in the last few years, the agriculture sector accounted for 25 percent of GDP, and continued to show strong performance, particularly the foodgrain subsector. The rate of per capita GDP growth, facilitated by the steady decline in population growth over recent years, increased to 4.7 percent in FY2001 compared with 4.6 percent in the preceding year. During this period, per capita gross national income increased to $387 from $377.
Table 1: Economic Growth by Sector
Growth Rate (%) FY1996 FY1997 FY1998 FY1999 FY2000 FY2001a
GDP Growth
4.6 5.4 5.2 4.9 5.9 6.0
Agriculture 3.1 6.0 3.2 4.8 7.4 5.0
Industry 7.0 5.8 8.3 4.9 6.2 8.7
Services 4.0 4.5 5.0 5.2 5.5 5.2
GDP = gross domestic product. a Provisional. Source: Bangladesh Bureau of Statistics.
1 Based on revised national accounts series (1995/96 base year), GDP growth rate for FY2000 has been revised
upward to 5.9 percent from the earlier estimate of 5.5 percent.

2
Source: Bangladesh Bureau of Statistics. 2. Sector Growth
3. During FY2001, the agriculture sector posted growth of 5 percent as against 7.4 percent in the previous year. Despite the large production increases that were registered by the sector, agriculture’s year-on-year growth rate was lower due to the high base for comparison following robust growth during successive recent years. The exceptional crop harvests contributed mainly to the growth performance of the agriculture sector, while the contributions of animal husbandry and forestry remained modest. The fishing subsector also showed a strong performance. Foodgrain production in FY2001 reached a record 26.8 million tons (rice: aus 1.9, aman 11.3, and boro 11.9 million tons; and wheat 1.7 million tons) 2 as against 24.9 million tons in FY2000, representing growth of 7.6 percent. Foodgrain production was over 2 million tons more than the domestic requirement (455 grams per day per capita).3 Favorable weather; extended irrigation; expansion of high yielding varieties; liberal credit policies; and the availability of diesel fuel, electricity, and urea fertilizer at lower prices contributed to the record harvests during recent years (Box 1).
2 Rice crops in Bangladesh are categorized according to growing season. Aus and aman are generally grown rain-
fed during March-July and July-November respectively. Boro is dry season rice grown with irrigation during December-May.
3 In the preceding year, production was about one million tons in excess of requirements.
Figure 1: Sector Growth
0.01.02.03.04.05.06.07.08.09.0
10.0
FY1996 FY1997 FY1998 FY1999 FY2000 FY2001
GDP Grow th Agriculture Industry Services

3
Box 1: Agricultural Growth Estimates The agricultural value added in the country increased notably in the second half of the 1990s, recording over 5 percent annual growth during 1997-2000 compared with 2 percent during 1991-1996. Foodgrain production more than doubled: Rice and wheat production increased from around 10 million tons per year in the early 1970s to 25 million tons by the late 1990s. Over the last two decades, reforms in the agriculture sector and the dismantling of state interventions have played a critical role in increasing agricultural production. The post reform period witnessed a decline in real food prices and a rise in agricultural productivity. As a result, the majority of households, particularly the poor, who are net purchasers of food, benefited. In addition to favorable weather and the increased availability of modern inputs, it is not clear how far methodological improvements of the revised national income estimates have contributed to recent high growth rates in agriculture compared with earlier periods. In the new national income estimates, revised estimation procedures for the agriculture sector (particularly the crop subsector) have been adopted. Several methodological changes have been made to provide a more accurate estimate of crop production. The sample size of the clustered survey has been increased from 5,733 to 9,348. Besides, the area and yield estimating procedures have been improved. The production data of crop subsector (especially rice and vegetables) and fish production have been reconciled and adjusted with the 1995/96 Household Expenditure Survey consumption figures. This has led to upward adjustments in production in most cases. In addition, the Early Warning and Food Information System has been launched by the Government to provide advance information on expected food production based on geographic information system and other techniques. Satellite images also generate crop area and production estimates, which are used in finalizing crop production data. All these developments indicate substantial methodological improvements in agricultural production statistics in the country. Since these changes have not been extrapolated to earlier years, it is somewhat difficult to analyze the trends. Similarly, noncrop agricultural production (e.g., livestock) is subject to a number of arbitrary estimates. 4. In view of the satisfactory position of foodgrain stocks during FY2001, the Government did not need to import any foodgrains commercially. Further, it imposed restrictions on the import of rice by the private sector to avoid a glut in the domestic market. Consecutive record harvests dampened the domestic prices. In FY2001, the price of coarse rice in nominal terms declined by 3 percent compared with FY2000 and by 16 percent compared with FY1999. Low foodgrain prices, while directly benefiting the poor, could induce some amount of diversion of production towards other crops in coming years. This could contribute to crop diversification in the agriculture sector. 5. The industry4 sector grew by 8.7 percent in FY2001, compared with 6.2 percent in FY2000, due mainly to a surge in manufacturing output. Growth in the manufacturing sector was 9.1 percent–substantially higher than the 4.8 percent in the previous year. The acceleration in the growth rate, albeit from a relatively depressed base, is attributable partly to expansionary macro policies and partly to the rapid expansion of export-oriented industries, viz., textiles including garments. Food processing, cement, chemicals, pharmaceuticals, toiletries, and steel output also expanded considerably. There was also an upturn in the output of small-scale industries (Box 2). However, the traditional jute industry stagnated. A sharp surge in credit to the private sector and an increase in imports of raw materials and machinery contributed to a rebounding of the manufacturing sector. The recovery in manufacturing output from the prolonged recession is encouraging, given the lingering political disruption and mounting infrastructure constraints in the country. 4 The industry sector comprises mining and quarrying, manufacturing, power, gas, water, and construction.

4
Source: Bangladesh Bureau of Statistics. 6. Although policy reforms removed all restrictions on private investments, the manufacturing sector’s structure continues to be narrow and undiversified, with heavy concentration on textiles and food processing for over 60 percent of output. Whether the country can sustain higher growth in the manufacturing sector will depend to a great extent on upgrading its fragile infrastructure and implementing key reforms to foster private sector development. Besides, a major issue facing Bangladesh is whether it can (i) maintain its international competitiveness in the garments industry; and (ii) succeed in broadening the export base, especially with the elimination by the end of 2004 of the quotas in North America under the Multi Fiber Arrangement (MFA). In the industry sector, the growth of value added in electricity, gas, and water supply together was 7.0 percent, only marginally higher than the preceding year. During the year, the production of natural gas and net electricity generation increased sharply by 15.9 percent and 10.3 percent, respectively. Progress achieved in energy sector reforms includes functional unbundling, tariff adjustment and rationalization, and fostering private sector participation in power generation. The growth of construction declined slightly to 7.9 percent from 8.5 percent in the preceding year. New construction has slowed down, as there is apparently a glut in the supply of apartments, office spaces, and shopping malls. During FY2001, growth in the services sector was 5.2 percent as against 5.5 percent in the previous year. In this sector, transport, communications, financial, public administration, defense, health, and social work services recorded notable progress.
Figure 2: Foodgrain Production
19.2 18.1 19.1 20.3 20.7 21.8
24.926.8
0
5
10
15
20
25
30
FY1994 FY1995 FY1996 FY1997 FY1998 FY1999 FY2000 FY2001

5
Box 2: Small and Medium Enterprises In Bangladesh, small and medium enterprises (SMEs) are significant contributors to manufacturing growth and employment creation. There are around 27,000 medium-sized enterprises and around 150,000 small-scale enterprises in the country. Comprising 80 percent of manufacturing establishments, SMEs account for 80 percent of the labor force and 50 percent of the output of the sector. SMEs provide vital linkages to larger enterprises, particularly in the high-growth export sector, and also form part of the core business activities in both rural and urban areas. The garments industry contributed to SME development through orders for accessories, packaging materials, etc., while the footwear industry increased subcontracts to SMEs. In addition, agroprocessing and poultry have recently emerged as important activities for the development of SMEs.
Over the past decades, SMEs have contributed significantly to fostering labor- intensive growth and reducing poverty. However, the lack of reliable data and information precludes a comprehensive analysis of the constraints and potentials of these enterprises. SMEs are handicapped from realizing their full potential due to a wide range of problems including shortage of capital, lack of access to institutional credit, poor infrastructure, difficulty in acquiring basic materials, unfavorable policy environment, and limited business development skills. Their production processes are often marked by outdated technologies. Further, there are considerable concerns that the adverse implications of termination of the Multi Fiber Arrangement (MFA) by the end of 2004 may seriously affect the SMEs, which have thrived with the growth of the garments industry. SMEs in general cannot offer the requisite collateral and meet the transaction costs for getting access to institutional credit. While banks and development finance institutions prefer assisting larger enterprises, and nongovernment organizations focus their activities on micro enterprises, the credit needs of SMEs are generally left unattended. Because of their limited range of investments, SMEs cannot raise capital from the stock market. They are often forced to borrow from informal sources at higher interest rates. SMEs also find it relatively more difficult to access key infrastructure including electricity and gas. The policy environment is not conducive to the growth of SMEs. They are subject to the same procedural rigors of registration, taxation, credit disbursement, export, and import as those for large enterprises, thus adding high costs to their operations. Large-scale smuggling of goods from across the border also puts SMEs at a competitive disadvantage, as they find it hard to cope with cheaper foreign goods. The low level of professional and managerial skills of entrepreneurs, lack of access to information and communication technology, poor access to market and related information, and difficulties in penetrating export markets also undermine the potential of SMEs. Besides, SMEs are not well organized themselves to represent and protect their interests.
Sustainable growth of SMEs will require addressing their problems in accessing credit, and infrastructure, and improving the policy environment, business development skills, and quality and timeliness of data on SMEs. Remittances from overseas Bangladeshis are a major source of foreign exchange for the country. Much of this money is used for consumption, real estate, and other nonproductive activities. Efforts need to be taken to harness these resources for investment in SMEs by providing information and imparting skills to the senders or recipients of overseas remittances.
3. Employment and Wages 7. Poverty remains extensive in Bangladesh, with around half of the population living below the poverty line. Over the course of the last decade, although the country achieved remarkable progress in human development, income poverty has declined by about only one percentage point per annum.

6
8. The Population Census 2001, conducted during the end of January 2001, revealed notable success in the drive to arrest the population growth rate in the country. On 22 January 2001, the enumerated population was 123.2 million, while the adjusted population after the postenumeration check was 129.3 million. The annual compound growth rate of the adjusted population in 2001 over the adjusted 1991 population census was 1.48 percent compared with 2.17 percent in the 1991 census. The average household size, according to preliminary figures in the 2001 census, was 4.8 persons compared with 5.5 persons in 1991, showing a decline in the size of the household during the last decade with the decline in the growth rate of population. The male-female ratio declined to 103.8 in 2001 from 106.1 in 1991. 9. The country faces a gigantic challenge to absorb about 2 million people entering the labor force annually on top of the large number of existing underemployed. The only avenue of employment for the growing labor force, which is currently expanding at almost twice the population growth rate, is self-employment in the low productive segments of the nonformal sector. Declining population growth has been more than offset by the increased participation rates of women. According to the 1995/96 labor force survey, the unemployment rate in Bangladesh was estimated at only 2.5 percent; this grossly underestimates the true rate and overlooks the large number of underemployed. According to some estimates, the unemployment rate in the country is over 25 percent. Agriculture accounts for 58 percent of employment; industry, 16 percent; and services, 26 percent. The garments industry, which has absorbed a large proportion of the population entering the labor market, especially females, seems to have become oversaturated. Moreover, the fate of the garments industry may be uncertain due to deterioration in the global business environment, and the forthcoming elimination by the end of 2004 of quotas under the MFA.
10. During recent years, the overseas job market employed about 250,000 Bangladeshis annually, and their remittances constituted about 4 percent of GDP. However, overseas job opportunities seem to be declining, with only around 230,000 leaving for jobs abroad during FY2001. 11. In terms of labor rights, Bangladesh generally has sound laws for protecting workers and providing the right of association and collective bargaining. However, due to weak enforcement machinery, the labor laws are not always effectively enforced. The Government in principle agreed to allow trade union activities in the export processing zones from 2004.
12. Although the wage level in Bangladesh is low, increases in real terms were maintained during recent years. Nominal wages during FY2001 increased by 4.2 percent as against FY2000. In real terms, the wages during the period rose by 3.3 percent.
4. Savings and Investment 13. Investment during FY2001 increased marginally to 23.6 percent of GDP from 23 percent during the preceding year (Figure 3). Public investment increased by 0.5 percentage points to 7.9 percent of GDP. However, private investment increased by only 0.1 percentage point to 15.7 percent of GDP, probably reflecting political uncertainty and loss of business confidence in the country. The gross national savings rate declined to 21.5 percent of GDP during FY2001 ― about 0.5 percentage points lower than the preceding year ― due mainly to a decline in overseas workers’ remittances. If the economy is to grow at 7-8 percent per annum, which is necessary for meeting the Government’s poverty reduction targets, then the savings and investment rates need to be substantially stepped up. In this context, the Government should

7
expedite implementation of financial sector reforms. A vibrant and efficient financial sector is the key to mobilizing potential savings and allocating them to the most efficient use. 14. Over the years, a number of policies have been adopted to facilitate the expansion of the private sector and increase the inflow of foreign investment. Facilities for domestic and foreign investment have been widened and several measures have been taken to attract private investment. There is no restriction on foreign equity participation and safeguard against expropriation is provided. Tax holidays, duty free import of capital machinery and raw materials for manufacturing of export items and other institutional and infrastructural facilities are given for domestic and foreign investors. New export processing zones have been established both in government and the private sector. During last few years, there has been some increase in foreign direct investment (FDI) inflows due to the opening up of gas, power, and telecommunications to the private sector including foreign investors. Important sectors such as manufacturing, in particular, have not been able to attract significant FDI. Inflows of FDI, based on balance of payments data, which amounted to $249 million in FY1998, declined in the following years and totaled only $174 million in FY2001.
Source: Bangladesh Bureau of Statistics.
Figure 3: Savings and Investment
0
5
10
15
20
25
30
FY1992 FY1993 FY1994 FY1995 FY1996 FY1997 FY1998 FY1999 FY2000 FY2001
Domestic Savings National Savings Gross Investments

8
Box 3: Roads/Highways and Rural Infrastructure The transport network in Bangladesh includes roads, railways, inland waterways, two maritime ports,
and civil aviation catering for both domestic and international traffic. Transport sector development contributes to the generation of economies of scale, reduced cost, integrated markets, systematic urbanization, export-led faster growth, and increased rural incomes with consequent poverty reduction.
Bangladesh witnessed a rapid expansion of road transport services in the 12 years ending in FY1997 with growth rates of 7.2 percent for passengers and 8.7 percent for freight. With the completion of the Jamuna Bridge, the volume of road transport for both passengers and freight has further increased over recent years. It is envisaged that road transport volume will increase by 8-9 percent per annum during the coming years. The traffic volume on major corridors will probably increase at an even faster pace. Excluding expenditures for the Jamuna Multipurpose Bridge, the road subsector expenditure for FY2000 was Tk 37.73 billion or about 1.7 percent of GDP. To support economic growth and balanced development through the different regions in Bangladesh, such a level of investment would have to be continued for the next few years.
The Fifth Five-Year Plan does stipulate the integrated “strategies” for roads/highways and rural infrastructure. However, the strategies themselves are not well defined. The Roads and Highways Department (RHD) and Local Government Engineering Department (LGED) each pursue its own strategies, which are sometimes not closely followed during implementation. Within the Annual Development Program (ADP), in addition to a set of normal development projects for national and regional highway improvement, RHD has umbrella projects with many subprojects. It is impossible to manage all these, and most of the funding is wasted. LGED is rapidly expanding earthen roads. This leads to two problems: First, many of these roads have overlapping population catchments whose communities can ill afford to lose the farmland necessary for road construction. Second, the Government is already overstretched by the maintenance needs of the current network.
Maintenance is critical to preserving the value of road assets. It is estimated that, while new construction and reconstruction or rehabilitation projects generally have rates of return between 8 and 20 percent, preventive maintenance activities often result in rates of return of 40-100 percent. As the traffic and length of paved roads increase sharply, proper maintenance for the entire network will become a major challenge to the road agencies. The maintenance issue needs to be addressed properly with adequate resources to protect the road assets that have been created over the years.
Much of the road network in Bangladesh is very narrow and in poor condition compared with international standards. The increasing traffic congestion on major highway corridors has resulted in high transport cost and hence exerted great strain on the economy. Thus, continuing capacity enhancement and replacing ferries with bridges on major highway corridors should remain the top priorities in order to reduce high vehicle operating cost and to support the national economic growth.
A well-functioning private market allocates resources efficiently, and, for this reason, private markets should have primacy in providing infrastructure and infrastructure services unless public sector intervention is warranted. The private sector can and should play a dominant role in construction and maintenance through government contracts. Wherever possible, the Government should contract construction and maintenance work to private enterprises since they tend to be much more efficient than traditional government-owned construction or maintenance units.
15. Even though Bangladesh offers attractive incentives to potential investors, and has a relatively liberal policy regime, the overall environment is not fully conducive to FDI, and there is a considerable gap between stated policies and their implementation. Besides, improvement in

9
infrastructure (Box 3) and transparency in the decision-making are needed for private sector development. Fostering growth of the private sector including inflows of FDI is critically dependent on addressing these constraints, creating a stable macroeconomic environment, developing efficient sources of capital for investment, and hastening the pace of financial and other key sector reforms.
16. Portfolio investment after recording an outflow $132 million in FY1997 following a stock market boom and bust has not returned in subsequent years. However, the Dhaka Stock Exchange’s all shares price index remained steady during FY2001, recording an increase of 27.6 percent over FY2000. The capital market is still at a nascent stage, with market capitalization amounting to only $1.27 billion at the end of FY2001 compared with $1.05 billion in the corresponding period of FY2000. Investors’ confidence in the stock market needs to be restored by further strengthening the regulatory framework and market infrastructure (trading, settlement, clearing, and depository systems), corporate governance of listed companies, issuers of listed securities, and other market institutions.
B. Fiscal Developments
17. The Government’s revenue increased notably in the early 1990s with the introduction of a revenue-productive value-added tax (VAT) system and wide-ranging reforms in trade taxes. However, the impressive performance could not be sustained in mid-1990s with systemic consolidation, expansion of coverage, and enhancing of efficiency. The much-needed procedural improvements in the newly introduced VAT system were not undertaken in the light of experience on the ground. A coherent framework was not adopted to logically extend the coverage of the VAT network. On the contrary, various ad-hoc measures, e.g., truncated bases of value for various items subject to VAT, were defined, largely compromising the integrity of the system. The list of exemptions was expanded. Effective training and publicity campaigns were not launched to educate and familiarize both the taxpayers and the tax collectors with the key systemic aspects of VAT. While, rates of customs duty were moderated downwards in the wake of the ongoing trade liberalization, the income tax and VAT could not fully take over the expected role of generating required revenue. At less than 9 percent of GDP in 2000, Bangladesh’s revenue generation effort remained substantially weak in comparison with other South Asian countries.5 Low revenue efforts imply a lack of adequate resources for matching the size of public expenditure required for infrastructure development and poverty reduction.
18. Fiscal deficits, which remained largely contained for the greater part of the decade, began to show rising trends during the last couple of years (Figure 4). While revenue growth tapered off, public expenditure increased rapidly. The recent years have witnessed changes in the financing pattern of fiscal deficit. Over the years, the proportion of deficit financed from external resources has decreased and, correspondingly, the proportion of domestic borrowing has increased. The costly domestic borrowing has pushed up the domestic interest payment obligations of the Government. The interest payment on domestic debt as a ratio of revenue—indicating debt-servicing capacity, has been rising—reaching 13.6 percent in FY2001. Borrowing from the banking system, especially the central bank, has also been the prime cause of monetary expansion.
5 In 2000, the ratio of revenue to GDP was 15.8 percent in India, 17.2 percent in Pakistan, and 16.7 percent in Sri
Lanka. Source: ADB. 2001: Asian Development Outlook. Hongkong: Oxford University Press.

10
Table 2: Selected Fiscal Indicators (percent of gross domestic product)
Item FY94 FY95 FY96 FY97 FY98 FY99 FY00 FY01(a) FY02 (b)
Total Revenue 9.3 9.3 9.0 9.2 9.2 9.0 8.5 9.5 9.8
Tax Revenue 7.1 7.3 7.2 7.4 7.3 7.2 6.8 7.6 7.8
Nontax Revenue 2.1 2.0 1.8 1.8 1.9 1.8 1.7 1.9 1.9
Total Expenditure 13.8 14.6 13.4 13.5 13.3 13.8 14.7 15.5 15.2
Current Expenditure 6.7 6.8 6.8 6.8 7.2 7.6 7.8 8.0 7.8
ADP 6.4 6.6 5.8 6.0 5.6 5.6 6.5 7.0 6.7
Overall Budget Deficit 4.5 5.3 4.5 4.3 4.1 4.8 6.2 6.0 5.4
Net Foreign Financing 3.7 3.8 2.8 2.8 2.4 2.4 2.5 2.5 2.8
Net Domestic Financing 0.8 1.5 1.7 1.5 1.6 2.4 3.7 3.5 2.6
Banking System (0.4) 0.3 0.9 0.9 0.6 0.9 1.5 1.5 0.8
Other Domestic 1.2 1.1 0.8 0.5 0.9 1.5 2.3 2.0 1.9
ADP= Annual Development Program. a Revised estimate. b Budget. Sources: Ministry of Finance, World Bank, and Bangladesh Bureau of Statistics.
19. Against the backdrop of the poor performance of the previous two fiscal years, revenue collection under the National Board of Revenue, which accounts for close to 95 percent of tax revenues and 75 percent of total revenues, recorded a growth of 24 percent in FY2001 over the previous year. This was an impressive achievement as it exceeded the budget target by 2 percent. All the major taxes registered high growth. Income tax receipts increased by 35 percent, supplementary duty by 28 percent, VAT by 23 percent, and customs duty by 19.4 percent. Better enforcement and monitoring and an increase in domestic economic activity led to the increase in income tax and domestic indirect taxes. An increase in imports and the introduction of a compulsory preshipment inspection system6 also contributed to the enhanced collection of import-based taxes. Nontax revenue collection, however, remained low as usual at around 2 percent of GDP in view of the losses incurred and reduced levels of profit earned by the state-owned enterprises (SOEs). The nonfinancial SOEs recorded a net loss of Tk33 billion or 1.3 percent of GDP in FY2001.
6 This is a procedure under which appointed agencies certify price, quantity, and quality of goods prior to shipment
with a view to expediting clearance of a consignment at the port of entry and also to facilitate collection of revenue.

11
B= Budget. Source: Ministry of Finance and World Bank. 20. Government expenditure increased from 13.8 percent of GDP in FY1999 to 14.7 percent in FY2000. In FY2001, the ratio of government expenditure to GDP increased to 15.5 percent. Current expenditure increased from 7.8 percent of GDP in FY2000 to 8 percent of GDP in FY2001, while the ADP increased from 6.5 percent of GDP in FY2000 to 7 percent of GDP in FY2001. In the FY2002 budget, the Government is aiming to reduce expenditure to 15.2 percent of GDP by bringing down current expenditure to 7.8 percent and ADP to 6.7 percent of GDP. The FY2002 budget allocates 14.6 percent of development and nondevelopment expenditures to the education sector, 6.9 percent to health, and 8.6 percent to defense. In the FY2002 budget, the allocation for transport and communications is 10.8 percent and that for energy is 7 percent. Domestic sources will provide 48 percent of the total financing of the ADP. Of the domestic funding, 23 percent will be from banking sources as against 40 percent in FY2001. The reduced reliance on bank borrowing, while being a welcome step from the point of view of macroeconomic stability, may be hard to realize if the impressive revenue performance of FY2001 is not sustained. The ADP contains certain low priority projects as well as projects of questionable merit.
21. The FY2002 budget projects a revenue of 9.8 percent of GDP, which is 0.3 percentage point higher than the level achieved in FY2001. The projection is somewhat overambitious, given the depressed external environment and its likely impact on the domestic economy. The highly impressive revenue performance of FY2001 understandably influenced the setting of an ambitious target for FY2002. For increasing revenue, the budget relies on improving the efficiency of tax administration, modernizing the tax collection process, closer monitoring and supervision, expanding the tax base, and increasing duty rates (Box 4). 22. Despite the strong revenue outcomes for the year, the budget deficit of the central Government in FY2001 remained high at 6.0 percent of GDP. Net foreign financing was 2.5 percent of GDP—the same level as of FY2000, while net domestic financing declined from 3.7 percent to 3.5 percent of GDP in FY2001. Domestic bank borrowing, which recorded a sharp rise to 1.5 percent of GDP in FY2000, remained unchanged in FY2001. The FY2002 budget seeks to reduce reliance on domestic financing to 2.6 percent of GDP and bank borrowing to 0.8 percent of GDP in a bid to bring down the fiscal deficit to 5.4 percent of GDP. In the
Figure 4: Fiscal Situation
(10.0)
(5.0)
0.0
5.0
10.0
15.0
20.0
FY1992 FY1993 FY1994 FY1995 FY1996 FY1997 FY1998 FY1999 FY2000 FY2001 FY2002(B)
Perc
ent o
f GDP
Total Revenue Total Expenditure Overall Budget Deficit

12
backdrop of the lower than expected revenue performance that is likely to be realized in FY2001, unless measures are taken to curtail expenditures of an unproductive and low priority nature, there is a strong possibility that domestic borrowing might rise to levels similar to that of the past two years. Domestic borrowing is costly in terms of interest liabilities. Based on budget projections, interest payment liabilities are likely to be 13.2 percent of revenue earnings in FY2002.
Box 4: Important Budgetary Measures for FY2002
Income Taxes. Measures were introduced in the FY2002 budget to simplify tax collection, create
a favorable investment climate, expand the tax base, reduce evasion, and accelerate the pace of domestic resource mobilization. The limit of income for payment of advance income tax has been raised from Tk100,000 to Tk200,000. For bringing discipline to the corporate sector and widening the tax base, submission of tax returns has been declared mandatory for all companies. The provision of deduction of tax at source by airlines on agency commissions paid to travel agents has been abolished. A tax holiday up to June 2005 has been granted to income from the production of poultry feed, seed production, and marketing of locally produced seeds.
Indirect Taxes. The four-slab structure of tariff rates remains unchanged with 5 percent for basic
raw materials, 15 and 25 percent for intermediate products, and 37.5 percent for finished goods. In the interest of industrialization of the country, duty rates on basic raw materials and intermediate goods were further reduced. For protecting local industries, duty rates on certain finished goods were enhanced. The budget introduced certain measures for promotion of exports, such as reduction of duty on refer containers from 25 to 15 percent and reduction of duty on some raw materials used in the melamine industry. As an environment-friendly measure, the duty on four-stroke compressed natural gas (CNG) driven, as well as electric battery operated three-wheeler was reduced from 37.5 to 15 percent. For patronizing agro-based industries, duty rates on certain raw materials used in them were reduced. For encouraging backward linkage industries in the textile sector, the budget introduced measures reducing duties on textile spares and on raw materials for textile spares. Systemic, operational, and administrative improvements in the collection of VAT and supplementary duties were introduced in the budget for increasing resource mobilization, improving equity, streamlining procedures, and enhancing the transparency and accountability of the tax structure.
Other Important Proposals. The FY2002 budget proposes setting up of a revenue commission
for advising the Government on ways to increase mobilization of domestic resources. The budget also proposes to set up an expenditure commission. The budget continues its support of poverty reduction programs, agricultural growth, and rural development. Social sector investment has received continued priority. A sizable investment is proposed in the power and gas sectors.

13
Box 5: Fiscal Developments and Priorities
A sustainable fiscal framework is essential for macroeconomic stability, private sector
development, higher growth, and faster poverty reduction.
The central Government’s fiscal deficit measure, based on the difference between government investment and saving levels, indicates fiscal deterioration, as the deficit increased from 0.5 percent of GDP in FY1998 to 2.3 percent in FY2001. Apart from the central Government, the public sector in Bangladesh comprises a sizable SOE as well as a large public financial sector including nationalized commercial banks (NCBs), development finance institutions (DFIs), and the Bangladesh Bank (the central bank). The deficits of the SOEs rose from 0.9 percent of GDP in FY1999 to 3.0 percent in FY2001. Ineffective governance, sizable implicit subsidies to consumers and producers through low tariffs and prices for SOE goods and services, and overstaffing continue to have crippling effects on SOE performance. Although the NCBs occupy a large share of Bangladesh’s banking system, they did not record any profit during the last decade. The DFIs also incurred losses during the same period. Bangladesh Bank has been generating net profits of around 0.35 percent of GDP, the bulk of which is shifted to the central Government as dividends. In terms of saving-investment difference, the consolidated public sector deficit (taking into account the central Government, SOEs, NCBs, DFIs and Bangladesh Bank) increased from 1.6 percent of GDP in FY1998 to 5.5 percent in FY2001. The rises in the deficits of the central Government and the SOEs largely contributed to this deterioration in fiscal position. Out of 586 SOEs, 502 have been disinvested till FY2001. The present Government has undertaken an Action Plan to stop the loss of the SOEs and gradually unbundling those to the private sector. Public deficits pushed the net liabilities of the consolidated public sector upward from 44.1 percent of GDP in FY1998 to 55.5 percent in FY2001. Net foreign liabilities of the consolidated public sector have remained steady at around 33 percent of GDP in recent years. But the net domestic liabilities of the consolidated public sector increased sharply during the last three years from 6.6 percent of GDP in FY1999 to around 16 percent in FY2001. The actual level of primary fiscal deficit (based on conventional measure) of the Government in FY2001 was 4.4 percent of GDP, which is significantly higher than the sustainable level of 2.7 percent. This would require a reduction of the Government's overall budget deficit by 1.3 percentage points of GDP from 6.0 percent of GDP in FY2001 to 4.7 percent, which will prove difficult unless expenditures are cut drastically and revenues are raised substantially. The deficits for the consolidated public sector are equally unsustainable in view of the rising debt-GDP ratio. This implies that in the long run, in the absence of low domestic and foreign interest rates as well as the foreign grants that are available at present, substantial reduction in actual deficit will be required to ensure continued sustainability.
Financing of growing consolidated public sector deficits through domestic bank and nonbank borrowing reduces bank credit available to the private sector, increasing domestic interest rates and resulting in lower private investment and economic growth. Empirical results obtained from estimating standard models for domestic bank lending rates, private investment rates, and per capita GDP growth for Bangladesh provide strong evidence that domestic public borrowing exerts a strong upward pressure on domestic interest rates. The expansionary fiscal policy results in large negative long-term effects on private investment and aggregate growth. An assessment of the short-term effects of fiscal expansion, using a computable general equilibrium model, also indicates that an increase in domestic borrowing leads to a sharp rise in real interest rates and crowds out private sector spending. Because of the negative growth effects, expansionary fiscal policies can have adverse implications for income distribution and poverty reduction. The attendant inflation can also affect real wages. On the contrary, there is considerable international evidence that a sustainable and prudent fiscal stance, with low fiscal deficit and low inflation, can contribute to growth and poverty reduction, as fiscal stabilization leads to rapid growth, as well as raising average incomes, including those of the poor.

14
23. Fiscal management, of both the central Government and the consolidated public sector, has been unsustainable in recent years (Box 5). For ensuring macroeconomic stability, it is essential to maintain a sustainable fiscal framework by emphasizing mobilization of domestic resources, containing unproductive expenditure, dropping low priority projects, improving utilization of external aid, and addressing losses of SOEs and nonperforming assets in the banking system. C. Monetary Developments and Prices 24. Monetary policy remained expansionary during FY2001 due to a spurt in domestic credit, although broad money (M2) growth decelerated to 16.6 percent in June 2001 from 18.6 percent in June 2000 (Figure 5 and Table 3). The growth rate of domestic credit increased from 13.6 percent in FY2000 to 17.7 percent in FY2001, but the net foreign assets of the banking system, which increased by 32.7 percent in FY2000, declined by 16.6 percent in FY2001 due to the decline in international reserves. In addition to the decline in net foreign assets of the banking system, decline in the growth of credit to the central Government from 31.3 percent during FY2000 to 19.7 percent during FY2001 largely contributed to the deceleration in the growth of broad money. Growth of bank credit to the private sector increased from 10.7 percent in FY2000 to 16.9 percent during FY2001, indicating an increase in private sector economic activities. Steps taken by the Government to ease monetary and credit conditions during FY2000, e.g., lowering of the bank rate from 8 to 7 percent and of cash reserve requirements from 5 to 4 percent, and the withdrawal of the interest rate band for small and cottage industries and agriculture, appear to have contributed to the growth in credit to the private sector. Although the growth of government credit from the banking system declined, it still remained high and crowded out private sector access to credit at lower interest rates.
Source: Bangladesh Bank.
25. The inflation rate, based on the consumer price index, declined from 3.4 percent in FY2000 to 1.5 percent in FY2001. The decline in food prices due to increased availability of foodgrains, and a somewhat depressed demand for nonfood items contributed to this decline.
Figure 5: Money and Credit
-10.0
0.0
10.0
20.0
30.0
40.0
50.0
60.0
70.0
FY1992 FY1993 FY1994 FY1995 FY1996 FY1997 FY1998 FY1999 FY2000 FY2001
Perc
ent C
hang
e
Broad Money Credit to Government Credit to Private Sector

15
Food inflation declined from 4.1 percent in FY2000 to 0.95 percent in FY2001 while nonfood inflation remained unchanged at around 2.7 percent. Declining food prices outweighed the inflationary impact of monetary expansion. Although the relationship between broad money and inflation is complex in Bangladesh, expansionary monetary policy may ultimately imperil price stability.
Table 3: Monetary Survey (Tk billion, end of period)
Date
Net Foreign Assets
Net Domestic
Assets
Domestic
Credit
Central Govt. Net
Other Public Sector
Private Sector
Other Items Net
Broad Money
Money
Quasi Money
Reserve Money
June 1995 104.64 321.81 360.85 46.14 49.07 265.65 -43.37 422.12 131.79 290.33 106.30
June 1996 67.36 389.77 434.52 63.10 54.82 316.60 -44.72 456.85 144.59 312.26 110.03
June 1997 65.45 442.10 493.97 80.17 57.40 356.40 -51.87 506.28 151.67 354.61 123.94
June 1998 66.78 490.46 556.40 92.72 62.50 401.18 -65.94 558.69 158.89 399.81 136.18
June 1999 62.10 568.16 629.08 112.49 60.21 456.38 -60.91 630.27 172.49 457.77 147.43
June 2000 82.42 665.20 714.89 147.73 61.72 505.44 -49.69 747.62 198.81 548.81 170.65
June 2001 68.71 803.03 841.08 176.77 73.60 590.71 -38.05 871.74 223.47 648.27 189.27
Source: Bangladesh Bank.
26. Despite some significant policy reforms over recent years, Bangladesh's financial sector remains shallow and underdeveloped. The financial system, which is dominated by banking, is under stress mainly because of the large proportion of nonperforming loans (NPLs), low recovery rates, high spreads to cover provisioning and management costs, weak institutional capacity of the banking system, and deficient legal framework. Many banks, mainly the nationalized commercial banks (NCBs), are unable to meet the capital adequacy ratio.7 A well-developed long-term debt market is yet to emerge. There is a lack of competition in the banking sector, with the NCBs occupying a dominant position. The banks are beset by administrative and governance problems. Although some improvement has taken place, NPLs are still high: As of June 2001, the gross NPLs of scheduled banks were about 34 percent. In order to improve loan recovery and performance of the banking system, the Government has been pursuing legal reforms by amending the existing laws and enacting new laws. A new Bill for Money Loan Court Act has also been approved by the Cabinet. Recently, banks have taken a number of measures to recover loans. As a result, the NPLs of both NCBs and private commercial banks declined from 39 percent and 22 percent as of December 2000 to 38 percent and 20 percent respectively in September 2001. Recovery of loans suffered due to political influence, institutional constraints faced by the banking system and weak enforcement. The level of operational efficiency and financial discipline at the NCBs is low, and their lending to loss-incurring SOEs continues. The process of court settlement of cases has been very slow, resulting in a huge backlog of unresolved cases. Although a number of defaulting borrowers have been placed in receivership, the banks are unable to recover loans from them. The central bank cannot conduct its supervisory and regulatory functions effectively, as it is institutionally weak and lacks the required independence. Reforms at the central bank involving manpower rationalization have also stalled.
7 Minimum 8 percent of risk-weighted assets, with at least 4 percent in core capital.

16
D. External Sector and Balance of Payments 27. During the 1990s, major progress was made in trade policy reforms by significant elimination of quantitative restrictions and reduction of tariff rates. However, the pace of trade liberalization witnessed in the early part of the 1990s became more gradual and moderate in the later part of the decade. Although the procompetitive effects of liberalization could bring substantial benefits to an economy, the policy stance reflected a concern for protection of domestic industries. In FY2001, the four-slab duty structure of FY2000 was kept unchanged. Duty rates on raw materials and intermediate goods were generally reduced, evidently to increase protection to value added. For supporting local industries, duty rates on certain items were raised. The average (unweighted) tariff rate stayed at around 17 percent. As in the previous fiscal year, no major trade policy changes were introduced in the FY2002 budget, and an identical rate structure and approach to rate adjustments were followed.
Table 4: Key Balance of Payments Indicators
Item
FY1995
FY1996
FY1997
FY1998
FY1999
FY2000
FY2001
Export (growth %) 37.1 11.8 14.0 16.8 2.9 8.2 12.4
Import (growth %) 39.2 19.1 3.1 5.1 6.6 4.8 11.4
Remittance ($ billion) 1.2 1.2 1.5 1.5 1.7 2.0 1.9
Current Account Deficit (% of GDP)
2.4 4.0 2.1 1.1 1.4 1.0 2.1
Foreign Exchange Reserve ($ billion)
3.1 2.0 1.7 1.8 1.5 1.6 1.3
In months of Imports 6.3 3.6 2.9 2.9 2.3 2.3 1.7
Source: Export Promotion Bureau and Bangladesh Bank. 28. Exports grew at a rate of 12.4 percent in FY2001 compared with 8.2 percent in the previous year (Table 4). However, export growth decelerated sharply as the year progressed. Overall exports grew at a rate of 25.4 percent in the first quarter of the fiscal year (July-September 2000) compared with the first quarter of the previous year. The growth rate dropped to 21.1 percent during the second quarter (October-December 2000). There was a steep decline in growth to only 1.3 percent in the third quarter (January-March 2001) and 3.6 percent in the fourth quarter (April-June 2001). This deceleration in aggregate exports has been caused by a progressive reduction in the growth rate of export of ready-made garments (RMG). In addition to global recession, the enactment of the US Trade and Development Act of 2000, granting duty- and quota-free access to RMG exports from 72 sub-Saharan and Caribbean countries into the US market, also adversely affected exports of RMG from Bangladesh. The prolonged political disturbance and infrastructure bottlenecks such as port congestion and frequent power outages also contributed to the deceleration in exports. 29. The export structure of Bangladesh is narrow, with RMG and knitwear constituting about 75 percent of total exports. To maintain, a high level of exports, especially after the phase-out of the MFA by the end of 2004, the Government will need to adopt appropriate policy measures to diversify the export base; maintain external competitiveness; and improve infrastructure including transport, telecommunications, and port facilities.
17
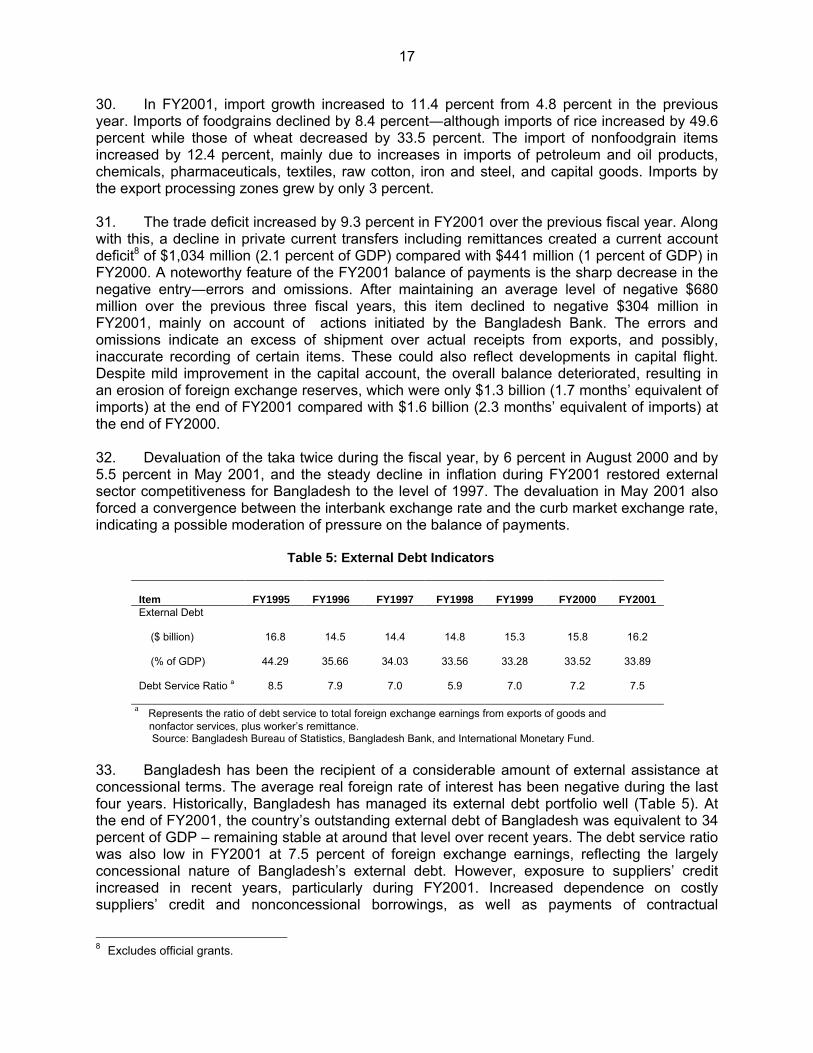
30. In FY2001, import growth increased to 11.4 percent from 4.8 percent in the previous year. Imports of foodgrains declined by 8.4 percent―although imports of rice increased by 49.6 percent while those of wheat decreased by 33.5 percent. The import of nonfoodgrain items increased by 12.4 percent, mainly due to increases in imports of petroleum and oil products, chemicals, pharmaceuticals, textiles, raw cotton, iron and steel, and capital goods. Imports by the export processing zones grew by only 3 percent. 31. The trade deficit increased by 9.3 percent in FY2001 over the previous fiscal year. Along with this, a decline in private current transfers including remittances created a current account deficit8 of $1,034 million (2.1 percent of GDP) compared with $441 million (1 percent of GDP) in FY2000. A noteworthy feature of the FY2001 balance of payments is the sharp decrease in the negative entry―errors and omissions. After maintaining an average level of negative $680 million over the previous three fiscal years, this item declined to negative $304 million in FY2001, mainly on account of actions initiated by the Bangladesh Bank. The errors and omissions indicate an excess of shipment over actual receipts from exports, and possibly, inaccurate recording of certain items. These could also reflect developments in capital flight. Despite mild improvement in the capital account, the overall balance deteriorated, resulting in an erosion of foreign exchange reserves, which were only $1.3 billion (1.7 months’ equivalent of imports) at the end of FY2001 compared with $1.6 billion (2.3 months’ equivalent of imports) at the end of FY2000.
32. Devaluation of the taka twice during the fiscal year, by 6 percent in August 2000 and by 5.5 percent in May 2001, and the steady decline in inflation during FY2001 restored external sector competitiveness for Bangladesh to the level of 1997. The devaluation in May 2001 also forced a convergence between the interbank exchange rate and the curb market exchange rate, indicating a possible moderation of pressure on the balance of payments.
Table 5: External Debt Indicators
Item
FY1995
FY1996
FY1997
FY1998
FY1999
FY2000
FY2001
External Debt
($ billion) 16.8 14.5 14.4 14.8 15.3 15.8 16.2
(% of GDP) 44.29 35.66 34.03 33.56 33.28 33.52 33.89
Debt Service Ratio a 8.5 7.9 7.0 5.9 7.0 7.2 7.5
a Represents the ratio of debt service to total foreign exchange earnings from exports of goods and nonfactor services, plus worker’s remittance. Source: Bangladesh Bureau of Statistics, Bangladesh Bank, and International Monetary Fund. 33. Bangladesh has been the recipient of a considerable amount of external assistance at concessional terms. The average real foreign rate of interest has been negative during the last four years. Historically, Bangladesh has managed its external debt portfolio well (Table 5). At the end of FY2001, the country’s outstanding external debt of Bangladesh was equivalent to 34 percent of GDP – remaining stable at around that level over recent years. The debt service ratio was also low in FY2001 at 7.5 percent of foreign exchange earnings, reflecting the largely concessional nature of Bangladesh’s external debt. However, exposure to suppliers’ credit increased in recent years, particularly during FY2001. Increased dependence on costly suppliers’ credit and nonconcessional borrowings, as well as payments of contractual
8 Excludes official grants.

18
obligations in the energy sector, can exert pressure on the balance of payments in the coming years.
Source: Bangladesh Bank II. SHORT– AND MEDIUM–TERM ECONOMIC PROSPECTS AND POLICY ISSUES 34. The slowdown in the global economy and heightened external pressures have aggravated Bangladesh’s macroeconomic performance since the beginning of FY2002. In addition, the tragic incident of 11 September 2001 and subsequent developments have added to the downside risks. The weakening external environment has considerably undermined the country’s short- and medium-term prospects for economic growth and consequent poverty reduction. The decline in exports and erosion in confidence of domestic and foreign investors point to a continuing economic downturn. 35. Exports from Bangladesh are already showing signs of sharp deceleration, as three fourths of the country’s total exports are concentrated in RMG and knitwear, which are again focused on two markets, the European Union and the United States. Other notable export items like frozen foods and leather are also destined for western markets. A reduction in exports from Bangladesh will have adverse impacts on the economy through both direct and indirect channels in terms of lower GDP growth, lower investments and savings, mounting external and fiscal imbalances, increase in unemployment, and rise in poverty. Because of the interdependence among sectors in the economy, an export slowdown will affect different production and service sectors. Production in export sectors like RMG, knitwear, and frozen food will suffer a serious setback in response to the drop in world demand for such goods. There will also be severe effects on the backward linkage industries to RMG. An unfavorable external environment will also negatively affect services like trade and transport, banking, insurance, and ports and shipping, given the integrated structure of the economy. A decline in production and service activities throughout the economy will imply a general slowdown in the domestic economy and a fall in imports, with negative impact on revenue earnings for the Government. The loss in employment in the sectors immediately affected by the global
Figure 6: Foreign Exchange Reserves
0.01.0
2.03.0
4.05.0
6.07.0
8.09.0
FY1992 FY1993 FY1994 FY1995 FY1996 FY1997 FY1998 FY1999 FY2000 FY2001
Foreign Exchange Reserves In months of imports

19
slowdown, e.g., garments would be substantial. Loss of employment in the service sectors, which are essentially labor intensive, could be considerable. 36. During July-October of FY2002, the country’s exports, which depend on the US market for 40 percent of the total, declined by 10 percent compared with the corresponding period of FY2001. Exports of woven garments and knitwear (accounting for about 75 percent of exports) declined by 9.5 percent and 3.3 percent, respectively, while exports of frozen food declined by 32.8 percent. With new orders plummeting, about 1,200 garment factories have already closed down, with about 350,000 workers losing jobs. The decline in exports will particularly adversely affect export-oriented manufacturing production and transport and trade services. Imports have also decelerated, but not at a pace to offset the growing trade deficit. During July-October of FY2002, imports (in terms of opening of letters of credit) declined by 5.6 percent compared with the same period of previous year. However, workers’ remittances recorded a 22 percent increase during July-October of FY2002 as against same period of last year. The increase in remittances seems to be due to actions taken to address bottlenecks in delivery, and possibly repatriation of accumulated savings by some workers. It is uncertain whether the spurt in remittances can be sustained, considering that the number of persons leaving the country for employment abroad has sharply declined during recent months. 37. Foreign exchange reserves declined from $1.3 billion (1.7 months of imports) at the end of June 2001 to only $1.1 billion (1.4 months of imports) at the end of November 2001. Further erosion in the reserve level has been prevented by deferring the Asian Clearing Union (ACU) payment of $150 million, which was due in November 2001.9 The maintenance of the Taka exchange rate value at appropriate levels, prevention of currency transfers by hundis, deposits of foreign exchange with the central bank by the commercial banks are some of the steps which have already been taken by the Government. The early signs for revenue performance are not encouraging, as revenue collection during July–November of FY2002, although registering growth of 3.9 percent over the same period of the previous fiscal year fell short of the target for the period by 6.1 percent. All import-based taxes (customs duty, VAT, and supplementary duties at the import stage) recorded declines, mainly indicating a deceleration of merchandize imports. Collection of domestic-based taxes, e.g., VAT, supplementary duties (local), and income tax, registered double digit growth, although excise duties (on manually made cigarettes, textiles, and bank services) declined. An expansionary monetary policy continues, with Government net credit growing by 26 percent in September 2001. Inflation continues to be low, although it picked up slightly to 2.2 percent in September 2001, mainly due to increases in nonfood prices. 38. The foodgrain production target for FY2002 is 27.9 million tons, which is about 4 percent higher than in FY2001. The outlook for the foodgrain sector continues to be favorable. Despite drought in the northern districts, the country is expecting another reasonably good aman crop this year. Although the aman crop is likely to fall short of the target, it is expected to be higher than the production of last year. However, the overall crop sector prospect is dependent on the forthcoming boro crop.
39. Given the weakening global environment and emerging domestic developments, The GDP growth rate during FY2002 is expected to be 4.0-4.5 percent, compared with the 6 percent achieved during FY2001, mainly due to mounting external pressures and lower growth in agriculture sector. Although agriculture is expected to maintain a steady upturn, depending on
9 While deferring the ACU payment will provide a temporary respite, the country will have to make two ACU
payments in January 2002 with interest on $150 million.

20
weather conditions, its overall growth is likely to be lower than the previous year due to the high base for comparison following robust growth during recent years. Given lower GDP growth projection, in comparison with FY2000, investment may decline by 1.6 percentage points to 22 percent of GDP, while the national savings rate is expected to fall by 1.8 percentage points to 19.7 percent of GDP. Heightened external pressures could particularly affect export-oriented manufacturing production, export trade-related services, remittances, and FDI. During FY2002, the current account deficit is projected to increase to 2.3 percent of GDP from 2.1 percent of GDP in the previous year on the assumption of an 8 percent decline in exports, a 5 percent decline in imports, and a tapering off of the recent spurt in remittances. The budget deficit is expected to remain high at 6 percent of GDP, mainly on account of shortfall in revenue collection. Over the medium term, i.e., in FY2003 and FY2004, the economic growth prospects of the country should improve, depending on recovery in the global economy, developments in the external environment, and progress in the country’s structural and economic reforms. 40. The Government has taken a number of measures to address some of the emerging macroeconomic issues. These include reducing lending rates, increasing credit facilities, lowering the interest on saving certificates, pruning the ADP with particular emphasis on low-priority Government-funded projects including those financed by costly suppliers’ credit, raising the government revenue collection target by Tk5 billion, cancellation of the Non-aligned Movement Summit, imposing a 100 percent letter of credit margin on some non-essential and luxury goods, imposing regulatory duties on the import of some products, freezing public sector employment, and enhancing enforcement of foreign exchange laws and rules. Efforts are also being made by both the Government and the private sector to obtain duty- and quota-free access of garment exports to the US market. While some of these measures are in the right direction, the Government will nevertheless need to initiate comprehensive reforms over the short to medium term. These include addressing the losses of SOE, expediting the process of privatization, accelerating financial sector reform, enhancing revenue collection, tightening monetary and expenditure policies, improving governance, fostering private sector development, stimulating international competitiveness, and expanding exports. 41. Addressing the mounting pressures on the balance of payments and fiscal sector should be the utmost priority of the Government over the short to medium term. The issues that need to be addressed urgently include diversifying the export base and markets, avoiding costly suppliers’ credit, removing bottlenecks in channeling overseas remittances through official means, fostering a favorable climate for higher external assistance and FDI flows, adopting more flexible exchange rate management, and restoring monetary and fiscal discipline. On the fiscal front, the central challenge is to raise revenue and contain nonpriority spending, and also to reduce reliance on the Government’s domestic borrowing, particularly from the banking system, to protect the drawdown of foreign exchange reserves and create room for private sector borrowing. Current revenue can be raised notably by expanding coverage of income tax and VAT through reduction of exemptions and exclusions; upward adjustments in the administered prices of electricity, gas, and petroleum products; and strengthening tax administration. Restructuring and privatization of SOEs should also be an important component in the policy agenda. 42. The financial system in Bangladesh, which is dominated by the banking sector, is under stress mainly because of the large portfolio of NPL, deficient legal framework, and poor governance including inadequate financial disclosure and a weak central bank. Overhauling of the financial sector is needed to ensure effective intermediation between savers and investors, and to increase resource mobilization for requisite industrial and infrastructure investments. The much-needed foreign capital inflows to finance domestic investments will not be forthcoming

21
unless the financial system is restructured. Any reform strategy to deal with the problems must focus first on measures to prevent the situation from deteriorating and to restore credit discipline. These measures must stem the flow of bad loans, curtail operating losses and conserve the assets of both the NCBs and the private domestic banks, and stimulate capital market development. 43. Bangladesh is confronting considerable external and domestic risks over the short to medium term that could imperil macroeconomic stability, thereby seriously undermining economic growth prospects and consequent poverty reduction. If the downturn in the global economy lingers, the adverse impact on the country’s real and external sectors could be severe. The overall balance payments may deteriorate substantially with a rapid slide in foreign exchange reserves. If the foreign exchange reserves reach a critically lower level, the Government may face difficulty in servicing its external debt. There could be more severe pressures on the fiscal balance as a result of lower economic activity and reduced imports. The fall in revenue may force the Government either to borrow more from the banking system to meet both current and development spending or to cut the size of the development budget. The policy measures announced by the Government may prove inadequate to address the slippage in the external and fiscal balances. On the positive sides, the Government is discussing balance of payments support with the World Bank and the International Monetary Fund to address the emerging macroeconomic concerns. If oil prices continue to be low, oil imports payments will decline, with some respite for the balance of payments. On the domestic front, there are considerable risks that political instability and law and order problems, as in past few years, will continue to undermine economic growth prospects. A consensus between the ruling and opposition political parties on substantive national issues would be extremely important if the Government is to carry out much-needed critical reform measures.

22
APPENDIX
Table Number Title Page Table A.1 Key Macroeconomic Indicators 23 Table A.2 Gross National Domestic Product at Current Prices 24 Table A.3 Gross Domestic Product at Constant Prices 25 Table A.4 Sector Growth Rate of GDP at Constant Prices 26 Table A.5 Balance of Payments 27 Table A.6 Revenue and Expenditure of the Government 28 Table A.7 Consumer Price Index, National 29 Table A.8 Major Social Indicators 30
23 Appendix, page 1
Item FY1992 FY1993 FY1994 FY1995 FY1996 FY1997 FY1998 FY1999 FY2000 FY2001a
Real GDP Growth (%) 5.0 4.6 4.1 4.9 4.6 5.4 5.2 4.9 5.9 6.0GDP per Capita (US$) 277 277 288 316 334 340 348 357 363 369GNI per Capitab (US$) 283 285 297 326 343 351 359 369 377 387
SavingsDomestic Savings 13.9 12.5 13.1 13.3 14.9 15.9 17.4 17.7 17.9 18.8National Savings 15.5 16.0 17.2 16.7 16.0 18.6 20.5 20.8 22.0 21.5Investment Gross Investment 17.3 17.9 18.4 19.1 20.0 20.7 21.6 22.2 23.0 23.6 Public 7.0 6.5 6.6 6.7 6.4 7.0 6.4 6.7 7.4 7.9 Private 10.3 11.5 11.8 12.4 13.6 13.7 15.3 15.5 15.6 15.7Budget Total Revenue 8.3 9.1 9.3 9.3 9.0 9.2 9.3 9.0 8.5 9.5 Tax Revenue 6.7 7.3 7.1 7.3 7.2 7.4 7.3 7.2 6.8 7.6
Total Expenditure 12.7 13.3 13.8 14.6 13.4 13.5 13.3 14.2 14.7 15.5Current Expenditurec 6.3 6.7 6.7 6.8 6.8 6.8 7.2 7.6 7.8 8.0
Overall Budget Deficitd (4.5) (4.3) (4.5) (5.3) (4.4) (4.3) (4.1) (4.8) (6.2) (6.0)Balance of Payments Exportse 6.4 7.4 7.5 9.2 9.5 10.5 11.7 11.7 12.2 13.6 Importsf 11.3 12.7 12.4 15.4 16.9 16.9 17.1 17.6 17.8 19.6
Current Account Balance (1.8) (1.9) (1.2) (2.4) (4.0) (2.1) (1.1) (1.4) (1.0) (2.1)Debt Service Ratiog 9.8 9.5 10.4 8.5 7.9 7.0 5.9 7.0 7.2 7.5Money and Credit (percent change) Broad Money 14.1 10.6 14.6 16.0 8.2 10.8 10.4 12.8 18.6 16.6 Credit to Government 65.7 8.2 19.4 (1.5) 36.8 27.1 15.7 21.3 31.3 19.7 Credit to Private Sector 0.7 7.7 8.0 23.3 19.2 12.6 12.6 13.8 10.7 16.9External Debt ($ billion) 13.3 13.6 15.4 16.8 14.5 14.4 14.8 15.3 15.8 16.2Rate of Inflationh 4.6 2.7 3.3 8.9 6.6 2.6 7.0 9.0 3.4 1.5Memorandum ItemsBB Gross Reserves In $ billion 1.7 2.2 2.9 3.1 2.0 1.7 1.8 1.5 1.6 1.3 In months of imports 5.8 6.6 8.2 6.3 3.6 2.9 2.9 2.3 2.3 1.7Exchange Rate (TK/$) 38.2 39.1 40.0 40.2 40.9 42.7 45.4 47.8 50.3 54.0BB=Bangladesh Bank, GDP=gross domestic product, GNI= gross national income.
a Provisional .
c Excludes food subsidies.
e Exports imply merchandise export only.f Imports imply merchandise imports only.
services, plus worker's remittances.h Based on national consumer price index (base 1985/86).
Sources: Bangladesh Bureau of Statistics, Bangaldesh Bank, and World Bank.
g Represents the ratio of debt service to total foreign exchange earnings from exports of goods and nonfactor
STATISTICAL APPENDIXTable A.1: Key Macroeconomic Indicators
d Defined as the difference between the expenditure-GDP and revenue-GDP ratios, adjusted to reflect the differencebetween the fiscal accounts and estimates of total government financing.
b In calculating GNI, workers' remittances are included in net factor income. Per capita GNI is calculated using thesame year's period average exchange rate.
(percent of GDP)

24 Appendix, page 2
FY1991 FY1992 FY1993 FY1994 FY1995 FY1996 FY1997 FY1998 FY1999 FY2000 FY2001a
A. Agriculture 286,325 295,319 261,871 269,000 310,060 324,382 350,462 381,359 429,901 446,923 469,074
1. Crops and Horticulture 223,289 228,312 191,437 194,896 230,570 239,925 259,975 284,240 323,955 334,178 351,719
2. Animal Husbandry 40,584 42,678 44,981 47,626 50,547 53,621 56,969 60,496 64,431 68,576 70,872
3. Forestry and Related Services 22,452 24,329 25,453 26,478 28,943 30,836 33,518 36,623 41,515 44,169 46,483
B. Fishing 39,714 44,078 55,066 65,823 76,307 85,500 96,415 108,742 124,854 136,738 148,648
326,039 339,397 316,937 334,823 386,367 409,882 446,877 490,101 554,755 583,661 617,722
C. Mining and Quarrying 9,020 10,517 12,707 13,699 15,444 16,691 18,002 19,517 20,664 23,112 26,648
1. Natural Gas and Crude Petroleum 5,723 6,499 8,018 8,405 9,235 9,919 9,898 10,418 10,800 12,769 15,357
2. Other Mining and Quarrying 3,297 4,018 4,689 5,294 6,209 6,772 8,104 9,099 9,864 10,343 11,291
D. Manufacturing 144,012 160,620 179,954 199,792 224,560 246,351 270,605 312,692 327,828 348,371 384,019
1. Large and Medium Scale 100,861 111,864 126,165 140,839 160,338 175,732 190,314 221,752 235,265 249,387 276,158
2. Small Scale 43,151 48,756 53,789 58,953 64,222 70,619 80,291 90,940 92,563 98,984 107,861
E. Electricity, Gas, and Water Supply 16,609 17,922 19,517 21,124 22,685 24,009 25,537 26,433 28,381 30,722 33,345
1. Electricity 14,471 15,497 16,740 17,901 19,056 20,196 21,585 22,132 23,879 25,792 27,904
2. Gas 1,607 1,816 1,997 2,255 2,641 2,810 2,898 3,103 3,184 3,433 3,776
3. Water Supply 531 609 780 968 988 1,003 1,054 1,198 1,318 1,497 1,666
F. Construction 63,768 70,562 75,347 83,198 96,961 109,993 121,695 138,588 156,249 176,218 199,126
233,409 259,621 287,525 317,813 359,650 397,044 435,839 497,230 533,122 578,423 643,138
G. Wholesale and Retail Trade 133,528 141,565 149,874 163,588 188,727 206,076 220,374 248,444 272,319 292,037 313,381
H. Hotel and Restaurants 6,280 6,835 7,300 8,045 8,841 9,782 10,328 11,561 13,165 14,628 16,027
I. Transport, Storage, and Communications 103,611 112,157 119,476 126,827 135,252 144,832 155,841 167,413 180,413 197,434 219,878
1. Land Transport 72,280 78,164 83,891 89,030 95,310 102,758 110,496 120,237 130,832 144,626 162,830
2. Water Transport 22,419 22,884 22,915 22,883 22,700 22,825 23,102 23,263 24,035 24,903 26,252
3. Air Transport 1,722 1,934 2,381 2,654 2,440 2,496 2,393 2,797 3,201 3,731 4,224
4. Support Transport Services, Storage 2,944 3,484 4,105 4,291 5,296 5,850 6,159 6,409 6,762 7,722 9,002
5. Post and Telecommunications 4,246 5,691 6,184 7,969 9,506 10,903 13,691 14,707 15,583 16,451 17,571
J. Financial Intermediations 14,832 16,389 18,034 20,064 22,464 25,171 27,595 29,918 33,511 36,475 38,619
1. Bank 12,912 14,373 15,967 17,551 19,302 21,022 22,433 23,910 26,388 28,278 29,441
2. Insurance 1,692 1,738 1,737 2,111 2,661 3,366 3,976 4,707 5,654 6,598 7,476
3. Others 228 278 330 402 501 783 1,186 1,301 1,469 1,599 1,702
K. Real Estate, Renting, and Business Activities 92,421 98,844 108,562 119,956 130,952 151,036 162,952 176,285 195,837 211,391 228,308
L. Public Administration and Defense 21,874 25,903 31,063 33,810 36,872 40,165 44,188 49,604 55,523 62,340 67,588
M. Education 20,542 22,888 25,708 28,241 30,729 33,042 36,099 41,366 47,178 53,859 58,976
N. Health and Social Work 24,234 26,587 29,258 31,543 33,798 36,388 39,424 43,709 48,416 53,762 57,666
O. Community, Social, and Personal Services 96,957 104,824 113,570 121,739 130,728 142,943 153,812 170,285 184,971 203,596 222,814
514,279 555,992 602,845 653,813 718,363 789,435 850,613 938,585 1,031,333 1,125,522 1,223,257
Import Duty 31,455 40,415 46,386 47,675 60,798 66,880 73,685 75,849 77,761 83,252 96,562
GDP at Market Prices 1,105,182 1,195,425 1,253,693 1,354,124 1,525,178 1,663,241 1,807,014 2,001,765 2,196,972 2,370,856 2,580,679
GDP at Current Producer Price 1,073,727 1,155,010 1,207,307 1,306,449 1,464,380 1,596,361 1,733,329 1,925,916 2,119,210 2,287,606 2,484,117
Growth Rate 10.16 8.17 4.87 8.01 12.63 9.05 8.64 10.78 9.75 7.91 8.85a Provisional.GDP=gross domestic product.Sources: Bangladesh Bureau of Stastics, Revised National Accounts Data.
Subtotal (C-F)
Subtotal (G-O)
Sector/Subsector
Table A.2: Gross Domestic Product at Current Prices(Tk million)
Subtotal (A+B)
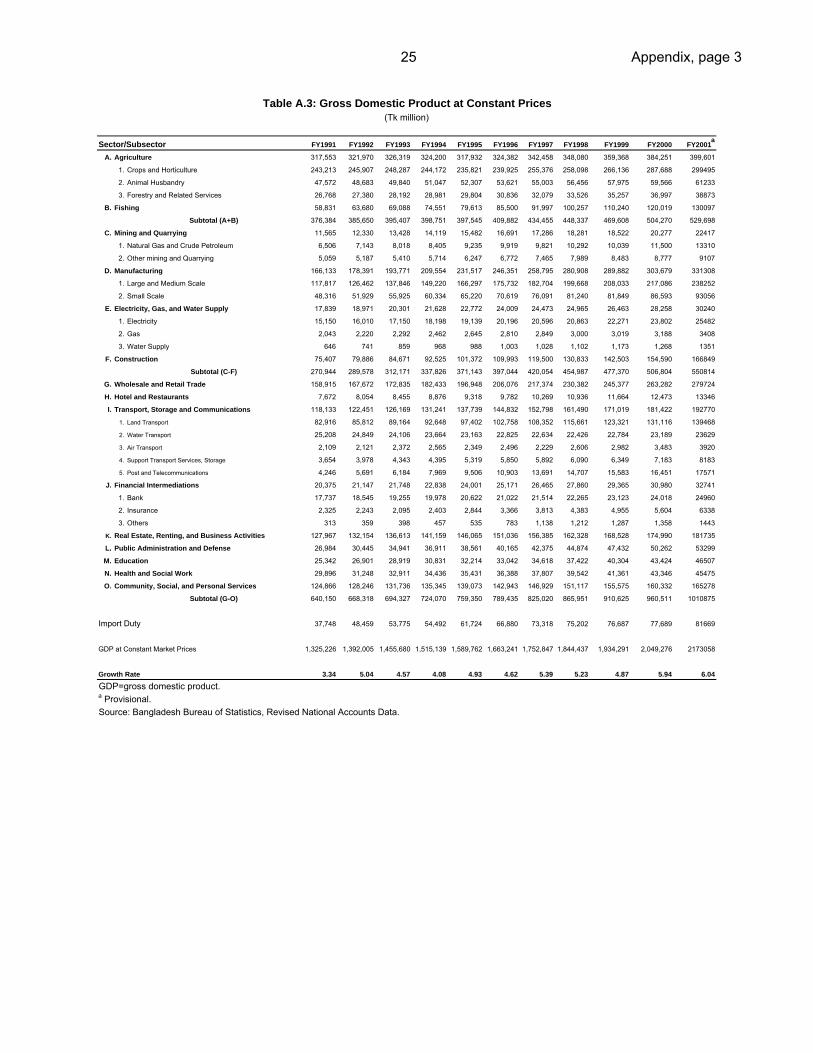
25 Appendix, page 3
FY1991 FY1992 FY1993 FY1994 FY1995 FY1996 FY1997 FY1998 FY1999 FY2000 FY2001a
A. Agriculture 317,553 321,970 326,319 324,200 317,932 324,382 342,458 348,080 359,368 384,251 399,601
1. Crops and Horticulture 243,213 245,907 248,287 244,172 235,821 239,925 255,376 258,098 266,136 287,688 299495
2. Animal Husbandry 47,572 48,683 49,840 51,047 52,307 53,621 55,003 56,456 57,975 59,566 61233
3. Forestry and Related Services 26,768 27,380 28,192 28,981 29,804 30,836 32,079 33,526 35,257 36,997 38873
B. Fishing 58,831 63,680 69,088 74,551 79,613 85,500 91,997 100,257 110,240 120,019 130097
Subtotal (A+B) 376,384 385,650 395,407 398,751 397,545 409,882 434,455 448,337 469,608 504,270 529,698
C. Mining and Quarrying 11,565 12,330 13,428 14,119 15,482 16,691 17,286 18,281 18,522 20,277 22417
1. Natural Gas and Crude Petroleum 6,506 7,143 8,018 8,405 9,235 9,919 9,821 10,292 10,039 11,500 13310
2. Other mining and Quarrying 5,059 5,187 5,410 5,714 6,247 6,772 7,465 7,989 8,483 8,777 9107
D. Manufacturing 166,133 178,391 193,771 209,554 231,517 246,351 258,795 280,908 289,882 303,679 331308
1. Large and Medium Scale 117,817 126,462 137,846 149,220 166,297 175,732 182,704 199,668 208,033 217,086 238252
2. Small Scale 48,316 51,929 55,925 60,334 65,220 70,619 76,091 81,240 81,849 86,593 93056
E. Electricity, Gas, and Water Supply 17,839 18,971 20,301 21,628 22,772 24,009 24,473 24,965 26,463 28,258 30240
1. Electricity 15,150 16,010 17,150 18,198 19,139 20,196 20,596 20,863 22,271 23,802 25482
2. Gas 2,043 2,220 2,292 2,462 2,645 2,810 2,849 3,000 3,019 3,188 3408
3. Water Supply 646 741 859 968 988 1,003 1,028 1,102 1,173 1,268 1351
F. Construction 75,407 79,886 84,671 92,525 101,372 109,993 119,500 130,833 142,503 154,590 166849
Subtotal (C-F) 270,944 289,578 312,171 337,826 371,143 397,044 420,054 454,987 477,370 506,804 550814
G. Wholesale and Retail Trade 158,915 167,672 172,835 182,433 196,948 206,076 217,374 230,382 245,377 263,282 279724
H. Hotel and Restaurants 7,672 8,054 8,455 8,876 9,318 9,782 10,269 10,936 11,664 12,473 13346
I. Transport, Storage and Communications 118,133 122,451 126,169 131,241 137,739 144,832 152,798 161,490 171,019 181,422 192770
1. Land Transport 82,916 85,812 89,164 92,648 97,402 102,758 108,352 115,661 123,321 131,116 139468
2. Water Transport 25,208 24,849 24,106 23,664 23,163 22,825 22,634 22,426 22,784 23,189 23629
3. Air Transport 2,109 2,121 2,372 2,565 2,349 2,496 2,229 2,606 2,982 3,483 3920
4. Support Transport Services, Storage 3,654 3,978 4,343 4,395 5,319 5,850 5,892 6,090 6,349 7,183 8183
5. Post and Telecommunications 4,246 5,691 6,184 7,969 9,506 10,903 13,691 14,707 15,583 16,451 17571
J. Financial Intermediations 20,375 21,147 21,748 22,838 24,001 25,171 26,465 27,860 29,365 30,980 32741
1. Bank 17,737 18,545 19,255 19,978 20,622 21,022 21,514 22,265 23,123 24,018 24960
2. Insurance 2,325 2,243 2,095 2,403 2,844 3,366 3,813 4,383 4,955 5,604 6338
3. Others 313 359 398 457 535 783 1,138 1,212 1,287 1,358 1443
K. Real Estate, Renting, and Business Activities 127,967 132,154 136,613 141,159 146,065 151,036 156,385 162,328 168,528 174,990 181735
L. Public Administration and Defense 26,984 30,445 34,941 36,911 38,561 40,165 42,375 44,874 47,432 50,262 53299
M. Education 25,342 26,901 28,919 30,831 32,214 33,042 34,618 37,422 40,304 43,424 46507
N. Health and Social Work 29,896 31,248 32,911 34,436 35,431 36,388 37,807 39,542 41,361 43,346 45475
O. Community, Social, and Personal Services 124,866 128,246 131,736 135,345 139,073 142,943 146,929 151,117 155,575 160,332 165278
Subtotal (G-O) 640,150 668,318 694,327 724,070 759,350 789,435 825,020 865,951 910,625 960,511 1010875
Import Duty 37,748 48,459 53,775 54,492 61,724 66,880 73,318 75,202 76,687 77,689 81669
GDP at Constant Market Prices 1,325,226 1,392,005 1,455,680 1,515,139 1,589,762 1,663,241 1,752,847 1,844,437 1,934,291 2,049,276 2173058
Growth Rate 3.34 5.04 4.57 4.08 4.93 4.62 5.39 5.23 4.87 5.94 6.04
GDP=gross domestic product.a Provisional.Source: Bangladesh Bureau of Statistics, Revised National Accounts Data.
Sector/Subsector
Table A.3: Gross Domestic Product at Constant Prices(Tk million)

26 Appendix, page 4
FY1991 FY1992 FY1993 FY1994 FY1995 FY1996 FY1997 FY1998 FY1999 FY2000 FY2001a
A. Agriculture
1. Agriculture 1.25 1.39 1.35 (0.65) (1.93) 2.03 5.57 1.63 3.24 6.92 3.99
a. Crops and Horticulture 0.84 1.11 0.97 (1.66) (3.42) 1.74 6.44 1.05 3.11 8.10 4.10
b. Animal Husbandry 2.29 2.34 2.38 2.42 2.47 2.51 2.58 2.64 2.69 2.74 2.80
c. Forestry and Related Services 3.19 2.29 2.97 2.80 2.84 3.46 4.03 4.51 5.16 4.94 5.07
2. Fishing 7.89 8.24 8.49 7.91 6.79 7.39 7.60 8.98 9.96 8.87 8.40
Subtotal (1+2) 2.23 2.46 2.53 0.85 (0.30) 3.10 6.00 3.19 4.77 7.38 5.04
B. Industry
1. Mining and Quarrying 1.63 6.61 8.91 5.15 9.65 7.81 3.56 5.76 1.32 9.48 10.55
a. Natural Gas and Crude Petroleum 1.69 9.79 12.25 4.83 9.88 7.41 (0.99) 4.80 (2.46) 14.55 15.74
b. Other Mining and Quarrying 1.55 2.53 4.30 5.62 9.33 8.40 10.23 7.02 6.18 3.47 3.76
2. Manufacturing 6.38 7.38 8.62 8.15 10.48 6.41 5.05 8.54 3.19 4.76 9.10
a. Large and Medium Scale 6.02 7.34 9.00 8.25 11.44 5.67 3.97 9.28 4.19 4.35 9.75
b. Small Scale 7.28 7.48 7.70 7.88 8.10 8.28 7.75 6.77 0.75 5.80 7.46
3. Electricity, Gas, and Water Supply 7.43 6.35 7.01 6.54 5.29 5.43 1.93 2.01 6.00 6.78 7.01
a. Electricity 4.50 5.68 7.12 6.11 5.17 5.52 1.98 1.30 6.75 6.87 7.06
b. Gas 35.48 8.66 3.24 7.42 7.43 6.24 1.39 5.30 0.63 5.60 6.90
c. Water Supply 7.85 14.71 15.92 12.69 2.07 1.52 2.49 7.20 6.44 8.10 6.55
4. Construction 0.59 5.94 5.99 9.28 9.56 8.50 8.64 9.48 8.92 8.48 7.93
Subtotal (B) 4.57 6.88 7.80 8.22 9.86 6.98 5.80 8.32 4.92 6.17 8.68
C. Services
1. Wholesale and Retail Trade 4.73 5.51 3.08 5.55 7.96 4.63 5.48 5.98 6.51 7.30 6.25
2. Hotel and Restaurants 4.97 4.98 4.98 4.98 4.98 4.98 4.98 6.50 6.66 6.94 7.00
3. Transport, Storage, and Communication 1.60 3.66 3.04 4.02 4.95 5.15 5.50 5.69 5.90 6.08 6.26
4. Financial Intermediations 4.86 3.79 2.84 5.01 5.09 4.87 5.14 5.27 5.40 5.50 5.68
a. Bank 8.32 4.56 3.83 3.75 3.22 1.94 2.34 3.49 3.85 3.87 3.92
b. Insurance (16.19) (3.53) (6.60) 14.70 18.35 18.35 13.28 14.95 13.05 13.10 13.10
c. Others 10.60 14.70 10.86 14.82 17.07 46.36 45.34 6.50 6.19 5.52 6.26
5. Real Estate, Renting, and Business Activities 3.23 3.27 3.37 3.33 3.48 3.40 3.54 3.80 3.82 3.83 3.85
6. Public Administration and Defence 2.87 12.83 14.77 5.64 4.47 4.16 5.50 5.90 5.70 5.97 6.04
7. Education 5.52 6.15 7.50 6.61 4.49 2.57 4.77 8.10 7.70 7.74 7.10
8. Health and Social Works 2.16 4.52 5.32 4.63 2.89 2.70 3.90 4.59 4.60 4.80 4.91
9. Community, Social and Personal Services 2.69 2.71 2.72 2.74 2.75 2.78 2.79 2.85 2.95 3.06 3.08
Subtotal (C) 3.28 4.40 3.89 4.28 4.87 3.96 4.51 4.96 5.16 5.48 5.24
Import Duty 6.87 28.38 10.97 1.33 13.27 8.35 9.63 2.57 1.97 1.31 5.12
GDP at Market Prices 3.34 5.04 4.57 4.08 4.93 4.62 5.39 5.23 4.88 5.94 6.04
GDP=gross domestic product.a Provisional.Sources: Bangladesh Bureau of Stastics, Revised National Accounts Data.
Sector/Subsector
Table A.4: Sector Growth Rate of GDP at Constant Prices(percent)
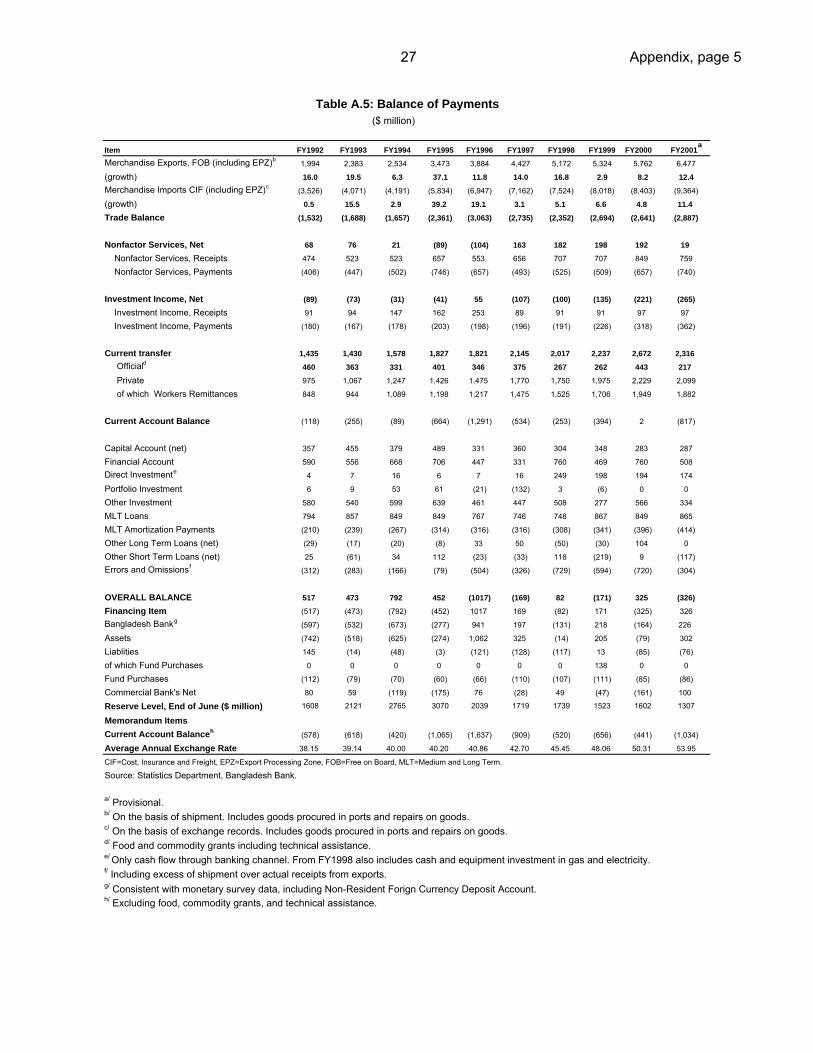
27 Appendix, page 5
Item FY1992 FY1993 FY1994 FY1995 FY1996 FY1997 FY1998 FY1999 FY2000 FY2001a
Merchandise Exports, FOB (including EPZ)b 1,994 2,383 2,534 3,473 3,884 4,427 5,172 5,324 5,762 6,477
(growth) 16.0 19.5 6.3 37.1 11.8 14.0 16.8 2.9 8.2 12.4Merchandise Imports CIF (including EPZ)c (3,526) (4,071) (4,191) (5,834) (6,947) (7,162) (7,524) (8,018) (8,403) (9,364)
(growth) 0.5 15.5 2.9 39.2 19.1 3.1 5.1 6.6 4.8 11.4Trade Balance (1,532) (1,688) (1,657) (2,361) (3,063) (2,735) (2,352) (2,694) (2,641) (2,887)
Nonfactor Services, Net 68 76 21 (89) (104) 163 182 198 192 19 Nonfactor Services, Receipts 474 523 523 657 553 656 707 707 849 759
Nonfactor Services, Payments (406) (447) (502) (746) (657) (493) (525) (509) (657) (740)
Investment Income, Net (89) (73) (31) (41) 55 (107) (100) (135) (221) (265) Investment Income, Receipts 91 94 147 162 253 89 91 91 97 97
Investment Income, Payments (180) (167) (178) (203) (198) (196) (191) (226) (318) (362)
Current transfer 1,435 1,430 1,578 1,827 1,821 2,145 2,017 2,237 2,672 2,316 Officiald 460 363 331 401 346 375 267 262 443 217 Private 975 1,067 1,247 1,426 1,475 1,770 1,750 1,975 2,229 2,099
of which Workers Remittances 848 944 1,089 1,198 1,217 1,475 1,525 1,706 1,949 1,882
Current Account Balance (118) (255) (89) (664) (1,291) (534) (253) (394) 2 (817)
Capital Account (net) 357 455 379 489 331 360 304 348 283 287
Financial Account 590 556 668 706 447 331 760 469 760 508Direct Investmente 4 7 16 6 7 16 249 198 194 174
Portfolio Investment 6 9 53 61 (21) (132) 3 (6) 0 0
Other Investment 580 540 599 639 461 447 508 277 566 334
MLT Loans 794 857 849 849 767 746 748 867 849 865
MLT Amortization Payments (210) (239) (267) (314) (316) (316) (308) (341) (396) (414)
Other Long Term Loans (net) (29) (17) (20) (8) 33 50 (50) (30) 104 0
Other Short Term Loans (net) 25 (61) 34 112 (23) (33) 118 (219) 9 (117)Errors and Omissionsf (312) (283) (166) (79) (504) (326) (729) (594) (720) (304)
OVERALL BALANCE 517 473 792 452 (1017) (169) 82 (171) 325 (326)Financing Item (517) (473) (792) (452) 1017 169 (82) 171 (325) 326Bangladesh Bankg (597) (532) (673) (277) 941 197 (131) 218 (164) 226
Assets (742) (518) (625) (274) 1,062 325 (14) 205 (79) 302
Liablities 145 (14) (48) (3) (121) (128) (117) 13 (85) (76)
of which Fund Purchases 0 0 0 0 0 0 0 138 0 0
Fund Purchases (112) (79) (70) (60) (66) (110) (107) (111) (85) (86)
Commercial Bank's Net 80 59 (119) (175) 76 (28) 49 (47) (161) 100
Reserve Level, End of June ($ million) 1608 2121 2765 3070 2039 1719 1739 1523 1602 1307
Memorandum ItemsCurrent Account Balanceh (578) (618) (420) (1,065) (1,637) (909) (520) (656) (441) (1,034)
Average Annual Exchange Rate 38.15 39.14 40.00 40.20 40.86 42.70 45.45 48.06 50.31 53.95
CIF=Cost, Insurance and Freight, EPZ=Export Processing Zone, FOB=Free on Board, MLT=Medium and Long Term.
Source: Statistics Department, Bangladesh Bank.
a/ Provisional.b/ On the basis of shipment. Includes goods procured in ports and repairs on goods.c/ On the basis of exchange records. Includes goods procured in ports and repairs on goods.d/ Food and commodity grants including technical assistance. e/ Only cash flow through banking channel. From FY1998 also includes cash and equipment investment in gas and electricity.f/ Including excess of shipment over actual receipts from exports.
h/ Excluding food, commodity grants, and technical assistance.
g/ Consistent with monetary survey data, including Non-Resident Forign Currency Deposit Account.
Table A.5: Balance of Payments($ million)

28 Appendix, page 6
Item FY1991 FY1992 FY1993 FY1994 FY1995 FY1996 FY1997 FY1998 FY1999 FY2000 FY2001a FY2002b
Total Revenue 80.0 98.9 113.6 125.3 141.8 150.2 165.9 185.5 198.1 200.9 243.8 274.6 Tax 65.2 79.5 91.2 96.3 111.9 120.0 133.1 147.0 158.4 160.7 194.9 220.2 Nontax 14.8 19.4 22.4 29.0 29.9 30.2 32.8 38.5 39.7 40.2 48.9 54.3
Total Expenditure (139.9) (152.4) (167.0) (186.9) (221.6) (224.8) (244.0) (266.9) (311.0) (348.8) (399.0) (426.3) Current Expenditure (72.3) (75.6) (84.6) (91.1) (103.1) (113.1) (123.6) (143.2) (167.3) (185.0) (206.6) (220.4) Food Account Surplus (7.4) (5.8) (6.5) 4.5 (7.0) (5.0) (4.0) (3.2) (5.9) (3.5) (2.1) (7.3) ADP (52.0) (57.0) (67.5) (87.1) (100.9) (96.1) (108.5) (113.0) (123.2) (154.5) (179.5) (187.5) Non ADP Capital and Net Lending (5.3) (5.4) (8.5) (12.5) (12.0) (8.6) (8.0) (7.5) (7.2) (5.8) (10.8) (11.1)
Residual (2.9) (8.6) (2.2) (0.6) 1.4 (2.0) 0.1 0.0 (7.4) 0.0 0.0 0.0
Overall Budget Deficit (62.8) (53.5) (57.7) (62.1) (78.3) (76.6) (78.0) (81.4) (105.6) (147.9) (155.3) (151.7)Net Foreign Financing 51.9 44.1 52.9 50.4 57.5 46.3 51.4 48.9 53.6 59.3 65.4 77.5Project Aid 35.2 36.4 39.6 38.9 49.7 44.0 47.7 52.7 38.9 67.5 74.7 82.2Commodity Aid 16.3 6.4 17.2 18.2 13.4 9.4 11.2 9.3 17.1 9.4 6.6 10.9Food Aid 9.7 8.8 4.7 4.8 5.5 5.6 4.3 5.0 11.1 8.8 5.8 5.6Commercial Food Borrowing (0.5) (0.8) (0.7) (0.4) 0.0 0.0 0.0 0.0 0.0 0.0 0.0 0.0Others 0.2 2.1 (2.5) 2.9 2.6 2.0 3.5Debt Amortization (8.8) (6.7) (7.8) (11.0) (11.0) (12.9) (14.0) (15.5) (16.3) (29.0) (23.8) (24.7)
Net Domestic Financing 8.0 9.3 2.7 11.1 22.2 28.1 26.8 31.6 52.0 88.7 90.3 74.2 Banking System 1.7 (2.9) (10.3) (5.4) 5.2 15.6 17.1 12.6 19.8 35.2 37.6 21.6 Other Domestic 3.5 9.2 13.0 16.4 17.0 12.5 9.7 19.0 32.2 53.5 52.7 52.6
Total Revenue 16.1 23.6 14.9 10.3 13.2 5.9 10.5 11.8 6.8 1.4 21.4 12.6Total Expenditure 10.2 8.9 9.6 11.9 18.6 1.4 8.5 9.4 16.5 12.2 14.4 6.8Current Expenditure 11.7 4.6 11.9 7.7 13.2 9.7 9.3 15.9 16.8 10.6 11.7 6.7ADP 10.2 9.6 18.4 29.0 15.8 (4.8) 12.9 4.1 9.0 25.4 16.2 4.5
Total Revenue 7.2 8.3 9.1 9.3 9.3 9.0 9.2 9.2 9.0 8.5 9.5 9.8Tax Revenue 5.9 6.7 7.3 7.1 7.3 7.2 7.4 7.3 7.2 6.8 7.6 7.8Nontax Revenue 1.3 1.6 1.8 2.1 2.0 1.8 1.8 1.9 1.8 1.7 1.9 1.9Total Expenditure 12.7 12.7 13.3 13.8 14.6 13.4 13.5 13.3 13.8 14.7 15.5 15.2Current Expenditure 6.5 6.3 6.7 6.7 6.8 6.8 6.8 7.2 7.6 7.8 8.0 7.8ADP 4.7 4.8 5.4 6.4 6.6 5.8 6.0 5.6 5.6 6.5 7.0 6.7Overall Budget Deficit (5.4) (4.5) (4.4) (4.5) (5.3) (4.5) (4.3) (4.1) (4.8) (6.2) (6.0) (5.4)Net Foreign Financing 4.7 3.7 4.2 3.7 3.8 2.8 2.8 2.4 2.4 2.5 2.5 2.8Net Domestic Financing 0.7 0.8 0.4 0.8 1.5 1.7 1.5 1.6 2.4 3.7 3.5 2.6Banking System 0.2 (0.2) (0.8) (0.4) 0.3 0.9 0.9 0.6 0.9 1.5 1.5 0.8Other Domestic 0.3 0.8 1.0 1.2 1.1 0.8 0.5 0.9 1.5 2.3 2.0 1.9
GDP at Market Prices 1105.2 1195.4 1253.7 1354.1 1525.2 1663.2 1807.0 2001.8 2194.4 2370.9 2580.7 2812.9ADP= annual development program, GDP=gross domestic product.Sources: Ministry of Finance and World Bank.
a Revised.b Budget.
(as percent of GDP)
Table A.6: Revenue and Expenditure of the Government(Tk billion)
(annual percentage change)
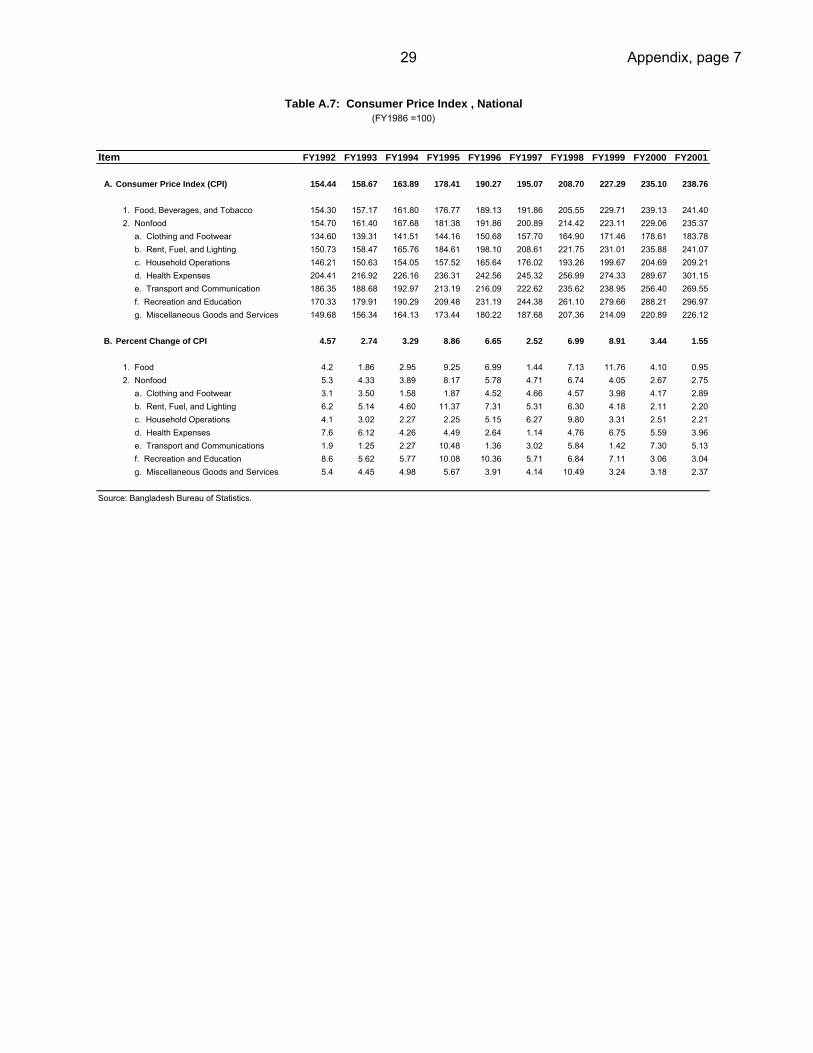
29 Appendix, page 7
Item FY1992 FY1993 FY1994 FY1995 FY1996 FY1997 FY1998 FY1999 FY2000 FY2001
A. Consumer Price Index (CPI) 154.44 158.67 163.89 178.41 190.27 195.07 208.70 227.29 235.10 238.76
1. Food, Beverages, and Tobacco 154.30 157.17 161.80 176.77 189.13 191.86 205.55 229.71 239.13 241.40 2. Nonfood 154.70 161.40 167.68 181.38 191.86 200.89 214.42 223.11 229.06 235.37 a. Clothing and Footwear 134.60 139.31 141.51 144.16 150.68 157.70 164.90 171.46 178.61 183.78 b. Rent, Fuel, and Lighting 150.73 158.47 165.76 184.61 198.10 208.61 221.75 231.01 235.88 241.07 c. Household Operations 146.21 150.63 154.05 157.52 165.64 176.02 193.26 199.67 204.69 209.21 d. Health Expenses 204.41 216.92 226.16 236.31 242.56 245.32 256.99 274.33 289.67 301.15 e. Transport and Communication 186.35 188.68 192.97 213.19 216.09 222.62 235.62 238.95 256.40 269.55 f. Recreation and Education 170.33 179.91 190.29 209.48 231.19 244.38 261.10 279.66 288.21 296.97 g. Miscellaneous Goods and Services 149.68 156.34 164.13 173.44 180.22 187.68 207.36 214.09 220.89 226.12
B. Percent Change of CPI 4.57 2.74 3.29 8.86 6.65 2.52 6.99 8.91 3.44 1.55
1. Food 4.2 1.86 2.95 9.25 6.99 1.44 7.13 11.76 4.10 0.95 2. Nonfood 5.3 4.33 3.89 8.17 5.78 4.71 6.74 4.05 2.67 2.75 a. Clothing and Footwear 3.1 3.50 1.58 1.87 4.52 4.66 4.57 3.98 4.17 2.89 b. Rent, Fuel, and Lighting 6.2 5.14 4.60 11.37 7.31 5.31 6.30 4.18 2.11 2.20 c. Household Operations 4.1 3.02 2.27 2.25 5.15 6.27 9.80 3.31 2.51 2.21 d. Health Expenses 7.6 6.12 4.26 4.49 2.64 1.14 4.76 6.75 5.59 3.96 e. Transport and Communications 1.9 1.25 2.27 10.48 1.36 3.02 5.84 1.42 7.30 5.13 f. Recreation and Education 8.6 5.62 5.77 10.08 10.36 5.71 6.84 7.11 3.06 3.04 g. Miscellaneous Goods and Services 5.4 4.45 4.98 5.67 3.91 4.14 10.49 3.24 3.18 2.37
Source: Bangladesh Bureau of Statistics.
(FY1986 =100)Table A.7: Consumer Price Index , National
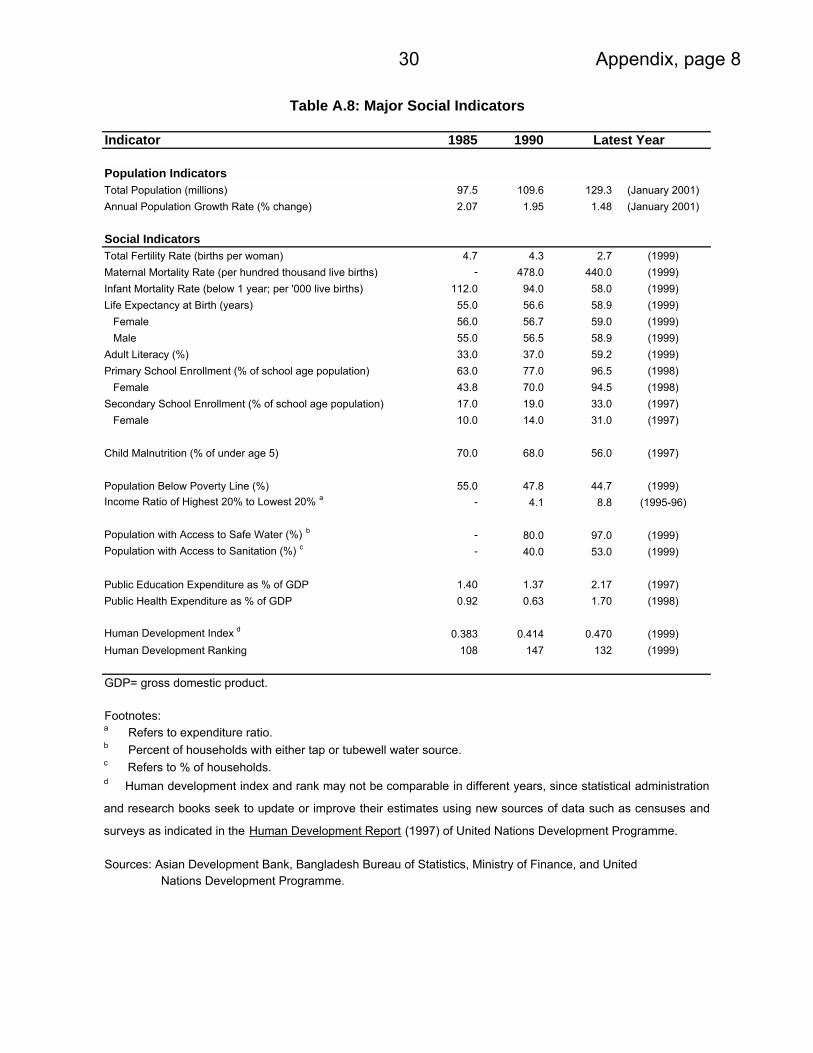
30 Appendix, page 8
Table A.8: Major Social Indicators
Indicator 1985 1990 Latest Year
Population IndicatorsTotal Population (millions) 97.5 109.6 129.3 (January 2001)Annual Population Growth Rate (% change) 2.07 1.95 1.48 (January 2001)
Social IndicatorsTotal Fertility Rate (births per woman) 4.7 4.3 2.7 (1999)Maternal Mortality Rate (per hundred thousand live births) - 478.0 440.0 (1999)Infant Mortality Rate (below 1 year; per '000 live births) 112.0 94.0 58.0 (1999)Life Expectancy at Birth (years) 55.0 56.6 58.9 (1999) Female 56.0 56.7 59.0 (1999) Male 55.0 56.5 58.9 (1999)Adult Literacy (%) 33.0 37.0 59.2 (1999)Primary School Enrollment (% of school age population) 63.0 77.0 96.5 (1998) Female 43.8 70.0 94.5 (1998)Secondary School Enrollment (% of school age population) 17.0 19.0 33.0 (1997) Female 10.0 14.0 31.0 (1997)
Child Malnutrition (% of under age 5) 70.0 68.0 56.0 (1997)
Population Below Poverty Line (%) 55.0 47.8 44.7 (1999)Income Ratio of Highest 20% to Lowest 20% a - 4.1 8.8 (1995-96)
Population with Access to Safe Water (%) b - 80.0 97.0 (1999)Population with Access to Sanitation (%) c - 40.0 53.0 (1999)
Public Education Expenditure as % of GDP 1.40 1.37 2.17 (1997)Public Health Expenditure as % of GDP 0.92 0.63 1.70 (1998)
Human Development Index d 0.383 0.414 0.470 (1999)Human Development Ranking 108 147 132 (1999)
GDP= gross domestic product.
Footnotes:a Refers to expenditure ratio.b Percent of households with either tap or tubewell water source.c Refers to % of households.
Sources: Asian Development Bank, Bangladesh Bureau of Statistics, Ministry of Finance, and United Nations Development Programme.
d Human development index and rank may not be comparable in different years, since statistical administration
and research books seek to update or improve their estimates using new sources of data such as censuses and
surveys as indicated in the Human Development Report (1997) of United Nations Development Programme.


![[XLS] · Web view2001 2 2003 4 2004 1 2006 1 1995 1 1990 1993 1998 1999 1999 1999 1999 2000 2000 2000 2000 2000 2001 2001 2001 2001 2001 2001 2001 2001 2001 2001 2001 2001 2001 2002](https://static.fdocuments.us/doc/165x107/5bdc2d6f09d3f2bc1c8d6ace/xls-web-view2001-2-2003-4-2004-1-2006-1-1995-1-1990-1993-1998-1999-1999-1999.jpg)


