Decarbonization of the Chemical Industry
16
Cathy Tway July 23, 2019 Decarbonization of the Chemical Industry
Transcript of Decarbonization of the Chemical Industry
Cathy TwayJuly 23, 2019
Decarbonization of the Chemical Industry
The Global Chemistry Industry: Catalyzing Growth and Addressing Our World’s Sustainability Challenges, ICCA, March 2019 2
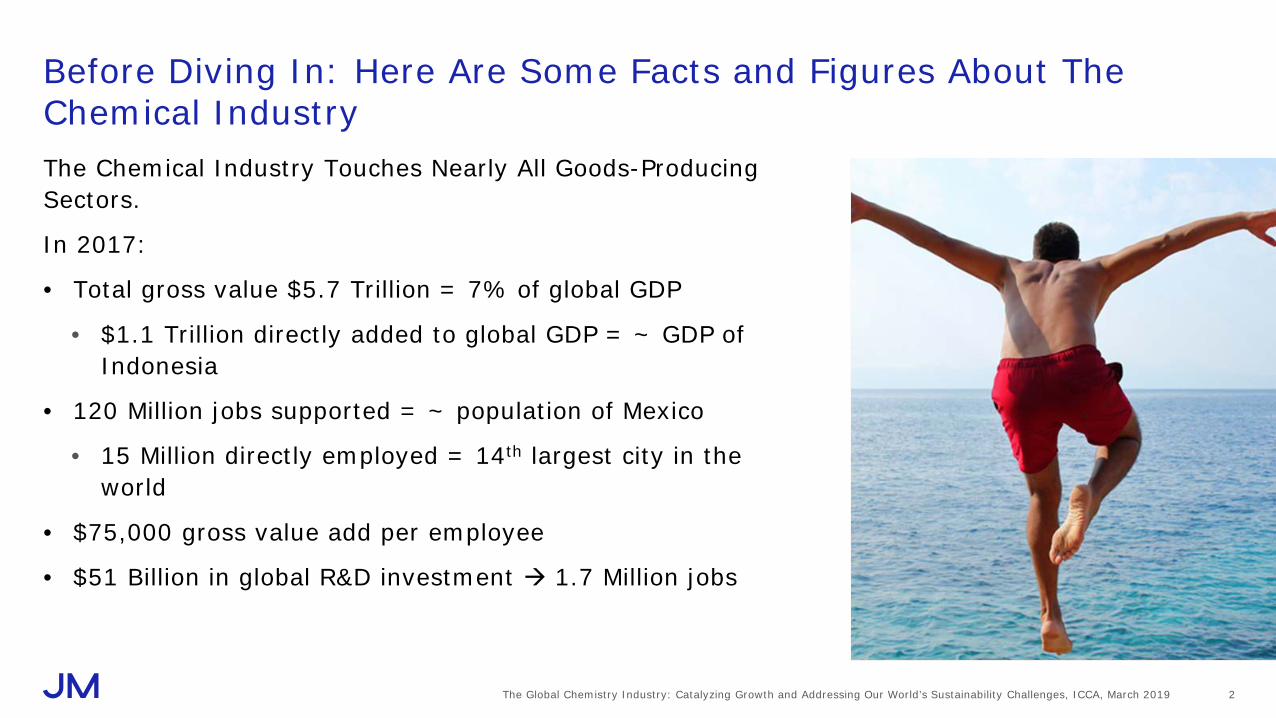
Before Diving In: Here Are Some Facts and Figures About The Chemical IndustryThe Chemical Industry Touches Nearly All Goods-Producing Sectors.
In 2017:
• Total gross value $5.7 Trillion = 7% of global GDP
• $1.1 Trillion directly added to global GDP = ~ GDP of Indonesia
• 120 Million jobs supported = ~ population of Mexico
• 15 Million directly employed = 14th largest city in the world
• $75,000 gross value add per employee
• $51 Billion in global R&D investment 1.7 Million jobs

3
Greater Than 50% Is FeedstocksChemicals Are The Largest Industrial Energy Consumer
Chemicals
Iron and SteelCement
Pulp and Paper
Aluminum
0
500
1000
1500
2000
2500
3000
0 200 400 600 800 1000 1200 1400
Dire
ct C
O2
Emiss
ions
, MtC
O2/
yr
Energy Demand, Mtoe
The Future of Petrochemicals, IEA, Oct. 2018

Significant Focus Has Resulted in Highly Optimized Processes
P. G. Levi, J. M. Cullen, The Future of Petrochemicals, IEA, Oct. 2018Environ. Sci. Technol. 2018, 52, 1725−1734; A. Katelhon, et al, PNAS 2019, 116, 11187’ 4
Energy Related
85%
Process Loss15%
CO2 Emission Sources
• Between 1977 and 2014, nearly 25%reduction in non-feedstock energy use
• In 2014, 58% of energy input used as feedstocks
• 1.5 GtCO2 per year – 18% of global industrial CO2 emissions
• Non-CO2 GHG emissions are 350 – 400 MtCO2-eq

Predictions from Technology Roadmap1,2 Point Out Need For Different Approaches
-
500
1,000
1,500
2,000
2,500
2010 2015 2020 2025 2030 2040 2050
Prod
uctio
n v
olum
e [k
t]
Ammonia Ethylene PropyleneACN Methanol PETPA PP Mixed XylenesPX Benzene StyreneEG VCM EOToluene Cumene POPhenol Caprolactam
Volumes Expected to Grow ~2-3X1,2
With no process improvements1,2 ,
• Energy use to increase by >110%
• GHG emissions to increase by >100%
To give 50% chance of limiting to 2˚C by 2050, 30% reduction in CO2 or75% reduction/unit of production3
1Technology Roadmap: Energy and GHG Reductions in the Chemical Industry via Catalytic Processes, International Energy Agency, June 20132https://www.iea.org/publications/freepublications/publication/name,40309,en.html
3P. G. Levi, J. M. Cullen, Environ. Sci. Technol. 2018, 52, 1725−1734

There Are Upstream and Downstream Opportunities to Reduce CO2Emissions
P. G. Levi, J. M. Cullen, The Future of Petrochemicals, IEA, Oct. 2018Environ. Sci. Technol. 2018, 52, 1725−1734; 6
Olefins
BTX
Ammonia
Methanol
Polymers
Agrochemicals
Specialty Chemicals
2/3 Energy Use
Consumer Goods
Packaging
Transportation
Construction
Agriculture
Pharmaceuticals
• Novel processes/energy optimization• Alternative feedstock and fuels• Electrification• Carbon management (CCS)
• Reduced use: novel materials, new application/forming techniques, improved performance/life, etc.
• Recycling

The Future of Petrochemicals, IEA, Oct. 2018; Decarbonization of industrial sectors: the next frontier, McKinsey& Company, June 2018 7
A Variety of Feedstocks And Fuels Are Under Exploration OR In Use
Notable Examples:• Bioethanol/ethylene in Brazil• Electrolyzers for H2
• Coke Oven Gas (off gas from iron and steel) used to generate 20% of methanol in China
Sustainably produced biomass available could supply up to 90 EJ/yr to all of the industrial sector – it can only be a partial solution for the Chemical Industry which used 43 EJ/yr in 2015
Investment Is Needed• Venture capital investments in clean tech sector have decreased
dramatically since 2011• Biomass conversion investments have dropped since 2015• Equipment costs for handling biomass ~7X more expensive

New Feedstocks Are Being Proposed For Commodity Chemicals
Adapted from Carbon Dioxide Utilization (CO2U) ICEF Roadmap 2.0, Nov. 2017 8
CO2
CH4
H2O
Direct ReactionCO2 + H2
CO2 Reforming Processes CO2 + CH4 2CO + 2H2
RWGSCO2 + H2 CO + H2O
Co-Electrolysis2CO2 + e- 2CO + O22H2O + 4e- 2H2 + O2
CH4 Reforming + WGSCH4 + 2H2O CO2 + 4H2
Electrolysis2H2O + 4e- 2H2 + O2
Syngas Routes
Fischer-TropschCO+ H2
Syngas to MethanolCO+ 2H2 CH3OH
H2
CO2 (to Geological Storage)
DME
CH4
CH3OH
Alkanes
Alkenes

One CCU Model Explored Highlights The Complexity
A. Katelhon, et al. PNAS 2019, 116, 11187 9
H2 From Water Electrolysis
CO2 From Point Source (100%)
Methanol
Methane NH3
Olefins, BTX
Results:
• Mass flows increased by 287% larger plants will be required or significant intensification will need to be developed
• 32 PWh of electricity needed 97% of projected world electricity supply by 2030
• If all additional electricity were renewable, 222% of targeted installation would be required
• If oil is $92.3/barrel, electricity is $1.8 – 3.5 kg/H2, additional operating costs would be $564-1,570 billion annually
• The additional costs would be 59-164% of 2017 market value for these 20 chemicals
• Costs for CO2 reduction would be $168-467/t CO2 equivalent

CCU Thermodynamics Are Challenging
Insert footer here
10
-450
-400
-350
-300
-250
-200
-150
-100
-50
0
50H
eat
of F
orm
atio
n pe
r C A
tom
, kJ
/mol
CFuels, Many Plastics, &
Primary Feedstocks
Syn-Gas Derivatives, Biomass & Oxygenates
Formic Acid and CO2Combustion
CCU
Adapted from M. Bender, et al., Chem. Ing. Tech. 2018, 60, 1.
www.carbolrecycling.is, accessed July 21,2019, Gaseous Carbon Waste Streams Utilization Status and Research Needs, NAS, 2019 11
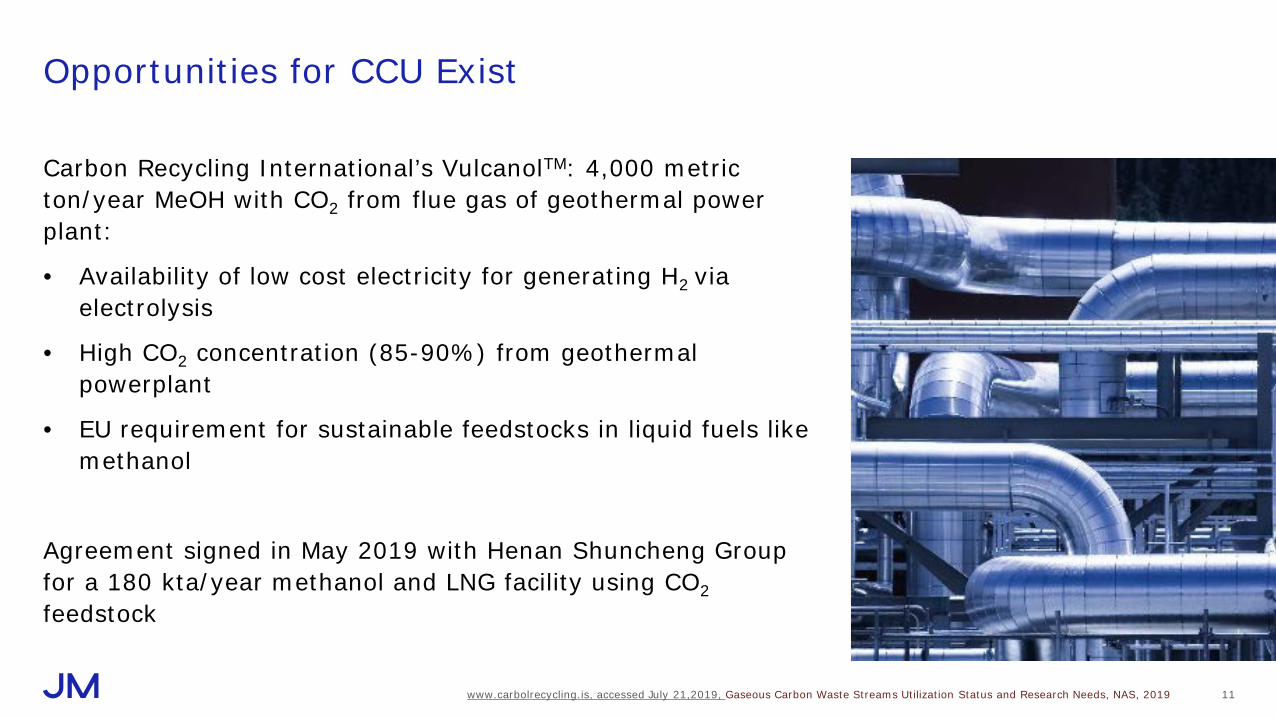
Opportunities for CCU Exist
Carbon Recycling International’s VulcanolTM: 4,000 metric ton/year MeOH with CO2 from flue gas of geothermal power plant:
• Availability of low cost electricity for generating H2 via electrolysis
• High CO2 concentration (85-90%) from geothermal powerplant
• EU requirement for sustainable feedstocks in liquid fuels like methanol
Agreement signed in May 2019 with Henan Shuncheng Group for a 180 kta/year methanol and LNG facility using CO2feedstock

Integration and Scale Add Complexity & Opportunity
Adapted from The Chemical Industry Reimagined, EY, 2018 12
Inorganics Oil & Gas Industrial Gases
salt, ores, carbonates, silicon, phosphorous, etc.
caustic, chlorine, TiO2, silicon, etc.
natural gas naphtha heavy oil
C2s, C3s, C4s, C5s, aromatics
wax, lubricants, fuels
air gases, H2, etc.
crop protection
fertilizers
seeds
plastics, pigments & industrial coatings, adhesives, catalysts, detergents, construction chemicals, glass manufacturing,
etc.
consumer care, food additives, flavors & fragrances, paints and coatings, surfactants, vitamins, etc.
industrial manufacturing, steel production, chemical
manufacturing
Com
mod
ity C
hem
icals
Agric
ultu
re C
hem
icals
Spec
ialty
Che
mica
ls
Consumer Chemicals

Decarbonization of industrial sectors: the next frontier, McKinsey & Company, June 2018 13
McKinsey & Company 2018 estimates:
• $25/MWh renewable electricity needed for greenfield ethylene plant electrification
• $15/MWh renewable electricity needed for brownfield ethylene plant electrification
For electrification to be cost-competitive to using CCS for CO2 management
Need For Integration Consideration Evident In An Ethylene Cracker Electrification ExampleEthylene production generates 0.2 GT CO2/year or ~10% CO2of the chemical industry from fuel for the furnaces
Currently no commercial high temperature electric furnaces are available
• Expected to be more efficient than current combustion
• Less heat available for downstream processes, so they would need to be electrified as well

Current Infrastructure Build Out Adds To The Complexity
Adapted from The Chemical Industry Reimagined, EY, 2018 14
Inorganics Oil & Gas Industrial Gases
salt, ores, carbonates, silicon, phosphorous, etc.
caustic, chlorine, TiO2, silicon, etc.
natural gas naphtha heavy oil
C2s, C3s, C4s, C5s, aromatics
wax, lubricants, fuels
air gases, H2, etc.
crop protection
fertilizers
seeds
plastics, pigments & industrial coatings, adhesives, catalysts, detergents, construction chemicals, glass manufacturing,
etc.
consumer care, food additives, flavors & fragrances, paints and coatings, surfactants, vitamins, etc.
industrial manufacturing, steel production, chemical
manufacturing
Com
mod
ity C
hem
icals
Agric
ultu
re C
hem
icals
Spec
ialty
Che
mica
ls
Consumer Chemicals

Current Infrastructure Build Out Adds To The Complexity
Adapted from The Chemical Industry Reimagined, EY, 2018 15
Inorganics Oil & Gas Industrial Gases
salt, ores, carbonates, silicon, phosphorous, etc.
caustic, chlorine, TiO2, silicon, etc.
natural gas naphtha heavy oil
C2s, C3s, C4s, C5s, aromatics
wax, lubricants, fuels
air gases, H2, etc.
crop protection
fertilizers
seeds
plastics, pigments & industrial coatings, adhesives, catalysts, detergents, construction chemicals, glass manufacturing,
etc.
consumer care, food additives, flavors & fragrances, paints and coatings, surfactants, vitamins, etc.
industrial manufacturing, steel production, chemical
manufacturing
Com
mod
ity C
hem
icals
Agric
ultu
re C
hem
icals
Spec
ialty
Che
mica
ls
Consumer Chemicals
“The biggest obstacle to innovation is a paid off plant.” –From the Innovation Abyss by Chris DeArmitt
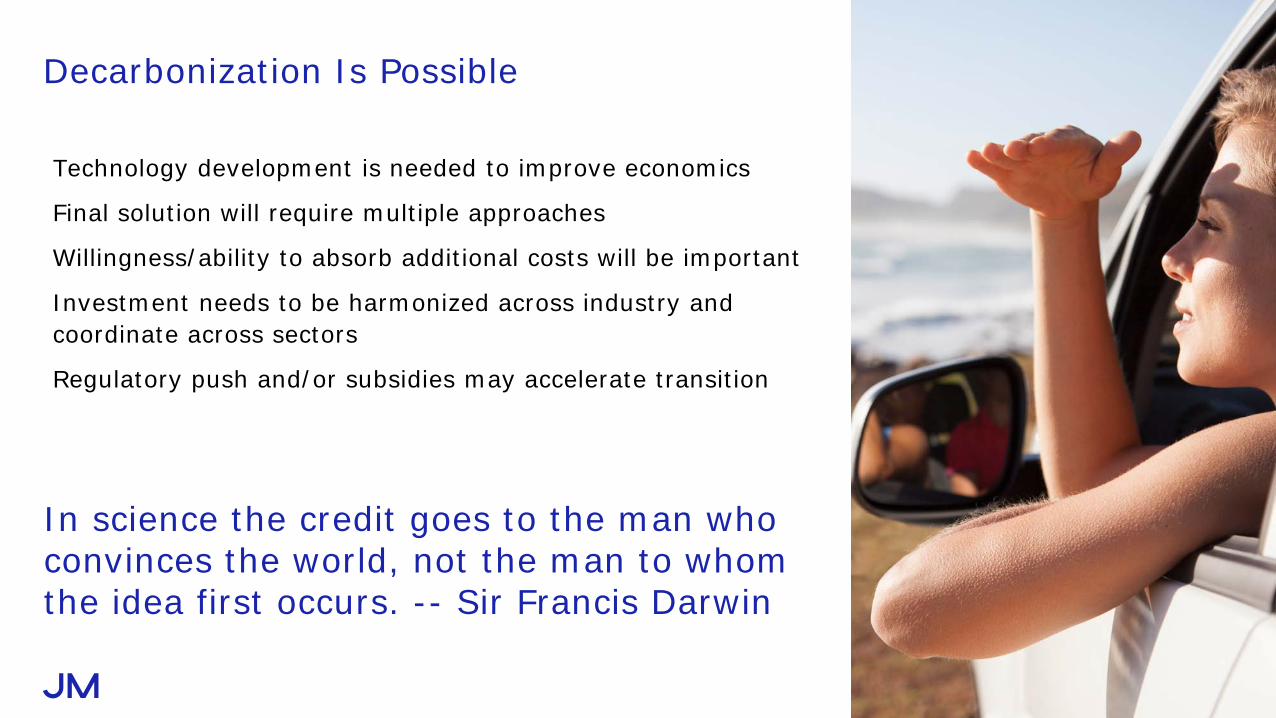
Decarbonization Is Possible
Technology development is needed to improve economics
Final solution will require multiple approaches
Willingness/ability to absorb additional costs will be important
Investment needs to be harmonized across industry and coordinate across sectors
Regulatory push and/or subsidies may accelerate transition
In science the credit goes to the man who convinces the world, not the man to whom the idea first occurs. -- Sir Francis Darwin