Decadal changes in fire frequencies shift tree communities ...
21
ARTICLES https://doi.org/10.1038/s41559-021-01401-7 1 Department of Earth System Science, Stanford University, Stanford, CA, USA. 2 Department of Plant Sciences, University of Cambridge, Cambridge, UK. 3 Department of Natural Resources & Environmental Science, University of Nevada, Reno, NV, USA. 4 Department of Environmental Systems Science, Institute of Integrative Biology, ETH Zürich, Zürich, Switzerland. 5 Physical and Life Sciences Directorate, Lawrence Livermore National Laboratory, Livermore, CA, USA. 6 Department of Ecology and Evolutionary Biology, Yale University, New Haven, CT, USA. 7 Southern Research Station, USDA Forest Service, Auburn, AL, USA. 8 National Parks Service, Sequoia & Kings Canyon National Parks, Three Rivers, CA, USA. 9 Department of Forestry, Wildlife, and Fisheries, University of Tennessee, Knoxville, TN, USA. 10 Scientific Services, South African National Parks, Kruger National Park, Skukuza, South Africa. 11 School of Natural Resource Management, Nelson Mandela University, Port Elizabeth, South Africa. 12 Southern Research Station, USDA Forest Service, Pineville, LA, USA. 13 Department of Ecology, Evolution, and Behavior, University of Minnesota, St. Paul, MN, USA. 14 Department of Plant and Microbial Biology, North Carolina State University, Raleigh, NC, USA. 15 School of Forestry & Wildlife Sciences, Auburn University, Auburn, AL, USA. 16 Department of Agriculture and Fisheries, Queensland Government, Brisbane, Queensland, Australia. 17 Rocky Mountain Research Station, USDA Forest Service, Flagstaff, AZ, USA. 18 Forestry Program, Holdsworth Natural Resources Center, University of Massachusetts, Amherst, MA, USA. 19 Department of Biology, Stanford University, Stanford, CA, USA. 20 Department of Forest Resources, University of Minnesota, St. Paul, MN, USA. 21 Hawkesbury Institute for the Environment, Western Sydney University, Penrith, New South Wales, Australia. 22 School of Geosciences, University of Edinburgh, Edinburgh, UK. 23 College of Natural Resources, University of Wisconsin–Stevens Point, Stevens Point, WI, USA. 24 Department of Geography, University of Colorado-Boulder, Boulder, CO, USA. 25 Division of Forestry and Natural Resources, West Virginia University, Morgantown, WV, USA. 26 Northern Research Station, USDA Forest Service, Houghton, MI, USA. 27 Department of Integrative Biology, University of Wisconsin, Madison, WI, USA. 28 Tall Timbers Research Station, Tallahassee, FL, USA. 29 Woods Institute for the Environment, Stanford University, Stanford, CA, USA. 30 Precourt Institute for Energy, Stanford University, Stanford, CA, USA. ✉ e-mail: [email protected] E cosystem resilience to changing fire regimes 1–3 will be a key determinant of how terrestrial ecosystems respond to global change 3,4 . Fire is a pervasive disturbance, burning ~5% of global land area each year and releasing carbon stored in plant bio- mass equivalent to ~20% of anthropogenic fossil fuel emissions 5 . Historically, much of this carbon is re-sequestered through time as plants recover and regrow, then lost again in the next fire. However, in many systems, changes in climate and land use have shifted fire frequencies, potentially changing the ability of plants, especially trees, to regrow between fires 1,6–8 . Although trees can be top-killed in fires, previous studies have presented mixed results for the effect of burning frequency on tree biomass 9–13 , highlighting the need to understand the factors lead- ing to different fire effects. Climate extremes can moderate fire effects on trees by influencing both tree growth and mortality as well as fire intensity: sites with strong wet seasons have trees lack- ing physiological adaptations to burning 14 , and sites with strong dry seasons can have intense fires and droughts 15 . Furthermore, trees in different ecosystems respond to changes in fire frequency dif- ferently, partly owing to fuel load and composition but also their physiology 16 . For example, traits conferring physiological protec- tion from heating during fire and/or the capacity to colonize and regrow rapidly could decrease tree biomass losses under frequent burning 13,17,18 . Tests of these hypotheses using observational data are Decadal changes in fire frequencies shift tree communities and functional traits Adam F. A. Pellegrini 1,2 ✉ , Tyler Refsland 3 , Colin Averill 4 , César Terrer 1,5 , A. Carla Staver 6 , Dale G. Brockway 7 , Anthony Caprio 8 , Wayne Clatterbuck 9 , Corli Coetsee 10,11 , James D. Haywood 12 , Sarah E. Hobbie 13 , William A. Hoffmann 14 , John Kush 15 , Tom Lewis 16 , W. Keith Moser 17 , Steven T. Overby 17 , William A. Patterson III 18 , Kabir G. Peay 19 , Peter B. Reich 20,21 , Casey Ryan 22 , Mary Anne S. Sayer 12 , Bryant C. Scharenbroch 23 , Tania Schoennagel 24 , Gabriel Reuben Smith 4,19 , Kirsten Stephan 25 , Chris Swanston 26 , Monica G. Turner 27 , J. Morgan Varner 28 and Robert B. Jackson 1,29,30 Global change has resulted in chronic shifts in fire regimes. Variability in the sensitivity of tree communities to multi-decadal changes in fire regimes is critical to anticipating shifts in ecosystem structure and function, yet remains poorly understood. Here, we address the overall effects of fire on tree communities and the factors controlling their sensitivity in 29 sites that expe- rienced multi-decadal alterations in fire frequencies in savanna and forest ecosystems across tropical and temperate regions. Fire had a strong overall effect on tree communities, with an average fire frequency (one fire every three years) reducing stem density by 48% and basal area by 53% after 50 years, relative to unburned plots. The largest changes occurred in savanna eco- systems and in sites with strong wet seasons or strong dry seasons, pointing to fire characteristics and species composition as important. Analyses of functional traits highlighted the impact of fire-driven changes in soil nutrients because frequent burning favoured trees with low biomass nitrogen and phosphorus content, and with more efficient nitrogen acquisition through ectomy- corrhizal symbioses. Taken together, the response of trees to altered fire frequencies depends both on climatic and vegetation determinants of fire behaviour and tree growth, and the coupling between fire-driven nutrient losses and plant traits. NATURE ECOLOGY & EVOLUTION | VOL 5 | APRIL 2021 | 504–512 | www.nature.com/natecolevol 504
Transcript of Decadal changes in fire frequencies shift tree communities ...

Articleshttps://doi.org/10.1038/s41559-021-01401-7
1Department of Earth System Science, Stanford University, Stanford, CA, USA. 2Department of Plant Sciences, University of Cambridge, Cambridge, UK. 3Department of Natural Resources & Environmental Science, University of Nevada, Reno, NV, USA. 4Department of Environmental Systems Science, Institute of Integrative Biology, ETH Zürich, Zürich, Switzerland. 5Physical and Life Sciences Directorate, Lawrence Livermore National Laboratory, Livermore, CA, USA. 6Department of Ecology and Evolutionary Biology, Yale University, New Haven, CT, USA. 7Southern Research Station, USDA Forest Service, Auburn, AL, USA. 8National Parks Service, Sequoia & Kings Canyon National Parks, Three Rivers, CA, USA. 9Department of Forestry, Wildlife, and Fisheries, University of Tennessee, Knoxville, TN, USA. 10Scientific Services, South African National Parks, Kruger National Park, Skukuza, South Africa. 11School of Natural Resource Management, Nelson Mandela University, Port Elizabeth, South Africa. 12Southern Research Station, USDA Forest Service, Pineville, LA, USA. 13Department of Ecology, Evolution, and Behavior, University of Minnesota, St. Paul, MN, USA. 14Department of Plant and Microbial Biology, North Carolina State University, Raleigh, NC, USA. 15School of Forestry & Wildlife Sciences, Auburn University, Auburn, AL, USA. 16Department of Agriculture and Fisheries, Queensland Government, Brisbane, Queensland, Australia. 17Rocky Mountain Research Station, USDA Forest Service, Flagstaff, AZ, USA. 18Forestry Program, Holdsworth Natural Resources Center, University of Massachusetts, Amherst, MA, USA. 19Department of Biology, Stanford University, Stanford, CA, USA. 20Department of Forest Resources, University of Minnesota, St. Paul, MN, USA. 21Hawkesbury Institute for the Environment, Western Sydney University, Penrith, New South Wales, Australia. 22School of Geosciences, University of Edinburgh, Edinburgh, UK. 23College of Natural Resources, University of Wisconsin–Stevens Point, Stevens Point, WI, USA. 24Department of Geography, University of Colorado-Boulder, Boulder, CO, USA. 25Division of Forestry and Natural Resources, West Virginia University, Morgantown, WV, USA. 26Northern Research Station, USDA Forest Service, Houghton, MI, USA. 27Department of Integrative Biology, University of Wisconsin, Madison, WI, USA. 28Tall Timbers Research Station, Tallahassee, FL, USA. 29Woods Institute for the Environment, Stanford University, Stanford, CA, USA. 30Precourt Institute for Energy, Stanford University, Stanford, CA, USA. ✉e-mail: [email protected]
Ecosystem resilience to changing fire regimes1–3 will be a key determinant of how terrestrial ecosystems respond to global change3,4. Fire is a pervasive disturbance, burning ~5% of
global land area each year and releasing carbon stored in plant bio-mass equivalent to ~20% of anthropogenic fossil fuel emissions5. Historically, much of this carbon is re-sequestered through time as plants recover and regrow, then lost again in the next fire. However, in many systems, changes in climate and land use have shifted fire frequencies, potentially changing the ability of plants, especially trees, to regrow between fires1,6–8.
Although trees can be top-killed in fires, previous studies have presented mixed results for the effect of burning frequency on tree
biomass9–13, highlighting the need to understand the factors lead-ing to different fire effects. Climate extremes can moderate fire effects on trees by influencing both tree growth and mortality as well as fire intensity: sites with strong wet seasons have trees lack-ing physiological adaptations to burning14, and sites with strong dry seasons can have intense fires and droughts15. Furthermore, trees in different ecosystems respond to changes in fire frequency dif-ferently, partly owing to fuel load and composition but also their physiology16. For example, traits conferring physiological protec-tion from heating during fire and/or the capacity to colonize and regrow rapidly could decrease tree biomass losses under frequent burning13,17,18. Tests of these hypotheses using observational data are
Decadal changes in fire frequencies shift tree communities and functional traitsAdam F. A. Pellegrini 1,2 ✉, Tyler Refsland 3, Colin Averill4, César Terrer 1,5, A. Carla Staver 6, Dale G. Brockway7, Anthony Caprio8, Wayne Clatterbuck9, Corli Coetsee10,11, James D. Haywood12, Sarah E. Hobbie 13, William A. Hoffmann 14, John Kush15, Tom Lewis16, W. Keith Moser17, Steven T. Overby17, William A. Patterson III18, Kabir G. Peay 19, Peter B. Reich 20,21, Casey Ryan 22, Mary Anne S. Sayer12, Bryant C. Scharenbroch23, Tania Schoennagel24, Gabriel Reuben Smith 4,19, Kirsten Stephan25, Chris Swanston 26, Monica G. Turner 27, J. Morgan Varner28 and Robert B. Jackson 1,29,30
Global change has resulted in chronic shifts in fire regimes. Variability in the sensitivity of tree communities to multi-decadal changes in fire regimes is critical to anticipating shifts in ecosystem structure and function, yet remains poorly understood. Here, we address the overall effects of fire on tree communities and the factors controlling their sensitivity in 29 sites that expe-rienced multi-decadal alterations in fire frequencies in savanna and forest ecosystems across tropical and temperate regions. Fire had a strong overall effect on tree communities, with an average fire frequency (one fire every three years) reducing stem density by 48% and basal area by 53% after 50 years, relative to unburned plots. The largest changes occurred in savanna eco-systems and in sites with strong wet seasons or strong dry seasons, pointing to fire characteristics and species composition as important. Analyses of functional traits highlighted the impact of fire-driven changes in soil nutrients because frequent burning favoured trees with low biomass nitrogen and phosphorus content, and with more efficient nitrogen acquisition through ectomy-corrhizal symbioses. Taken together, the response of trees to altered fire frequencies depends both on climatic and vegetation determinants of fire behaviour and tree growth, and the coupling between fire-driven nutrient losses and plant traits.
NATuRE ECOLOGy & EVOLuTION | VOL 5 | APRIL 2021 | 504–512 | www.nature.com/natecolevol504
ArticlesNATurE EcoloGy & EVoluTioN
limited by the collinearity between fire regime and environmental variables at individual sites19,20; instead, tests require experimental manipulations across broad geographic ranges that are long-term, ideally multi-decadal, because fire-driven mortality and top-kill can take decades to impact the tree community10,13,21.
In addition to external factors, changes within the tree commu-nity can modify the effect of repeated fires through the increasing abundance of species that are more tolerant of the direct and indi-rect effects of fire. Fire effects may be buffered by the colonization and growth of species with structural traits that help trees to avoid heat-induced mortality, but also of species with different nutrient use and acquisition traits that help plants optimize for fire-driven changes in nutrient availability22,23. Such shifts in nutrient use and acquisition strategies have ecosystem-level implications, as changes in these traits significantly influence soil nutrient cycling24,25. For example, plants that form symbioses with ectomycorrhizal (ECM) fungi, arbuscular mycorrhizal (AM) fungi, or nitrogen-fixing bacte-ria may be better equipped to access nutrients26 that can be depleted under frequent burning22. The distinction between strategies is key because ECM plants tend to slow nutrient cycling and pro-ductivity, while arbuscular and nitrogen-fixing species accelerate nutrient cycling and productivity24–26. Tissue stoichiometry is also relevant, with species containing lower nutrient concentrations bet-ter equipped to tolerate low nutrient supply, but in turn contributing to slower nutrient turnover and lower nutrient availability24,25. Thus, how fire filters for species with different nutrient use and acquisi-tion strategies can influence long-term site productivity.
Here, we evaluate how changes in fire frequency alter tree communities, and how climate, vegetation composition and soils influence the variability in the sensitivity of trees to changing fire regimes. Furthermore, we quantify how fire changes the distribu-tion of functional traits in the tree community to evaluate multiple nutrient use traits that are indicative of tree responses to fire-driven changes in nutrients. We combined published data with new sur-veys on tree populations from 29 sites and 374 plots in four con-tinents. At 27 of the sites (324 plots), surface fire frequency was experimentally manipulated or varied naturally for 16–64 years (mean of 30 years), and at two sites (50 plots), natural variation in crown fire frequency presented a natural experiment. We focused on tree responses because of their importance for carbon storage, ecosystem productivity, and nutrient cycling23,27,28. The sites cover locations in North America (coniferous, deciduous and mixed for-ests, and broadleaf savanna), South America (tropical savanna and temperate shrubland), Africa (broadleaf savanna) and Australia (wet and dry eucalyptus forests), all of which are ecosystems that experience frequent burning (Extended Data Fig. 1, Supplementary Table 1 and Supplementary Information). For our main analysis, we define ecosystems broadly based on dominant fuel type (grass ver-sus tree litter) and tree functional composition (angiosperm broad-leaf versus gymnosperm needleleaf trees), but test the robustness of our conclusions to other classifications. Each surface fire site con-tains replicate plots including an unburned treatment and differ-ent prescribed burning frequencies (Extended Data Fig. 2), where fire frequencies ranged from approximately one fire every decade to one fire every year (Supplementary Table 1). We evaluated the effects of fire alone and in combination with environmental covari-ates using model selection (Supplementary Information) to test the importance of climate, soil and species composition in modifying the effect of fire.
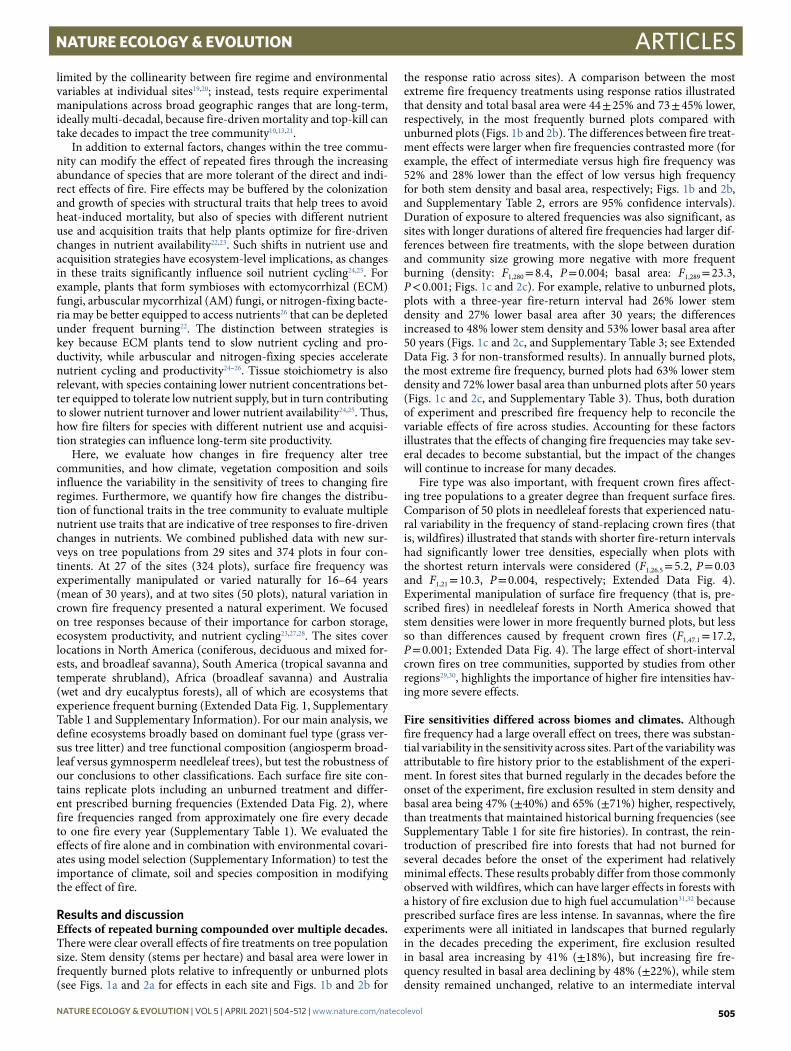
Results and discussionEffects of repeated burning compounded over multiple decades. There were clear overall effects of fire treatments on tree population size. Stem density (stems per hectare) and basal area were lower in frequently burned plots relative to infrequently or unburned plots (see Figs. 1a and 2a for effects in each site and Figs. 1b and 2b for
the response ratio across sites). A comparison between the most extreme fire frequency treatments using response ratios illustrated that density and total basal area were 44 ± 25% and 73 ± 45% lower, respectively, in the most frequently burned plots compared with unburned plots (Figs. 1b and 2b). The differences between fire treat-ment effects were larger when fire frequencies contrasted more (for example, the effect of intermediate versus high fire frequency was 52% and 28% lower than the effect of low versus high frequency for both stem density and basal area, respectively; Figs. 1b and 2b, and Supplementary Table 2, errors are 95% confidence intervals). Duration of exposure to altered frequencies was also significant, as sites with longer durations of altered fire frequencies had larger dif-ferences between fire treatments, with the slope between duration and community size growing more negative with more frequent burning (density: F1,280 = 8.4, P = 0.004; basal area: F1,289 = 23.3, P < 0.001; Figs. 1c and 2c). For example, relative to unburned plots, plots with a three-year fire-return interval had 26% lower stem density and 27% lower basal area after 30 years; the differences increased to 48% lower stem density and 53% lower basal area after 50 years (Figs. 1c and 2c, and Supplementary Table 3; see Extended Data Fig. 3 for non-transformed results). In annually burned plots, the most extreme fire frequency, burned plots had 63% lower stem density and 72% lower basal area than unburned plots after 50 years (Figs. 1c and 2c, and Supplementary Table 3). Thus, both duration of experiment and prescribed fire frequency help to reconcile the variable effects of fire across studies. Accounting for these factors illustrates that the effects of changing fire frequencies may take sev-eral decades to become substantial, but the impact of the changes will continue to increase for many decades.
Fire type was also important, with frequent crown fires affect-ing tree populations to a greater degree than frequent surface fires. Comparison of 50 plots in needleleaf forests that experienced natu-ral variability in the frequency of stand-replacing crown fires (that is, wildfires) illustrated that stands with shorter fire-return intervals had significantly lower tree densities, especially when plots with the shortest return intervals were considered (F1,26.5 = 5.2, P = 0.03 and F1,21 = 10.3, P = 0.004, respectively; Extended Data Fig. 4). Experimental manipulation of surface fire frequency (that is, pre-scribed fires) in needleleaf forests in North America showed that stem densities were lower in more frequently burned plots, but less so than differences caused by frequent crown fires (F1,47.1 = 17.2, P = 0.001; Extended Data Fig. 4). The large effect of short-interval crown fires on tree communities, supported by studies from other regions29,30, highlights the importance of higher fire intensities hav-ing more severe effects.
Fire sensitivities differed across biomes and climates. Although fire frequency had a large overall effect on trees, there was substan-tial variability in the sensitivity across sites. Part of the variability was attributable to fire history prior to the establishment of the experi-ment. In forest sites that burned regularly in the decades before the onset of the experiment, fire exclusion resulted in stem density and basal area being 47% (±40%) and 65% (±71%) higher, respectively, than treatments that maintained historical burning frequencies (see Supplementary Table 1 for site fire histories). In contrast, the rein-troduction of prescribed fire into forests that had not burned for several decades before the onset of the experiment had relatively minimal effects. These results probably differ from those commonly observed with wildfires, which can have larger effects in forests with a history of fire exclusion due to high fuel accumulation31,32 because prescribed surface fires are less intense. In savannas, where the fire experiments were all initiated in landscapes that burned regularly in the decades preceding the experiment, fire exclusion resulted in basal area increasing by 41% (±18%), but increasing fire fre-quency resulted in basal area declining by 48% (±22%), while stem density remained unchanged, relative to an intermediate interval
NATuRE ECOLOGy & EVOLuTION | VOL 5 | APRIL 2021 | 504–512 | www.nature.com/natecolevol 505

Articles NATurE EcoloGy & EVoluTioN
that maintained the pre-experiment frequency (statistics from log response ratios ±95% confidence intervals, P < 0.001 for both basal area comparisons; Supplementary Information). Taken together, the largest effects of altered fire frequencies were owing to fire exclusion in landscapes that had burned regularly for the past few decades.
Model selection illustrated that climate, vegetation type and con-tinent played significant roles in explaining the variability in the sen-sitivity of trees to fire. Fire effects were largest in areas that received more rainfall in the wet season, less rainfall in the dry season and had lower mean annual temperatures (F1,285.1 = 50.3, P < 0.001; F1,285.6 = 7.5, P = 0.007; and F1,280.8 = 16.8, P < 0.001, respectively; Fig. 3a–c and Supplementary Table 4; see Supplementary Table 5 for stem density). For example, plots that experienced more frequent burning (two fires every three years, one standard deviation above mean frequency) had 65% lower tree basal area than unburned plots in sites with high wet season precipitation. In sites with average wet season precipitation, the difference between the same treatments was only 22% (Fig. 3a, Extended Data Fig. 5 and Supplementary Table 4; see Supplementary Information for details on calculations).
Dry season precipitation had the opposite correlation with fire effects: sites with lower precipitation in the dry season experi-enced twice as large an effect of fire on basal area (frequent burning resulted in 44% versus 22% lower tree basal area in sites with low versus average dry season precipitation; Fig. 3c and Supplementary Table 4). The contrasting response to precipitation in the wet versus dry season is consistent with our understanding that fires are most intense in areas with stronger wet seasons (leading to more fuel) and more severe dry seasons (lower fuel moisture), thus contrib-uting to potential losses with more frequent burning33–35. Rainfall in the dry season probably also influences fire effects by determin-ing the water available for tree growth. Neither soil texture nor soil carbon explained the sensitivity to changing fire frequencies across sites (Supplementary Table 4). Thus, climate was a key determinant of fire effects, with more moderately seasonal sites being the least sensitive to changing fire regimes.
The effect of fire on tree basal area also differed across eco-systems, with frequent burning having a larger effect on tree basal area in savannas relative to broadleaf and needleleaf forests
–5
–4
9
8
7
6
5
4
10 29 48 67 67 6710 29
Years of repeated burning
48 10 29 48
–3
–2
–1
0.5
0
–0.5
–1
0
1
2a
c
b
Bau
ple
Dry
Pea
ches
ter
Hig
hlan
d R
imLo
mba
rdM
orto
nU
nive
rsity
Mis
sour
iA
lapa
haC
him
ney
Spr
ing
Esc
ambi
aH
itchi
tiK
ings
Can
yon
Kis
atch
ieLi
mes
tone
Seq
uoia
Tal
l Tim
bers
Wha
rton
Yel
lSto
nLY
ellS
tonH
Ced
ar C
reek
IBG
EK
ruge
r M
opan
iK
ruge
r P
reto
riusk
opK
ruge
r S
atar
aK
ruge
r S
kuku
zaLa
mto
La P
ampa
Mar
onde
ra
Broadleaf forest
Needleleaf forest
Savanna
Fire frequency 0–0.21 yr–1 Fire frequency 0.22–0.66 yr–1 Fire frequency 0.67–1 yr–1
Low versushigh
Low versusmid
Mid versushigh
Treatment comparisons
Par
tial r
esid
ual l
og(s
tem
den
sity
)S
tem
den
sity
log(
RR
)
Ste
m d
ensi
ty lo
g(R
R)
Fig. 1 | Tree stem density declines with both fire frequency and duration of fire regime. a,b, log response ratios (RR) of stem densities and the surrounding 95% confidence intervals. Shown are comparisons between ln (burned/unburned) treatments within each individual site coloured by broad ecosystem categorization with the burned treatment being the most extreme fire frequency treatments in a (a; n = 25; Supplementary Table 1, ecosystem groups based on broad differences in fire fuel and tree composition; Supplementary Information). Also shown are averages across all sites comparing the different levels of fire frequency in studies with ≥3 levels; less frequent treatment always in denominator (b; n = 23, n = 17, n = 18; Supplementary Table 2). c, Partial residuals plot from a mixed-effects model including fire frequency, the number of years of repeated burning and their interaction for ln stem density (n = 303; Supplementary Table 3); site was used as a random intercept. Panels are centred on cross-section values of one fire every ten years, one every three years and one every year, but encompass a range of fire frequencies within each panel. IBGE, Reserva Ecológica do IBGE; YellStonL, Yellowstone low severity; YellStonH, Yellowstone high severity.
NATuRE ECOLOGy & EVOLuTION | VOL 5 | APRIL 2021 | 504–512 | www.nature.com/natecolevol506

ArticlesNATurE EcoloGy & EVoluTioN
(F2,279.7 = 14.0, P < 0.001, model incorporating climate effects; Fig. 3d and Supplementary Table 4). Relative to the unburned plots, basal area in frequently burned plots was 5% lower in needleleaf forests and 22% lower in broadleaf forests (Fig. 3d, burn frequency of two fires every three years; Supplementary Information; continent dif-ferences in Extended Data Fig. 6). In savannas, frequently burned plots had 70% lower basal area relative to the unburned plots (Fig. 3d and Supplementary Table 4). Interestingly, stem density responses to fire frequency were qualitatively different between savannas and forests (Supplementary Table 5). Stem densities increased with more frequent burning in forests while basal area decreased, poten-tially due to higher light availability and tree recruitment in the for-ests. To assess the sensitivity of these findings to our classification of ecosystem type, we also tried using a subdivided classification by partitioning broadleaf forests into oak and eucalypt types, and needleleaf forests into those that transitioned between oak and pine dominated (Supplementary Table 1). When included in the final model, the subdivided vegetation classification still had a significant
main effect (F4,16.8 = 11.1, P = 0.0001) and a significant interaction with fire frequency (F4,282.5 = 7.1, P < 0.001; Extended Data Fig. 7), with basal area in savannas responding the most to changes in fire frequency (Extended Data Figs. 7 and 8).
Fire changed the functional composition of tree communities. Fire-driven changes in basal area and stem density are important for ecosystem function, but fire can also impact ecosystems by chang-ing the functional composition of trees. To address this, we anal-ysed functional composition in only the experiments from North America (77 tree species, 16 sites, 181 plots) because trait data were available there to (1) categorize species by nutrient acquisition strat-egies and (2) assign wood, leaf and root traits related to growth, sur-vival and nutrient use strategies.
We found that structural traits were important for explaining cross-site variability in the sensitivity of tree communities to fire. Across sites, frequent burning impacted basal area more where tree species had thinner bark and denser wood (bark thickness:
–1
0
1
2
3
4
5
Par
tial r
esid
ual l
og(b
asal
are
a)
Bas
al a
rea
log(
RR
)
–3.00
–2.00
–1.00
0
1.00
–5
–4
–3
–2
–1
0
1
2a
c
b
Bas
al a
rea
log(
RR
)
Broadleaf forest
Needleleaf forest
Savanna
Bau
ple
Dry
Pea
ches
ter
Hig
hlan
d R
imLo
mba
rdM
orto
nO
kmul
gee
Uni
vers
ity M
isso
uri
Wet
Pea
ches
ter
Ala
paha
Chi
mne
y S
prin
gE
scam
bia
Hitc
hiti
Kin
gs C
anyo
nK
isat
chie
Lim
esto
neS
equo
iaT
all T
imbe
rsW
hart
onC
edar
Cre
ekIB
GE
Kru
ger
Mop
ani
Kru
ger
Pre
toriu
skop
Kru
ger
Sat
ara
Kru
ger
Sku
kuza
Mar
onde
ra
Low versushigh
Low versusmid
Mid versushigh
Treatment comparisons
Fire frequency 0–0.21 yr–1 Fire frequency 0.22–0.66 yr–1 Fire frequency 0.67–1 yr–1
10 29 48 67 67 6710 29
Years of repeated burning
48 10 29 48
Fig. 2 | Tree basal area declines with both fire frequency and duration of fire regime. a,b, log response ratios of basal area and the surrounding 95% confidence intervals. Shown are comparisons within each individual site coloured by broad ecosystem categorization in the most extreme fire frequency treatments ln (burned/unburned) (a; n = 23; Supplementary Table 1, ecosystem groups based on broad differences in fire behaviour and tree composition; Supplementary Information). Also shown are averages across all sites comparing the different levels of fire frequency in studies with ≥3 levels; less frequent treatment always in denominator (b; n = 23, n = 17, n = 17; Supplementary Table 2). c, Partial residuals plot from a mixed-effects model including fire frequency, the number of years of repeated burning and their interaction for ln basal area (n = 309; Supplementary Table 3); site was used as a random intercept. Panels are centred on cross-section values of one fire every ten years, one every three years and one every year, but encompass a range of fire frequencies within each panel (ranges: unburned to one every five years; one every five years to two every three years; two every three years to every year).
NATuRE ECOLOGy & EVOLuTION | VOL 5 | APRIL 2021 | 504–512 | www.nature.com/natecolevol 507

Articles NATurE EcoloGy & EVoluTioN
F1,164.3 = 9.2, P = 0.003; wood density: F1,165 = 10, P = 0.002; see Supplementary Table 6 for both in the same model, and Fig. 4a,b). However, within sites we found mixed evidence that fire filtered for species with different structural trait values. Mean wood density
of the tree community tended to be lower in frequently burned plots, potentially because of increasing dominance of gymnosperm trees, which tend to have lower wood density. In contrast, we did not observe any effect of fire on the mean bark investment of the
–1
0
1
2
3
4
a
b
c
d
Par
tial r
esid
ual
log(
basa
l are
a)P
artia
l res
idua
llo
g(ba
sal a
rea)
–1
0
1
2
3
4
0.02 0.34
5–12
MAT (°C)
13–17 18–22
175–301
Precipitation wet quarter (mm):
302–450 451–737 12–79
Precipitation dry quarter (mm):
80–187 188–351
Broadleaf forest Needleleaf forest Savanna
0.66 0.34
Fire frequency (fires yr–1) Fire frequency (fires yr–1)
0.661 0.02 1 0.34 0.660.02 1 0.02 0.34 0.66 0.34 0.661 0.02 1 0.34 0.660.02 1
0.02 0.34 0.66 0.34
Fire frequency (fires yr–1) Fire frequency (fires yr–1)
0.661 0.02 1 0.34 0.660.02 1 0.02 0.34 0.66 0.34 0.661 0.02 1 0.34 0.660.02 1
–1
0
1
2
3
4
–1
0
1
2
3
4
Fig. 3 | Climate and ecosystem type modify effects of fire frequencies on tree basal area. a–d, Partial residual plots of the mixed-effects model illustrating the interactive effects between covariates (site as a random intercept, n = 309 plots, n = 25 sites). Panels centred on cross-sectional values from one standard deviation around the median (−1, 0, 1). MAT, mean annual temperature. Partial residual predictions account for the values of all other covariates in the model. Comparisons of rainfall scenarios relative to the mean in the text used wet season precipitation of +1 standard deviation above the mean (525 versus 375 mm yr−1) and dry season precipitation of −1 standard deviation below the mean (25 versus 133 mm yr−1). The duration of experiment held at its mean of 28 years. All model fits are P < 0.05; statistics are in Supplementary Table 4.
Par
tial r
esid
ual l
og(b
asal
are
a)
0.25
10.5 mm 11.6 mm 16.0 mm 0.38 g cm–3 0.54 g cm–3 0.59 g cm–3
0.50 0.75
Fire frequency (fires yr–1)
Arbuscular mycorrhizal Ectomycorrhizal
Fire frequency (fires yr–1)
Years of repeated burning
1.000
2.0
Rel
ativ
e B
A (
arc
sine
)
1.5
0
0.02 0.34 0.66 1 0.02
Fire frequency (fires yr–1)
0.34 0.66 1 10 29 48 67 10 29 48 67
0.5
1.0
14.8
Gre
en le
af N
(m
g g–1
)
Roo
t N (
mg
g–1)
9.7
12.2
11
7
9
0.25 0.50 0.75 1.000 0.25 0.50 0.75 1.000 0.25 0.50 0.75 1.000 0.25 0.50 0.75 1.000 0.25 0.50 0.75 1.000
3
2
4
5
a
c d
b
Par
tial r
esid
ual l
og(b
asal
are
a)
2
1
3
4
5
Fig. 4 | Functional composition of tree communities both responds to and modifies the effects of frequent burning. a,b, Partial regression plots from mixed-effects models with community-weighted means of bark investment (BI) scaled to a 10 cm stem size (a) and wood density (WD) as modifying variables (b; n = 172 plots, n = 16 sites). Bark investment and wood density were included in the same model and were negatively correlated σ = −0.86. Statistics are in Supplementary Table 6. Basal area is ln transformed. c, Relative basal area of nutrient acquisition strategies (arcsine transformed) of AM versus ECM trees as a function of fire frequency. d, Community-weighted means of nutrient use strategies, showing green leaf and live root N as a function of study duration. Statistics are in Supplementary Tables 7–9 (n = 172 plots and n = 16 sites), which also show data on litter N and resorption. Phosphorus content data are shown in Extended Data Fig. 7.
NATuRE ECOLOGy & EVOLuTION | VOL 5 | APRIL 2021 | 504–512 | www.nature.com/natecolevol508
ArticlesNATurE EcoloGy & EVoluTioN
tree community (Supplementary Table 6), demonstrating that bark investment at the community scale does not appear to change in response to fire. Nevertheless, bark investment helped to predict basal area loss patterns across broad biogeographic scales.
Frequent fire favoured conservative nutrient strategies. We found evidence for compensatory responses in the nutrient use and acqui-sition strategies of the tree communities under different fire fre-quencies. On average, plots burned frequently for longer periods of time were dominated by tree species with low nitrogen (N) concen-trations in green and senesced leaves and roots, and that resorbed a greater proportion of N before leaf senescence (P < 0.001 for all variables; Fig. 4d and Supplementary Table 7). This is consistent with the hypothesis that fire-driven soil N losses22 filter for species with adaptations to low N conditions. Tissue phosphorus (P) con-centrations also declined with frequent burning in leaves and litter but not in roots (Extended Data Fig. 9 and Supplementary Table 7). Given that P is less prone to being lost than N22,36,37, this result was surprising and raises questions about how fire may change the P economy of trees in an opposite way to changes in soil P availability. Taken together, fire filters for species with more conservative nutri-ent use strategies in both their leaves and fine roots across several North American savannas and forests.
Fire also affected the relative abundance of nutrient acquisi-tion strategies, evaluated by trees’ abilities to form symbioses38. Trees that formed symbioses with ECM and AM fungi were the most abundant nutrient acquisition strategies across our plots; eri-coid and nitrogen-fixing trees were absent from most sites (Fig. 4c; categorization based on tree species’ taxonomy38). ECM trees, which associate with fungal symbionts capable of acquiring N from organic matter39, tended to be more successful in frequently burned plots. The relative abundance of ECM trees increased from 85% in unburned plots to nearly 100% in annually burned plots (Fig. 4c and Supplementary Table 8). ECM trees were also more common in warmer climates and on soils with low carbon concentrations (Supplementary Table 8). ECM trees typically have lower con-centrations of N and P in leaves, litter and roots than AM trees38 (Supplementary Table 9), suggesting the turnover in symbiont composition may be driving the shift in stoichiometry of the tree community. As repeated fire tends to decrease inorganic N and N mineralization23, it makes sense that frequent fire causes the tree community to shift towards species capable of obtaining N from soil organic matter.
The tendency for frequently burned plots to have tree communi-ties dominated by ECM species with low N and P content in leaves, roots and litter indicates that frequent burning favours conserva-tive nutrient use and acquisition strategies. This trend is probably a result of fire-driven soil nutrient losses, which should favour species better equipped to cope with low nutrient environments; however, other factors such as phylogenetic conservatism of traits may be at play38. These trait shifts may themselves reinforce an important fire–nutrient feedback if N losses cause a decline in productivity that limits the ability of trees to regrow between fire events, fur-ther decreasing ecosystem N turnover. Our results unpack only one part of this feedback loop (fire effects on traits), and further study is needed to connect changes in strategies with the observed differ-ences in nutrient availability and plant growth.
Our analysis also highlights several areas for future work. For one, an improved representation of fire experiments in different ecosystem types across continents in our dataset (for example, tropical forests in Africa) would help further unpack the variabil-ity across ecosystems and continents. Second, longitudinal data on how fire effects emerge through time could assist with better under-standing how the turnover in tree species composition influences changes in total tree cover within experiments10,18,40. Third, consid-ering other plant groups (for example, herbaceous plants) will help
obtain a more comprehensive picture of how shifting fire regimes change ecosystem function. Finally, the extent of fire effects on plant strategies across temperate ecosystems highlights the need for more studies of plant strategies to consider fire. For example, the effect of fire on fungal symbiosis strategies should be integrated into theories seeking to explain their biogeographic distribution, which generally rely on climatic factors alone41.
Our observation that changing fire frequencies shift both tree basal area and density as well as trait composition is important because it identifies two means by which fire can indirectly alter carbon and nutrient storage in other ecosystem pools, such as soil organic matter. For one, the observed multi-decadal decline in tree populations mirrors multi-decadal shifts in soil carbon and nitrogen22,23, both in timescale and across ecosystems. The greater rates of change in tree population sizes in savannas and broadleaf forests are consistent with the higher losses of mineral soil carbon and nitrogen reported in those ecosystems relative to needleleaf forests22,42. Furthermore, a shift towards conservative nutrient use and acquisition traits is consistent with lower soil N mineralization23,42. Consequently, our findings support hypotheses that fire-driven changes in tree biomass inputs and the turnover of plant traits may both contribute to changes in soil carbon and nutrient pools42–45.
ConclusionsWidespread changes in fire regimes are likely to shift both the popu-lation size and functional composition of tree communities, with both factors affecting the storage and cycling of carbon and nutri-ents. The effects are heterogeneous, however, with certain ecosys-tems being especially sensitive, such as savannas experiencing rapid encroachment of tree cover when fire is excluded. Climatic factors were also key, as regions with extreme precipitation amounts in the wet and dry seasons (high and low, respectively) changed more than areas with more moderate precipitation. The effects of fire were not limited to tree population sizes, but also extended to the func-tional composition of the community. The convergent response of frequent burning promoting conservative nutrient use strategies indicates that fire impacts nutrient cycling not only over decadal timescales, but also suggests that fire probably influences the evo-lution of these plant strategies. Consequently, climatically sensitive shifts in fire frequency, even when relatively low intensity, will alter the structure and functioning of ecosystems through multiple direct and indirect pathways.
MethodsSite descriptions and experimental designs. The majority of sites sampled are in ecosystems that experience surface fires (from fire manipulation experiments, n = 27). Our main analyses are based on the surface fire experiments, but we compare these data with a network of plots across n = 2 sites with natural variability in the frequency of stand-replacing crown fires to evaluate the effect of fire regime. We describe the sites briefly in Supplementary Table 1 and present detailed descriptions of site history in Supplementary Data 3. Most of the data were obtained from existing studies, but we complemented these data with unpublished surveys in the Sequoia and Kings Canyon sites. We identified these sites first by using a list of sites from a previous meta-analysis of multi-decadal changes in fire frequencies22. Not all of the sites in the other study contained vegetation surveys and in some cases the authors of the other studies did not share data. We then complemented these studies with other long-term fire manipulation experiments using a literature search and conference presentations. Finally, data from some of the sites were collected specifically for this study.
The surface fire experiments are mostly experimental prescribed burn plots. The managers generally try to burn in a broad seasonal window (for example, a spring fire in North America may occur anytime from March to May) to optimize burn timing for the local fire conditions most suitable for their planned fire intensities. Treatments were not applied in a uniform fashion across sites, which is one motivation for using mixed-effects models (see description of our statistical approach below).
The sites contained different land use histories before the establishment of the experiment, which was not always documented in detail, but we describe key factors in Supplementary Table 1 and Supplementary Data 3. We describe how we
NATuRE ECOLOGy & EVOLuTION | VOL 5 | APRIL 2021 | 504–512 | www.nature.com/natecolevol 509

Articles NATurE EcoloGy & EVoluTioN
evaluated the potential role of land use history in ‘Testing role of fire and land use history’ in the Supplementary Information.
Environmental data. Soil chemistry. We collected and analysed soil data using several methods. First, we determined the dominant soil type using either author descriptions or reported soil texture analysis. Second, we used the highest resolution soil data possible (for example, soil samples from each replicate plot within a fire treatment), but some sites contained only site-level soil properties. Consequently, we analysed overall effects of fire on all sites without any covariates, followed by a model that uses model selection to account for collinearities among variables when testing for factors that modify fire effects. To extend data on soils across plots, we sampled soils (top 0–5 cm of the mineral horizon) in 24 plots across four sites: Kings Canyon, Sequoia, Limestone Flats and Chimney Springs. Each site contained three replicate plots of an unburned treatment and a high fire frequency treatment. We collected n = 5 pseudo-replicates within the true replicate plot, analysed the soils for carbon and texture, and averaged within each plot. For chemical analyses, soils were sieved to <2 mm, dried to constant weight and ground on a ball mill. Subsets were then analysed using combustion on an elemental analyser at Stanford University; duplicates were run every 10 samples (analytical accuracy was >90%). Texture was analysed using the hydrometer method (adopted from the Kellogg Biological Station, Long-Term Ecological Research, https://lter.kbs.msu.edu/protocols) on sieved soils.
Climate. To obtain long-term climate averages at each site, we used WorldClim46. WorldClim integrates data from 1970–2000 across 9,000–60,000 weather stations and spatially extrapolates the values by integrating other covariates from topography maps and satellite data (described in detail in ref. 46). The timespan of the climate data overlaps the duration of the experiments reasonably well (mean study initiation = 1983; mean survey year = 2006). Managers timed burning to coincide with consistent weather conditions over the course of the experiment, therefore we did not obtain high-resolution interannual variability in climate. We focused on several climate variables based on ecologically relevant a priori hypotheses: (1) precipitation partitioned into the driest and wettest quarters of the year because precipitation influences fuel accumulation (primarily in the wettest quarter) and fire conditions (primarily in the driest quarter); and (2) mean annual temperature because of its large effect on a variety of biogeochemical processes. Precipitation in wet and dry quarters are not as correlated with one another but are highly correlated with mean annual precipitation and temperature (Supplementary Table 10).
Ecosystem type. The vegetation composition at each site differs substantially, ranging from diverse tropical savannas with dozens of tree species (for example, Kruger sites) to monodominant coniferous forests (for example, Limestone Flats and Chimney Springs). Classifying the sites into broad categories was done methodologically, by balancing the need to maintain parsimony (and thus statistical power) with accurately capturing how plant composition may modify fire effects. Consequently, we performed two levels of classification: (1) a coarse categorization separating savannas versus forests, and within forests treating broadleaf and needleleaf forests separately, which we refer to as a vegetation type; and (2) accounting for variability within forest types by partitioning broadleaf forests into Myrtaceae (eucalypt) versus Fagaceae (oak) dominated, and needleleaf forests into forests that are near completely dominated by needleleaf trees versus a mixed forest containing both needleleaf and broadleaf trees, which we refer to as a sub-vegetation type.
Quantifying environmental effects. Several methods exist to calculate variable importance, with no clear optimal method47. We chose to use the regression coefficients in the model to understand the sensitivity of basal area and stem density to changes in relative values of each variable. Importantly, the models were fitted to rescaled data by subtracting each value by the mean and dividing by the standard deviation of the variable. Consequently, the product between the mean value of a variable and its coefficient is always zero. Thus, we can compare the relative impact of variables by comparing the magnitude of the fitted coefficients because they reflect the potential change in basal area for a one standard deviation change in a variable value.
Wet season precipitation. Wet season precipitation varied one standard deviation above the mean versus at the mean (525 versus 375 mm yr−1, respectively). Fire frequency varied from unburned to one standard deviation above the mean (two fires every three years). Wet season precipiation is shown in Fig. 3a.
Dry season precipitation. Dry season precipitation was one standard deviation below the mean versus at the mean (25 versus 133 mm yr−1, respectively). Fire frequency varied from unburned to one standard deviation above the mean (two fires every three years). Dry season precipiation is shown in Fig. 3c.
Vegetation type. Fire frequency effects were made using two levels of comparison. Unburned plots versus burning at the mean frequency (one fire every three years)
and unburned plots versus burning at one standard deviation above the mean frequency (two fires every three years). Vegetation type is shown in Fig. 3d.
Statistics. Fire effect calculations. We first evaluated the overall effect of fire frequency and duration that frequency was altered on tree basal area and stem density without considering any potential modifying role of covariates. To accomplish this we analysed (1) a mixed-effects model containing fire frequency, fire period and their interaction; and (2) log response ratios of stem density and basal area relativized within each site. We excluded the 50 crown fire plots for this initial analysis. We fitted the mixed-effects models with site as a random intercept. The statistical design is nested because each site has several replicate plots receiving different fire treatments. In all cases of mixed-effects models, we tested for model significance using Satterthwaite’s approximation for degrees of freedom and a type III analysis of variance48. In the event of an insignificant main effect but significant interaction, we tested whether the main effect could be dropped from the model using a change in Akaike information criterion with a threshold of two.
Fire–environment interactions. For the plots with surface fires, we performed model selection by incorporating covariates of climate, soil and plant composition into mixed-effects models to test for pairwise interactions and possible collinearities (see discussion below of collinearities). Finally, we constructed a full model containing fire, climate, soil and composition variables based on our hypotheses that these factors will interact with fire frequency as well as information gained from the pairwise tests. There were several insignificant effects in the final model, which we tested for removal using model selection with a threshold Akaike information criterion of two. All variables were rescaled by subtracting the mean and dividing by their standard deviation.
Traits. Bark thickness data were collected from a dataset in the Fire and Fuels Extension to the Forest Vegetation Simulator (https://www.fs.fed.us/fmsc/ftp/fvs/docs/gtr/FFEaddendum.pdf). Although broad syntheses of bark investment exist for many tree species in North America, not all species contained data from empirical measurements, thus we used the data from the Fire and Fuels Extension. Bark thickness was assumed to scale linearly with stem diameter, which is generally valid for smaller stems, but it is known that bark saturates with increasing stem diameter49. The ability of bark investment to predict fire effects will probably improve with better consideration of the non-linear relationship between bark and stem diameter. We evaluate the relative bark investment, not absolute bark thickness, which is based on bark investment as well as stem size.
Wood density was compiled from the literature using a global wood density database50, supplemented with additional data51,52. We assigned a genus-level average for 19 species lacking data. Plant tissue stoichiometry and mycorrhizal type were determined using both trait data and phylogenetic trait estimates calibrated to trait data used in a previous global analysis of plant mycorrhizal traits38. Full data selection criteria are presented in ref. 38, but we describe them in the Supplementary Information.
To test for fire effects on the relative abundance of symbiotic strategies, we calculated the relative basal area of the different strategies (ECM, AM and the less abundant ericoid mycorrhizal, non-mycorrhizal and nitrogen-fixing tree species). Given the low occurrences of ericoid, non-mycorrhizal and nitrogen-fixing species, we analysed the relative abundance of only AM and ECM species. We then fitted mixed-effects models with relative basal area as the dependent variable and fire, climate, broad vegetation type (broadleaf, needleleaf, savanna) and soil conditions as the independent variables, each modified by a symbiont term. Relative basal area was arcsine transformed. This analysis was conducted in the North American plots.
To test how fire influenced the trait composition of the community we fit mixed-effects models to test the effect of fire and environmental factors in explaining the community-weighted mean trait values. We do not include an independent effect of either wood density or bark thickness because we are primarily concerned with how they may modify fire effects. We also tested for whether the symbiotic strategies differed in their traits. To do so, we assigned symbiotic strategies and the dominant ecosystem in which they occurred to different species. We then analysed linear models incorporating symbiotic strategy and ecosystem type as additive effects.
Reporting Summary. Further information on research design is available in the Nature Research Reporting Summary linked to this article.
Data availabilityWood density data are from refs. 50–52, plant tissue stoichiometry and mycorrhizal type data are from ref. 38, and bark thickness data are from the Fire and Fuels Extension to the Forest Vegetation Simulator (https://www.fs.fed.us/fmsc/ftp/fvs/docs/gtr/FFEaddendum.pdf). Supplementary Data 1 and 2 contain the woody population size data and Supplementary Data 3 contains land use data. Refs. 53–76 describe the fire experiments.
Received: 10 July 2020; Accepted: 25 January 2021; Published online: 25 February 2021
NATuRE ECOLOGy & EVOLuTION | VOL 5 | APRIL 2021 | 504–512 | www.nature.com/natecolevol510

ArticlesNATurE EcoloGy & EVoluTioN
References 1. Andela, N. et al. A human-driven decline in global burned area. Science 356,
1356–1362 (2017). 2. Westerling, A. L., Hidalgo, H. G., Cayan, D. R. & Swetnam, T. W. Warming
and earlier spring increase western US forest wildfire activity. Science 313, 940–943 (2006).
3. Turner, M. G. Disturbance and landscape dynamics in a changing world. Ecology 91, 2833–2849 (2010).
4. Higgins, S. I. & Scheiter, S. Atmospheric CO2 forces abrupt vegetation shifts locally, but not globally. Nature 488, 209–212 (2012).
5. van der Werf, G. R. G. R. et al. Global fire emissions estimates during 1997–2016. Earth Syst. Sci. Data 9, 697–720 (2017).
6. Schoennagel, T. et al. Adapt to more wildfire in western North American forests as climate changes. Proc. Natl Acad. Sci. USA 114, 4582–4590 (2017).
7. Westerling, A. L., Turner, M. G., Smithwick, E. A. H., Romme, W. H. & Ryan, M. G. Continued warming could transform Greater Yellowstone fire regimes by mid-21st century. Proc. Natl Acad. Sci. USA 108, 13165–13170 (2011).
8. Johnstone, J. F. et al. Changing disturbance regimes, ecological memory, and forest resilience. Front. Ecol. Environ. 14, 369–378 (2016).
9. Lewis, T. Very frequent burning encourages tree growth in sub-tropical Australian eucalypt forest. Forest Ecol. Manag. 459, 117842 (2020).
10. Peterson, D. W. & Reich, P. B. Prescribed fire in oak savanna: fire frequency effects on stand structure and dynamics. Ecol. Appl. 11, 914–927 (2001).
11. Tilman, D. et al. Fire suppression and ecosystem carbon storage. Ecology 81, 2680–2685 (2000).
12. Pellegrini, A. F. A., Hedin, L. O., Staver, A. C. & Govender, N. Fire alters ecosystem carbon and nutrients but not plant nutrient stoichiometry or composition in tropical savanna. Ecology 96, 1275–1285 (2015).
13. Russell-Smith, J., Whitehead, P. J., Cook, G. D. & Hoare, J. L. Response of eucalyptus-dominated savanna to frequent fires: lessons from Munmarlary, 1973–1996. Ecol. Monogr. 73, 349–375 (2003).
14. Uhl, C. & Kauffman, J. B. Deforestation, fire susceptibility, and potential tree responses to fire in the eastern Amazon. Ecology 71, 437–449 (1990).
15. Case, M. F., Wigley‐Coetsee, C., Nzima, N., Scogings, P. F. & Staver, A. C. Severe drought limits trees in a semi‐arid savanna. Ecology 100, e02842 (2019).
16. Keeley, J. E., Pausas, J. G., Rundel, P. W., Bond, W. J. & Bradstock, R. A. Fire as an evolutionary pressure shaping plant traits. Trends Plant Sci. 16, 406–411 (2011).
17. Schoennagel, T., Turner, M. G. & Romme, W. H. The influence of fire interval and serotiny on postfire lodgepole pine density in Yellowstone National Park. Ecology 84, 2967–2978 (2003).
18. Higgins, S. I. et al. Which traits determine shifts in the abundance of tree species in a fire-prone savanna? J. Ecol. 100, 1400–1410 (2012).
19. Lehmann, C. E. R. et al. Savanna vegetation–fire–climate relationships differ among continents. Science 343, 548–552 (2014).
20. Staver, A. C., Archibald, S. & Levin, S. A. The global extent and determinants of savanna and forest as alternative biome states. Science 334, 230–232 (2011).
21. Higgins, S. I., Bond, J. I. & Trollope, W. S. Fire, resprouting and variability: a recipe for grass–tree coexistence in savanna. J. Ecol. 88, 213–229 (2000).
22. Pellegrini, A. F. A. et al. Fire frequency drives decadal changes in soil carbon and nitrogen and ecosystem productivity. Nature 553, 194–198 (2018).
23. Reich, P. B., Peterson, D. W., Wedin, D. A. & Wrage, K. Fire and vegetation effects on productivity and nitrogen cycling across a forest–grassland continuum. Ecology 82, 1703–1719 (2001).
24. Phillips, R., Brzostek, E. & Midgley, M. The mycorrhizal‐associated nutrient economy: a new framework for predicting carbon–nutrient couplings in temperate forests. New Phytol. 99, 41–51 (2013).
25. Hobbie, S. E. Plant species effects on nutrient cycling: revisiting litter feedbacks. Trends Ecol. Evol. 30, 357–363 (2015).
26. Read, D. J. & Perez‐Moreno, J. Mycorrhizas and nutrient cycling in ecosystems – a journey towards relevance? New Phytol. 157, 475–492 (2003).
27. Dixon, R. K. et al. Carbon pools and flux of global forest ecosystems. Science 263, 185–190 (1994).
28. Jackson, R. B. et al. Trading water for carbon with biological carbon sequestration. Science 310, 1944–1947 (2005).
29. Whitman, E., Parisien, M. A., Thompson, D. K. & Flannigan, M. D. Short-interval wildfire and drought overwhelm boreal forest resilience. Sci. Rep. 9, 18796 (2019).
30. Hart, S. J. et al. Examining forest resilience to changing fire frequency in a fire-prone region of boreal forest. Glob. Change Biol. 25, 869–884 (2019).
31. Stephens, S. L. et al. Managing forests and fire in changing climates. Science 342, 41–42 (2013).
32. Steel, Z. L., Safford, H. D. & Viers, J. H. The fire frequency–severity relationship and the legacy of fire suppression in California forests. Ecosphere 6, 1–23 (2015).
33. Scott, J. & Burgan, R. Standard Fire Behavior Fuel Models: A Comprehensive Set for Use with Rothermel’s Surface Fire Spread Model General Technical Report RMRS-GTR-153 (USDA, Forest Service and Rocky Mountain Research Station, 2005).
34. Liu, Y. Y. et al. Recent reversal in loss of global terrestrial biomass. Nat. Clim. Change 5, 470–474 (2015).
35. Brandt, M. et al. Satellite passive microwaves reveal recent climate-induced carbon losses in African drylands. Nat. Ecol. Evol. 2, 827–835 (2018).
36. Butler, O. M., Elser, J. J., Lewis, T., Mackey, B. & Chen, C. The phosphorus-rich signature of fire in the soil–plant system: a global meta-analysis. Ecol. Lett. 21, 335–344 (2018).
37. Raison, R. J., Khanna, P. K. & Woods, P. V. Transfer of elements to the atmosphere during low-intensity prescribed fires in three Australian subalpine eucalypt forests. Can. J. Forest Res. 15, 657–664 (1985).
38. Averill, C., Bhatnagar, J. M., Dietze, M. C., Pearse, W. D. & Kivlin, S. N. Global imprint of mycorrhizal fungi on whole-plant nutrient economics. Proc. Natl. Acad. Sci. USA https://doi.org/10.1073/pnas.1906655116 (2019).
39. Shah, F. et al. Ectomycorrhizal fungi decompose soil organic matter using oxidative mechanisms adapted from saprotrophic ancestors. New Phytol. 209, 1705–1719 (2016).
40. Woinarski, J. C. Z., Risler, J. & Kean, L. Response of vegetation and vertebrate fauna to 23 years of fire exclusion in a tropical eucalyptus open forest, Northern Territory, Australia. Austral Ecol. 29, 156–176 (2004).
41. Steidinger, B. S. et al. Climatic controls of decomposition drive the global biogeography of forest–tree symbioses. Nature 569, 404–408 (2019).
42. Pellegrini, A. F. A. et al. Repeated fire shifts carbon and nitrogen cycling by changing plant inputs and soil decomposition across ecosystems. Ecol. Monogr. 90, e01409 (2020).
43. Newland, J. A. & DeLuca, T. H. Influence of fire on native nitrogen-fixing plants and soil nitrogen status in ponderosa pine - Douglas-fir forests in western Montana. Can. J. Forest Res. 30, 274–282 (2000).
44. Johnson, D. W. & Curtis, P. S. Effects of forest management on soil C and N storage: meta analysis. Forest Ecol. Manag. 140, 227–238 (2001).
45. Pellegrini, A. F. A. Nutrient limitation in tropical savannas across multiple scales and mechanisms. Ecology 97, 313–324 (2016).
46. Hijmans, R. J., Cameron, S. E., Parra, J. L., Jones, P. G. & Jarvis, A. Very high resolution interpolated climate surfaces for global land areas. Int. J. Climatol. 25, 1965–1978 (2005).
47. Harrison, X. A. et al. A brief introduction to mixed effects modelling and multi-model inference in ecology. PeerJ 2018, e4794 (2018).
48. Bates, D., Mächler, M., Bolker, B. & Walker, S. Fitting linear mixed-effects models using lme4. J. Stat. Softw. 67, 1–48 (2015).
49. Jackson, J. F., Adams, D. C. & Jackson, U. B. Allometry of constitutive defense: a model and a comparative test with tree bark and fire regime. Am. Nat. 153, 614–632 (1999).
50. Chave, J. et al. Towards a worldwide wood economics spectrum. Ecol. Lett. 12, 351–366 (2009).
51. Hoffmann, W. A., Marchin, R. M., Abit, P. & Lau, O. L. Hydraulic failure and tree dieback are associated with high wood density in a temperate forest under extreme drought. Glob. Change Biol. 17, 2731–2742 (2011).
52. Harmon, M. E. Decomposition of standing dead trees in the southern Appalachian Mountains. Oecologia 52, 214–215 (1982).
53. Hedges, L. V., Gurevitch, J. & Curtis, P. S. The meta-analysis of response ratios in experimental ecology. Ecology 80, 1150–1156 (1999).
54. Gurevitch, J., Morrow, L. L., Wallace, A. & Walsh, J. S. A meta-analysis of competition in field experiments. Am. Nat. 140, 539–572 (1992).
55. Zanne, A. E. et al. Three keys to the radiation of angiosperms into freezing environments. Nature 506, 89–92 (2014).
56. Pearse, W. D. et al. pez: phylogenetics for the environmental sciences. Bioinformatics 31, 2888–2890 (2015).
57. Kembel, S. W. et al. Picante: R tools for integrating phylogenies and ecology. Bioinformatics 26, 1463–1464 (2010).
58. Brockway, D. G. & Lewis, C. E. Long-term effects of dormant-season prescribed fire on plant community diversity, structure and productivity in a longleaf pine wiregrass ecosystem. Forest Ecol. Manag. 96, 167–183 (1997).
59. Lewis, T. & Debuse, V. J. Resilience of a eucalypt forest woody understorey to long-term (34–55 years) repeated burning in subtropical Australia. Int. J. Wildl. Fire 21, 980–991 (2012).
60. Scudieri, C. A., Sieg, C. H., Haase, S. M., Thode, A. E. & Sackett, S. S. Understory vegetation response after 30 years of interval prescribed burning in two ponderosa pine sites in northern Arizona, USA. Forest Ecol. Manag. 260, 2134–2142 (2010).
61. Lewis, T., Reif, M., Prendergast, E. & Tran, C. The effect of long-term repeated burning and fire exclusion on above- and below-ground blackbutt (Eucalyptus pilularis) forest vegetation assemblages. Austral Ecol. 37, 767–778 (2012).
62. Stratton, R. Effects of Long-Term Late Winter Prescribed Fire on Forest Stand Dynamics, Small Mammal Populations, and Habitat Demographics in a Tennessee Oak Barrens. MSc thesis, Univ. Tennessee (2007).
63. Wade, D. D. Long-Term Site Responses to Season and Interval of Underburns on the Georgia Piedmont (Forest Service Research Data Archive, 2016).
NATuRE ECOLOGy & EVOLuTION | VOL 5 | APRIL 2021 | 504–512 | www.nature.com/natecolevol 511
Articles NATurE EcoloGy & EVoluTioN
64. Pellegrini, A. F. A., Hoffmann, W. A. & Franco, A. C. Carbon accumulation and nitrogen pool recovery during transitions from savanna to forest in central Brazil. Ecology 95, 342–352 (2014).
65. Nesmith, C. B., Caprio, A. C., Pfaff, A. H., McGinnis, T. W. & Keeley, J. E. A comparison of effects from prescribed fires and wildfires managed for resource objectives in Sequoia and Kings Canyon National Parks. Forest Ecol. Manag. 261, 1275–1282 (2011).
66. Haywood, J. D., Harris, F. L., Grelen, H. E. & Pearson, H. A. Vegetative response to 37 years of seasonal burning on a Louisiana longleaf pine site. South. J. Appl. For. 25, 122–130 (2001).
67. Higgins, S. I. et al. Effects of four decades of fire manipulation on woody vegetation structure in savanna. Ecology 88, 1119–1125 (2007).
68. Gignoux, J., Lahoreau, G., Julliard, R. & Barot, S. Establishment and early persistence of tree seedlings in an annually burned savanna. J. Ecol. 97, 484–495 (2009).
69. Tizon, F. R., Pelaez, D. V. & Elia, O. R. The influence of controlled fires on a plant community in the south of the Caldenal and its relationship with a regional state and transition model. Int. J. Exp. Bot. 79, 141–146 (2010).
70. Neill, C., Patterson, W. A. & Crary, D. W. Responses of soil carbon, nitrogen and cations to the frequency and seasonality of prescribed burning in a Cape Cod oak–pine forest. Forest Ecol. Manag. 250, 234–243 (2007).
71. Ryan, C. M., Williams, M. & Grace, J. Above‐ and belowground carbon stocks in a miombo woodland landscape of Mozambique. Biotropica 43, 423–432 (2011).
72. Scharenbroch, B. C., Nix, B., Jacobs, K. A. & Bowles, M. L. Two decades of low-severity prescribed fire increases soil nutrient availability in a midwestern, USA oak (Quercus) forest. Geoderma 183–184, 80–91 (2012).
73. Burton, J. A., Hallgren, S. W., Fuhlendorf, S. D. & Leslie, D. M. Jr. Understory response to varying fire frequencies after 20 years of prescribed burning in an upland oak forest. Plant Ecol. 212, 1513–1525 (2011).
74. Stewart, J. F., Will, R. E., Robertson, K. M. & Nelson, C. D. Frequent fire protects shortleaf pine (Pinus echinata) from introgression by loblolly pine (P. taeda). Conserv. Genet. 16, 491–495 (2015).
75. Knapp, B. O., Stephan, K. & Hubbart, J. A. Structure and composition of an oak–hickory forest after over 60 years of repeated prescribed burning in Missouri, U.S.A. Forest Ecol. Manag. 344, 95–109 (2015).
76. Olson, M. G. Tree regeneration in oak–pine stands with and without prescribed fire in the New Jersey Pine Barrens: management implications. North. J. Appl. For. 28, 47–49 (2011).
AcknowledgementsA.F.A.P. was supported by a NOAA Climate and Global Change postdoctoral fellowship programme and the USDA National Institute of Food and Agriculture grant 2018‐67012‐28077. R.B.J. received support from the Gordon and Betty Moore Foundation. The experiments at the sites were organized and funded through the Cedar Creek Long Term Ecological Research programme (DEB 1234162, 0620652, 1831944 and DBI 2021898), the National Park Service and Sequoia Parks Conservancy, and South African National Parks. C.T. was supported by a Lawrence Fellow award supported by the LLNL-LDRD Program under Project No. 20-ERD-055.
Author contributionsA.F.A.P. and R.B.J. conceived and designed the overall study. T.R., C.A. and C.T. helped with data acquisition and provided feedback on statistical analyses. D.G.B., A.C.S., W.C., C.C., J.D.H., S.H.E., W.A.H., J.K., T.L., W.K.M., S.T.O., W.A.P., K.G.P., P.B.R., C.R., M.A.S.S., B.C.S., T.S., G.R.S., K.S., C.S., M.G.T. and J.M.V. provided data and/or assisted with interpreting the field data from experiments. All authors contributed to the writing of the manuscript.
Competing interestsThe authors declare no competing interests.
Additional informationExtended data is available for this paper at https://doi.org/10.1038/s41559-021-01401-7.
Supplementary information The online version contains supplementary material available at https://doi.org/10.1038/s41559-021-01401-7.
Correspondence and requests for materials should be addressed to A.F.A.P.
Peer review information Nature Ecology & Evolution thanks Donald Falk and the other, anonymous, reviewer(s) for their contribution to the peer review of this work.
Reprints and permissions information is available at www.nature.com/reprints.
Publisher’s note Springer Nature remains neutral with regard to jurisdictional claims in published maps and institutional affiliations.
© The Author(s), under exclusive licence to Springer Nature Limited 2021
NATuRE ECOLOGy & EVOLuTION | VOL 5 | APRIL 2021 | 504–512 | www.nature.com/natecolevol512

ArticlesNATurE EcoloGy & EVoluTioN ArticlesNATurE EcoloGy & EVoluTioN
Extended Data Fig. 1 | Distribution of sites. a, Map displaying the distribution of sites (dots) with the surface fire sites filled with black and the crown fire sites filled with white. The coloration indicates the average fire frequency within a gridcell using 1. The sample size of plots is written adjacent to the continent. b, distribution of sites in climate space overlying Whittaker’s biome distribution 77. (1 = tundra, 2=boreal forest, 3=woodland/shrubland, 4=temperate grassland/desert, 5=temperate forest, 6=temperate rainforest, 7=subtropical desert, 8=tropical forest and savanna, 9=tropical rainforest). Dots colored according to broad vegetation type category. Plots span a mean annual temperate range from 5.2–27.3 °C and a mean annual precipitation range from 408–2378 mm yr−1. c, aerial picture of two different fire treatment plots from Cedar Creek, a temperate oak savanna, where different fire frequencies have created a stark biome boundary between forests in unburned plots and savannas in biennial burn plots.
NATuRE ECOLOGy & EVOLuTION | www.nature.com/natecolevol

Articles NATurE EcoloGy & EVoluTioNArticles NATurE EcoloGy & EVoluTioN
Extended Data Fig. 2 | Example of the experimental layout of a fire manipulation experiment. Example of the experimental layout of a fire manipulation experiment taken from Cedar Creek (a temperate savanna in Minnesota, USA), where fires have been manipulated since 1964. Aerial imagery (taken in 2017) from the National Agriculture Imagery Program from the Farm Service Agency. Plots are outlined with a color corresponding to their fire frequencies expressed in terms of number of fires per year (for example 0.33 is one fire every 3 years).
NATuRE ECOLOGy & EVOLuTION | www.nature.com/natecolevol

ArticlesNATurE EcoloGy & EVoluTioN ArticlesNATurE EcoloGy & EVoluTioN
Extended Data Fig. 3 | untransformed data on stem density and basal area. Untransformed data on stem density (a-b) and basal area (c-d) as a function of the duration that plots have been exposed to burning in the experiment (0 = unburned plots). Each dot represents a site and the dashed lines connect treatments within sites. Columns represent two sets of fire frequency contrasts comparing unburned vs. the intermediate frequency in a and c, and unburned vs. the high frequency in b and d (levels defined based on treatments within sites). Dots and bars based on mean and standard error calculated across the replicate plots within a fire treatment in a site. Note y-axis is on a log10 scale.
NATuRE ECOLOGy & EVOLuTION | www.nature.com/natecolevol

Articles NATurE EcoloGy & EVoluTioNArticles NATurE EcoloGy & EVoluTioN
Extended Data Fig. 4 | Comparison between fire types. Comparison between fire types (surface in a, F1,94.3 = 50.6, p < 0.001, n = 9 sites and n = 104 plots; and crown in b, F1,21 = 10.3, p = 0.004, n = 24 plots) in needleleaf forests with fire expressed in terms of return period (crown fire plots are all 12 years postfire, data subset to include short-interval burn plots). c, illustrates the mean response ratios ± standard error for the fire types with crown fires split into high (>2,400 m) and low (<2,400) elevation sites (Crown 1 and Crown 2, respectively; n = 25 plots for each elevation category). Analyses were robust to considering surface fires in only Western US needleleaf forests: F1,47.1 = 17.2, p = 0.001. Response ratios were split into long and short fire return interval plots (Crown 1 and 2, respectively), with the justification for definition of interval in 17.
NATuRE ECOLOGy & EVOLuTION | www.nature.com/natecolevol

ArticlesNATurE EcoloGy & EVoluTioN ArticlesNATurE EcoloGy & EVoluTioN
Extended Data Fig. 5 | Fire frequency effects across precipitation in the wet quarter bins. Partial residual plot displaying the relationship between loge basal area and precipitation in the wettest quarter cross-sectioned based on fire frequency. This plot is based on the same mixed-effects model presented in Fig. 3 and Supplementary Table 4, just re-arranged to emphasize how precipitation-basal area relationship changes with more frequent burning. n = 25 sites and n = 309 plots.
NATuRE ECOLOGy & EVOLuTION | www.nature.com/natecolevol

Articles NATurE EcoloGy & EVoluTioNArticles NATurE EcoloGy & EVoluTioN
Extended Data Fig. 6 | Differences in fire effects across continents. Partial residual plot between the length of time plots were exposed to frequent burning and the log basal area (a, n = 25 sites and n = 309 plots) and stem density (b, n = 25 sites and n = 303 plots) in the different continents (from the main mixed-effects model with site as a random intercept in Supplementary Tables 4-5).
NATuRE ECOLOGy & EVOLuTION | www.nature.com/natecolevol

ArticlesNATurE EcoloGy & EVoluTioN ArticlesNATurE EcoloGy & EVoluTioN
Extended Data Fig. 7 | Fire effects in sub-vegetation classifications. Partial residual plot between the length of time plots were exposed to frequent burning and the log basal area in the different sub-vegetation types (from the main mixed-effects model, presented in Supplementary Table 4 but substituting the broad vegetation effect with the more detailed classification. We found no evidence that accounting for the finer-scale variability in ecosystem classification increased the accuracy of the model or changed our conclusions. n = 25 sites and n = 309 plots.
NATuRE ECOLOGy & EVOLuTION | www.nature.com/natecolevol
Articles NATurE EcoloGy & EVoluTioNArticles NATurE EcoloGy & EVoluTioN
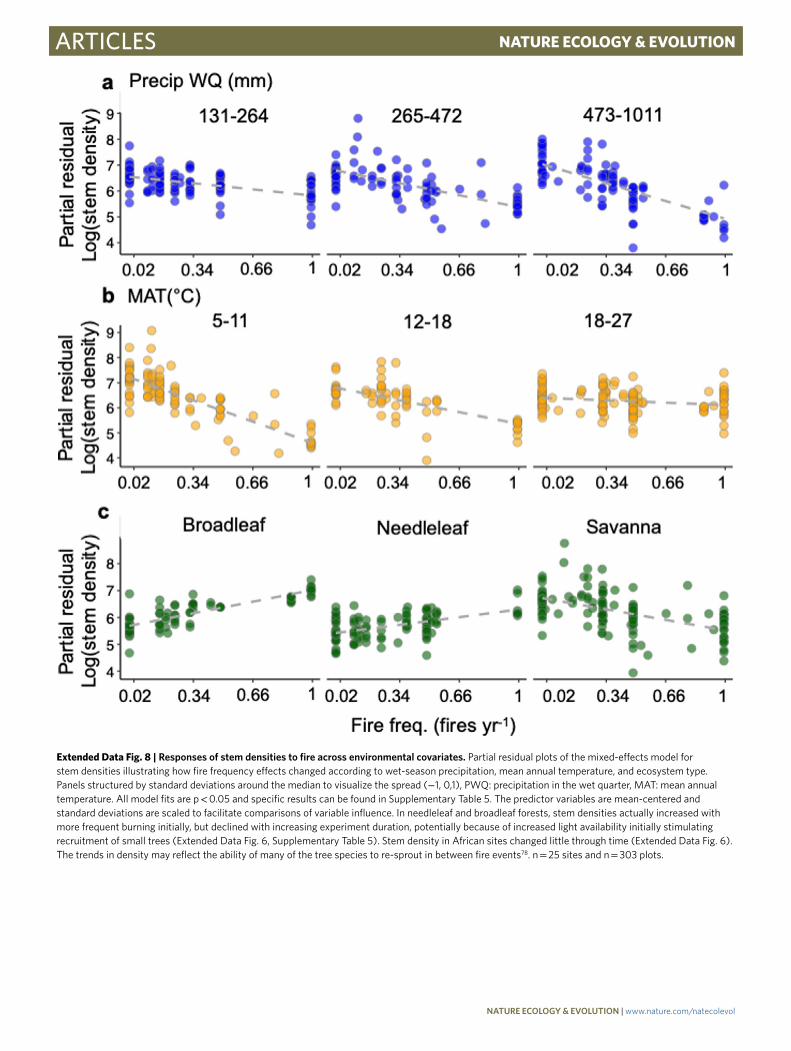
Extended Data Fig. 8 | Responses of stem densities to fire across environmental covariates. Partial residual plots of the mixed-effects model for stem densities illustrating how fire frequency effects changed according to wet-season precipitation, mean annual temperature, and ecosystem type. Panels structured by standard deviations around the median to visualize the spread (−1, 0,1), PWQ: precipitation in the wet quarter, MAT: mean annual temperature. All model fits are p < 0.05 and specific results can be found in Supplementary Table 5. The predictor variables are mean-centered and standard deviations are scaled to facilitate comparisons of variable influence. In needleleaf and broadleaf forests, stem densities actually increased with more frequent burning initially, but declined with increasing experiment duration, potentially because of increased light availability initially stimulating recruitment of small trees (Extended Data Fig. 6, Supplementary Table 5). Stem density in African sites changed little through time (Extended Data Fig. 6). The trends in density may reflect the ability of many of the tree species to re-sprout in between fire events78. n = 25 sites and n = 303 plots.
NATuRE ECOLOGy & EVOLuTION | www.nature.com/natecolevol

ArticlesNATurE EcoloGy & EVoluTioN ArticlesNATurE EcoloGy & EVoluTioN
Extended Data Fig. 9 | Effect of fire on phosphorus stoichiometry. Partial residual plots of the phosphorus (P) stoichiometry of community weighted means as a function of years of repeated burning. Taken from mixed-effects models presented in Supplementary Table 7. The models include a vegetation type effect. Tissue P is rescaled by subtracting the mean and dividing by the standard deviation. n = 16 sites and n = 172 plots.
NATuRE ECOLOGy & EVOLuTION | www.nature.com/natecolevol

1
nature research | reporting summ
aryApril 2020
Corresponding author(s): Adam F. A. Pellegrini
Last updated by author(s): 12/14/2020
Reporting SummaryNature Research wishes to improve the reproducibility of the work that we publish. This form provides structure for consistency and transparency in reporting. For further information on Nature Research policies, see our Editorial Policies and the Editorial Policy Checklist.
StatisticsFor all statistical analyses, confirm that the following items are present in the figure legend, table legend, main text, or Methods section.
n/a Confirmed
The exact sample size (n) for each experimental group/condition, given as a discrete number and unit of measurement
A statement on whether measurements were taken from distinct samples or whether the same sample was measured repeatedly
The statistical test(s) used AND whether they are one- or two-sided Only common tests should be described solely by name; describe more complex techniques in the Methods section.
A description of all covariates tested
A description of any assumptions or corrections, such as tests of normality and adjustment for multiple comparisons
A full description of the statistical parameters including central tendency (e.g. means) or other basic estimates (e.g. regression coefficient) AND variation (e.g. standard deviation) or associated estimates of uncertainty (e.g. confidence intervals)
For null hypothesis testing, the test statistic (e.g. F, t, r) with confidence intervals, effect sizes, degrees of freedom and P value noted Give P values as exact values whenever suitable.
For Bayesian analysis, information on the choice of priors and Markov chain Monte Carlo settings
For hierarchical and complex designs, identification of the appropriate level for tests and full reporting of outcomes
Estimates of effect sizes (e.g. Cohen's d, Pearson's r), indicating how they were calculated
Our web collection on statistics for biologists contains articles on many of the points above.
Software and codePolicy information about availability of computer code
Data collection We did not develop code to collect data, we used field survey data and existing databases.
Data analysis We conducted all analyses in the programming language R with separate packages (all published) for specific analyses not included in the base statistics package. GitHub will be used to deposit the final code upon publication.
For manuscripts utilizing custom algorithms or software that are central to the research but not yet described in published literature, software must be made available to editors and reviewers. We strongly encourage code deposition in a community repository (e.g. GitHub). See the Nature Research guidelines for submitting code & software for further information.
DataPolicy information about availability of data
All manuscripts must include a data availability statement. This statement should provide the following information, where applicable: - Accession codes, unique identifiers, or web links for publicly available datasets - A list of figures that have associated raw data - A description of any restrictions on data availability
Data will be published as a dataset alongside the manuscript. All data used to create the figures will be freely available.

2
nature research | reporting summ
aryApril 2020
Field-specific reportingPlease select the one below that is the best fit for your research. If you are not sure, read the appropriate sections before making your selection.
Life sciences Behavioural & social sciences Ecological, evolutionary & environmental sciences
For a reference copy of the document with all sections, see nature.com/documents/nr-reporting-summary-flat.pdf
Ecological, evolutionary & environmental sciences study designAll studies must disclose on these points even when the disclosure is negative.
Study description We quantified the effects of fire frequency on tree cover across broad biogeographic and climatic scales, incorporating additional factors that may explain variability in fire effects on tree communities. We used original survey data collected across 29 repeated burn experiments within a large collaborative network. We also compiled data on plant functional traits within North American fire manipulation experiments to test how traits could predict the effects of fire as well as how fire changed the functional composition of the plant community.
Research sample We combined published data with new surveys on tree populations from 29 sites and 374 plots in four continents. At 27 of the sites (324 plots), surface fire frequency was experimentally manipulated for 16-64 years (mean of 30 years), and at two sites (50 plots), natural variation in crown fire frequency presented a natural experiment. We focused on tree responses because of their importance for carbon storage, ecosystem productivity and nutrient cycling23,27,28. The sites cover locations in North America (coniferous, deciduous, and mixed forests, broadleaf savanna), South America (tropical savanna and temperate shrubland), Africa (broadleaf savanna), and Australia (wet and dry eucalyptus forests) all of which are ecosystems that experience frequent burning (Figure S1, Table S1, Supplemental Information, SI). For our main analysis, we define ecosystems broadly based on dominant fuel type (grass vs. litter) and tree functional composition (angiosperm broadleaf vs. gymnosperm needleleaf trees) but test the robustness of our conclusions to other classifications. Each surface fire site contains replicate plots including an unburned treatment and different prescribed burning frequencies (Figure S2), where fire frequencies ranged from approximately one fire every decade to one fire every year (Table S1). We evaluated the effects of fire alone and in combination with environmental covariates using model selection (SI) to test the importance of climate, soil, and species composition in modifying the effect of fire.
Sampling strategy Our study contains two levels of relevant sampling strategies. First, the level of choosing the sites included in our analysis. This paper was a result of a large collaborative group that has communicated through a series of meetings with the 1st author Adam Pellegrini. This study is not an exhaustive meta-analysis of the literature. Clearly, not every single fire manipulation experiment in the world is included in this study, partly because in some cases, organizers of fire manipulation experiments declined to be a part of the study. In other cases, organizers never responded or did not have raw data necessary for our analysis. The second level of sampling included collecting data on the tree communities and soils. Transects to survey trees and collect soils were randomly established in the plots. Survey area was generally designed to capture the ecological heterogeneity within a landscape (e.g., larger surveys in areas with patchy tree cover such as savannas). All functional trait data were acquired from the most extensive trait databases currently freely accessible.
Data collection We provide information on the experimental designs in Table S1 because each site varied (we also include the corresponding citation that describes each experiment in greater detail). This table includes a list of sites with key meta-data such as the continent, vegetation type present in broad categories and the families of the dominant tree species. Number of plots is the total within the entire site. Duration is the number of years over which fire frequencies have differed across plots. We also describe the prior conditions of the ecosystem at the beginning of the experiment (e.g. whether the site experienced regular burning prior to the experiment). Soil data were collected using previously published values, unpublished values, or our own sampling and analyses. The types of data for each site are described in the section "Soil chemistry data". Plant functional trait data were compiled from published datasets, with the appropriate citations given in the text. The section describing these data is "Species classifications and functional traits".
Timing and spatial scale Sampling was conducted over the course of several decades because the timing that the fire manipulation experiments were surveyed differed across sites. The plots were relatively large (>0.5 hectares, and in some cases up to 7 hectares in size). The tree community surveys attempted to account for ecological heterogeneity within the plots.
Data exclusions In certain cases, experiments contained multiple surveys through time and treatments in different seasons. These are described in the section "Choice of plots within 27 sites with surface fires" in our Supplemental Information section. Our decision to exclude plots was conservative because we wanted to avoid pseudoreplication arising from repeated measures on the same fire treatment in different years within a site. We avoided using different seasons of burns within the same site because the range of fire conditions in the seasons varied considerably in some sites (e.g., burned anytime between March - June).
Reproducibility These experiments are large-scale fire manipulations at the ecosystem level for multiple decades. The reproducibility of the experimental findings from a single study is partly captured by comparing the effects of fire from multiple independent experiments.
Randomization Replicate plots within each experiment were randomized at the onset of the experiment.
Blinding Blinding was not consistently used during data collection but we did randomize the location of the transects within a plot.

3
nature research | reporting summ
aryApril 2020
Did the study involve field work? Yes No
Field work, collection and transportField conditions Fieldwork was generally conducted in the growing season, which allowed for the proper identification of tree species. Weather
conditions during the field season varied considerably across sites given their broad range in climates.
Location All experimental locations are provided in Table S1. We provide a broad description of the sites as well as the original references that describe the experimental design of each site.
Access & import/export We did not conduct any importing or exporting of samples requiring permits.
Disturbance There was no disturbance of the sites. Soil cores are minimal and not considered destructive.
Reporting for specific materials, systems and methodsWe require information from authors about some types of materials, experimental systems and methods used in many studies. Here, indicate whether each material, system or method listed is relevant to your study. If you are not sure if a list item applies to your research, read the appropriate section before selecting a response.
Materials & experimental systemsn/a Involved in the study
Antibodies
Eukaryotic cell lines
Palaeontology and archaeology
Animals and other organisms
Human research participants
Clinical data
Dual use research of concern
Methodsn/a Involved in the study
ChIP-seq
Flow cytometry
MRI-based neuroimaging