Debugging Javascript
33
-
Upload
soltech-inc -
Category
Software
-
view
169 -
download
0
Transcript of Debugging Javascript
DEBUGGING JAVASCRIPTFROM 0 TO HEISENBERG
Chris MorrowSenior UI Developer

WALTER WHITE

HEISENBERG
JAVASCRIPT BEST PRACTICES (throughout)
BREAKPOINTSWATCHESUSING THE CONSOLECALL STACKCUSTOM TOOLS / UNIT TESTING
THE PLAN

TOO MANY COOKS INTHE KITCHEN?
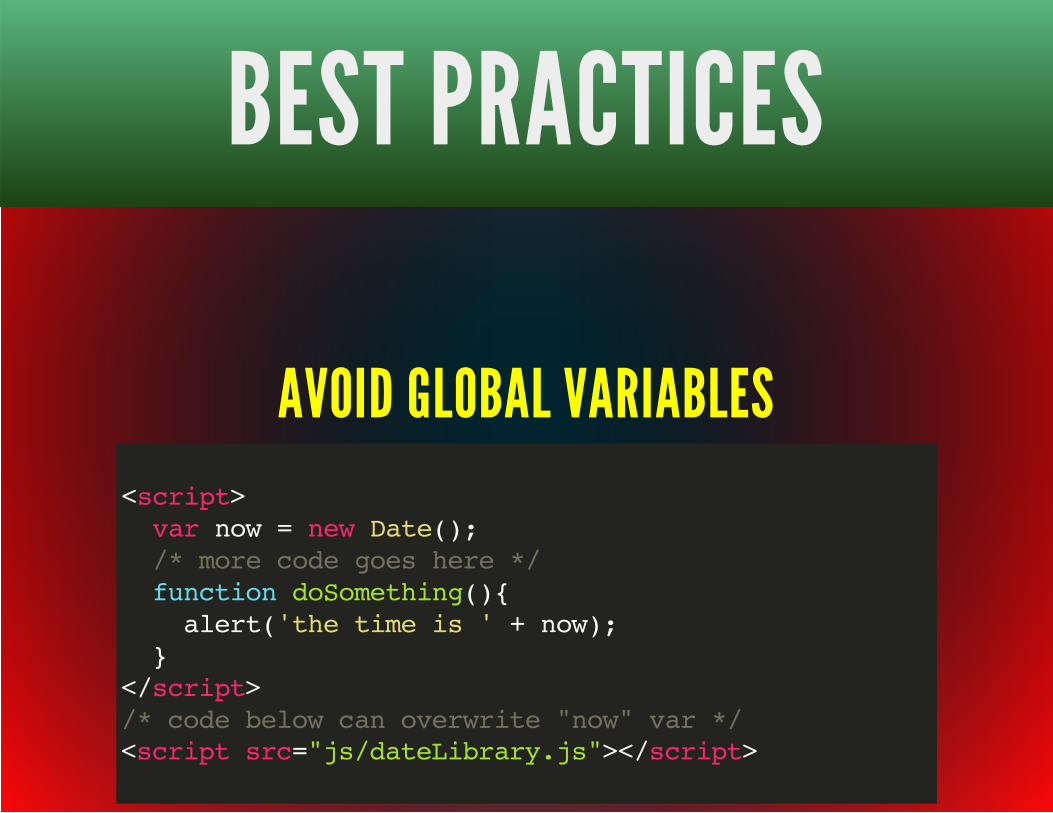
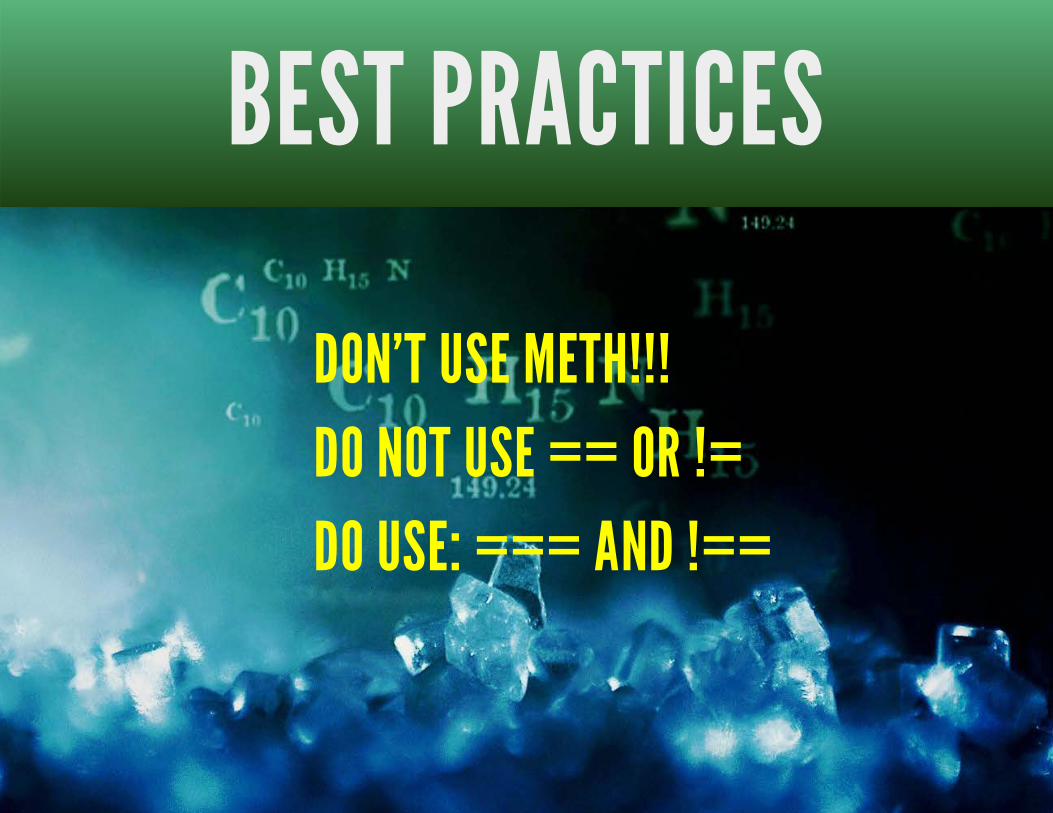
BEST PRACTICES
AVOID GLOBAL VARIABLES<script> var now = new Date(); /* more code goes here */ function doSomething(){ alert('the time is ' + now); }</script>/* code below can overwrite "now" var */<script src="js/dateLibrary.js"></script>
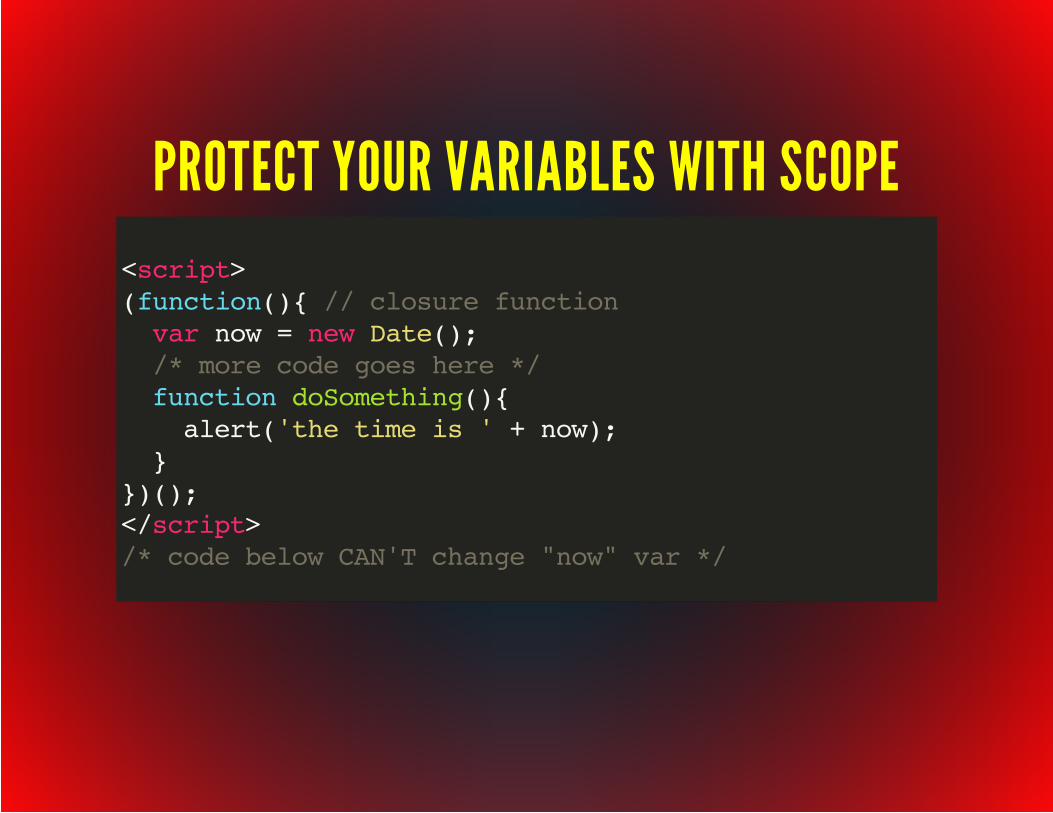
PROTECT YOUR VARIABLES WITH SCOPE<script>(function(){ // closure function var now = new Date(); /* more code goes here */ function doSomething(){ alert('the time is ' + now); }})();</script>/* code below CAN'T change "now" var */

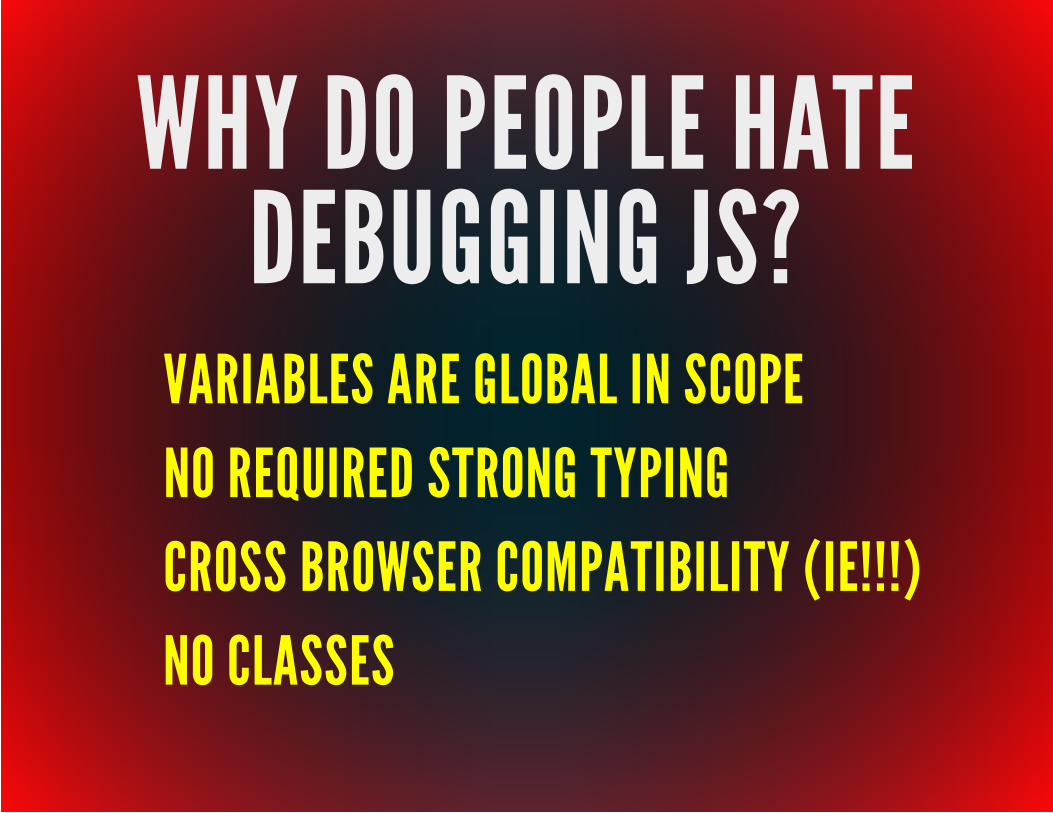
WHY DO PEOPLE HATEDEBUGGING JS?
VARIABLES ARE GLOBAL IN SCOPENO REQUIRED STRONG TYPINGCROSS BROWSER COMPATIBILITY (IE!!!)NO CLASSES
DEBUGGING GOT YOUSTRESSED?
BREAKPOINTSNAVIGATING CODESTANDARDCONDITIONAL
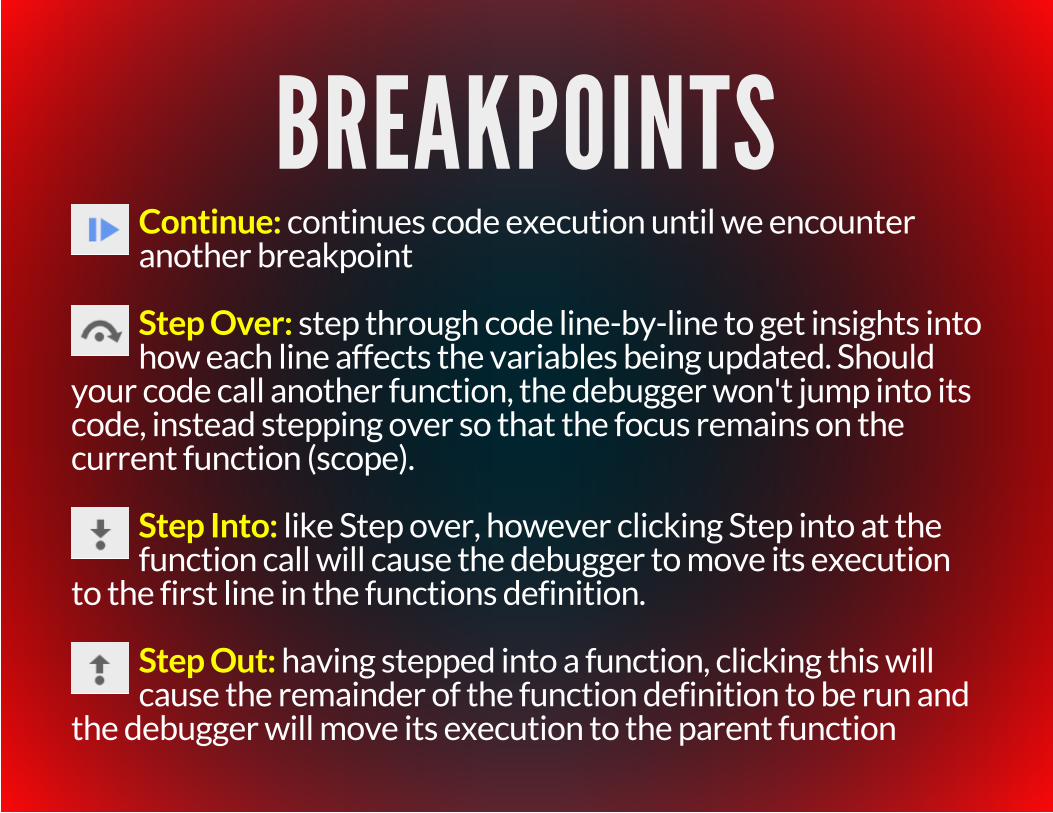
BREAKPOINTSContinue: continues code execution until we encounteranother breakpoint
Step Over: step through code line-by-line to get insights intohow each line affects the variables being updated. Should
your code call another function, the debugger won't jump into itscode, instead stepping over so that the focus remains on thecurrent function (scope).
Step Into: like Step over, however clicking Step into at thefunction call will cause the debugger to move its execution
to the first line in the functions definition.
Step Out: having stepped into a function, clicking this willcause the remainder of the function definition to be run and
the debugger will move its execution to the parent function
BEST PRACTICES

WATCHES
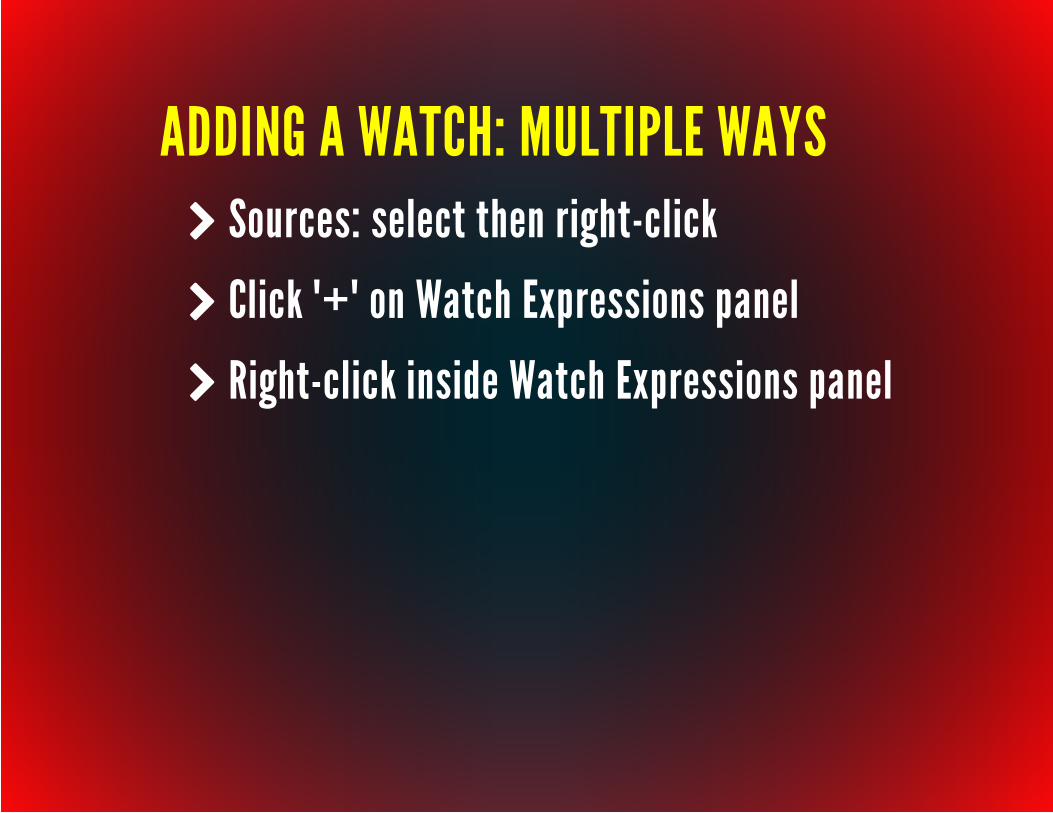
ADDING A WATCH: MULTIPLE WAYSk Sources: select then right-click
k Click "+" on Watch Expressions panel
k Right-click inside Watch Expressions panel
SCOPE VARIABLESk Like watches, but are only shown in scope

AND NOW A QUICK MESSAGE FROM OURSPONSOR...

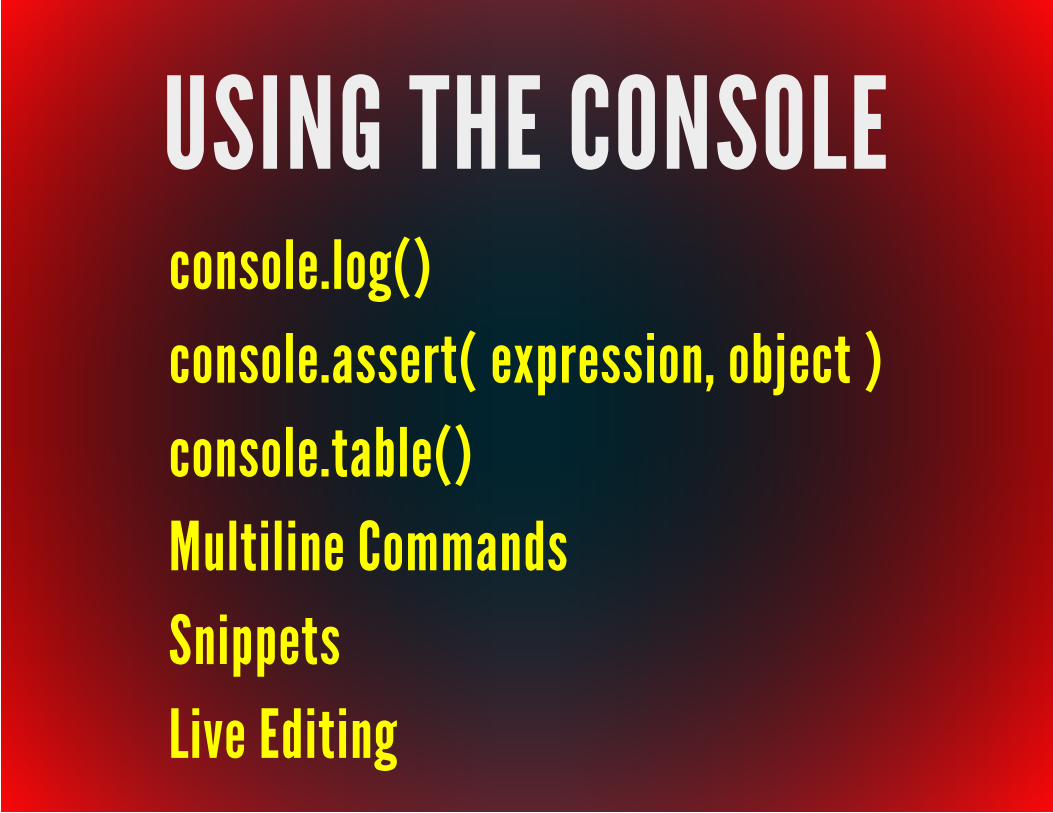
USING THE CONSOLEconsole.log()console.assert( expression, object )console.table()Multiline CommandsSnippetsLive Editing
BEST PRACTICES
DO NOT MINIFY CODE IN DEVELOPMENT


CALL STACKBOTTOMS UP

CRAPPY CODE

CLEAN UP YOUR CODE
DEBUGGING TOOLS
ROLL YOUR OWN
PRE-DEBUGGING TOOLSJSHint / JSLint
JsHint is more lenient than JSLint.

NOT HAPPY WITHJSHINT?
CUSTOMIZE IT WITH.jshintrc

UNIT TESTINGQUnit: http://qunitjs.com/
Mocha: http://visionmedia.github.io/mocha/
Jasmine: http://jasmine.github.io/

REMOTE TESTINGAndroid - (Chrome Dev Tools)https://developer.chrome.com/devtools
iOS - (Safari Dev Tools)https://developer.apple.com/safari/tools/
Browser Stack: $39.99/month and uphttp://www.browserstack.com/
Adobe Edge Inspect: $9.99/monthhttps://creative.adobe.com/products/inspect
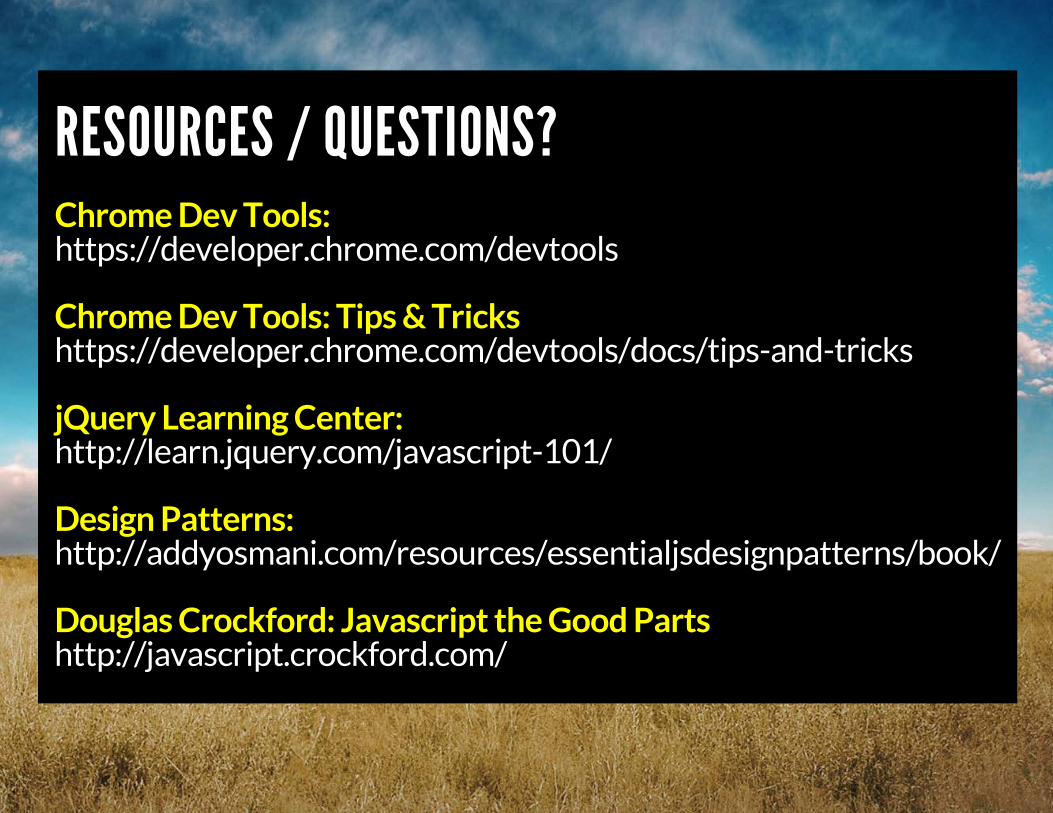
RESOURCES / QUESTIONS?Chrome Dev Tools:https://developer.chrome.com/devtools
Chrome Dev Tools: Tips & Trickshttps://developer.chrome.com/devtools/docs/tips-and-tricks
jQuery Learning Center:http://learn.jquery.com/javascript-101/
Design Patterns:http://addyosmani.com/resources/essentialjsdesignpatterns/book/
Douglas Crockford: Javascript the Good Partshttp://javascript.crockford.com/