Debt Investor Presentation - Sampo Group · 2019-02-08 · DEBT INVESTOR CONTACTS. Teemu Seikkula,...
51
JANUARY – DECEMBER 2018 Debt Investor Presentation
Transcript of Debt Investor Presentation - Sampo Group · 2019-02-08 · DEBT INVESTOR CONTACTS. Teemu Seikkula,...

JANUARY – DECEMBER 2018
Debt Investor Presentation

DEBT INVESTOR CONTACTS
Teemu Seikkula, Head of Group Controltel. +358 10 516 0085 [email protected]
Knut Arne Alsaker, CFOtel. +358 10 516 [email protected]
Jarmo Salonen, Head of Investor Relations and Group Communicationstel. +358 10 516 [email protected]
FINANCIAL CALENDAR 2019
07/02/2019 Financial Statement Release for 2018Silent period 08/01/2019-07/02/2019
Week 10 Financial Statements and Board of Directors’ Report 2018
09/04/2019 AGM08/05/2019 Interim Statement Q1/2019
Silent period 08/04/2019-08/05/201907/08/2019 Half-Year Financial Report 2019
Silent period 08/07/2019-07/08/201906/11/2019 Interim Statement Q3/2019
Silent period 07/10/2019-06/11/2019
Moody's Standard and Poor's
Rating Outlook Rating Outlook
Sampo plc – Long-term Issuer Rating A3 Stable A- Stable
If P&C Insurance (Sweden)– Insurance Financial Strength Rating A1 Stable A+ Stable
DisclaimerThis presentation may contain forward-looking statements that reflect management’s current views with respect to certain future events and potential financial performance. Although Sampo believes that the expectations reflected in such forward looking statements are reasonable, no assurance can be given that such expectations will prove to have been correct. Accordingly, results could differ materially from those set out in the forward-looking statements as a result of various factors.Important factors that may cause such a difference for Sampo include, but are not limited to: (i) the macroeconomic development,(ii) change in the competitive climate and (iii) developments in capital markets.This presentation does not imply that Sampo has undertaken to revise these forward-looking statements, beyond what is required by applicable law or applicable stock exchange regulations if and when circumstances arise that will lead to changes compared to the date when these statements were provided. 2

Sampo Group 3-16
Subsidiaries and Associated companiesIf P&C 17-22Topdanmark 23-27Mandatum Life 28-32Nordea Bank 33-34
Sampo plc 35-41
Appendix 42-50

Value Creation in the Nordic Financials as Group Strategy
4
LONG-TERM VALUE CREATION
• Value creation through investments in Nordic financials based on knowledge of Nordic markets, Nordic financial institutions & Nordic people.
• Commitment to the long-term development of affiliated companies.
OPERATIONAL EXCELLENCE IN SUBSIDIARIES
• Continuous development of services => excellence in underwriting and risks.• Economies of scale and high retail/consumer content.• Pan-Nordic diversification & operational excellence facilitate low volatility.
CONSERVATIVE PARENT WITH PROFIT FOCUS
• Conservative capital structure, modest leverage and strong liquidity.• Parent company steers subsidiaries through Boards by approving (in Topdanmark,
Nordea and Nordax by contributing to) strategies, guiding principles and ROE targets.
GROUP LEVEL PORTFOLIO BENEFITS
• Profitable companies, mostly with the lowest volatility in the peer group.• Profits of affiliated companies have low correlation creating diversification
benefits at the Group level.
LONG-TERM VALUE FOR SHAREHOLDERS & BONDHOLDERS
CENTRALIZEDINVESTMENT MANAGEMENT
• Company specific liabilities and solvency driving risk profiles, supported bya Group-wide investment philosophy. Common investment infrastructure (except Topdanmark) facilitates monitoring and prompt actions, also at the Group level.
Sampo Group ― Nordic Financial Group with Strong Brands

5
Sampo Group ‒ Nordic Financial Group with Strong Brands
The leading P&C insurer in the Nordic region with full service offering and a strong European presence
Safety and Stability:• Focus on Customer value• Focus on insurance expertise• Stable profitability through
underwriting excellence and operational efficiency
~ 10.9 EURbn
• RoE above 17.5%
The second largest P&C insurer and the sixth largest Life insurer in Denmark
Profitable Business in DK:• Digitalisation: Self-service,
Online purchase• Efficiency: Process
optimisation and Automation• Transformation: Cultur,
Digital readiness
~ 2.8 EURbn (P&C)
• Profit margin of 10%• CR% 91%
One of Finland’s most respected and best capitalisedfinancial services providers to private & corporate customers
An expert in Money and Life:• Unit-linked insurance• Group pension insurance• Risk insurance• Insurance for corporate
customers and entrepreneurs• Wealth management
~ 5.6 EURbn
• RoE above 17.5%
• Long-term investor• Manager of capital structure and liquidity
• Pay-out ratio ≥ 50%
Marketposition
Strategy
Investmentassets
Return /profit target
Subsidiary Subsidiary
100% 46.7% 100%
The leading and most diversified, bank group in the Nordics with strong capital generation
Key priorities to increase business momentum, further improve cost efficiencies and drive scale• Leverage ONE Nordea• Embrace Data, Technology &
Digitalisation• Embed thr Nordea Culture
~ B/S 551 EURbn~ AuM 283 EURbn
• ROE above the Nordic peer average
Associated Company
21.2%
Sampo Group ― Nordic Financial Group with Strong Brands
Subsidiary Associated Company
36.2%
NDX Intressenter

32.125.0
22.422.4
20.118.017.7
14.97.7
6.84.9
3.83.12.8
1.20.70.4
NordeaDNB
SwedbankSampo
SEBSHB
InvestorDanske
GjensidigeTryg
IndustrivärdenTopdanmark
StorebrandJyske
Alm.BrandAktia
Protector
Efficient and stable operations as basis for value creation
6Source: Thomson Reuters
>45%
*100% owned by the Republic of Finland; 31.12.2018
A Mixed Financial Conglomerate
BankInsuranceInvestment company
Foreign and Nominee registered 66.86%Solidium 10.09%*Varma Mutual Pension Ins.Co. 4.01%Ilmarinen Mutual Pension Ins.Co. 0.73%The State Pension Fund 0.68%Schweizer Nationalbank 0.50%Other domestic owners 17.14%
>21%
In total over100,000 owners
Strong relative performance
Sampo ownership structure
Market cap February 4th 2019, EURbn 10Y Total Shareholder Return
Sampo Group ― Nordic Financial Group with Strong Brands

1-12/2018 Result • Pre-tax profit 848 EURm (818)• Comprehensive income 284 EURm (581)• Excellent combined ratio of 85.2% (85.3)
‒ Risk ratio 63.3% (63.3); Cost ratio 21.9% (22.0)‒ Claims ratio 68.8% (68.9); Expense ratio 16.4% (16.4)
• ROE%: 11.2% (21.3)
If P&C ‒ A Diversified Nordic P&C Insurer
7
• Diversified and profitable subsidiary• Provides insurance solutions and services
in the Nordic and Baltic regions as well asto Nordic customers with international operations
• Operated on a pan-Nordic basis leveraging both scale and capabilities across all areas in If
• The business areas are divided by customer segments Private, Commercial and Industrial
• The Baltic countries comprise a separate business area
• More than 3.8 million customers• Employees ~6,600• Leading Nordic insurer with a Nordic
market share of 17%, 21% with Topdanmark
549
644
707
636
864
929
931
960
883
818
848
-267
1,12
7
943
308
978
689
526
624
714
581
284
-400-200
0200400600800
1,0001,200
Profit before tax
Comprehensiveincome
Strong & Stable Annual Profit Development, EURmEURm
68.1
68.0
69.1
68.4
65.9
65.4
65.1
66.6
62.3
63.3
63.3
23.7
24.1
23.7
23.5
23.0
22.8
22.5
18.8
22.1
22.0
21.9
91.8
92.1
92.8
92.0
88.9
88.1
87.7
85.4
84.4
85.3
85.2
020406080
100%
Cost ratio
Risk ratio
Combined Ratio Development, %
Sampo Group ― Nordic Financial Group with Strong Brands

-1000
100200300400500600700
Non-life insurance Life insurance Parent companyt etc.
1-12/2018 Result (Contribution to Sampo Group Profit) • Pre-tax profit 199 EURm (848*)• Comprehensive income 147 EURm ( 836*)• Combined ratio 83.6% (81.9)
‒ Claims ratio 67.5% (65.8); Expense ratio 16.1% (16.1)• Topdanmark book value in Group accounts 1,398 EURm(+ positive valuation difference 306 EURm)
• A profitable subsidiary with robust business model• Carries out Danish non-life insurance,
life insurance and pension fund business• Non-life business is divided to
‒ Personal segment (~500,000)‒ SME & Agricultural segment (~100.000)
• Life insurance customers (~140 000)• Employees ~2,400• Market shares in Denmark: P&C insurance 17%,
life insurance 8%• Strategic focus
‒ to be Denmark’s best-run insurance company‒ to combine new technology, digitalization and automation with competent experience in insurance and risk management‒ to utilize the economies of scale between life and non-life insurance business in Denmark‒ declining expense ratio, good risk management and strong sales power
• Sampo’s ownership of shares 46.7% and of votes 49.3%
Combined Ratio Development, %
72.2 75.4 70.3 70.9 68.7 65.8 67.5
15.8 16.2 15.7 15.9 16.4 16.1 16.1
020406080
100
2012 2013 2014 2015 2016 2017 2018
%
Expense ratio
Claims ratio
85.186.886.091.588.0
Topdanmark – A Danish Non-life and Life Insurer
8
Sampo Group ― Nordic Financial Group with Strong Brands
82.0
2013 2014 2015 2016 2017
Profit before taxes, DKKmDKKm
2018
* Includes 706 EURm from valuing of Topdanmark to fair value
83.6

01,0002,0003,0004,0005,0006,000 Other WP-liabilities
Segregated Group PensionWP-liabilities (3.5% guarantee)WP-liabilities (4.5% guarantee)
1-12/2018 Result• Pre-tax profit 450 EURm (236) • Comprehensive income 112 EURm (188)• ROE%: 8.7% (13.3)
140
121
142
137
136
153
163
181
210
236
450
-378
495
332
-115
286
220
149
168
232
188
112
-500
-250
0
250
500
Profit beforetaxes
Comprehensiveincome
• Finnish Profit sharing mechanism – principle of fairness ‒ facilitates active investment strategies and risk taking.
• Profit sharing mechanism has benefited both policyholdersand shareholders over the years.
• Smoothened bonuses and dividends over time.
With-Profit Technical Provisions Forecast, EURmCurrent
Unit-linked Technical Provisions 31.12.2018 EUR 6,955m
Mandatum Life ‒ A Finnish Financial Service Company
9
• Provides a comprehensive range of wealthmanagement and health and life risk servicesin Finland and the Baltics for private and corporate customers
• Services provided‒ Tailored unit-linked investments and the related wealth management‒ Personal risk insurance‒ Pension and reward services
• Customers ~275,000 (Finland)• Employees ~520• A leading life and pension insurer in Finland
with ca 20% market share
Sampo Group ― Nordic Financial Group with Strong Brands
Profit Development, EURmEURm
EURm
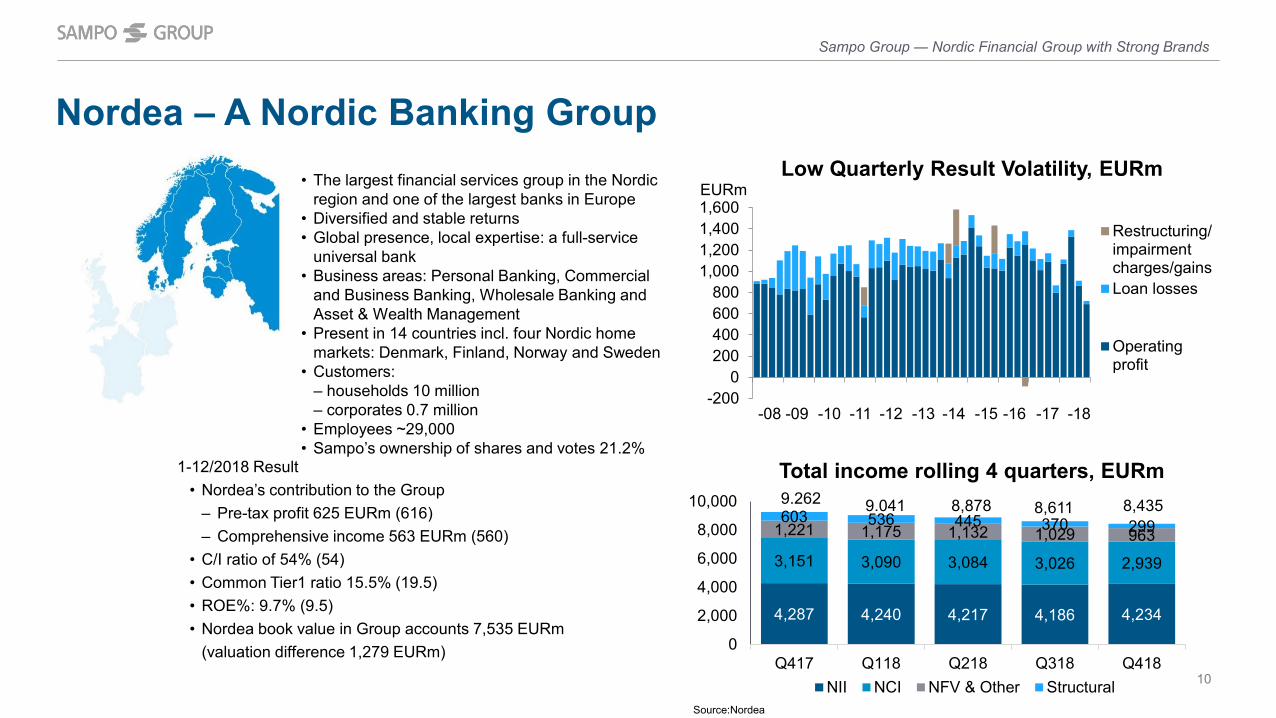
• The largest financial services group in the Nordic region and one of the largest banks in Europe
• Diversified and stable returns• Global presence, local expertise: a full-service
universal bank• Business areas: Personal Banking, Commercial
and Business Banking, Wholesale Banking and Asset & Wealth Management
• Present in 14 countries incl. four Nordic home markets: Denmark, Finland, Norway and Sweden
• Customers:‒ households 10 million‒ corporates 0.7 million
• Employees ~29,000• Sampo’s ownership of shares and votes 21.2%
1-12/2018 Result• Nordea’s contribution to the Group
‒ Pre-tax profit 625 EURm (616)‒ Comprehensive income 563 EURm (560)
• C/I ratio of 54% (54)• Common Tier1 ratio 15.5% (19.5)• ROE%: 9.7% (9.5)• Nordea book value in Group accounts 7,535 EURm
(valuation difference 1,279 EURm)
Nordea – A Nordic Banking Group
-2000
200400600800
1,0001,2001,4001,600
Restructuring/impairmentcharges/gainsLoan losses
Operatingprofit
10
-08 -09 -10 -11 -12 -13 -14 -15 -16 -17
Sampo Group ― Nordic Financial Group with Strong Brands
Low Quarterly Result Volatility, EURmEURm
-18
Source:Nordea
4,287 4,240 4,217 4,186 4,234
3,151 3,090 3,084 3,026 2,939
1,221 1,175 1,132 1,029 963603 536 445 370 299
0
2,000
4,000
6,000
8,000
10,000
Q417 Q118 Q218 Q318 Q418NII NCI NFV & Other Structural
Total income rolling 4 quarters, EURm9.262 9.041 8,878 8,611 8,435

• Geographical diversification• Strong Retail P&C Franchise• Several Lines of Businesses
‒ Motor, Cargo‒ Workersʼ compensation‒ Liability ‒ Accident‒ Property
• Low C/R volatility and Conservative Investments
Diversified Companies and Diversified Portfolio*
11
• Geographical diversification• Strong Retail Banking Franchise• Diversified earnings base:
‒ Banking (Retail, Wholesale)‒ Wealth Management (Asset
Management, Private Banking, Life & Pensions)
• Low earnings volatility & stableROE over the cycle
• Finland & Baltics• Strong Finnish Position• Product areas
‒ Wealth Management‒ Unit-linked Business‒ With-profit Business ‒ Remuneration services‒ Risk insurance
• Dependency on Capital Markets
* Correlations of quarterly Reported Profits Q1/2005–Q4/2018
PBT 2010-18
IF 45%ML 10%Nordea 45%
P/L CONTRIBUTIONS* LOW VOLATILITY EARNINGS LOW VOLATILITY C/R FOCUS ON U-L & WM
0.29
0.23
1
0.85 1
1
Sampo Group ― Nordic Financial Group with Strong Brands
0.34 0.66 0.66 1
• Denmark• Second largest insurance
company• Nation-wide businesses
‒ Non-life insurance‒ Life insurance‒ Pension fund
• Stable insurance riskand low C/R volatility
LOW VOLATILITY C/R

12
870 825
1,320 1,228
1,616 1,668 1,7591,888 1,871
2,482
2,094
-200
200
600
1,000
1,400
1,800
2,200
2,600
2008 2009 2010 2011 2012 2013 2014 2015 2016 2017 2018
Holding Banking Life Topdanmark If P&C
Steady Development of Profit before Taxes
EURm
• If P&C• Mandatum Life• Nordea / Investment
• If P&C• Topdanmark / Associated• Mandatum Life • Nordea / Associated
Sampo Group ― Nordic Financial Group with Strong Brands
* Includes 706 EURm from valuing of Topdanmark to fair value (with share price DKK 247.7)
• If P&C• Topdanmark• Mandatum Life • Nordea / Associated
*
• If P&C• Topdanmark• Mandatum Life • Nordea / Associated• Nordax/ Associated

Sampo plc ‒ Direct equity investments in Other FinancialsCompany Nordax Nets Saxo Bank Asiakastieto Intrum
Business • Swedish consumercredit online bank
• Danish pioneer in digital paymentsand leadingpayment servicesprovider
• Danish fintechcompanyspezialising in online trading
• The Combination of Asiakastieto and UC creates one of the leading Nordic companies in digital services and data innovation with strong market positions in Finland and Sweden
Investment • Associatedcompany • Equity investment • Equity investment • Equity investment • Equity investment
Acquisition value • 240 EURm • 230 EURm • 265 EURm • 62 EURm • 150 EURm
Sampo’s ownership • 36.25% • 19.9% • 12.19% • 5.2%
Market value 12/2018 • 72 EURm • 138 EURm
Co-investor • Nordic Capital • Hellman & Friedman
• Geely 51.5% • Kim Fournais 25.7%
13
Sampo Group ― Nordic Financial Group with Strong Brands

Investment Allocation
14
Sampo Group ― Nordic Financial Group with Strong Brands
Total Group (MEUR)
Money Market 8% 4% 13% 75% 3% 4% 14% 74% 2% 7% 9% 59%Long-Term Fixed Income 79% 67% 47% 20% 84% 68% 49% 18% 88% 65% 54% 11%Equity 13% 12% 26% 5% 13% 10% 25% 7% 10% 8% 24% 20%Private Equity 0% 1% 4% 0% 0% 3% 3% 0% 0% 3% 4% 9%Other 0% 16% 10% 1% 0% 15% 8% 1% 0% 16% 10% 1%
26,524 25,286 25,832
12/16 12/17 12/18
12,192
5,8166,582
1,933
11,459
5,944 6,263
1,620
10,912
6,8795,602
2,440
0
2,000
4,000
6,000
8,000
10,000
12,000
14,000
IfP&
C
Topd
anm
ark
Man
datu
mLi
fe
Sam
poPl
c IfP&
C
Topd
anm
ark
Man
datu
mLi
fe
Sam
poPl
c IfP&
C
Topd
anm
ark
Man
datu
mLi
fe
Sam
poPl
c

1,452
990445
3,779
291
7,017
10,330
59
0
2,000
4,000
6,000
8,000
10,000
12,000
If P&C Mandatum Life Topdanmark Sampo plc'sshares ofNordea/
NDXintressenter
Sampo plc Total capitalrequirement
Group’s Own Funds
Group solvency ratio 147%
Sampo Group’s Own Funds and SolvencyAccording to Conglomerate Rules Dec 31st 2018
15
EURm
Sampo Group ― Nordic Financial Group with Strong Brands
Nordea

Sampo Group Solvency by Solvency II Rules Dec 31st 2018
16
EURm
*) Standard formula
Sampo Group ― Nordic Financial Group with Strong Brands
3,572
3,840
7,41210,361
0
2,000
4,000
6,000
8,000
10,000
12,000
Consolidated GroupSCR*
Nordea and Otherfinancial sector
Group SCR Total Eligible OwnFunds
Ratio of Eligible Own Funds to Group SCR 140%
If P&CA Pan-Nordic Diversified P&C Insurer

58%26%
12%4%
PrivateCommercialIndustrialBaltic
By Business Area By Country
66%
24%
5%3%2%
PrivateCommercialIndustrialBalticOther
Technical Results643 EURm
31%
46%
17%
1%3%
2% NorwaySwedenFinlandDenmarkBalticOther
Gross Written Premiums 4,502 EURm
31%
36%
21%
9% 3% Norway
Sweden
Finland
Denmark
Baltic
If P&C ― A Pan-Nordic Diversified Nordic P&C Insurer
Diversified Client Base
18
1-12/2018

Expense ratio 2017, %
If P&C and Nordic Weighted Average CR% Standard deviation 2008-2018
88.1 87.786.5 86.1
85.3
91.2
88.7 88.7 88.9 88.5
82
84
86
88
90
92
2013 2014 2015 2016 2017If P&C Nordic Market (excl.If)
Disciplined Underwriting and Diversification
%
16.116.417.217.7
25.327.327.828.7
31.831.3
TopdanmarkIf P&C
Nordic market excl. If (-16)RSA Scandinavia
Direct LineAXA
GeneraliAllianz
ZFSAviva
19
If P&C ― A Pan-Nordic Diversified Nordic P&C Insurer
3.9% (2008-2017)
3.2%
4.2%
4.9%
3.9%
If P&C and BA average quarterly CR % vs. DeviationQ1/2008-Q4/2018
Private Commercial
Industrial
Baltic
If P&C
Norway Sweden
Finland Denmark
0
2
4
6
8
10
12
86 88 90 92 94 96
CR
% S
tand
ard
devi
atio
nQ
1/20
08-Q
4/20
18
Average CR% Q1/2008-Q4/2018

Conservative Investment Portfolio
20
• Duration 1.4 years• Average Maturity 2.7 years• Fixed Income Running Yield 1.7%
Mark-to-Market Investment Return, %Investment Allocation7.4%
1.8%
6.1%5.0%
4.1%
1.5%2.9% 2.6%
-0.8%-2%
0%
2%
4%
6%
8%
2010 2011 2012 2013 2014 2015 2016 2017 2018
Mark-to-Market Investment Return, EURm
821
113
689558
459
190334 304
-82-2000
200400600800
1,000
2010 2011 2012 2013 2014 2015 2016 2017 2018
Total 10.9 EURbn
If P&C ― A Pan-Nordic Diversified Nordic P&C Insurer
Money Market 2%
Public Sector 8%
Other Fixed
Income55%
Covered Bonds25%
Equities10%
Private Equity 0.2 % Real Estate0.1 %
Other 0.0 %
EURm

0
50
100
150
200
250
300
350
Investment result
Technical result
Operating result
Seasonality in Quarterly Results and CR%
21
Q4 Q3 Q2 Q1Average Quarterly CR%, 2008-2018 88.3 87.9 87.1 90.9Year 2017 CR% 83.6 84.8 85.7 87.4Year 2018 CR% 83.5 85.8 85.1 86.5
EURm
If P&C ― A Pan-Nordic Diversified Nordic P&C Insurer

EURm
624
1,092
257671 159
156
1,305
3,599
0
500
1,000
1,500
2,000
2,500
3,000
3,500
4,000
1,280
1,047
109467
159 296
1,833
3,599
0
500
1,000
1,500
2,000
2,500
3,000
3,500
4,000
Internally assessed Solvency ratio 276% Standard Formula Solvency ratio 196%
LAC = Loss Absorbing Capacity, DT = Deferred Taxes, SCR= Solvency Capital Requirement
EURm
S&P TTC for A rating 2,949 EURmS&P TTC for A rating 2,949 EURm
If P&C Solvency December 31st 2018
22
If P&C ― A Pan-Nordic Diversified Nordic P&C Insurer

TopdanmarkA Danish Non-life and Life Insurer

84%
13%3%
Non-life insurance
Life insurance
Parent company
26%
21%15%
38%Non-life insurance, Personal
Non-life insurance, SME
Life insurance, regular
Life insurance, single
Topdanmark ― A Danish Non-life and Life Insurer
24
Diversified business modelPre-tax profit 1,702 DKKm Premiums earned 19,247 DKKm
3810
303 3
52
187
1
37
Non-life Life
Head office and life sales
Others (banks etc.)
Danske Bank
Car dealers and Home
Brokers
Digital sales
Telephone sales etc.
Insurance sales reps.
Distribution channels 2018
%
1-12/2018
Source:Topdanmark
Trend in technical result

25
56%44%
Personal
SME
Technical result by Business Line 1,499 DKKm
Non-life insuranceCombined Ratio by Business Line, %
Investment AllocationTotal 2.8 EURbn
Investment Return
4.1%3.4%
1.0%
4.4%
2.1%
0.0%0%
2%
4%
6%
2013 2014 2015 2016 2017 2018
595711
514392
288
-79-200
0
200
400
600
800
2013 2014 2015 2016 2017 2018
DKKm
Topdanmark ― A Danish Non-life and Life Insurer
70 68.5 66.1 67.4 72 69 65.5 67.6
16.3 16.7 16.2 15.9 15.4 16 16 16.4
0
20
40
60
80
100
2015 2016 2017 2018 2015 2016 2017 2018
Claims ratio Expense ratio
85.087.485.286.2 81.582.3
%84.083.3
Personal SME
Source:Topdanmark,Sampo
Money market 15%Fixed income 3%Covered bonds 57%Equities 4%Real estate 6%Other 16%

Life insurance
26
Result by components 228 DKKm
18%
3%
54%
22%
3%Individual policies, single
Individual policies, regular
Policies, part of a tenure single
Policies, part of a tenure, regular
Group life, regular
Gross Premiums (Regular and Single) 10,111 DKKm
110
202
140
228
0
25
50
75
100
125
150
175
200
Inv.return onshareholders’equity(Life Holding)
Sales and administration
Insurancerisk
Risk return onshareholders’equity
Profit onlife insurance
Topdanmark ― A Danish Non-life and Life Insurer
DKKmRegular premiums 2,855 DKKmSingle premiums 7,257 DKKm
Source:Topdanmark

EURm
Partial Internal Model Solvency ratio 196%Gross figures
LAC = Loss Absorbing Capacity, DT = Deferred Taxes, SCR= Solvency Capital Requirement27
Topdanmark Solvency Dec 31st 2018
691
42
595 40161
35898
534872
0
500
1,000
1,500
Standard Model Solvency ratio 163%used in Sampo Group SCR calculations
691
42300 230 61 358
62445
872
0
500
1,000
1,500
Topdanmark ― A Danish Non-life and Life Insurer
26932 14
13264 146 61 82 62
445
872
0
500
1,000
1,500
Partial Internal Model Solvency ratio 196%as reported by Topdanmark, Net SCR figures
EURm
EURm
DKK/EUR 7.4573

Mandatum LifeA Finnish Financial Services Company

Premiums Written 1,081 EURm
Insurance Savings10,450 EURm
138
136
679
2365382
2,193
2,095
2,519144
152
3,309
24 14
Unit-linked life Unit-linked pensionUnit-linked capital redemption Unit-linked BalticOther life Other pensionOther capital redemption Other Baltic
Mandatum Life Business Volumes
29
U-L6,952 EURm
With-Profit3,498 EURm
U-L 976 EURm
With-Profit105 EURm
4,48
7
4,43
1
4,41
0
4,24
9
4,07
1
3,92
7
5,06
5
5,01
4
4,82
1
4,57
2
4,22
2
1,63
7
2,35
9
3,12
4
3,05
4
3,83
3
4,61
6 5,31
2
5,85
8
6,44
0
7,06
6
6,95
5
0
2,000
4,000
6,000
8,000
10,000
12,000 Unit-linked Guaranteed interest rates
Technical Provisions 11,177 EURm
EURm
Mandatum Life ― A Finnish Financial Services Company
Note: Excluding reserves for decreased discount rate, future bonus reserves and longevity reserve
1-12/2018

Investment Portfolio covering With-Profit liabilities
30
11.1%
-1.4%
9.4%
7.1%
4.6%
6.9%7.20% 6.50%
-2.40%-5%
0%
5%
10%
15%
2010 2011 2012 2013 2014 2015 2016 2017 2018
615
-59
504391
251427 440 376
-116-200
0
200
400
600
800
2010 2011 2012 2013 2014 2015 2016 2017 2018
• Duration 2.5 years• Average Maturity 2.8 years• Fixed Income Running Yield 2.7%
Mark-to-Market Investment Return, EURm
Mandatum Life ― A Finnish Financial Services Company
Investment Allocation Mark-to-Market Investment Return, %
EURm
5.6 EURbn
Money Market Securities and
Cash9 %
Government Bonds
1 %
Credit Bonds, Funds and
Loans53%
Listed Equity24 %
Real Estate4%
Private Equity4 %
Unlisted Equity0 %
Biometric0,2%
Commodities0 %
Other Alternative
5 %Trading
Derivatives0 %

Mandatum Life Profit by Components
31
Total expense ratio, % 91.7 93.9Incl. kick backs, % 76.5 76.4
EURm 1-12/2018 1-12/2017Net investment income -26.7 780.8
‒ Transferred to expense result -24.4 -26.2‒ Return on Unit-linked policies 258.8 -405.0‒ Return on With-profit policies* -15.6 -171.4
INVESTMENT RESULT 192.0 178.2EXPENSE RESULT** 34.5 33.2RISK RESULT 33.3 34.7OTHERS 190.5 -10.1PROFIT BEFORE TAXES 450.4 236.0Change in the market value of investments -313.8 5.4PROFIT AT MARKET VALUES 136.6 241.4
Mandatum Life Group, expense ratio
* Includes guaranteed interest, bonuses and change in the reserves of the above items** Result of Unit-linked business 29.4 EURm
Mandatum Life ― A Finnish Financial Services Company

Mandatum Life Solvency December 31st 2018
LAC = Loss Absorbing Capacity, TP = Technical Provision, DT = Deferred Taxes
* Own Funds without transitional measures 1,348 EURm
EURm SF with transitional measures Solvency ratio 176%
1,169
47
352 252 36114
248
990
248
1,740
0
200
400
600
800
1,000
1,200
1,400
1,600
1,800
2,000
32
*
Mandatum Life ― A Finnish Financial Services Company

Nordea BankThe Largest Nordic Financial Services Group

34
Nordea
2,9031,030
2,038
896
1,733
741
1,708
945
623
341
0
5,000
10,000
Operating Income Operating Profit
Group Functions & Other Wealth Management
Wholesale Banking Commercial & Business Banking
Personal Banking
Diversified sources of profit 2018, EURmOperating profit breakdown, EURm
135 129113 106
79 71
4059
4430
Q316 Q416 Q117 Q217 Q317 Q417 Q118 Q218 Q318 Q418
Strong asset quality ‒ Total net loan losses*, EURm
Nordea ― The Largest Nordic Financial Services Group
EURm EURm
1-12/2018
4,324
9,0052,993
1,088600
4,879
173
3,953 3,0810
5,000
10,000 9,005
3,953
Source:Nordea * includes Baltics up until Q317
305 296 296 301282
1312 11 11
1
1313
240
260
280
300
320
340
Q417 Q118 Q218 Q318 Q418AuM PBI NLP DK
AuM development, EURbn

Sampo plcParent Company with Capacity to Generate Funds

Simple Cash Flows, low leverage and adequate liquidity
36
Dividends • If P&C• Mandatum Life• Nordea• Topdanmark
• Internal Administration Costs• Discretionary Dividends for Shareholders
• Interest Expenses for Bondholders
Income• Interest on Liquidity • Income from other
investments
Sampo plc
Assets 12,073 Liabilities 12,073
Liquidity 1,447 CPs Issued 124
Investment assets 770 LT Senior Debt 3,943
‒ Real Estate 2 ‒ Private Placements 122
‒ Fixed Income 23 ‒ Bonds Issued 3,821
‒ Equity & Private Equity 745 ‒ Pension Insurance loans
Subordinated Loans 489 Subordinated Debt 0
Equity Holdings 9,200 Capital 7,890
‒ Subsidiaries 3,401 ‒ Undistributable 98
‒ Associated 5,799 ‒ Distributable 7,792
Other Assets 167 Other Liabilities 115
Key Credit Metrics well in Single A rangeSampo plc December 31st 2018Gross Debt, EURm 4,067Gross Debt to Equity 52%Financial Leverage 34% (= Debt/(Debt+Equity)
Sampo Group, EURm Q4/2018Shareholders’ Equity 13,014Hybrid Bonds 464Senior Debt 4,067Financial leverage 30.2%
Sampo plc ― Parent Company with Capacity to Generate Funds
Flow of Funds Balance Sheet, EURm

Cash and tradable financial investments Dec 31st 2018
37
• In case subordinated loans are sold, both liquidity and Own Funds at Group level are generated• This buffer of liquidity and Own Funds comes with positive interest margin
Sampo plc ― Parent Company with Capacity to Generate Funds
Instrument Market Value, nominalMillion
RunningYield,% Call Date
Cash EUR 1,447
Investment Assets EUR 770
Sub-Ordinated Loans EUR 488 5.34
‒ Mandatum Life T1 Perpetual EUR 100 4.31 Annual
‒ IF T2 30NC10 EUR 99 6.07 8.12.21
‒ Nordea AT1 PerpNC5 USD 171 5.95 23.9.19
‒ Nordea AT1 PerpNC5 USD 98 6.48 13.9.21
‒ Topdanmark T2 PerpNC5 DKK 135 2.92 11.12.20
‒ Topdanmark T2 PerpNC5.5 DKK 270 2.40 11.6.21
Total EUR 2,705

Sampo Group ― Conservative Leverage
-4,000-2,000
02,0004,0006,0008,000
10,00012,00014,00016,000
Q1/
05
Q1/
06
Q1/
07
Q1/
08
Q1/
09
Q1/
10
Q1/
11
Q1/
12
Q1/
13
Q1/
14
Q1/
15
Q1/
16
Q1/
17
Q1/
18
Q1/
19
Sampo plc Net debtGroup NAVGroup Equity*
EURm
0%
5%
10%
15%
20%
25%
30%
35%
40%
Q1/
05
Q1/
06
Q1/
07
Q1/
08
Q1/
09
Q1/
10
Q1/
11
Q1/
12
Q1/
13
Q1/
14
Q1/
15
Q1/
16
Q1/
17
Q1/
18
Q1/
19
Net debt/NAV
• ”Loan-To-Values” based on above figures is low• Parent Companyʼs Financial Leverage is 34% => Sampoʼs position to refinance its debt is adequate
38
Sampo plc ― Parent Company with Capacity to Generate Funds
* Equity attributable to parent company’s equity holders

Dividends Received by Payment YearEURm
39
181
488 540406
544 490597 587 586 620 675
293
200
100100
100 100
125
125150
150
150150
13080
204 250 224293
370533
551557
585
594
107
84
0
200
400
600
800
1,000
1,200
1,400
1,600
1,800
2008 2009 2010 2011 2012 2013 2014 2015 2016 2017 2018 2019***
TopdanmarkNordeaMandatum Life Extra DividendMandatum LifeIf P&C Extra DividendIf P&C
Sampo plc ― Parent Company with Capacity to Generate Funds
***
*) If made a sales gain in connection to the mandatory offer on Topdanmark shares and paid an extra SEK 2.8 billion (EUR 293 million) dividend to Sampo plc on 22 September 2016.**) Mandatum Life paid an extra EUR 150 billion dividend to Sampo plc in September 2018. ***) Nordea Bank AB’s Board of Directors is going propose to the Annual General meeting to be held on 28 March 2019, a dividend of EUR 0.69 per share. With its current holding Sampo plc’s share amounts to EUR 594 million. The dividend is proposed to be paid on 8 April 2019. Topdanmark’s Board of Directors proposes to the AGM of 2019 a dividend of DKK 15 per share. If approved Sampo plc’s share of the dividend payment is EUR 84 million.A dividend of EUR 150 million is planned to be paid by Mandatum Life during the first quarter of 2019. If normally pays its dividend towards the end of the calendar year.
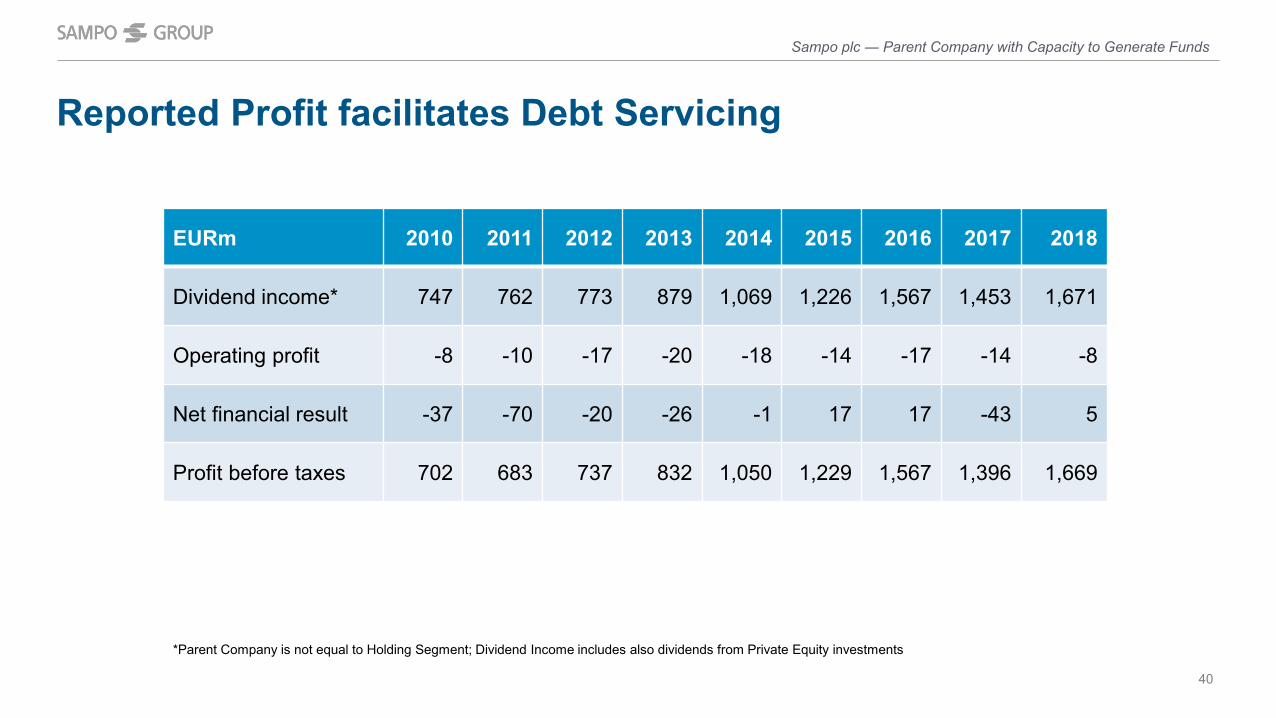
Reported Profit facilitates Debt Servicing
40
*Parent Company is not equal to Holding Segment; Dividend Income includes also dividends from Private Equity investments
*
Sampo plc ― Parent Company with Capacity to Generate Funds
EURm 2010 2011 2012 2013 2014 2015 2016 2017 2018
Dividend income* 747 762 773 879 1,069 1,226 1,567 1,453 1,671
Operating profit -8 -10 -17 -20 -18 -14 -17 -14 -8
Net financial result -37 -70 -20 -26 -1 17 17 -43 5
Profit before taxes 702 683 737 832 1,050 1,229 1,567 1,396 1,669

Issued Debt Instruments
41
EUR
m
Sampo plc ― Parent Company with Capacity to Generate Funds
Instrument & Nominal Coupon Swap Effective Rate MaturityCPs issued 125 EURm Euribor + Margin 0.2500% Average 3MSenior Bond 500 EURm 1.125% --- 1.1640% 24-05-19Senior Bond 2,000 SEKm Stibor3M + 0.77% Euribor3M + 0.586125% 0.2671% 28-05-20Senior Bond 1,000 SEKm 1.250% EUR 1.007% 1.0070% 28-05-20Senior Bond 500 EURm 1.500% --- 1.5920% 16-09-21Senior Bond 700 SEKm 0.875% Euribor6M + 0.3761% 0.1061% 23-05-22Senior Bond 1,300 SEKm Stibor3M + 0.55% Euribor6M + 0.3881% 0.1181% 23-05-22Senior Bond 750 EURm 1.000% --- 1.0060% 18-09-23Senior Bond 500 EURm 1.250% Euribor6M + 0.735% 0.4660% 20-05-25Senior Bond 500 EURm 1.625% Euribor6M + 0.562% 0.2960% 21-02-28Senior Bond 1,000 NOKm 3.100% Euribor6M + 0.77% 0.5010% 07-09-28Senior Bond 500 EURm 2.250% Euribor6M + 1.079% 0.8120% 27-09-30Public debt 3,963 EURm 0.7921% Private placements 124 EURm 0.8770%Total 4,087 EURm 0.8060%
0
500
1000
2019 2020 2021 2022 2023 2024 2025 2026 2027 2028 2029 2030CP´s Senior / EMTN Senior / Mndtm WM

AppendixSeparate Supplementary Information

Sampo Group’s Outlook for 2019
43
Appendix ― Separate Supplementary Information
• Sampo Group’s business areas are expected to report good operating results for 2019. • However, the mark-to-market results are, particularly in life insurance, highly dependent on
capital market developments. The continuing low interest rate level also creates a challenging environment for reinvestment in fixed income instruments.
• If P&C is expected to reach a combined ratio of 86 – 90 per cent in 2019. • With regard to Topdanmark reference is made to the profit forecast model that the company
publishes quarterly. • Nordea’s contribution to the Group’s profit is expected to be significant.

Sampo Group Steering Model and Principles
44
• Four separate and independent business areas and Sampo plc an active owner
• General Principles of Business activities • Straightforward and transparent legal structure combined with limited intragroup exposures • Clear responsibilities• Simple and flat operational structures• Personnel incentivized to increase shareholder value and guard profitability
• Parent company gives guidance to the subsidiaries by setting/contributing • Strategy • Targets for their capitalization and return on equity (RoE) • Group-wide principles for Risk Management, Remuneration, Compliance, Code of Conduct and HR framework
• Subsidiaries organize underwriting activities independently taking into account• The specific characteristics of their operations• The above guidance from the parent company• The stakeholders’ expectations and external regulations
Appendix ― Separate Supplementary Information

Calculation Principles of Sampo Group Solvency• Group Solvency Capital
• Under FICO rules, capital is Group equity with some additional items added or deducted (intangibles, subordinated loans, deferred tax assets, planned dividends etc.)
• Under SII rules capital – referred to as Own funds (OF) – consists mainly of reconciliation reserve and subordinated loans• Under normal circumstances Group OF by Solvency II and FICO rules are close to each other
• SCR by Financial Conglomerate Rules• The Group’s SCR is the sum of the separate sub-groups’ requirements (sectoral rules)• Banking rules are applied for the parent company • No diversification effect between the companies
• SCR by Solvency II rules • One capital requirement is calculated for the insurance group including the parent company Sampo plc, If P&C, Topdanmark and
Mandatum Life. This includes diversification effects and also capital requirement for the translation risk related to SEK denominated equity of If P&C and DKK nominated equity of Topdanmark
• Nordea’s capital requirements are added to the requirement • The SII SCR takes into account diversification only within the insurance group
=> Sampo Group Solvency Ratios are not comparable with most Insurance Groupsʼ solvency ratios 45
Appendix ― Separate Supplementary Information

Structural changes of Sampo Group to the position as the leading Nordic financial group
46
Sampo Group’s (If P&C’s) Topdanmark holding exceeds 23 per cent and Topdanmark becomesIf’s associated company.
Sampo Group (Mandatum Life) acquires Suomi Mutual’swith-profit group pension portfolio. The portfolio transfer takes place on 30 December 2014.
Mandatum Life ends distribution agreement with Danske Bank. In June 2018 ML and Danske agree to continue co-operation.
Sampo Insurance Company and Leonia merge into the Sampo-Leonia financial services group. The Group’s business areas are long-term savings (life insurance, asset management and mutual funds), banking, investment banking, and P&C insurance.
Sampo’s P&C insurance operations are merged with If (2002). Following the transaction, Sampo owns38 per cent of If. If becomes fully owned by Sampo (2004). Following the transaction, Sampo has three core businesses: P&C insurance, banking and long-term savings.
Sampo’s Nordea holding exceeds 20 per cent and Nordea becomes an associated company.
Sampo Group (If P&C) acquires Tryg’s Finnish Business and the acquisition was closed in May 2013. If P&C signs a partnership agreement with Nordea.
Sampo plc’s ownership of Topdanmarkexceeds 33.34 per cent afterthe acquisition of shares from If P&C and in the market and hence Sampo is obliged to make a mandatory offer for the share-holders of Topdanmark. Asa result Sampo plc owns 46.7 per cent of Topdanmark’s shares and 49.3 per cent of votes. Topdanmark becomesSampo’s associated company.
Sampo Group divests SampoBank Group to Danske Bank A/S. Following the transaction, Sampo’s business areas are: P&C insurance and life insurance.
Mandatum Bank joins the Group, and the Group’s name is shortened to Sampo.
Appendix ― Separate Supplementary Information
Topdanmarkbecomes Sampo plc’ssubsidiary on 30 Sept 2017.
Sampo’s ownership exceeds 36% and Nordax becomes Sampo’s accociatedcompany..Sampo invests in Nets, Saxo Bank, Asiakastieto and Intrum
20052003200220012000 2008 2011 2012 2013 2014 2016 20172004 20072006 20102009 2015 2018 2019

If P&C Reinsurance Programmes
47
If is using reinsurance to‒ Utilize its own capital base efficiently and reduce cost of capital‒ Limit large fluctuations of underwriting results‒ Get access to reinsurers’ competence base
If has the following Reinsurance Programmes in place
• Largest & most diversifiedportfolio in the Nordics
• Focus purely on underwriting• Specialised Reinsurance Unit
• Reinsurance partners having reinsurance as core business
• Diversified financially strong panel of reinsurers
• Stable reinsurance program • Efficient pricing and
broad terms
Additional reinsurance purchased for risks with property value accumulations according to Solvency II requirements.
In MillionCatastrophe/
EventProperty/
Risk CasualtyPersonalAccident Motor TPL Cargo Reporter
Capacity SEK 6,300 SEK 2,500/4,750 SEK 500/€50/$50 SEK 1,100 Unlimited SEK 1,000
Retention SEK 250 SEK 250 SEK 100/€10/$15 SEK 100 SEK 100 SEK 100
In MillionMarine HullReporter
Small VesselsClash Cover
Marine Hull I.V. Reporter
Marine Hull WarRisk Reporter
US TerrorismRisk
Capacity SEK 550 SEK 250 SEK 310 SEK 600 USD 250
Retention SEK 100 SEK 100 SEK 100 SEK 2.5 USD 25
Casualty/Cyber Event
SEK 600/€60/$55SEK 200/€20/$25
Appendix ― Separate Supplementary Information

Nordic P&C Insurance Market
22
21
18
6
12
17
If Finland
If Norway
If Sweden
If Denmark +Topdanmark
If Baltics
48
If16% Topdanmark
5%Tryg9%
LF10%
Codan8%Gjensidige
9%
Folksam5%
OP5%
Other33%
If + Topdanmark 21%
Total premiums 26 EURbn
• Consolidated markets• Loyal clients• Direct sales dominates the market• Various other distribution channels• Low expense ratios• Good profitability
Latest available data
Appendix ― Separate Supplementary Information
Nordic Market Shares, % If P&C and Topdanmark P&C Market Shares by Country, %

Life insurance Market
49
Nordea31%
Mandatum Life21%
OP Life22%
LähiTapiola11%
Fennia4%
Sp-Henkivakuutus
4%
Aktia 3%
Other4%
Total premiums 4.5 EURbn
• Various distribution channels• Bankassurance• Unit-linked products• Markets sensitive for regulation, tax changes,
interest rate movements
6
9
Baltics/Mandatum Life
Danmark/Topdanmark Life
Latest available data
Finland ‒ Market Shares, %
Appendix ― Separate Supplementary Information
Mandatum Life and Topdanmark Life Market Shares by Country, %
(+Kaleva 1.3%)

Source: FSA Finland, October 2018
Sampo Group ‒ Legal Supervision Structure
Appendix ― Separate Supplementary Information
50

Sampo plcFabianinkatu 2700100 Helsinki, Finland
Phone: +358 10 516 0100Business ID: 0142213-3
www.sampo.com@Sampo_plcsampo-plc
JANUARY – DECEMBER 2018
Debt Investor Presentation