Dear Shareholders, - Morgan Stanley · PDF fileDear Shareholders, 1998 was a turbulent ......
88
MORGAN STANLEY DEAN WITTER * 1998 ANNUAL REPORT * FOUR * Dear Shareholders, 1998 was a turbulent year in the world’s financial markets,but Morgan Stanley Dean Witter performed exceptionally well.We were there for our clients,and our share- holders were rewarded with strong financial results: * Morgan Stanley Dean Witter earned a record $3.3 billion in 1998, an increase of $690 million, or 27 percent over 1997.Diluted earnings per share were $5.33 — up 28 percent from $4.16 in 1997. * Return on equity was 24.5 percent, which compares favorably with our goal of an average of 18 percent to 20 percent over the course of the business cycle. * In January 1999, our Board of Directors increased the quarterly cash dividend per common share by 20 percent to $0.24. 1998 was a year in which we set ourselves apart from our competitors. Many firms in our industry suffered large trading losses, announced layoffs and began to scale back on their global commitments. Our disciplined approach to trading and risk management kept us on an even keel; we continued to expand the number of financial advisors serving individual investors;and we achieved record results in our individual securities,individual asset management and credit services businesses.We increased our commitment to global markets with a 20 percent staff increase in Europe and 10 percent in Asia. There are countless examples of how we have served our clients and customers during difficult times this past year. Perhaps the most dramatic example was our role as lead-manager in raising $4.4 billion in the first step of DuPont’s spin-off of Conoco, which was the largest U.S. initial public offering in history.The timing of the deal was particularly significant since it was launched in late September when market turmoil had virtually frozen the new issues business.We believe it is an example of our firm’s leadership and our ability to execute superbly in even the most difficult market conditions. A deal such as Conoco brings together the skills and talent of literally thousands of Morgan Stanley Dean Witter professionals.We believe our firm’s combined origi-
Transcript of Dear Shareholders, - Morgan Stanley · PDF fileDear Shareholders, 1998 was a turbulent ......
MORGAN STANLEY DEAN WITTER * 1998 ANNUAL REPORT
* FOUR *
Dear Shareholders,
1998 was a turbulent year in the world’s financial markets, but Morgan Stanley Dean
Witter performed exceptionally well.We were there for our clients, and our share-
holders were rewarded with strong financial results:
* Morgan Stanley Dean Witter earned a record $3.3 billion in 1998,an increase of $690 million, or 27
percent over 1997. Diluted earnings per share were $5.33 — up 28 percent from $4.16 in 1997.
* Return on equity was 24.5 percent, which compares favorably with our goal of an average of
18 percent to 20 percent over the course of the business cycle.
* In January 1999, our Board of Directors increased the quarterly cash dividend per common share by
20 percent to $0.24.
1998 was a year in which we set ourselves apart from our competitors. Many firms
in our industry suffered large trading losses, announced layoffs and began to scale
back on their global commitments. Our disciplined approach to trading and risk
management kept us on an even keel; we continued to expand the number of
financial advisors serving individual investors; and we achieved record results in our
individual securities, individual asset management and credit services businesses.We
increased our commitment to global markets with a 20 percent staff increase in
Europe and 10 percent in Asia.
There are countless examples of how we have served our clients and customers
during difficult times this past year. Perhaps the most dramatic example was our
role as lead-manager in raising $4.4 billion in the first step of DuPont’s spin-off of
Conoco, which was the largest U.S. initial public offering in history.The timing of
the deal was particularly significant since it was launched in late September when
market turmoil had virtually frozen the new issues business.We believe it is an
example of our firm’s leadership and our ability to execute superbly in even the
most difficult market conditions.
A deal such as Conoco brings together the skills and talent of literally thousands of
Morgan Stanley Dean Witter professionals.We believe our firm’s combined origi-

PHILIP J. PURCELL Chairman & Chief Executive Officer
JOHN J. MACKPresident & Chief Operating Officer
THE WISDOM OF OUR LONG-TERM STRATEGY IS INCREASINGLY APPARENT

* SEVEN *
MORGAN STANLEY DEAN WITTER * 1998 ANNUAL REPORT
nation and distribution strengths — forged in our merger two years ago — are par-
ticularly noteworthy. Conoco was not only the largest U.S. IPO in history, it also
provided an extraordinary opportunity for individual investors. Through their
Morgan Stanley Dean Witter financial advisors, our clients purchased an unprece-
dented 20 million shares, or $460 million, in more than 40,000 client accounts.
In last year’s Annual Report, we said we had put the merger behind us.That is true.
But it also is true that the success of the merger continues to have enormous bene-
fits, as evidenced by market share gains in our securities business.This past year, we
solidified our leadership position in global equity underwriting — since the merger,
our market share has increased from 7.3 percent to 10.7 percent.We were No.1 in
IPOs for U.S. issuers in 1998. In underwriting asset-backed securities, our ranking
has improved from No. 8 to No.1 since the merger. In our individual securities busi-
ness, market share measured by both financial advisors and branch revenues has also
increased. As a result of a 10 percent annual growth rate in financial advisors since
the merger,we now rank as the second largest securities sales organization in the U.S.
Our two other major businesses — asset management and credit services — also
performed well. Despite the fear and uncertainty in many markets during much of
the year, we had a net inflow of more than $24 billion in investor funds in our indi-
vidual and institutional asset management businesses.Two of our newest funds —
Competitive Edge and Senior Income Trust — together attracted more than $4 bil-
lion in 1998. Our credit services business had a record year as we refocused on our
highly successful Discover® Card brand.By year-end,we had begun several new ini-
tiatives, including the launch of the new Discover Platinum Card, which we believe
will be a major source of future growth. In addition, our international expansion
plans now are well underway, and we plan to launch a card outside of North
America in 1999.
98
97
96
10.7
figure 1
WORLDWIDE EQUITY & EQUITY RELATED UNDERWRITING*
(market share in percent)
9.3
7.3
*Securities Data Company
98
97
96
13.5
figure 2
INITIAL PUBLIC OFFERINGS*(market share in percent)
7.3
9.9
*Securities Data Company

TODAY’S CHALLENGE IS MANAGING VOLATILITY

* NINE *
MORGAN STANLEY DEAN WITTER * 1998 ANNUAL REPORT
We clearly had an excellent year in 1998, but we are not going to pretend that it
was easy. Like many in our industry, our firm was severely tested, and we are proud
to look back and say that we passed the test. But what of the future? It is clear that
certain long-term trends in the financial services marketplace, very evident this past
year, will continue to create challenges and opportunities.These trends are increas-
ing volatility, globalization, complexity and consolidation. Our strategy has been
built to take full advantage of these forces of change. And we believe our perfor-
mance this past year demonstrates the success of our strategy.
If there is one word to characterize financial markets in 1998, it is volatility.The
Dow swung from a high of 9,340 in July to 7,539 in August and back to a near
record by year-end.The Russian bond default in August contributed to a flight to
quality, unprecedented bond spreads and several weeks of paralysis in fixed income
markets. Continuing instability in Asia caused capital flight and currency fluctua-
tions that led to a virtual standstill in capital market activity.
Our own stock price was not immune from the wild swings in financial markets:
$967⁄8 in July, down to $387⁄16 in October only to rebound by year-end.When you
look at our steady revenue streams, it is difficult to understand this volatility. But it is
symptomatic of the view that all financial services firms are equally impacted by
volatile markets.The question is: How do you counter this perception? We believe
there are two ways: diversity of revenues and effective risk management.
We have diversified revenue streams from three major businesses — securities, asset
management and credit services. This diversity was important in the difficult third
quarter when record earnings in credit services helped us to report stronger earn-
ings than all of our major competitors. Asset management also tends to produce
steady revenue streams.We offer a wide range of asset management products and
OUR DIVERSE REVENUE STREAMS AND EFFECTIVE RISK MANAGEMENT PROVIDE STABILITY
98
97
96
11,238
figure 3
10,157
9,295
FINANCIAL ADVISORS
98
97
96
376
figure 4
TOTAL ASSETS UNDER MANAGEMENT(in billions of U.S. dollars)
338
278

MORGAN STANLEY DEAN WITTER * 1998 ANNUAL REPORT
* TEN *
services, including 45 mutual funds ranked 4- or 5-Star by Morningstar.This past
year, we brought our diverse asset management activities under a single organiza-
tional roof to create an even stronger presence in the marketplace.
There also is great diversity in our securities business. In individual securities, we
achieved stable growth in client assets despite volatile markets largely because our
11,238 financial advisors provided a steadying influence and kept clients focused on
long-term objectives. In institutional equities, foreign exchange and commodities,
we had strong revenues in part because we do not take major proprietary market
positions, but focus on assisting customers with a wide array of products, hedging
solutions and transaction execution.
Our record earnings were a tribute to our strong culture of managing risk. Like
most firms, we review market risk exposure in our institutional securities business
using both quantitative and qualitative approaches. But we believe our success in
managing risk comes down to the experience and discipline of our people.
The events of 1998 forced
people to rethink the concept of globalization.The information technology that
makes it possible for capital to flow freely and for investors to seek the best returns,
regardless of national borders, also makes it possible for capital to exit a country just
as readily.This is what happened in Asia, and, with the links between economies
worldwide, it created uncertainty in other parts of the world.The operative word
became “contagion,” and suddenly talk turned from the benefits of globalization to
fears of worldwide recession.
OUR COMMITMENT TO GLOBAL MARKETS IS UNDIMINISHED
30
25
20
15
10
5
0
figure 5
HISTOGRAM OF DAILY INSTITUTIONAL TRADING REVENUE(in millions of U.S. dollars)
<-15 -10 -5 0 5 10 15 20 25 30 35 40 45 >50
freq
uenc
y
(loss) (gain)

GLOBALIZATION CREATES OPPORTUNITIES AND RISKS

CLIENTS MUST DEAL WITHINCREASED COMPLEXITY

* THIRTEEN *
MORGAN STANLEY DEAN WITTER * 1998 ANNUAL REPORT
In the midst of these uncertainties, Morgan Stanley Dean Witter remained focused,
and both our customers and shareholders have benefited.We were able to structure
large financings for oil ventures in Mexico and Venezuela and an innovative high-
yield financing for the Republic of Argentina during a period when the markets
were not receptive to emerging market securities.We continued to expand our
activities in Europe, providing financing for a high-growth telecommunications
company in the Netherlands, entering and achieving substantial share in the Italian
lira markets, and even leading the first asset-backed offering for a group of British
pubs. Our company ranked No.1 in M&A in Europe for the fourth straight year,
acting as advisor on groundbreaking mergers such as British Petroleum-Amoco
and Deutsche Bank-Bankers Trust. At year-end, the influential European publica-
tion, International Financing Review, named us Bank of the Year, Bond House of the
Year and Equity House of the Year. It was the first time ever that one firm has won
these three top awards in a single year.
There is no better example of our global commitment than our 1998 performance
in Asia. Despite the continuing turmoil, we expanded our presence in equity mar-
kets throughout the region, attaining market leadership on both the Tokyo and
Hong Kong Stock Exchanges.We grew our equity business in Australia and Taiwan,
provided advisory services in restructuring two national banks in Korea and coor-
dinated the $1.1 billion secondary offering of Bangkok Bank — the largest ever
equity offering by a Thai company. Despite Japan’s continuing economic troubles,
we significantly expanded our investment banking and brokerage businesses as Japan
embarks on a comprehensive reform of its financial markets.
The increased complexity
of today’s financial marketplace reflects the forces of globalization,which have made
the world a smaller place but also have created wider opportunities. Investors can
WE SUPPORT OUR CLIENTS WITH INNOVATIVE SOLUTIONS
98
97
96
577.4
figure 6
289.9
260.9
*Securities Data Company
MSDW COMPLETED GLOBAL M&A VOLUME*(in billions of U.S. dollars)
98
97
96
58
figure 7
GENERAL PURPOSE CREDIT CARD VOLUME(in billions of U.S. dollars)
56
54

MORGAN STANLEY DEAN WITTER * 1998 ANNUAL REPORT
* FOURTEEN *
seek higher returns across national borders and diverse products, while issuers have
a much greater variety of financing sources.The great proliferation of products and
financial strategies has added a further layer of complexity. A third element of
complexity in financial services is the challenge posed by technology, which has
greatly accelerated the speed of transactions and created a much wider bandwidth
in the flow of information.
Since the world is unlikely to become a simpler place in the foreseeable future, we
believe the best response to ever-increasing complexity is continuous, relentless
innovation. For our firm, innovation and the application of new technology to
financial challenges have been hallmarks of our success.Whether in mergers and
acquisitions, the use of derivatives to hedge risk, new high-yield or asset-backed
securities, or making research and securities available to individual investors on the
Internet, we will continue to use the flexibility and intellectual capital of our people
to serve customers and create opportunities. Examples of continuing innovation this
past year include our underwritings for Amazon.com in the first-ever high yield
financing for an Internet retailer, the expansion of online services for our 2 million
individual investor clients and the successful launch of Discover Card’s high-speed
transaction report system for its merchant network.
Last year we
noted that in bringing together Morgan Stanley and Dean Witter in mid-1997, we
had anticipated a trend. Our merger was the first of the blockbuster combinations in
financial services.The wave of consolidation has continued. In 1998,M&A activity in
financial services reached $700 billion compared with $117 billion two years ago.We
believe that consolidation in our industry will continue, driven by customer needs.
Customers now want advice, products and liquidity across all geographic markets,
and they are turning to the global firms that can meet their needs.
PRODUCT RANGE AND SCOPE OF DISTRIBUTION ARE PRIZED ATTRIBUTES
98
97
96
13.5
figure 8
10.3
8.2
*Securities Data Company
U.S. HIGH-YIELD DEBT OFFERINGS*
(market share in percent)
98
97
96
14.4
figure 9
4.8
1.2
*Securities Data Company
U.S. PUBLIC RETAIL PREFERRED STOCK OFFERINGS*
(market share in percent)

MARKET FORCES AREDRIVING CONSOLIDATION

IN UNCERTAIN TIMES, CLIENTS LOOKFOR FINANCIAL STRENGTH

* SEVENTEEN *
MORGAN STANLEY DEAN WITTER * 1998 ANNUAL REPORT
Few firms can match Morgan Stanley Dean Witter in range of products and scale of
distribution. In fact, this was the reason for our merger. By bringing top-ranked
research and underwritten products to retail clients, we achieved significant gains in
our individual client business. By the same token, investment banking has gained
market share because of the distribution power of our 11,238 financial advisors.
The newest and most rapidly growing distribution channel is the Internet. Our
firm has positioned itself on the Internet through Discover Brokerage Direct, our
online provider of financial services to individuals. In 1998, Discover Brokerage
Direct expanded its product line to include proprietary equity research, 24-hour
trading of U.S. government securities and a mutual funds marketplace.We also have
introduced several Internet initiatives for Discover Card customers, including
online payment capabilities and Discover ShopCenter,SM a new Internet shopping
link. In 1999,we will focus on the growing number of consumers interested in using
the Internet to purchase a variety of products and services.
The next frontier is the global distribution of securities and asset management
products to individuals, particularly to capitalize on the huge pool of savings in
Japan and the trend toward privatization of pension funds in Europe.There is no
firm yet with a global retail capability, but we believe that firms that have the most
extensive products and distribution today will have the advantage in developing
such a capability tomorrow. In late 1998, we founded a new business unit to pursue
global opportunities in retail securities and asset management, and we expect sig-
nificant strides in 1999.
We believe that Morgan Stanley Dean
Witter clearly has demonstrated its ability to adapt, prosper and grow in a rapidly
changing and often turbulent marketplace.We believe the diversity of our revenue
FEW FIRMS CAN MATCH OUR STAYING POWER
98
97
96
8,703
figure 10
5,214
2,797
DISCOVER BROKERAGE DIRECTINTERNET TRADES PER DAY*
*Average for last month of fiscal year
98
97
96
90
figure 11
86
84
*Institutional Investor 1998 Ranked Analysts
NUMBER OF TOP-RATED ANALYSTS WORLDWIDE*
MORGAN STANLEY DEAN WITTER * 1998 ANNUAL REPORT
* EIGHTEEN *
streams and our ability to manage risk make us less subject to market volatility. Our
global commitment and expertise position us to take full advantage of the continu-
ing trend of globalization. Our capacity for innovation enables us to serve our clients
in an increasingly complex financial marketplace. And as the consolidation of the
financial services industry continues, we believe we have the range of products and
broad distribution channels that will enable us to continue to gain market share.
These capabilities and strategies are the source of considerable financial strength.
Underlying them is a capital base that is one of the largest in our industry.At fiscal
year-end, our shareholders’ equity stood at $14.1 billion, significantly higher than
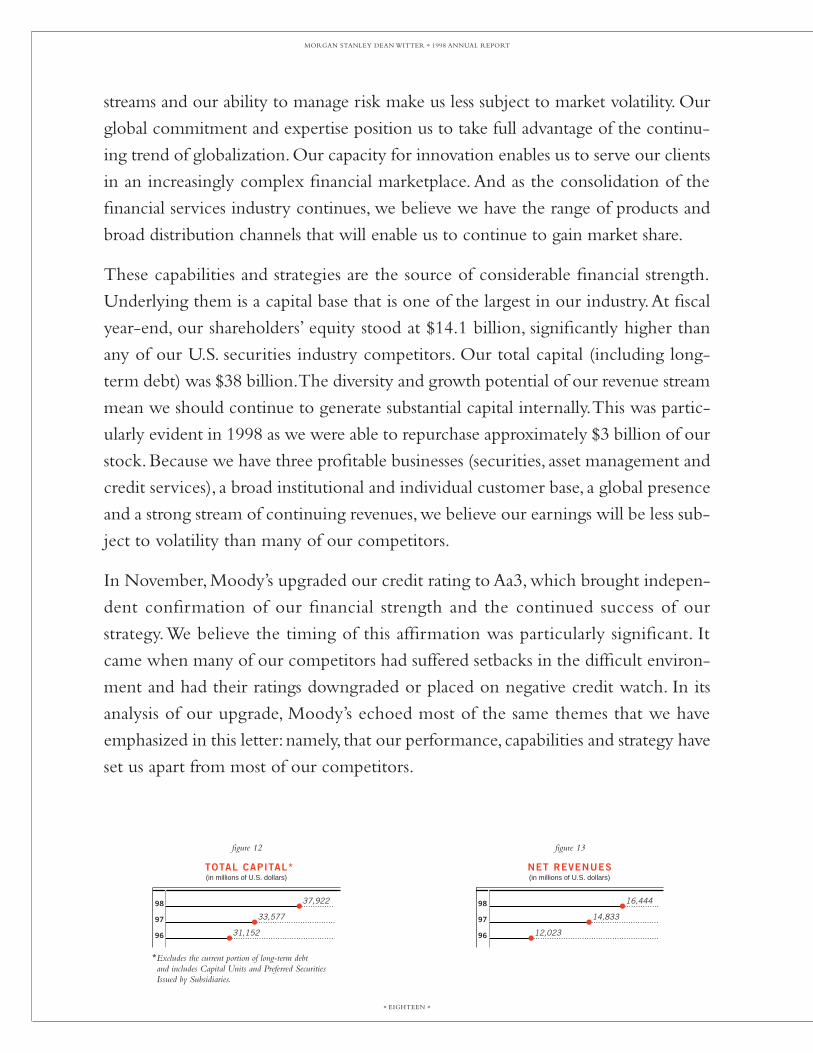
any of our U.S. securities industry competitors. Our total capital (including long-
term debt) was $38 billion.The diversity and growth potential of our revenue stream
mean we should continue to generate substantial capital internally.This was partic-
ularly evident in 1998 as we were able to repurchase approximately $3 billion of our
stock. Because we have three profitable businesses (securities, asset management and
credit services), a broad institutional and individual customer base, a global presence
and a strong stream of continuing revenues,we believe our earnings will be less sub-
ject to volatility than many of our competitors.
In November, Moody’s upgraded our credit rating to Aa3, which brought indepen-
dent confirmation of our financial strength and the continued success of our
strategy.We believe the timing of this affirmation was particularly significant. It
came when many of our competitors had suffered setbacks in the difficult environ-
ment and had their ratings downgraded or placed on negative credit watch. In its
analysis of our upgrade, Moody’s echoed most of the same themes that we have
emphasized in this letter: namely, that our performance, capabilities and strategy have
set us apart from most of our competitors.
98
97
96
37,922
figure 12
33,577
31,152
*Excludes the current portion of long-term debt and includes Capital Units and Preferred Securities Issued by Subsidiaries.
TOTAL CAPITAL*(in millions of U.S. dollars)
98
97
96
16,444
figure 13
14,833
12,023
NET REVENUES(in millions of U.S. dollars)

* NINETEEN *
MORGAN STANLEY DEAN WITTER * 1998 ANNUAL REPORT
1998 was a great year for Morgan Stanley Dean Witter. But it was by no means an
easy year. So we would like to thank each of our 45,000 employees for their strong
spirit and hard work, in often tough circumstances, on behalf of our clients, our
shareholders and our firm.We are pleased that our employees own approximately
25 percent of the stock in our company, which helps ensure that their interests are
closely aligned with our shareholders.
In April, Richard B. Fisher and Thomas C. Schneider, who played key roles in the
merger and helped create our new company,will be leaving our Board of Directors.
As Chairman of Morgan Stanley,Dick led the company’s successful global expansion.
Tom was Chief Financial Officer of Dean Witter Discover and had a central part in
taking the company public in 1993.They have served our company exceptionally
well and will continue to play active roles.We are pleased that Charles F. Knight,
the Chairman and CEO of Emerson Electric Co., has joined our Board of Directors.
The company will benefit from his counsel and experience.
At the time of the merger, we said our goal was to be the world’s preeminent finan-
cial services company. Since then, we have had two straight years of record earnings
and strong business growth in varying market conditions, and the goal we set for
ourselves two years ago now is well within our reach. Some enormous opportuni-
ties, as well as challenges, lie just ahead.We also know there will be surprises. But
we believe our firm is well-prepared for whatever lies in store and we are excited
about the future.We want to thank our fellow shareholders for your support.We
will continue to do everything we can to reward your commitment.
PHILIP J . PURCELL JOHN J . MACKChairman & Chief Executive Officer President & Chief Operating Officer
February 5, 1999

CREDIT AND TRANSACTION SERVICES
MSDW serves three principal constituencies: institutional investors,individual investors, and investment banking clients including cor-porations, governments and other entities around the globe.Thefirm provides investment banking advice on complex financialtransactions like mergers and acquisitions, financial restructuringsand privatizations, and is a major underwriter of stocks and bonds.Its sales and trading services cover virtually every type of financialinstrument traded in the world today, including stocks, bonds,derivatives, foreign exchange and commodities. Backed by morethan 11,000 financial advisors in its individual securities opera-tion, the group handles $438 billion in individual client assets.
ASSET MANAGEMENT
MSDW’s asset management group offers a wide range of productsand services. They include a large family of domestic and inter-national bond, equity and multi-asset class funds for individualand institutional investors; and private partnerships that invest inprivate equity, venture capital and real estate opportunities.
* MSDW managed $376 billion for institutional and individual investors at fiscalyear-end 1998 to rank #2 among U.S. full-service securities firms.
* Van Kampen Funds have won the DALBAR Quality Tested Seal ofApproval for the last nine years for superior service.
* There are 138 MSDW Funds and portfolios with more than $121 billion inassets and more than 3 million investors.
* The firm maintained a top three ranking in global M&A transactions,worldwide equity and equity-related issues, high-yield debt and U.S.investment grade debt. It ranked first in the underwriting of U.S. equityand equity-related issues.
* The equity research group was ranked #1 (by weighted formula) and hadthe greatest number of first-team positions in the 1998 InstitutionalInvestor All-America Poll.
* The firm gained 455,000 new individual accounts — which brought thetotal number of accounts to 3.9 million.
The Discover Card was started in 1985 and was marketed as thefirst value card — with no annual fee and a Cashback Bonus®
Award. The credit services business has $32.5 billion in receiv-ables and is accepted at more than 3 million merchant locationsacross the United States. Discover Brokerage Direct, the firm’sInternet brokerage service, continues to expand as the demandfor Internet trading continues to grow briskly.
* The Discover/NOVUS ®Network enrolled nearly 400,000 merchant locationsduring 1998.
* General purpose credit card transaction volume continued to grow, reaching$58 billion in 1998.
* Discover Brokerage Direct continued to expand the range of services it offers to its growing client list, including online equity research and 24-hour trading in U.S. government securities.
SECURITIES

98
97
96
438
INDIVIDUAL CLIENT ASSETS(in billions of U.S. dollars)
378
254
98
97
96
157
INSTITUTIONAL ASSETS UNDER MANAGEMENT
145
111
(in millions of U.S. dollars)
98
97
96
38
GENERAL PURPOSE CREDIT CARD ACCOUNTS
40
39
(in millions)
98
97
96
3,340
INVESTMENT BANKING REVENUES(in millions of U.S. dollars)
2,694
2,190
98
97
96
219
RETAIL ASSETS UNDER MANAGEMENT(in millions of U.S. dollars)
193
167
98
97
96
33
MANAGED CONSUMER LOANS(in billions of U.S. dollars)
36
33
98
97
96
2,052
INCOME AFTER TAXES(in millions of U.S. dollars)
1,650
1,269
98
97
96
653
INCOME AFTER TAXES(in millions of U.S. dollars)
531
277
98
97
96
688
INCOME AFTER TAXES(in millions of U.S. dollars)
468
434
MORGAN STANLEY DEAN WITTERAT-A-GLANCE

fiscal year (1) (dollars in millions, except share data) 1998 1997 1996 1995 1994
INCOME STATEMENT DATA:
Revenues:Investment banking $ 3,340 $ 2,694 $ 2,190 $ 1,556 $ 1,102Principal transactions:
Trading 3,291 3,191 2,659 1,685 1,614Investments 89 463 86 121 154
Commissions 2,353 2,086 1,776 1,533 1,323Fees:
Asset management, distribution and administration 2,849 2,505 1,732 1,377 1,317
Merchant and cardmember 1,647 1,704 1,505 1,135 940Servicing 928 762 809 680 565
Interest and dividends 16,436 13,583 11,288 10,530 8,715Other 198 144 126 115 127
Total revenues 31,131 27,132 22,171 18,732 15,857Interest expense 13,514 10,806 8,934 8,190 6,697Provision for consumer loan losses 1,173 1,493 1,214 722 530
Net revenues 16,444 14,833 12,023 9,820 8,630Non-interest expenses:
Compensation and benefits 6,636 6,019 5,071 4,005 3,535Other 5,108 4,466 3,835 3,464 3,133Merger-related expenses — 74 — — —Relocation charge — — — 59 —
Total non-interest expenses 11,744 10,559 8,906 7,528 6,668Gain on sale of businesses 685 — — — —Income before income taxes and
cumulative effect of accounting change 5,385 4,274 3,117 2,292 1,962Provision for income taxes 1,992 1,688 1,137 827 705Income before cumulative effect
of accounting change 3,393 2,586 1,980 1,465 1,257Cumulative effect of accounting change (117) — — — —Net income $ 3,276 $ 2,586 $ 1,980 $ 1,465 $ 1,257Earnings applicable to common shares(2) $ 3,221 $ 2,520 $ 1,914 $ 1,400 $ 1,192
PER SHARE DATA:
Earnings per common share(3):Basic before cumulative effect of
accounting change $ 5.80 $ 4.38 $ 3.34 $ 2.37 $ 2.01Cumulative effect of accounting change (0.20) — — — —Basic 5.60 4.38 3.34 2.37 2.01Diluted before cumulative effect of
accounting change 5.52 4.16 3.16 2.26 1.93Cumulative effect of accounting change (0.19) — — — —Diluted 5.33 4.16 3.16 2.26 1.93
Book value per common share 23.88 22.11 18.43 15.63 13.38Dividends per common share 0.80 0.56 0.44 0.32 0.25
BALANCE SHEET AND OTHER OPERATING DATA:
Total assets $ 317,590 $ 302,287 $ 238,860 $ 181,961 $ 159,477Consumer loans, net 15,209 20,033 21,262 19,733 14,731Total capital(4) 37,922 33,577 31,152 24,644 20,933Long-term borrowings(4) 23,803 19,621 19,450 14,636 12,352Shareholders’ equity 14,119 13,956 11,702 10,008 8,581Return on average common shareholders’ equity 24.5% 22.0% 20.0% 16.4% 15.8%Average common and equivalent shares(2) (3) 575,822,725 574,818,233 573,356,930 590,144,217 594,212,948
(1) Fiscal 1994 through fiscal 1996 represents the combination of Morgan Stanley Group Inc.’s financial statements for the fiscal years ended November 30 with Dean Witter, Discover& Co.’s financial statements for the years ended December 31.
(2) Amounts shown are used to calculate basic earnings per common share.(3) Earnings per share data for fiscal 1994 through fiscal 1997 have been restated to reflect the Company’s adoption of SFAS No. 128.(4) These amounts exclude the current portion of long-term borrowings and include Capital Units and Preferred Securities Issued by Subsidiaries.
* SIX *
MORGAN STANLEY DEAN WITTER * 1998 ANNUAL REPORT
S E L E C T E D F I N A N C I A L D ATA

INTRODUCTION
THE COMPANY
On May 31, 1997, Morgan Stanley Group Inc. (“Morgan Stanley”)
was merged with and into Dean Witter, Discover & Co. (“Dean Witter
Discover”) (the “Merger”). At that time, Dean Witter Discover
changed its corporate name to Morgan Stanley, Dean Witter, Discover
& Co. (“MSDWD”). In conjunction with the Merger, each share of
Morgan Stanley common stock then outstanding was converted into
1.65 shares of MSDWD’s common stock (the “Exchange Ratio”). In
addition, each share of Morgan Stanley preferred stock was converted
into one share of a corresponding series of preferred stock of
MSDWD. The Merger was treated as a tax-free exchange.
On March 24, 1998, MSDWD changed its corporate
name to Morgan Stanley Dean Witter & Co. (the “Company”).
The Company is a pre-eminent global financial ser-
vices firm that maintains leading market positions in each of its
businesses — Securities and Asset Management, and Credit and
Transaction Services. The Company combines global strengths in
investment banking (including underwriting public offerings of secu-
rities and mergers and acquisitions advice) and institutional sales and
trading, with strengths in providing investment and global asset man-
agement services to its customers and in providing quality consumer
credit products primarily through its Discover® Card brand.
BASIS OF FINANCIAL INFORMATION
AND CHANGE IN FISCAL YEAR-END
The Company’s consolidated financial statements give retroactive
effect to the Merger, which was accounted for as a pooling of inter-
ests. The pooling of interests method of accounting requires the
restatement of all periods presented as if Dean Witter Discover and
Morgan Stanley always had been combined. The consolidated state-
ment of changes in shareholders’ equity reflects the accounts of the
Company as if the additional preferred and common stock had been
issued during all of the periods presented.
Prior to the Merger, Dean Witter Discover’s year ended
on December 31 and Morgan Stanley’s fiscal year ended on
November 30. Subsequent to the Merger, the Company adopted a
fiscal year-end of November 30. In recording the pooling of inter-
ests combination, Dean Witter Discover’s financial statements for the
year ended December 31, 1996 were combined with Morgan Stanley’s
financial statements for the fiscal year ended November 30, 1996
(on a combined basis, “fiscal 1996”). The Company’s results for the
12 months ended November 30, 1998 (“fiscal 1998”) and
November 30, 1997 (“fiscal 1997”) reflect the change in fiscal year-
end. Fiscal 1997 includes the results of Dean Witter Discover that
were restated to conform to the new fiscal year-end date. The
Company’s results of operations for fiscal 1997 and fiscal 1996
include the month of December 1996 for Dean Witter Discover.
Certain reclassifications have been made to prior-year
amounts to conform to the current presentation. All material inter-
company balances and transactions have been eliminated.
RESULTS OF OPERATIONS
CERTAIN FACTORS AFFECTING RESULTS OF OPERATIONS*
The Company’s results of operations may be materially affected by
market fluctuations and by economic factors. In addition, results of
operations in the past have been and in the future may continue to
be materially affected by many factors of a global nature, including
economic and market conditions; the availability of capital; the
level and volatility of equity prices and interest rates; currency val-
ues and other market indices; technological changes and events (such
as the increased use of the Internet and the Year 2000 issue); the
availability of credit; inflation; and legislative and regulatory devel-
opments. Such factors also may have an impact on the Company’s
ability to achieve its strategic objectives on a global basis, includ-
ing (without limitation) continued increased market share in its
securities activities, growth in assets under management and the
expansion of its Discover Card brand.
The Company’s Securities and Asset Management
business, particularly its involvement in primary and secondary
markets for all types of financial products, including derivatives, is
subject to substantial positive and negative fluctuations due to a vari-
ety of factors that cannot be predicted with great certainty, includ-
ing variations in the fair value of securities and other financial
* TWENTY-THREE *
MORGAN STANLEY DEAN WITTER * 1998 ANNUAL REPORT
MANAGEMENT ’S D ISCUSS ION AND ANALYS IS OF F INANC IAL COND IT ION AND RESULTS OF OPERAT IONS
*This Management’s Discussion and Analysis of Financial Condition and Results of Operationscontains forward-looking statements as well as a discussion of some of the risks and uncertaintiesinvolved in the Company’s businesses that could affect the matters referred to in such statements.

products and the volatility and liquidity of global trading markets.
Fluctuations also occur due to the level of market activity, which,
among other things, affects the flow of investment dollars into
mutual funds and the size, number and timing of transactions or
client assignments (including the realization of returns from the
Company’s private equity investments).
In the Company’s Credit and Transaction Services
business, changes in economic variables may substantially affect con-
sumer loan levels and credit quality. Such variables include the num-
ber and size of personal bankruptcy filings, the rate of unemployment
and the level of consumer debt as a percentage of income.
The Company’s results of operations also may be
materially affected by competitive factors. In addition to competi-
tion from firms traditionally engaged in the securities and asset man-
agement business, there has been increased competition from other
sources, such as commercial banks, insurance companies, mutual
fund groups, online service providers and other companies offering
financial services both in the U.S. and globally. As a result of recent
and pending legislative and regulatory initiatives in the U.S. to
remove or relieve certain restrictions on commercial banks, com-
petition in some markets that have historically been dominated by
investment banks and retail securities firms has increased and may
continue to increase in the near future. In addition, recent and con-
tinuing global convergence and consolidation in the financial services
industry will lead to increased competition from larger diversified
financial services organizations.
Such competition, among other things, affects the
Company’s ability to attract and retain highly skilled individuals.
Competitive factors also affect the Company’s success in attracting
and retaining clients and assets through its ability to meet investors’
saving and investment needs by consistency of investment perfor-
mance and accessibility to a broad array of financial products and
advice. In the credit services industry, competition centers on mer-
chant acceptance of credit cards, credit card account acquisition and
customer utilization of credit cards. Merchant acceptance is based
on both competitive transaction pricing and the number of credit
cards in circulation. Credit card account acquisition and customer
utilization are driven by offering credit cards with competitive and
appealing features such as no annual fees, low introductory inter-
est rates and other customized features targeting specific consumer
groups and by having broad merchant acceptance.
As a result of the above economic and competitive fac-
tors, net income and revenues in any particular period may not be
representative of full-year results and may vary significantly from year
to year and from quarter to quarter. The Company intends to man-
age its business for the long term and help mitigate the potential
effects of market downturns by strengthening its competitive posi-
tion in the global financial services industry through diversification
of its revenue sources and enhancement of its global franchise. The
Company’s ability and success in maintaining high levels of profitable
business activities, emphasizing fee-based assets that are designed
to generate a continuing stream of revenues, managing risks in
both the Securities and Asset Management and Credit and
Transaction Services businesses, evaluating credit product pricing
and monitoring costs will continue to affect its overall financial
results. In addition, the complementary trends in the financial ser-
vices industry of consolidation and globalization present, among other
things, technological, risk management and other infrastructure
challenges that will require effective resource allocation in order for
the Company to remain competitive.
GLOBAL MARKET AND
ECONOMIC CONDITIONS IN FISCAL 1998
Conditions in the global financial markets were extremely turbulent
during fiscal 1998. While the favorable market and economic con-
ditions which characterized fiscal 1997 continued through much of
the first and second quarters of fiscal 1998, periods of extreme
volatility in the latter half of the year created difficult conditions in
many global financial markets. Nevertheless, the Company’s
Securities and Asset Management business generated record levels
of net income and net revenues and ended the fiscal year with
record levels of financial advisors, customer accounts and assets, and
assets under management and administration. The Company’s Credit
and Transaction Services business also achieved record operating
results in fiscal 1998, reflecting an improvement in the credit qual-
ity of customer receivables.
In the U.S., market conditions continued to benefit
from the overall strength of the domestic economy. Throughout fis-
* TWENTY-FOUR *
MORGAN STANLEY DEAN WITTER * 1998 ANNUAL REPORT

cal 1998, the U.S. economy was characterized by moderate levels
of growth, a stable level of inflation, low unemployment, and high
levels of consumer confidence and spending. However, U.S. finan-
cial markets also experienced periods of volatility. In the first half
of the year, investors were concerned with the potential impact of
the ongoing economic downturn in the Far East and with domestic
wage inflation. Later in the year, U.S. markets were adversely
affected by investor reaction to the severe economic turmoil in the
Far East, Russia and other emerging market nations. Investor pref-
erences shifted toward less-risky investments, resulting in unprece-
dented widening of credit spreads, reduced liquidity in the
marketplace and dramatic declines in U.S. Treasury yields. In addi-
tion, equity prices declined significantly as a result of these devel-
opments. During the fourth quarter, these conditions prompted the
Federal Reserve Board to lower the overnight lending rate by 0.25%
on three separate occasions in an effort to increase liquidity, to min-
imize the risk of recession in the U.S. due to the weaknesses in for-
eign economies and to avert a continued global economic slowdown.
The actions of the Federal Reserve Board, coupled with the contin-
ued resilience of the U.S. economy, contributed to improved con-
ditions in the financial markets in late 1998, and both equity and
bond prices rebounded.
Conditions in European financial markets were gen-
erally favorable in fiscal 1998. Many European stock exchanges
reached record levels during the year as the result of strong corpo-
rate earnings, merger and consolidation activity, and stable economic
conditions in the first half of fiscal 1998. European financial mar-
kets also benefited from positive investor sentiment relating to the
European Economic and Monetary Union (“EMU”). EMU com-
menced on January 1, 1999 when the European Central Bank
assumed control of monetary policy for the 11 European Union
countries participating in the EMU. Those national currencies of the
participating countries have become fixed denominations of the
euro and ultimately will cease to exist as separate currencies and will
be replaced by the euro. European markets also experienced peri-
ods of extreme volatility during the year, particularly during the
third quarter as investors reacted to the severe economic and finan-
cial difficulties which developed in Russia. The Russian economy
was adversely affected by the difficult conditions in the Far East,
declining oil prices and an unstable political infrastructure. The
Russian government’s decision to reschedule its domestic debt
obligations and some of its external Soviet debt obligations and to
devalue the ruble severely reduced investor confidence and resulted
in significant levels of volatility in Russian and other financial mar-
kets. Toward the end of fiscal 1998, conditions in Europe recovered
due to, among other things, lower interest rates and increased sta-
bility in the global financial markets.
Market conditions in the Far East continued to be slug-
gish due to the ongoing financial and economic difficulties that have
existed in that region since the latter half of fiscal 1997. The
Japanese economy continued to be adversely affected by shrinking
consumer demand, declining corporate profits, deflation and rising
unemployment. These conditions contributed to the resignation of
Japan’s Prime Minister during the year, as well as the announcement
of more aggressive fiscal, monetary and financial sector policies
designed to improve the nation’s rate of economic growth. However,
due to the weakness of the Japanese banking system and the diffi-
cult economic conditions existing throughout the Far East, many
investors were concerned that the length of time necessary for eco-
nomic recovery would be longer than expected. Financial markets
elsewhere in the Far East also were weak during fiscal 1998. The
poor economic performance of Japan, outbreaks of political and social
unrest, and crises in other emerging markets adversely affected the
financial markets of many nations within the region.
The worldwide market for mergers and acquisitions
continued to be robust during fiscal 1998, contributing to record lev-
els of revenues by the Company’s investment banking business. The
merger and acquisition market reflected ongoing consolidation and
globalization across many industry sectors, as well as an increased
level of deregulation and privatization. As a result, fiscal 1998
included some of the largest merger and acquisition transactions ever
completed. The markets for the underwriting of securities were pos-
itively impacted by the generally favorable market and economic con-
ditions which existed during the first half of fiscal 1998. Activity in
the primary markets virtually came to a standstill in the latter part
of the third quarter and the beginning of the fourth quarter. However,
toward the end of fiscal 1998, activity in the primary markets, par-
* TWENTY-FIVE *
MORGAN STANLEY DEAN WITTER * 1998 ANNUAL REPORT

ticularly for fixed income securities, began to strengthen as condi-
tions in the global financial markets stabilized.
In fiscal 1998, U.S. consumer demand and retail
sales continued to increase at a moderate pace, despite an earlier
consensus that a slowdown may have been imminent. The favorable
interest rate environment that existed in the U.S. during fiscal
1998 enabled consumers to manage finances advantageously while
still allowing for steady growth in consumer credit. During fiscal
1998, loan losses and personal bankruptcies appeared to level off
from the record growth of industry-wide loan losses set in 1997. The
Company continued to invest in the growth of its credit card busi-
ness through the expansion of its Discover/NOVUS® Network and by
increasing its marketing and solicitation activities with respect to the
Discover Card brand.
FISCAL 1998 AND 1997 RESULTS FOR THE COMPANY
The Company achieved net income of $3,276 million in fiscal
1998, a 27% increase from fiscal 1997. Fiscal 1998’s net income
included a net gain of $345 million from the sale of the Company’s
Global Custody business, its interest in the operations of SPS
Transaction Services, Inc. (“SPS”), and certain BRAVO® Card receiv-
ables (“BRAVO”) (see “Results of Operations — Business
Dispositions” herein). Fiscal 1998 net income also included a
charge of $117 million resulting from the cumulative effect of an
accounting change. This charge represents the effect of an account-
ing change adopted in the fourth quarter (effective December 1,
1997) with respect to the accounting for offering costs paid by invest-
ment advisors of closed-end mutual funds, where such costs are not
specifically reimbursed through separate advisory contracts (see
Note 2 to the consolidated financial statements).
Excluding the net gain from the sale of the businesses
noted above and the charge resulting from the cumulative effect of
an accounting change, fiscal 1998 income was $3,048 million, an
increase of 18% from fiscal 1997. In fiscal 1997, net income was
$2,586 million, an increase of 31% from fiscal 1996. Basic earn-
ings per common share increased 28% to $5.60 in fiscal 1998 and
31% to $4.38 in fiscal 1997. Excluding the net gain from the sale
of the businesses noted above and the impact of the cumulative effect
of an accounting change, basic earnings per common share was
$5.20 in fiscal 1998, an increase of 19% from fiscal 1997. Diluted
earnings per common share increased 28% to $5.33 in fiscal 1998
and 32% to $4.16 in fiscal 1997. Excluding the net gain from the
sale of the businesses noted above and the impact of the cumula-
tive effect of an accounting change, diluted earnings per common
share was $4.95 in fiscal 1998, an increase of 19% from fiscal
1997. The Company’s return on average shareholders’ equity was
25%, 22% and 20% in fiscal 1998, fiscal 1997 and fiscal 1996,
respectively. Excluding the net gain from the sale of the businesses
noted above and the impact of the cumulative effect of an
accounting change, fiscal 1998’s return on average shareholders’
equity was 23%.
BUSINESS DISPOSITIONS
In fiscal 1998, the Company entered into several transactions reflect-
ing its strategic decision to focus on growing its core Securities and
Asset Management and Credit and Transaction Services businesses.
In the fourth quarter of fiscal 1998, the Company com-
pleted the sale of its Global Custody business. The Company also sold
its interest in the operations of SPS, a 73%-owned, publicly held
subsidiary of the Company. In addition, the Company sold certain
credit card receivables relating to its discontinued BRAVO Card. The
Company’s aggregate net pre-tax gain resulting from these transac-
tions was $685 million.
In addition, during fiscal 1998 the Company sold its
Prime OptionSM MasterCard® portfolio (“Prime Option”), a business
it had operated with NationsBank of Delaware, N.A., and its
Correspondent Clearing business. The gains resulting from the sale
of these businesses were not material to the Company’s results of
operations or financial condition.
The remainder of Results of Operations is presented on
a business segment basis. With the exception of fiscal 1997’s merger-
related expenses, substantially all of the operating revenues and
operating expenses of the Company can be directly attributed to its
two business segments: Securities and Asset Management and Credit
and Transaction Services. This discussion excludes the cumulative
effect of the accounting change in references to fiscal 1998 net
* TWENTY-SIX *
MORGAN STANLEY DEAN WITTER * 1998 ANNUAL REPORT
income. Certain reclassifications have been made to prior-period
amounts to conform to the current year’s presentation.
SECURITIES AND ASSET MANAGEMENT
STATEMENTS OF INCOME
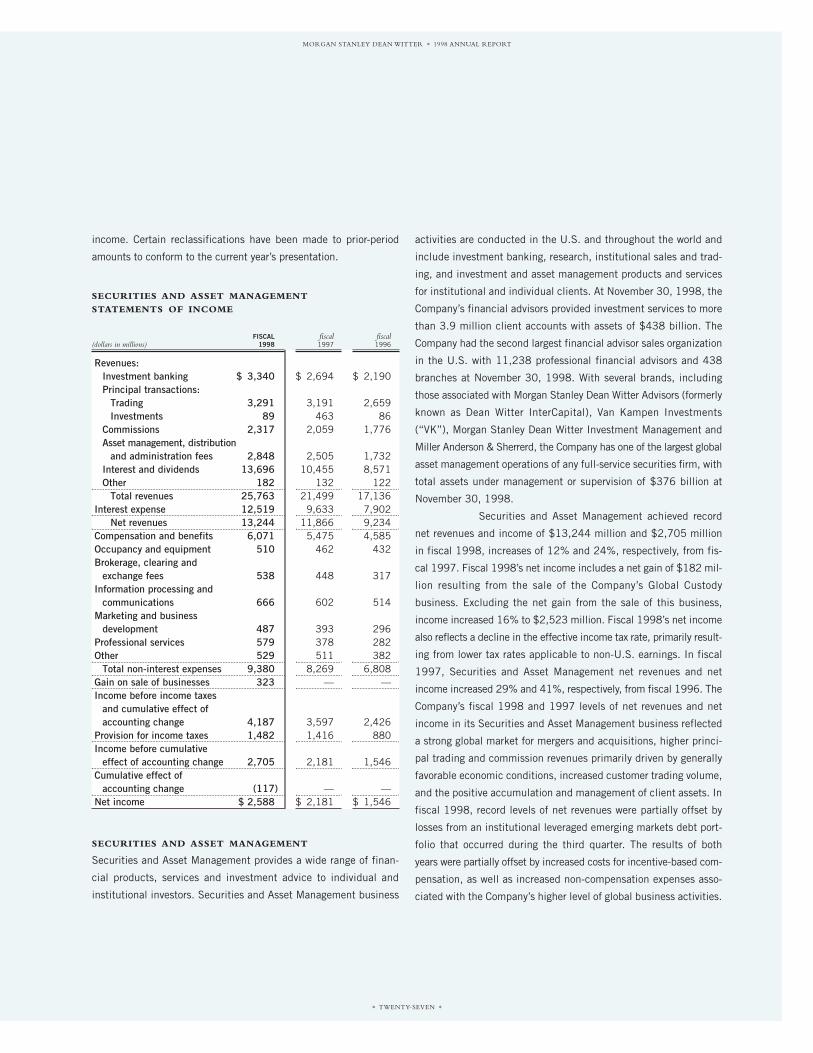
FISCAL fiscal fiscal(dollars in millions) 1998 1997 1996
Revenues:Investment banking $ 3,340 $ 2,694 $ 2,190Principal transactions:
Trading 3,291 3,191 2,659Investments 89 463 86
Commissions 2,317 2,059 1,776Asset management, distribution
and administration fees 2,848 2,505 1,732Interest and dividends 13,696 10,455 8,571Other 182 132 122
Total revenues 25,763 21,499 17,136Interest expense 12,519 9,633 7,902
Net revenues 13,244 11,866 9,234Compensation and benefits 6,071 5,475 4,585Occupancy and equipment 510 462 432Brokerage, clearing and
exchange fees 538 448 317Information processing and
communications 666 602 514Marketing and business
development 487 393 296Professional services 579 378 282Other 529 511 382
Total non-interest expenses 9,380 8,269 6,808Gain on sale of businesses 323 — —Income before income taxes
and cumulative effect ofaccounting change 4,187 3,597 2,426
Provision for income taxes 1,482 1,416 880Income before cumulative
effect of accounting change 2,705 2,181 1,546Cumulative effect of
accounting change (117) — —Net income $ 2,588 $ 2,181 $ 1,546
SECURITIES AND ASSET MANAGEMENT
Securities and Asset Management provides a wide range of finan-
cial products, services and investment advice to individual and
institutional investors. Securities and Asset Management business
activities are conducted in the U.S. and throughout the world and
include investment banking, research, institutional sales and trad-
ing, and investment and asset management products and services
for institutional and individual clients. At November 30, 1998, the
Company’s financial advisors provided investment services to more
than 3.9 million client accounts with assets of $438 billion. The
Company had the second largest financial advisor sales organization
in the U.S. with 11,238 professional financial advisors and 438
branches at November 30, 1998. With several brands, including
those associated with Morgan Stanley Dean Witter Advisors (formerly
known as Dean Witter InterCapital), Van Kampen Investments
(“VK”), Morgan Stanley Dean Witter Investment Management and
Miller Anderson & Sherrerd, the Company has one of the largest global
asset management operations of any full-service securities firm, with
total assets under management or supervision of $376 billion at
November 30, 1998.
Securities and Asset Management achieved record
net revenues and income of $13,244 million and $2,705 million
in fiscal 1998, increases of 12% and 24%, respectively, from fis-
cal 1997. Fiscal 1998’s net income includes a net gain of $182 mil-
lion resulting from the sale of the Company’s Global Custody
business. Excluding the net gain from the sale of this business,
income increased 16% to $2,523 million. Fiscal 1998’s net income
also reflects a decline in the effective income tax rate, primarily result-
ing from lower tax rates applicable to non-U.S. earnings. In fiscal
1997, Securities and Asset Management net revenues and net
income increased 29% and 41%, respectively, from fiscal 1996. The
Company’s fiscal 1998 and 1997 levels of net revenues and net
income in its Securities and Asset Management business reflected
a strong global market for mergers and acquisitions, higher princi-
pal trading and commission revenues primarily driven by generally
favorable economic conditions, increased customer trading volume,
and the positive accumulation and management of client assets. In
fiscal 1998, record levels of net revenues were partially offset by
losses from an institutional leveraged emerging markets debt port-
folio that occurred during the third quarter. The results of both
years were partially offset by increased costs for incentive-based com-
pensation, as well as increased non-compensation expenses asso-
ciated with the Company’s higher level of global business activities.
* TWENTY-SEVEN *
MORGAN STANLEY DEAN WITTER * 1998 ANNUAL REPORT

The operating results of both years were favorably impacted by the
Company’s focus on accumulating client assets and building fee-
based assets under management and administration.
Investment Banking
Investment banking revenues are derived from the underwriting of
securities offerings and fees from advisory services. Investment
banking revenues were as follows:
FISCAL fiscal fiscal(dollars in millions) 1998 1997 1996
Advisory fees from merger, acquisition and restructuring
transactions $1,322 $ 920 $ 848Equity underwriting revenues 815 888 722Fixed income underwriting
revenues 1,203 886 620Total investment banking
revenues $3,340 $2,694 $2,190
Investment banking revenues increased 24% and attained record lev-
els in fiscal 1998, surpassing the Company’s previous record in fis-
cal 1997. Revenues in fiscal 1998 benefited from increased advisory
fees from merger, acquisition and restructuring transactions, as well
as increased revenues from underwriting fixed income securities. Fiscal
1997’s revenues reflect higher advisory fees from merger, acquisi-
tion and restructuring transactions, as well as increased revenues from
underwriting both equity and fixed income securities.
The worldwide merger and acquisition markets
remained robust for the fourth consecutive year with more than $2.5
trillion of transactions (per Securities Data Company) announced dur-
ing calendar year 1998, including record volume in the U.S. During
calendar year 1998, the Company’s dollar volume of announced
merger and acquisition transactions increased by more than 80% over
the comparable period of 1997. The high level of transaction activ-
ity reflected the continuing trend of consolidation and globalization
across many industry sectors, as companies attempted to expand into
new markets and businesses through strategic combinations. The sus-
tained growth of the merger and acquisition markets, coupled with
the Company’s global presence and strong market share, had a pos-
itive impact on advisory fees, which increased 44% in fiscal 1998.
Advisory fees from real estate transactions also were higher as com-
pared with the prior year, driven by strong levels of market consol-
idation activities in the U.S. and by recovering real estate markets
in Europe. The 8% increase in advisory fees in fiscal 1997 was pri-
marily due to high transaction volumes resulting from the strong
global market for merger, acquisition and restructuring activities, as
well as increased revenues from real estate advisory transactions.
Equity underwriting revenues decreased 8% in fiscal
1998 although continuing to reflect a high volume of equity offer-
ings and the Company’s strong market share. During the first half
of fiscal 1998, the primary market for equity issuances benefited
from a high volume of cash inflows into equity mutual funds, as well
as from a generally favorable economic environment. Equity under-
writing revenues were adversely affected by the reduced activity in
the primary market in the second half of the fiscal year due to the
significant uncertainty and volatility in global financial markets.
Equity underwriting revenues increased 23% in fiscal 1997, primarily
due to a higher volume of equity offerings and an increased market
share, particularly in Europe, as compared with the prior year. In fis-
cal 1997, the primary market for equity issuances also benefited from
a high volume of cash inflows into equity mutual funds and from a
favorable economic environment.
Revenues from fixed income underwriting increased
36% in fiscal 1998, primarily driven by higher revenues from
issuances of global high-yield and investment grade fixed income
securities. The primary market for these securities benefited from
relatively low nominal interest rates which existed throughout the year
and attracted many issuers to the market, as well as from periods
of strong investor demand. During the latter part of fiscal 1998, the
primary market was less active as increased volatility in global
financial markets caused an unprecedented widening of credit
spreads and a shift of investor preferences toward financial instru-
ments with higher credit ratings. Revenues from fixed income under-
writing increased 43% in fiscal 1997. The increase was primarily
attributable to higher revenues from high-yield debt issuances, as
the favorable market conditions which existed for much of fiscal 1997
enabled certain high-yield issuers to obtain attractive rates of financ-
ing. Fiscal 1997’s fixed income underwriting revenues also were
impacted by higher revenues from securitized debt issuances, result-
ing from the Company’s continued focus on this business sector and
an increase in the number of asset-backed transactions.
* TWENTY-EIGHT *
MORGAN STANLEY DEAN WITTER * 1998 ANNUAL REPORT

Principal Transactions
Principal transactions include revenues from customers’ purchases
and sales of securities in which the Company acts as principal and
gains and losses on securities held for resale.
Principal transaction trading revenues were as follows:
FISCAL fiscal fiscal(dollars in millions) 1998 1997 1996
Equities $2,056 $1,310 $1,181Fixed income 455 1,187 1,172Foreign exchange 587 500 169Commodities 193 194 137
Total principal transaction trading revenues $3,291 $3,191 $2,659
Principal transaction trading revenues increased 3% in fiscal 1998,
primarily due to higher equities and foreign exchange trading revenues,
partially offset by a decline in fixed income trading revenues. In fis-
cal 1997, principal trading revenues increased 20%, primarily
reflecting higher equities and foreign exchange trading revenues.
Equity trading revenues increased 57% to a record
level in fiscal 1998, primarily reflecting higher revenues from equity
cash and derivative products. The increase in revenues from equity
cash products was primarily attributable to higher trading volumes
in European markets, which benefited from the Company’s increased
sales and research coverage of the region that began in mid-1997.
European equity trading revenues also benefited from generally
favorable market conditions and positive investor sentiment regard-
ing EMU. Revenues from trading equity derivative products also
increased, primarily due to increased transaction volume and the high
levels of market volatility that existed throughout the year, particu-
larly in technology-related issues. Equity trading revenues increased
11% in fiscal 1997, reflecting favorable market conditions that con-
tributed to strong customer demand and high trading volumes. The
increased revenues were primarily from trading in equity cash prod-
ucts, as the strong rates of return generated by many global equity
markets contributed to higher customer trading volumes and the con-
tinuance of high levels of cash inflows into mutual funds. Revenues
also benefited from the strong performance of many foreign equity
markets, particularly in Europe, which led to higher trading volumes
as U.S. investors sought to increase their positions in these markets.
Fixed income trading revenues decreased 62% in fis-
cal 1998, reflecting significantly lower revenues from investment
grade, high-yield and securitized fixed income securities. Revenues
from investment grade fixed income securities were adversely
affected by the severe economic and financial turmoil in the Far East,
Russia and emerging markets that occurred during the year. These
difficult conditions caused investor preferences to shift toward
higher quality financial instruments, principally to U.S. treasury secu-
rities. This negatively affected the trading of credit-sensitive fixed
income securities by widening credit spreads, reducing market liq-
uidity and de-coupling the historical price relationships between
credit-sensitive securities and government securities. Revenues
from high-yield fixed income securities also were impacted by the
turbulent conditions in the global financial markets due to investors’
concerns about the impact of a prolonged economic downturn on
high-yield issuers. Revenues from securitized fixed income securi-
ties also declined, as the relatively low interest rate environment in
the U.S. increased prepayment concerns and resulted in increased
spreads. Fixed income trading revenues increased 1% in fiscal
1997. Revenues from trading in fixed income products were posi-
tively affected by high levels of customer trading volumes, a large
amount of new debt issuances and increased demand for credit-
sensitive fixed income products. Revenues from trading in high-yield
debt securities and fixed income derivative products were particu-
larly favorably impacted by these developments. Securitized debt trad-
ing revenues also increased, as the Company continued to focus on
this market segment by expanding its level of activity in several key
areas. Trading revenues benefited from higher revenues from trad-
ing in commercial whole loans and mortgage swaps, coupled with
increased securitization volumes and innovative structures. These
increases were offset by lower revenues from trading in government
and investment grade corporate securities.
Revenues from foreign exchange trading increased
17% to record levels in fiscal 1998. The increase was primarily attrib-
utable to high levels of customer trading volume and volatility in the
foreign exchange markets. During fiscal 1998, the U.S. dollar fluc-
tuated against major currencies due to concerns about the U.S.
economy’s exposure to the financial crises in the Far East and emerg-
ing markets, as well as from the Federal Reserve Board’s decision to
lower the overnight lending rate on three occasions during the fourth
* TWENTY-NINE *
MORGAN STANLEY DEAN WITTER * 1998 ANNUAL REPORT
quarter. Certain European currencies also experienced periods of
volatility, resulting from expectations of interest rate fluctuations in
anticipation of EMU and the collapse of the Russian ruble. Difficult
political and economic conditions in certain Asian nations, coupled
with the continued recession in Japan, also contributed to periods of
high volatility in the currency markets. Foreign exchange trading rev-
enues increased 196% in fiscal 1997, primarily resulting from the
Company’s increased client market share and from high levels of
volatility in the foreign exchange markets. During fiscal 1997, the U.S.
dollar appreciated against many currencies throughout the year due
to the strong growth of the U.S. economy and continued low levels
of inflation. In addition, many European currencies experienced
periods of increased volatility due to uncertainty regarding the tim-
ing of EMU and the strength of the euro, while the performance of
the yen was affected by sluggish economic growth in Japan. Other
Asian currencies were particularly volatile during the latter half of fis-
cal 1997, primarily due to the depreciation of certain currencies,
including Thailand’s baht. Higher trading volumes and an increasing
customer base also contributed to the increase in revenues.
Commodities trading revenues were comparable to
prior-year levels, as higher revenues from crude oil, refined energy
products and electricity were partially offset by lower revenues from
natural gas trading. Revenues from trading crude oil and refined
energy products were impacted by energy prices that fell during much
of fiscal 1998. Diminished demand for these products, partially due
to the ongoing economic crisis in the Far East, coupled with high
inventory levels, contributed to the decline in prices. Electricity
trading revenues benefited from higher electricity prices, primarily
during the summer months when the demand for electric power
increased. The Company’s continued presence in the electricity
market and the ongoing deregulation of the industry also had a favor-
able impact on electricity trading revenues. Revenues from natural
gas trading decreased as unseasonably warm weather in certain
regions of the U.S. during the winter months reduced the demand
for home heating oil, leading to a decline in prices. Commodities trad-
ing revenues increased 42% and reached record levels in fiscal 1997,
benefiting from higher revenues from trading in energy products,
including the Company’s increased presence in the electricity mar-
kets, precious metals and natural gas. Volatility in these products
was high during most of the year due to fluctuating levels of customer
demand and inventory. In both fiscal 1998 and fiscal 1997, com-
modities trading revenues benefited from the expansion of the cus-
tomer base for commodity-related products, including derivatives,
and the use of such products for risk management purposes.
Principal transaction investment revenues aggregating
$89 million were recognized in fiscal 1998 as compared with $463
million in fiscal 1997. Fiscal 1998 revenues reflected the second
highest level of revenues from the Company’s private equity business,
which primarily resulted from gains on certain positions that were
sold during the year and increases in the carrying value of certain
of the Company’s private equity investments. Such increases included
gains from the initial public offering of Equant and gains from the
sale of positions in Fort James Corporation and Jefferson Smurfit
Corporation. These gains were substantially offset by losses from an
institutional leveraged emerging markets debt portfolio that occurred
during the third quarter. Fiscal 1997 revenues primarily reflect
increases in the carrying value of certain of the Company’s private
equity investments, including an increase related to the Company’s
holdings of Fort James Corporation, as well as realized gains on cer-
tain positions that were sold during the year. Higher revenues from
certain real estate and venture capital investment gains also con-
tributed to fiscal 1997’s revenues.
Commissions
Commission revenues primarily arise from agency transactions in
listed and over-the-counter equity securities and sales of mutual
funds, futures, insurance products and options. Commission revenues
increased 13% in fiscal 1998, reflecting higher revenues from
equity cash products, primarily from markets in the U.S. and Europe,
as well as higher revenues from derivative products. Revenues from
U.S. markets benefited from high levels of market volatility, which
contributed to increased customer trading volumes. Revenues from
European markets also benefited from strong customer trading
volumes, which were positively impacted by the generally favorable
performances of certain European equity markets and from the
Company’s increased sales and research activities in the region.
Commissions on derivative products increased as the high levels of
market volatility contributed to increased customer hedging activi-
ties and trading volumes. Higher commissions from the sale of
mutual funds and the Company’s addition of more than 1,000
financial advisors during fiscal 1998 also contributed to the increase.
Commission revenues increased 16% in fiscal 1997, primarily
reflecting high customer trading volumes, particularly in the third
and fourth fiscal quarters when the New York Stock Exchange expe-
* THIRTY *
MORGAN STANLEY DEAN WITTER * 1998 ANNUAL REPORT

rienced some of the highest trading volume in its history. The strong
returns posted by many global equity markets encouraged an
increased investor demand for equity securities and resulted in
high levels of cash inflows into mutual funds. Commission rev-
enues also benefited from an increase in the Company’s market share
and from the continued strength in the market for equity issuances.
Net Interest
Interest and dividend revenues and interest expense are a function of
the level and mix of total assets and liabilities, including financial
instruments owned, reverse repurchase and repurchase agreements,
trading strategies associated with the Company’s institutional secu-
rities activities, customer margin loans and the prevailing level, term
structure and volatility of interest rates. Interest and dividend revenues
and interest expense should be viewed in the broader context of prin-
cipal trading results. Decisions relating to principal transactions in secu-
rities are based on an overall review of aggregate revenues and costs
associated with each transaction or series of transactions. This review
includes an assessment of the potential gain or loss associated with
a trade; the interest income or expense associated with financing or
hedging the Company’s positions; and potential underwriting, com-
mission or other revenues associated with related primary or secondary
market sales. Net interest revenues increased 43% in fiscal 1998, pri-
marily attributable to higher levels of revenues from net interest earn-
ing assets, including financial instruments owned and customer
margin receivable balances. Higher levels of securities lending trans-
actions also had a positive impact on net interest revenues. Net
interest revenues increased 23% in fiscal 1997, reflecting higher levels
of trading activities and retail customer financing activity, including
margin interest. In fiscal 1997, net interest revenues also reflected
increased financing costs associated with higher average levels of bal-
ance sheet usage, particularly in equity-related businesses.
Asset Management, Distribution and Administration Fees
Asset management, distribution and administration fees include rev-
enues from asset management services, including fund management
fees which are received for investment management and for pro-
moting and distributing mutual funds (“12b-1 fees”), other admin-
istrative fees and non-interest revenues earned from correspondent
clearing and custody services. Fund management fees arise from
investment management services the Company provides to registered
investment companies (the “Funds”) pursuant to various contrac-
tual arrangements. The Company receives management fees based
upon each Fund’s average daily net assets. The Company receives
12b-1 fees for services it provides in promoting and distributing cer-
tain open-ended Funds. These fees are based on either the average
daily Fund net asset balances or average daily aggregate net Fund
sales and are affected by changes in the overall level and mix of assets
under management and administration. The Company also receives
fees from investment management services provided to segregated
customer accounts pursuant to various contractual arrangements.
Asset management, distribution and administration
fees were as follows:
FISCAL fiscal fiscal(dollars in millions) 1998 1997 1996
Asset management, distribution and administration fees $2,848 $2,505 $1,732
The Company’s customer assets under management or supervision
were as follows:
FISCAL fiscal fiscal(dollars in billions) 1998 1997 1996
Customer assets under management or supervision
(at fiscal year-end) $376 $338 $278
In fiscal 1998, asset management, distribution and administration
fees increased 14%, reflecting the Company’s continuing strategic
emphasis on the asset management business. The increase in rev-
enues primarily reflects higher fund management and 12b-1 fees as
well as other revenues resulting from a higher level of assets under
management or supervision, including revenues from developed
country global equity and fixed income products. Such increases were
partially offset by the impact of market depreciation in certain of the
Company’s products resulting from the downturn in certain global
financial markets which occurred during the latter half of the year.
Fiscal 1998’s revenues also were negatively impacted by the
Company’s sale of its Correspondent Clearing and Global Custody
businesses which occurred during fiscal 1998. In fiscal 1997,
asset management, distribution and administration fees increased
45%. This increase reflects revenues from VK, which was acquired
by the Company on October 31, 1996. Fiscal 1997 revenues also
benefited from higher levels of fund management fees and increased
* THIRTY-ONE *
MORGAN STANLEY DEAN WITTER * 1998 ANNUAL REPORT

revenues from international equity, emerging market, and U.S.
domestic equity and fixed income products and continued growth
in customer assets under management or supervision. Revenues also
were positively impacted by the Company’s acquisition of the insti-
tutional global custody business of Barclays Bank PLC (“Barclays”)
on April 3, 1997.
As of November 30, 1998, assets under manage-
ment or supervision increased $38 billion from fiscal year-end
1997. The increase in assets under management or supervision in
both fiscal 1998 and fiscal 1997 reflected continued inflows of cus-
tomer assets as well as appreciation in the value of customer port-
folios. In both fiscal 1998 and fiscal 1997, approximately 50% of
the increase in assets under management or supervision was attrib-
utable to the acquisition of net new assets, while the remaining 50%
reflected market appreciation.
Non-Interest Expenses
FISCAL fiscal fiscal(dollars in millions) 1998 1997 1996
Compensation and benefits $6,071 $5,475 $4,585Occupancy and equipment 510 462 432Brokerage, clearing and
exchange fees 538 448 317Information processing and
communications 666 602 514Marketing and business
development 487 393 296Professional services 579 378 282Other 529 511 382
Total non-interest expenses $9,380 $8,269 $6,808
Fiscal 1998’s total non-interest expenses increased 13% to $9,380
million. Within the non-interest expense category, employee com-
pensation and benefits expense increased 11%, reflecting increased
levels of incentive compensation based on record fiscal 1998 rev-
enues and earnings, as well as an increase in the number of employ-
ees. Excluding compensation and benefits expense, non-interest
expenses increased $515 million. Occupancy and equipment expense
increased 10%, principally reflecting additional office space and
higher occupancy costs in New York and Hong Kong, as well as incre-
mental rent attributable to the opening of 27 securities branch
locations. Brokerage, clearing and exchange fees increased 20%, pri-
marily reflecting increased expenses related to higher levels of trad-
ing volume in the global securities markets. Commissions paid in
connection with the Company’s launch of The Van Kampen Senior
Income Trust mutual fund also contributed to the increase. Information
processing and communications costs increased 11% due to higher
data services and communications costs related to an increased
number of employees and continued enhancements and mainte-
nance associated with the Company’s information technology infra-
structure. Marketing and business development expense increased
24%, reflecting higher travel and entertainment costs relating to
increased levels of business activity associated with active financial
markets. Higher advertising and promotional costs also contributed
to the increase. Professional services expense increased 53%, pri-
marily reflecting higher consulting costs as a result of certain infor-
mation technology initiatives, including the Company’s preparations
for EMU and Year 2000 (see also “Year 2000 and EMU” herein).
Higher levels of temporary staff and employment fees due to the
increased level of overall business activity also contributed to the
increase. Other expenses increased 4%, which reflects the impact of
a higher level of business activity on various operating expenses.
Fiscal 1997’s total non-interest expenses increased
21% to $8,269 million. Within the non-interest expense category,
employee compensation and benefits expense increased 19%,
reflecting increased levels of incentive compensation based on
then-record fiscal 1997 revenues and earnings. Excluding com-
pensation and benefits expense, non-interest expenses increased
$571 million, including $266 million of operating costs related to
VK and the global institutional custody business of Barclays.
Occupancy and equipment expense increased 7%, principally reflect-
ing the occupancy costs of VK and increased office space in London
and Hong Kong. Brokerage, clearing and exchange fees increased
41%, primarily reflecting the acquisitions of VK and the institutional
global custody business of Barclays, as well as higher levels of trad-
ing volume in the global securities markets. Information processing
and communications costs increased 17% due to higher data ser-
vices costs related to an increased number of employees, incremental
costs related to VK and continued enhancements to the Company’s
information technology infrastructure. Marketing and business devel-
opment expense increased 33%, reflecting higher travel and enter-
tainment costs relating to increased levels of business activity
associated with active financial markets. Additional advertising
costs associated with VK’s retail mutual funds also contributed to
the increase. Professional services expense increased 34%, reflect-
ing higher consulting costs as a result of information technology ini-
* THIRTY-TWO *
MORGAN STANLEY DEAN WITTER * 1998 ANNUAL REPORT

tiatives and the increased level of overall business activity. Other
expenses increased 34%, which includes goodwill amortization of
$43 million associated with the acquisitions of VK and Barclays, as
well as the impact of a higher level of business activity on various
operating expenses.
CREDIT AND TRANSACTION SERVICES
STATEMENTS OF INCOME
FISCAL fiscal fiscal(dollars in millions) 1998 1997 1996
Fees:Merchant and cardmember $1,647 $1,704 $1,505Servicing 928 762 809
Commissions 36 27 —Asset management, distribution
and administration fees 1 — —Other 16 12 4
Total non-interest revenues 2,628 2,505 2,318Interest revenue 2,740 3,128 2,717Interest expense 995 1,173 1,032
Net interest income 1,745 1,955 1,685Provision for consumer
loan losses 1,173 1,493 1,214Net credit income 572 462 471Net revenues 3,200 2,967 2,789
Compensation and benefits 565 544 486Occupancy and equipment 73 64 61Brokerage, clearing and
exchange fees 14 12 —Information processing and
communications 474 478 482Marketing and business
development 924 786 731Professional services 98 73 52Other 216 259 286
Total non-interest expenses 2,364 2,216 2,098Gain on sale of businesses 362 — — Income before income taxes 1,198 751 691Provision for income taxes 510 283 257Net income $ 688 $ 468 $ 434
CREDIT AND TRANSACTION SERVICES
In fiscal 1998, Credit and Transaction Services net income increased
47% to $688 million, including a net after-tax gain of $163 mil-
lion related to the sale of the Company’s interest in the operations
of SPS and certain BRAVO receivables. Excluding this gain, net
income increased 12%. The increase in net income in fiscal 1998
was primarily attributable to the gain on the above-mentioned sales
and a lower provision for loan losses primarily resulting from the sale
of Prime Option and the operations of SPS. This increase was par-
tially offset by increases in marketing and business development
expense and incremental taxes associated with the sale of the oper-
ations of SPS. In fiscal 1997, net income increased 8% to $468
million. Fiscal 1997 net income was positively impacted by higher
average levels of consumer loans, credit card fees and interest rev-
enue enhancements introduced in fiscal 1996 and higher general
purpose credit card transaction volume, partially offset by increased
consumer credit losses and higher non-interest expenses.
The sale of Prime Option, the operations of SPS and
certain BRAVO receivables reflect the Company’s strategic deci-
sion to focus on the growth of its existing Discover Card brand and
Discover/NOVUS Network. Reflecting this renewed focus, the
Company introduced the Discover® Platinum Card in December
1998 and plans to launch the Discover Card in a major foreign mar-
ket during fiscal 1999.
As a result of enhancements made to certain of the
Company’s operating systems in the fourth quarter of fiscal 1997,
the Company began recording charged-off cardmember fees and inter-
est revenue directly against the income statement line items to
which they were originally recorded. Prior to the enhancements,
charged-off cardmember fees and interest revenue both were recorded
as a reduction of interest revenue. While this change had no impact
on net revenues, the Company believes the revised presentation bet-
ter reflects the manner in which charge-offs affect the Credit and
Transaction Services statements of income. However, since prior peri-
ods have not been restated to reflect this change, the comparabil-
ity of merchant and cardmember fees and interest revenue between
fiscal 1998 and fiscal 1997 has been affected. Accordingly, the fol-
lowing sections also will discuss the changes in these income state-
ment categories excluding the impact of this reclassification.
Credit and Transaction Services statistical data were as follows:
FISCAL fiscal fiscal(dollars in billions) 1998 1997 1996
Consumer loans at fiscal year-end:Owned $16.0 $20.9 $22.1Managed $32.5 $36.0 $35.3
General Purpose Credit Card transaction volume $58.0 $55.8 $53.6
* THIRTY-THREE *
MORGAN STANLEY DEAN WITTER * 1998 ANNUAL REPORT

The lower level of consumer loans at November 30, 1998 reflects
the Company’s sale of Prime Option, the operations of SPS and cer-
tain BRAVO receivables during fiscal 1998.
Merchant and Cardmember Fees
Merchant and cardmember fees include revenues from fees charged
to merchants on credit card sales, late payment fees, overlimit fees,
insurance fees, cash advance fees, and fees for the administration
of credit card programs and transaction processing services.
Merchant and cardmember fees decreased 3% in fis-
cal 1998 and increased 13% in fiscal 1997. Excluding the effect
of the reclassification of charged-off cardmember fees discussed
above, merchant and cardmember fees would have increased 2% in
fiscal 1998. This increase in fiscal 1998 was attributable to higher
merchant discount revenue primarily associated with increased
growth of general purpose credit card transaction volume related to
the Discover Card offset by lower revenues due to the sale of the oper-
ations of SPS in October 1998. In addition, merchant and card-
member fees benefited from higher overlimit and late fees attributable
to a fee increase introduced during fiscal 1998 and an increase in
occurrences of delinquent and overlimit accounts. Partially offsetting
these increases was a decrease in cash advance fees as a result of
lower cash advance transaction volume primarily attributable to lim-
its on cash advances imposed by the Company in an effort to improve
credit quality. The increase in fiscal 1997 was due to an increase in
merchant discount revenue associated with increased growth of gen-
eral purpose credit card transaction volume and increased late pay-
ment fees and overlimit fees. The increase in overlimit fees was due
to a higher incidence of overlimit occurrences. The increase in late
payment fee revenues was due to an increase in the incidence of late
payments and higher levels of delinquent accounts.
Servicing Fees
Servicing fees are revenues derived from consumer loans which
have been sold to investors through asset securitizations. Cash
flows from the interest yield and cardmember fees generated by secu-
ritized loans are used to pay investors in these loans a predetermined
fixed or floating rate of return on their investment, to reimburse the
investors for losses of principal resulting from charged-off loans and
to pay the Company a fee for servicing the loans. Any excess cash
flows remaining are paid to the Company. The servicing fees and
excess net cash flows paid to the Company are reported as servic-
ing fees in the consolidated statements of income. The sale of con-
sumer loans through asset securitizations therefore has the effect of
converting portions of net credit income and fee income to servic-
ing fees. The Company completed asset securitizations of $4.5 bil-
lion in fiscal 1998 and $2.8 billion in fiscal 1997. The asset
securitizations in fiscal 1998 and 1997 have expected maturities
ranging from three to 10 years from the date of issuance.
The table below presents the components of servicing fees:
FISCAL fiscal fiscal(dollars in millions) 1998 1997 1996
Merchant and cardmember fees $ 505 $ 436 $ 307Interest revenue 2,598 2,116 2,025Interest expense (1,010) (829) (792)Provision for consumer
loan losses (1,165) (961) (731)Servicing fees $ 928 $ 762 $ 809
Servicing fees are affected by the level of securitized loans, the spread
between the interest yield on the securitized loans and the yield paid
to the investors, the rate of credit losses on securitized loans and
the level of cardmember fees earned from securitized loans. Servicing
fees also include the effects of interest rate contracts entered into
by the Company as part of its interest rate risk management program.
Servicing fees increased 22% in fiscal 1998 and decreased 6% in
fiscal 1997. The increase in fiscal 1998 was due to higher levels
of net interest cash flows and increased fee revenue, partially off-
set by increased credit losses from securitized consumer loans
which were primarily a result of higher levels of average securitized
loans. The decline in fiscal 1997 servicing fees was attributable to
higher credit losses, partially offset by higher cardmember fees and
net interest revenues.
Commission Revenues
Commission revenues arise from customer securities transactions
associated with Discover Brokerage Direct, Inc. (“DBD”), the
Company’s provider of electronic brokerage services acquired in
January 1997. Commission revenues increased 33% in fiscal 1998
resulting from an increase in the level of customer trading activity,
partially offset by lower revenue per trade due to an increase in
Internet trades as a percentage of total trades. In addition, fiscal
1998 contained a full year of commissions for DBD, while fiscal 1997
reflected only 10 months.
* THIRTY-FOUR *
MORGAN STANLEY DEAN WITTER * 1998 ANNUAL REPORT

Asset Management, Distribution and Administration Fees
Asset management, distribution and administration fees include rev-
enues from asset management services, including fund management
fees which are received by DBD for promoting and distributing
mutual funds.
Net Interest Income
Net interest income is equal to the difference between interest rev-
enue derived from Credit and Transaction Services consumer loans
and short-term investment assets and interest expense incurred to
finance those assets. Credit and Transaction Services assets, con-
sisting primarily of consumer loans, earn interest revenue at both fixed
rates and market-indexed variable rates. The Company incurs inter-
est expense at fixed and floating rates. Interest expense also includes
the effects of interest rate contracts entered into by the Company
as part of its interest rate risk management program. This program
is designed to reduce the volatility of earnings resulting from changes
in interest rates and is accomplished primarily through matched
financing, which entails matching the repricing schedules of con-
sumer loans and the related financing.
The following tables present analyses of Credit and
Transaction Services average balance sheets and interest rates in fis-
cal 1998, fiscal 1997 and fiscal 1996 and changes in net interest
income during those fiscal years:
* THIRTY-FIVE *
MORGAN STANLEY DEAN WITTER * 1998 ANNUAL REPORT
AVERAGE BALANCE SHEET ANALYSIS
FISCAL 1998 FISCAL 1997(3) FISCAL 1996(3)
AVERAGE Average Average(dollars in millions) BALANCE RATE INTEREST Balance Rate Interest Balance Rate Interest
ASSETS
Interest earning assets:General purpose credit card loans $17,184 13.87% $2,383 $19,512 14.03% $2,738 $17,083 13.99% $2,391Other consumer loans 1,374 16.70 229 1,773 15.73 279 1,766 14.25 252Investment securities 496 6.25 31 176 5.45 10 234 5.38 13Other 1,465 6.61 97 1,680 6.06 101 1,078 5.60 61
Total interest earning assets 20,519 13.35 2,740 23,141 13.52 3,128 20,161 13.47 2,717Allowance for loan losses (847) (828) (669)Non interest earning assets 1,517 1,529 1,334
Total assets $21,189 $23,842 $20,826
LIABILITIES AND SHAREHOLDERS’ EQUITY
Interest bearing liabilities:Interest bearing deposits
Savings $ 1,073 4.79% $ 51 $ 963 4.27% $ 41 $ 1,021 4.58% $ 47Brokered 5,656 6.62 375 4,589 6.66 306 3,418 6.93 237Other time 2,189 6.16 135 2,212 6.12 135 1,921 6.05 116
Total interest bearing deposits 8,918 6.29 561 7,764 6.21 482 6,360 6.29 400Other borrowings 7,162 6.06 434 11,371 6.07 691 10,307 6.11 632
Total interest bearing liabilities 16,080 6.19 995 19,135 6.13 1,173 16,667 6.18 1,032Shareholders’ equity/other liabilities 5,109 4,707 4,159
Total liabilities and shareholders’ equity $21,189 $23,842 $20,826
Net interest income $1,745 $1,955 $1,685Net interest margin(1) 8.51% 8.45% 8.36%Interest rate spread(2) 7.16% 7.39% 7.29%
(1) Net interest margin represents net interest income as a percentage of total interest earning assets.(2) Interest rate spread represents the difference between the rate on total interest earning assets and the rate on total interest bearing liabilities.(3) Certain prior-year information has been reclassified to conform to the current year’s presentation.

* THIRTY-SIX *
MORGAN STANLEY DEAN WITTER * 1998 ANNUAL REPORT
RATE/VOLUME ANALYSIS
INCREASE/(DECREASE) DUE TO CHANGES IN: 1998 vs. 1997 1997 vs. 1996(dollars in millions) VOLUME RATE TOTAL Volume Rate Total
INTEREST REVENUE
General purpose credit card loans $(327) $(28) $(355) $339 $ 8 $347Other consumer loans (63) 13 (50) 1 26 27Investment securities 17 4 21 (3) — (3)Other (12) 8 (4) 33 7 40Total interest revenue (353) (35) (388) 400 11 411
INTEREST EXPENSE
Interest bearing deposits:Savings 5 5 10 (3) (3) (6)Brokered 71 (2) 69 81 (12) 69Other time (1) 1 — 18 1 19Total interest bearing deposits 72 7 79 88 (6) 82
Other borrowings (256) (1) (257) 64 (5) 59Total interest expense (188) 10 (178) 151 (10) 141
Net interest income $(165) $(45) $(210) $249 $21 $270
Net interest income decreased 11% in fiscal 1998 and increased
16% in fiscal 1997. Excluding the effect of the reclassification of
charged-off cardmember fees discussed previously, net interest
income would have decreased 15% in fiscal 1998. The decrease in
fiscal 1998 was due to lower average levels of owned consumer loans
and a lower yield on general purpose credit card loans. The decrease
in owned consumer loans was primarily due to an increase in secu-
ritized loans and the sale of the Prime Option and SPS portfolios.
The lower yield on general purpose credit card loans in fiscal 1998
was due to a larger number of cardmembers taking advantage of pro-
motional rates. In both years, the effects of changes in interest rates
on the Company’s variable rate loan portfolio were substantially off-
set by comparable changes in the Company’s cost of funds for the
related financing. The Company believes that the effect of changes
in market interest rates on net interest income was mitigated as a
result of its liquidity and interest rate risk management policies. The
increase in net interest income in fiscal 1997 was due to higher aver-
age levels of consumer loans outstanding, partially offset by the
effects of higher charge-offs on interest revenue. The impact of higher
charge-offs in fiscal 1997 was mitigated by pricing actions imple-
mented in the fourth quarter of fiscal 1996.
The Company anticipates the repricing of a substan-
tial portion of its existing credit card receivables to a fixed interest
rate during fiscal 1999. The Company does not believe this repric-
ing will have a material impact on its interest rate sensitivity due to
the Company’s matched financing objectives.

* THIRTY-SEVEN *
MORGAN STANLEY DEAN WITTER * 1998 ANNUAL REPORT
SUPPLEMENTAL AVERAGE MANAGED LOAN INFORMATION
FISCAL 1998 FISCAL 1997 FISCAL 1996AVERAGE Average Average
(dollars in millions) BALANCE RATE Balance Rate Balance Rate
Consumer loans $34,619 14.86% $34,619 14.83% $31,459 14.83%General purpose credit card loans 32,684 14.72 32,176 14.72 29,021 14.81Total interest earning assets 36,580 14.41 36,475 14.38 32,770 14.46Total interest bearing liabilities 32,141 6.16 32,469 6.17 29,277 6.22Consumer loan interest rate spread 8.70 8.66 8.61Interest rate spread 8.25 8.21 8.24Net interest margin 9.00 8.89 8.90
Provision for Consumer Loan Losses
The provision for consumer loan losses is the amount necessary to
establish the allowance for loan losses at a level that the Company
believes is adequate to absorb estimated losses in its consumer loan
portfolio at the balance sheet date. The Company’s allowance for loan
losses is regularly evaluated by management for adequacy on a
portfolio-by-portfolio basis and was $787 million at November 30,
1998 and $884 million at November 30, 1997.
The provision for consumer loan losses, which is
affected by net charge-offs, loan volume and changes in the amount
of consumer loans estimated to be uncollectable, decreased 21% in
fiscal 1998 and increased 23% in fiscal 1997. The decrease in fis-
cal 1998 was due to a decrease in net charge-offs resulting from lower
average levels of owned consumer loans, primarily attributable to an
increased level of securitized loans and reduced levels of charge-offs
associated with the sale of Prime Option and SPS receivables, par-
tially offset by a small increase in the net charge-off rate of the
Discover Card portfolio. The provision for loan losses also was posi-
tively impacted by a decline in the loan loss allowance in connection
with securitization transactions entered into prior to the third quar-
ter of 1996. The Company expects this loan loss allowance will be
fully amortized over fiscal 1999. In fiscal 1997, the increase in con-
sumer loan losses was primarily due to higher net charge-offs, which
resulted from an increase in the percentage of consumer loans
charged off and a higher level of average consumer loans outstand-
ing. The Company’s expectations about future charge-off rates and
credit quality are subject to uncertainties that could cause actual
results to differ materially from what has been discussed above.
Factors that influence the provision for consumer loan losses include
the level and direction of consumer loan delinquencies and charge-
offs, changes in consumer spending and payment behaviors, bank-
ruptcy trends, the seasoning of the Company’s loan portfolio, interest
rate movements and their impact on consumer behavior, and the rate
and magnitude of changes in the Company’s consumer loan portfo-
lio, including the overall mix of accounts, products and loan balances
within the portfolio.
Consumer loans are considered delinquent when inter-
est or principal payments become 30 days past due. Consumer
loans are charged-off when they become 180 days past due, except
in the case of bankruptcies and fraudulent transactions, where
loans are charged-off earlier. Loan delinquencies and charge-offs are
primarily affected by changes in economic conditions and may vary
throughout the year due to seasonal consumer spending and payment
behaviors. Delinquency rates decreased in fiscal 1998 as a reflec-
tion of the Company’s increased focus on credit quality and account
collections, as well as the sale of Prime Option, SPS and BRAVO.
From time to time, the Company has offered and may
continue to offer cardmembers with accounts in good standing the
The supplemental table below provides average man-
aged loan balance and rate information which takes into account
both owned and securitized loans:
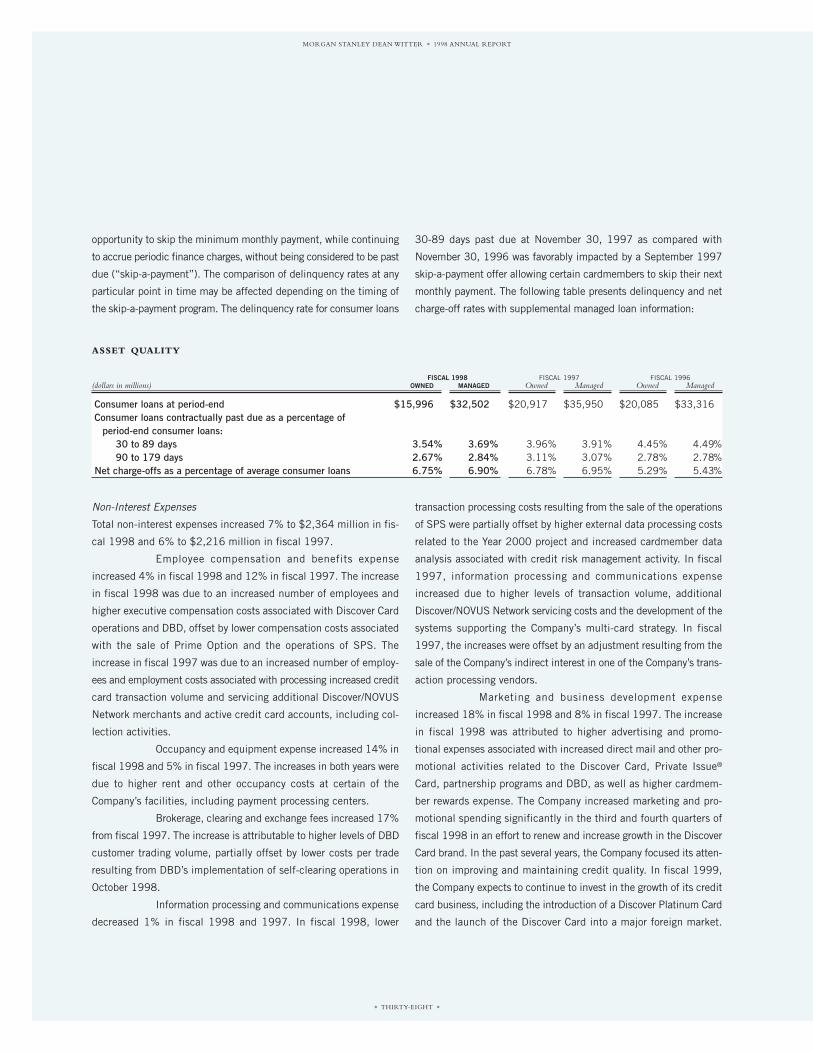
* THIRTY-EIGHT *
MORGAN STANLEY DEAN WITTER * 1998 ANNUAL REPORT
30-89 days past due at November 30, 1997 as compared with
November 30, 1996 was favorably impacted by a September 1997
skip-a-payment offer allowing certain cardmembers to skip their next
monthly payment. The following table presents delinquency and net
charge-off rates with supplemental managed loan information:
opportunity to skip the minimum monthly payment, while continuing
to accrue periodic finance charges, without being considered to be past
due (“skip-a-payment”). The comparison of delinquency rates at any
particular point in time may be affected depending on the timing of
the skip-a-payment program. The delinquency rate for consumer loans
ASSET QUALITY
FISCAL 1998 FISCAL 1997 FISCAL 1996(dollars in millions) OWNED MANAGED Owned Managed Owned Managed
Consumer loans at period-end $15,996 $32,502 $20,917 $35,950 $20,085 $33,316Consumer loans contractually past due as a percentage of
period-end consumer loans:30 to 89 days 3.54% 3.69% 3.96% 3.91% 4.45% 4.49%90 to 179 days 2.67% 2.84% 3.11% 3.07% 2.78% 2.78%
Net charge-offs as a percentage of average consumer loans 6.75% 6.90% 6.78% 6.95% 5.29% 5.43%
Non-Interest Expenses
Total non-interest expenses increased 7% to $2,364 million in fis-
cal 1998 and 6% to $2,216 million in fiscal 1997.
Employee compensation and benefits expense
increased 4% in fiscal 1998 and 12% in fiscal 1997. The increase
in fiscal 1998 was due to an increased number of employees and
higher executive compensation costs associated with Discover Card
operations and DBD, offset by lower compensation costs associated
with the sale of Prime Option and the operations of SPS. The
increase in fiscal 1997 was due to an increased number of employ-
ees and employment costs associated with processing increased credit
card transaction volume and servicing additional Discover/NOVUS
Network merchants and active credit card accounts, including col-
lection activities.
Occupancy and equipment expense increased 14% in
fiscal 1998 and 5% in fiscal 1997. The increases in both years were
due to higher rent and other occupancy costs at certain of the
Company’s facilities, including payment processing centers.
Brokerage, clearing and exchange fees increased 17%
from fiscal 1997. The increase is attributable to higher levels of DBD
customer trading volume, partially offset by lower costs per trade
resulting from DBD’s implementation of self-clearing operations in
October 1998.
Information processing and communications expense
decreased 1% in fiscal 1998 and 1997. In fiscal 1998, lower
transaction processing costs resulting from the sale of the operations
of SPS were partially offset by higher external data processing costs
related to the Year 2000 project and increased cardmember data
analysis associated with credit risk management activity. In fiscal
1997, information processing and communications expense
increased due to higher levels of transaction volume, additional
Discover/NOVUS Network servicing costs and the development of the
systems supporting the Company’s multi-card strategy. In fiscal
1997, the increases were offset by an adjustment resulting from the
sale of the Company’s indirect interest in one of the Company’s trans-
action processing vendors.
Marketing and business development expense
increased 18% in fiscal 1998 and 8% in fiscal 1997. The increase
in fiscal 1998 was attributed to higher advertising and promo-
tional expenses associated with increased direct mail and other pro-
motional activities related to the Discover Card, Private Issue®
Card, partnership programs and DBD, as well as higher cardmem-
ber rewards expense. The Company increased marketing and pro-
motional spending significantly in the third and fourth quarters of
fiscal 1998 in an effort to renew and increase growth in the Discover
Card brand. In the past several years, the Company focused its atten-
tion on improving and maintaining credit quality. In fiscal 1999,
the Company expects to continue to invest in the growth of its credit
card business, including the introduction of a Discover Platinum Card
and the launch of the Discover Card into a major foreign market.

* THIRTY-NINE *
MORGAN STANLEY DEAN WITTER * 1998 ANNUAL REPORT
The increase in fiscal 1997 was primarily attributable to higher card-
member rewards expense and marketing and promotional costs.
Higher marketing and promotional costs were associated with the
growth of new and existing credit card brands. Cardmember rewards
expense includes the Cashback Bonus® award, pursuant to which
the Company annually pays Discover Cardmembers and Private
Issue Cardmembers electing this feature a percentage of their pur-
chase amounts ranging up to 1% (up to 2% for the Private Issue
Card) based upon a cardmember’s level of annual purchases. Higher
cardmember rewards expense in both years was associated with
growth in credit card transaction volume and increased credit card-
member qualification for higher award levels. Commencing March
1, 1998, the terms of the Private Issue Cashback Bonus program
were amended by limiting the maximum annual bonus amount to
$500 and by increasing the amount of purchases required to
receive this bonus amount. Cardmember rewards expense was not
materially impacted by these changes.
Professional services expense increased 34% in fiscal
1998 and 40% in fiscal 1997. The increase in fiscal 1998 was due
to services related to increased partnership program activity, higher
expenditures for consumer credit counseling and collections services
and consulting fees. The increase in fiscal 1997 was primarily due
to higher expenditures for consumer credit counseling and collec-
tions services.
Other non-interest expenses decreased 17% in fiscal
1998 and 9% in fiscal 1997. Other expenses primarily include fraud
losses, credit inquiry fees and other administrative costs. The
decrease in both years was due to a continuing decline in the level
of fraud losses. Fiscal 1998 also reflects a lower level of expenses
resulting from the sale of Prime Option and the operations of SPS.
Seasonal Factors
The credit card lending activities of Credit and Transaction Services
are affected by seasonal patterns of retail purchasing. Historically,
a substantial percentage of credit card loan growth occurs in the
fourth calendar quarter, followed by a flattening or decline of con-
sumer loans in the following calendar quarter. Merchant fees, there-
fore, have historically tended to increase in the first fiscal quarter,
reflecting higher sales activity in the month of December. Additionally,
higher cardmember rewards expense is accrued in the first fiscal quar-
ter, reflecting seasonal growth in retail sales volume.
LIQUIDITY AND CAPITAL RESOURCES
The Balance Sheet
The Company’s total assets increased to $317.6 billion at November
30, 1998 from $302.3 billion at November 30, 1997, primarily
reflecting growth in cash and cash equivalents, cash and securities
deposited with clearing organizations or segregated under federal and
other regulations, and securities borrowed. A substantial portion of the
Company’s total assets consists of highly liquid marketable securities
and short-term receivables arising principally from securities transac-
tions. The highly liquid nature of these assets provides the Company
with flexibility in financing and managing its business.
Funding and Capital Policies
The Company’s senior management establishes the overall funding
and capital policies of the Company, reviews the Company’s perfor-
mance relative to these policies, monitors the availability of sources
of financing, reviews the foreign exchange risk of the Company, and
oversees the liquidity and interest rate sensitivity of the Company’s
asset and liability position. The primary goal of the Company’s fund-
ing and liquidity activities is to ensure adequate financing over a wide
range of potential credit ratings and market environments.
Many of the Company’s businesses are capital-inten-
sive. Capital is required to finance, among other things, the Company’s
securities inventories, underwriting, principal investments, private
equity activities, consumer loans and investments in fixed assets. As
a policy, the Company attempts to maintain sufficient capital and
funding sources in order to have the capacity to finance itself on a
fully collateralized basis at all times, including periods of financial
stress. Currently, the Company believes it has sufficient capital to meet
its needs. In addition, the Company attempts to maintain total
equity, on a consolidated basis, at least equal to the sum of all of its
subsidiaries’ equity. Subsidiary equity capital requirements are deter-
mined by regulatory requirements (if applicable), asset mix, leverage
considerations and earnings volatility.
The Company views return on equity to be an impor-
tant measure of its performance, in the context of both the partic-
ular business environment in which the Company is operating and
its peer group’s results. In this regard, the Company actively man-
ages its consolidated capital position based upon, among other

* FORTY *
MORGAN STANLEY DEAN WITTER * 1998 ANNUAL REPORT
things, business opportunities, capital availability and rates of return
together with internal capital policies, regulatory requirements and
rating agency guidelines and therefore, in the future, may expand
or contract its capital base to address the changing needs of its busi-
nesses. The Company also has returned to shareholders internally
generated equity capital which was in excess of the needs of its busi-
nesses through common stock repurchases and dividends.
The Company’s liquidity policies emphasize diversifi-
cation of funding sources. The Company also follows a funding strat-
egy which is designed to ensure that the tenor of the Company’s
liabilities equals or exceeds the expected holding period of the assets
being financed. Short-term funding generally is obtained at rates
related to U.S., Euro or Asian money market rates for the currency bor-
rowed. Repurchase transactions are effected at negotiated rates.
Other borrowing costs are negotiated depending upon prevailing mar-
ket conditions (see Notes 5 and 6 to the consolidated financial state-
ments). Maturities of both short-term and long-term financings are
designed to minimize exposure to refinancing risk in any one period.
The volume of the Company’s borrowings generally fluc-
tuates in response to changes in the amount of repurchase transactions
outstanding, the level of the Company’s securities inventories and
consumer loans receivable, and overall market conditions. Availability
and cost of financing to the Company can vary depending upon mar-
ket conditions, the volume of certain trading activities, the Company’s
credit ratings and the overall availability of credit. The Company,
therefore, maintains a surplus of unused short-term funding sources
at all times to withstand any unforeseen contraction in credit capac-
ity. In addition, the Company attempts to maintain cash and unhy-
pothecated marketable securities equal to at least 110% of its
outstanding short-term unsecured borrowings. The Company has in
place a contingency funding strategy, which provides a comprehensive
one-year action plan in the event of a severe funding disruption.
The Company views long-term debt as a stable source
of funding for core inventories, consumer loans and illiquid assets and,
therefore, maintains a long-term debt-to-capitalization ratio at a
level appropriate for the current composition of its balance sheet. In
general, fixed assets are financed with fixed rate long-term debt, and
securities inventories and all current assets are financed with a com-
bination of short-term funding, floating rate long-term debt or fixed
rate long-term debt swapped to a floating basis. Both fixed rate and
floating rate long-term debt (in addition to sources of funds accessed
directly by the Company’s Credit and Transaction Services business)
are used to finance the Company’s consumer loan portfolio. Consumer
loan financing is targeted to match the repricing and duration char-
acteristics of the loans financed. The Company uses derivative prod-
ucts (primarily interest rate, currency and equity swaps) to assist in
asset and liability management, reduce borrowing costs and hedge
interest rate risk (see Note 6 to the consolidated financial statements).
The Company’s reliance on external sources to finance
a significant portion of its day-to-day operations makes access to global
sources of financing important. The cost and availability of unsecured
financing generally are dependent on the Company’s short-term and
long-term debt ratings. In addition, the Company’s debt ratings can
have a significant impact on certain trading revenues, particularly in
those businesses where longer term counterparty performance is
critical, such as over-the-counter derivative transactions.
As of January 31, 1999, the Company’s credit ratings
were as follows:Commercial Senior
Paper Debt
Dominion Bond Rating Service R-1 n/aDuff & Phelps Credit Rating Co. D-1+ AAFitch IBCA, Inc. F1+ AA–Japan Rating & Investment Information, Inc. A-1+ AA–Moody’s Investors Service P-1 Aa3Standard & Poor’s A-1 A+Thomson BankWatch, Inc. TBW-1 AA
During fiscal 1998, Moody’s Investors Service upgraded the
Company’s senior debt rating from A1 to Aa3. In January 1999, Duff
& Phelps Credit Rating Co. upgraded the Company’s senior debt rat-
ing from AA– to AA.
As the Company continues its global expansion and
derives revenues increasingly from various currencies, foreign cur-
rency management is a key element of the Company’s financial poli-
cies. The Company benefits from operating in several different
currencies because weakness in any particular currency often is off-
set by strength in another currency. The Company closely monitors
its exposure to fluctuations in currencies and, where cost-justified,
adopts strategies to reduce the impact of these fluctuations on the
Company’s financial performance. These strategies include engag-
* FORTY-ONE *
MORGAN STANLEY DEAN WITTER * 1998 ANNUAL REPORT
ing in various hedging activities to manage income and cash flows
denominated in foreign currencies and using foreign currency bor-
rowings, when appropriate, to finance investments outside the U.S.
Principal Sources of Funding
The Company funds its balance sheet on a global basis. The
Company’s funding for its Securities and Asset Management business
is raised through diverse sources. These sources include the
Company’s capital, including equity and long-term debt; repurchase
agreements; U.S., Canadian, Euro and Japanese commercial paper;
letters of credit; unsecured bond borrows; securities lending; buy/sell
agreements; municipal reinvestments; master notes; and committed
and uncommitted lines of credit. Repurchase agreement transactions,
securities lending and a portion of the Company’s bank borrowings
are made on a collateralized basis and therefore provide a more sta-
ble source of funding than short-term unsecured borrowings.
The funding sources utilized for the Company’s Credit
and Transaction Services business include the Company’s capital,
including equity and long-term debt, asset securitizations, commercial
paper, deposits, asset-backed commercial paper, Federal Funds
and short-term bank notes. The Company sells consumer loans
through asset securitizations using several transaction structures.
Riverwoods Funding Corporation (“RFC”), an entity included in the
consolidated financial statements of the Company, issues asset-
backed commercial paper.
The Company’s bank subsidiaries solicit deposits from
consumers, purchase Federal Funds and issue short-term bank
notes. Interest bearing deposits are classified by type as savings, bro-
kered and other time deposits. Savings deposits consist primarily of
money market deposits and certificate of deposit accounts sold
directly to cardmembers and savings deposits from individual clients.
Brokered deposits consist primarily of certificates of deposit issued
by the Company’s bank subsidiaries. Other time deposits include insti-
tutional certificates of deposit. The Company, through Greenwood
Trust Company, an indirect subsidiary of the Company, sells notes
under a short-term bank note program.
The Company maintains borrowing relationships with
a broad range of banks, financial institutions, counterparties and oth-
ers from which it draws funds in a variety of currencies.
The Company maintains a senior revolving credit
agreement with a group of banks to support general liquidity needs,
including the issuance of commercial paper (the “MSDW Facility”).
Under the terms of the MSDW Facility, the banks are committed to
provide up to $6.0 billion. The MSDW Facility contains restrictive
covenants which require, among other things, that the Company main-
tain shareholders’ equity of at least $9.1 billion at all times. The
Company believes that the covenant restrictions will not impair the
Company’s ability to pay its current level of dividends. At November
30, 1998, no borrowings were outstanding under the MSDW Facility.
The Company maintains a master collateral facility
that enables Morgan Stanley & Co. Incorporated (“MS&Co.”), one of
the Company’s U.S. broker-dealer subsidiaries, to pledge certain col-
lateral to secure loan arrangements, letters of credit and other finan-
cial accommodations (the “MS&Co. Facility”). As part of the MS&Co.
Facility, MS&Co. also maintains a secured committed credit agreement
with a group of banks that are parties to the master collateral facility
under which such banks are committed to provide up to $1.875 bil-
lion. The credit agreement contains restrictive covenants which
require, among other things, that MS&Co. maintain specified levels
of consolidated shareholders’ equity and Net Capital, as defined. In
January 1999, the MS&Co. Facility was renewed. At November 30,
1998, no borrowings were outstanding under the MS&Co. Facility.
The Company also maintains a revolving committed
financing facility that enables Morgan Stanley & Co. International
Limited (“MSIL”), the Company’s London-based broker-dealer sub-
sidiary, to secure committed funding from a syndicate of banks by
providing a broad range of collateral under repurchase agreements
(the “MSIL Facility”). Such banks are committed to provide up to
an aggregate of $1.85 billion available in 12 major currencies and,
effective January 1, 1999, the euro. The facility agreements con-
tain restrictive covenants which require, among other things, that
MSIL maintain specified levels of Shareholders’ Equity and Financial
Resources, each as defined. At November 30, 1998, no borrowings
were outstanding under the MSIL Facility.
RFC maintains a senior bank credit facility to support
the issuance of asset-backed commercial paper in the amount of $2.6
billion. Under the terms of the asset-backed commercial paper pro-
gram, certain assets of RFC were subject to a lien in the amount of

* FORTY-TWO *
MORGAN STANLEY DEAN WITTER * 1998 ANNUAL REPORT
$2.6 billion at November 30, 1998. RFC has never borrowed from
its senior bank credit facility.
The Company anticipates that it will utilize the
MSDW Facility, the MS&Co. Facility or the MSIL Facility for short-
term funding from time to time (see Note 5 to the consolidated finan-
cial statements).
Fiscal 1998 and Subsequent Activity
During fiscal 1998, the Company took several steps to extend the matu-
rity of its liabilities, reduce its reliance on unsecured short-term fund-
ing and increase its capital. These steps contributed to a net increase
in capital of $4,345 million to $37,922 million at November 30, 1998.
During fiscal 1998, the Company issued senior notes
aggregating $9,800 million, including non-U.S. dollar currency
notes aggregating $1,640 million, primarily pursuant to its public
debt shelf registration statements. These notes have maturities
from 1999 to 2028 and a weighted average coupon interest rate of
5.6% at November 30, 1998; the Company has entered into cer-
tain transactions to obtain floating interest rates based primarily on
short-term LIBOR trading levels. At November 30, 1998, the aggre-
gate outstanding principal amount of the Company’s Senior
Indebtedness (as defined in the Company’s public debt shelf regis-
tration statements) was approximately $45.3 billion. Between
November 30, 1998 and January 31, 1999, the Company issued
additional debt obligations aggregating approximately $2,298 mil-
lion. These notes have maturities from 2000 to 2013.
Effective January 1999, the Company’s Board of
Directors authorized the Company to purchase, subject to market con-
ditions and certain other factors, up to $1 billion of the Company’s
common stock. The Board of Directors also approved a separate ongo-
ing repurchase authorization in connection with awards granted
under the Company’s equity-based compensation plans. During fis-
cal 1998, the Company purchased $2,925 million of its common
stock. Subsequent to November 30, 1998 and through January
31, 1999, the Company purchased an additional $110 million of
its common stock.
On March 5, 1998, MSDW Capital Trust I, a Delaware
statutory business trust (the “Capital Trust”), all of the common secu-
rities of which are owned by the Company, issued $400 million of
7.10% Capital Securities (the “Capital Securities”) that are guar-
anteed by the Company. The Capital Trust issued the Capital
Securities and invested the proceeds in 7.10% Junior Subordinated
Deferrable Interest Debentures issued by the Company, which are due
February 28, 2038.
On March 12, 1998, the Company’s shelf registration
statement for an additional $8 billion of debt securities, warrants,
preferred stock or purchase contracts, or any combination thereof
in the form of units, became effective.
On August 31, 1998, the Company redeemed all
1,000,000 outstanding shares of its 7-3/8% Cumulative Preferred
Stock at a redemption price of $200 per share. The Company also
simultaneously redeemed all corresponding Depositary Shares at a
redemption price of $25 per Depositary Share. Each Depositary Share
represented 1/8 of a share of the Company’s 7-3/8% Cumulative
Preferred Stock.
On January 28, 1999, the Company and Morgan
Stanley Finance, plc, a U.K. subsidiary, called for redemption all of
the outstanding 7.82% Capital Units and 7.80% Capital Units on
February 28, 1999. The aggregate principal amount of the Capital
Units to be redeemed is $352 million.
At November 30, 1998, certain assets of the Company,
such as real property, equipment and leasehold improvements of $1.8
billion, and goodwill and other intangible assets of $1.2 billion, were
illiquid. In addition, certain equity investments made in connection
with the Company’s private equity and other principal investment
activities, high-yield debt securities, emerging market debt, and cer-
tain collateralized mortgage obligations and mortgage-related loan
products are not highly liquid.
In connection with its private equity and other principal
investment activities, the Company has equity investments (directly
or indirectly through funds managed by the Company) in privately
and publicly held companies. As of November 30, 1998, the aggre-
gate carrying value of the Company’s equity investments in pri-
vately held companies (including direct investments and partnership
interests) was $185 million, and its aggregate investment in pub-
licly held companies was $320 million.
The Company acts as an underwriter of and as a mar-
ket-maker in mortgage-backed pass-through securities, collateralized
mortgage obligations and related instruments and as a market-
maker in commercial, residential and real estate loan products. In
this capacity, the Company takes positions in market segments in
which liquidity can vary greatly from time to time. The carrying value

* FORTY-THREE *
MORGAN STANLEY DEAN WITTER * 1998 ANNUAL REPORT
of the portion of the Company’s mortgage-related portfolio at
November 30, 1998 traded in markets that the Company believed
were experiencing lower levels of liquidity than traditional mortgage-
backed pass-through securities approximated $1,369 million.
In addition, at November 30, 1998, the aggregate
value of high-yield debt securities and emerging market loans and secu-
ritized instruments held in inventory was $2,395 million (a substan-
tial portion of which was subordinated debt). These securities, loans
and instruments were not attributable to more than 6% to any one
issuer, 22% to any one industry or 18% to any one geographic region.
Non-investment grade securities generally involve greater risk than
investment grade securities due to the lower credit ratings of the
issuers, which typically have relatively high levels of indebtedness and,
therefore, are more sensitive to adverse economic conditions. In addi-
tion, the market for non-investment grade securities and emerging mar-
ket loans and securitized instruments has been, and may in the
future be, characterized by periods of volatility and illiquidity. The
Company has in place credit and other risk policies and procedures
to control total inventory positions and risk concentrations for non-
investment grade securities and emerging market loans and securi-
tized instruments that are administered in a manner consistent with
the Company’s overall risk management policies and procedures (see
“Risk Management” following “Management’s Discussion and Analysis
of Financial Condition and Results of Operations”).
The Company also has commitments to fund certain
fixed assets and other less liquid investments, including at November
30, 1998 approximately $181 million in connection with its private
equity and other principal investment activities. Additionally, the
Company has provided and will continue to provide financing,
including margin lending and other extensions of credit to clients.
In November 1998, the Company announced that it
had entered into an agreement that will result in the development
of an office tower in New York City. Pursuant to this agreement, the
Company has entered into a 99-year lease for the land at the pro-
posed development site.
The Company may, from time to time, also provide
financing or financing commitments to companies in connection with
its investment banking and private equity activities. The Company
may provide extensions of credit to leveraged companies in the
form of senior or subordinated debt, as well as bridge financing on
a selective basis. At November 30, 1998, the Company had two com-
mitments to provide an aggregate of $82 million and had one loan
in the amount of $8 million outstanding in connection with its
high-yield underwriting activities. Between November 30, 1998 and
January 31, 1999, the Company’s aggregate commitments increased
to $89 million and had two loans in the amount of $112 million
outstanding.
In September 1998, the Company made an investment
of $300 million in the Long-Term Capital Portfolio, L.P. (“LTCP”). The
Company is a member of a consortium of 14 financial institutions par-
ticipating in an equity recapitalization of LTCP. The objectives of this
investment, the term of which is three years, are to continue active
management of its positions and, over time, reduce excessive risk
exposures and leverage, return capital to the participants and ulti-
mately realize the potential value of the LTCP portfolio. At November
30, 1998, the carrying value of the Company’s investment in LTCP
approximated fair value.
The Company also engages in senior lending activities,
including origination, syndication and trading of senior secured
loans of non-investment grade companies. Such companies are
more sensitive to adverse economic conditions than investment
grade issuers, but the loans generally are made on a secured basis
and are senior to the non-investment grade securities of these
issuers that trade in the capital markets. At November 30, 1998,
the aggregate value of senior secured loans and positions held by the
Company was $1,259 million, and aggregate senior secured loan
commitments were $447 million.
The gross notional and fair value amounts of deriva-
tives used by the Company for asset and liability management and
as part of its trading activities are summarized in Notes 6 and 9,
respectively, to the consolidated financial statements (see also
“Derivative Financial Instruments” herein).
YEAR 2000 AND EMU
Year 2000 Readiness Disclosure
Many of the world’s computer systems (including those in non-
information technology equipment and systems) currently record years
in a two-digit format. If not addressed, such computer systems may
be unable to properly interpret dates beyond the year 1999, which
could lead to business disruptions in the U.S. and internationally (the
“Year 2000” issue). The potential costs and uncertainties associ-
ated with the Year 2000 issue will depend on a number of factors,

* FORTY-FOUR *
MORGAN STANLEY DEAN WITTER * 1998 ANNUAL REPORT
including software, hardware and the nature of the industry in which
a company operates. Additionally, companies must coordinate with
other entities with which they electronically interact.
The Company has established a firm-wide initiative to
address issues associated with the Year 2000. Each of the Company’s
business areas has taken responsibility for the identification and
remediation of Year 2000 issues within its own areas of operations and
for addressing all interdependencies. A corporate team of internal and
external professionals supports the business teams by providing direc-
tion and company-wide coordination as needed. The Year 2000 and
EMU (discussed below) projects have been designated as the high-
est priority activities of the Company’s Information Technology
Department. To ensure that the Company’s computer systems are Year
2000 compliant, a team of Information Technology professionals
began preparing for the Year 2000 issue in 1995. Since then, the
Company has been reviewing its systems and programs to identify those
that contain two-digit year codes and is in the process of upgrading
its global infrastructure and corporate facilities to achieve Year 2000
compliance. In addition, the Company is actively working with its major
external counterparties and suppliers to assess their compliance and
remediation efforts and the Company’s exposure to them.
In addressing the Year 2000 issue, the Company has
identified the following phases. In the Awareness phase, the Company
defined the Year 2000 issue and obtained executive level support and
funding. In the Inventory phase, the Company collected a compre-
hensive list of items that may be affected by Year 2000 compliance
issues. Such items include facilities and related non-information tech-
nology systems (embedded technology), computer systems, hardware,
and services and products provided by third parties. In the Assessment
phase, the Company evaluated the items identified in the Inventory
phase to determine which will function properly with the change to
the new century and ranked items which will need to be remediated
based on their potential impact to the Company. The Remediation
phase includes an analysis of the items that are affected by Year 2000,
the identification of problem areas and the repair of non-compliant
items. The Testing phase includes a thorough testing of all proposed
repairs, including present and forward date testing which simulates
dates in the Year 2000. The Implementation phase consists of plac-
ing all items that have been remediated and successfully tested
into production. Finally, the Integration and External Testing phase
includes exercising business-critical production systems in a future
time environment and testing with external entities.
The Company has completed the Awareness, Inventory
and Assessment phases. As of November 30, 1998, the Remediation,
Testing and Implementation phases were substantially complete.
Due to resource allocations between the Year 2000 and EMU projects,
as well as late vendor delivery of third-party products, the Company
expects that the remaining portions of the Remediation, Testing and
Implementation phases of substantially all mission-critical systems will
be complete by March 31, 1999 as compared with the original
expected completion date of December 31, 1998. The Integration and
External Testing phase commenced in the second quarter of 1998 and
will continue through 1999. In addition, the major business rela-
tionships of the Company have been identified, and the most critical
of them have been or are scheduled to be tested.
In addition, the Company is closely monitoring the
Year 2000 compliance status of its most critical business relationships.
The Company continues to survey and communicate with counter-
parties, intermediaries and vendors with whom it has important finan-
cial and operational relationships to determine the extent to which they
are vulnerable to Year 2000 issues. As of November 30, 1998, the
Company had not yet received sufficient information from all parties
about their remediation plans to predict the outcomes of their efforts.
In particular, in some international markets in which the Company con-
ducts business, the level of awareness and remediation efforts relat-
ing to the Year 2000 issue is thought to be less advanced than in the
United States.
During the third quarter of fiscal 1998, the Company
participated in the Securities Industry Association’s Beta test and
a test sponsored by the Bank of England’s Central Gilts Office.
These tests were run in “future time,” using a portion of the
Company’s production system, and employed test scripts to check
functionality. The Company has achieved successful results in each
of the industry-wide tests in which it participated. The Company will
continue to participate in industry-wide and vendor-specific tests
throughout 1999.
There are many risks associated with the Year 2000
issue, including the possibility of a failure of the Company’s computer
and non-information technology systems. Such failures could have a
material adverse effect on the Company and may cause systems mal-
functions; incorrect or incomplete transaction processing resulting in
failed trade settlements; the inability to reconcile accounting books
and records; the inability to reconcile credit card transactions and

* FORTY-FIVE *
MORGAN STANLEY DEAN WITTER * 1998 ANNUAL REPORT
balances; the inability to reconcile trading positions and balances with
counterparties; and inaccurate information to manage the Company’s
exposure to trading risks and disruptions of funding requirements. In
addition, even if the Company successfully remediates its Year 2000
issues, it can be materially and adversely affected by failures of third
parties to remediate their own Year 2000 issues. The Company rec-
ognizes the uncertainty of such external dependencies since it can-
not directly control the remediation efforts of third parties. The failure
of third parties with which the Company has financial or operational
relationships, such as securities exchanges, clearing organizations,
depositories, regulatory agencies, banks, clients, counterparties, ven-
dors (including data center, data network and voice service providers)
and utilities, to remediate their computer and non-information tech-
nology systems issues in a timely manner could result in a material
financial risk to the Company.
If the above-mentioned risks are not remedied, the
Company may experience business interruption or shutdown, finan-
cial loss, regulatory actions, damage to the Company’s global fran-
chise and legal liability.
The Company has business continuity plans in place
for its critical business functions on a worldwide basis. The Company
also has in place a contingency funding strategy (see “Liquidity and
Capital Resources”). The Company has begun Year 2000 contingency
planning. The Company is currently reviewing responses from its
major external counterparties and suppliers with respect to Year 2000
preparation, assessing the results of various internal and external sys-
tems tests and analyzing possible Year 2000 scenarios to determine
a range of likely outcomes. The Company intends to document and
test Year 2000 specific contingency plans during fiscal 1999 as part
of its Year 2000 mitigation efforts.
Based upon current information, the Company esti-
mates that the total cost of implementing its Year 2000 initiative will
be between $200 million and $225 million. The decrease in these
estimates from amounts previously reported is associated with the
Company’s sale of its interest in the operations of SPS and with revised
internal estimates. The Year 2000 costs include all activities under-
taken on Year 2000 related matters across the Company, including,
but not limited to, remediation, testing (internal and external), third-
party review, risk mitigation and contingency planning. Through
November 30, 1998, the Company expended approximately $110
million on the Year 2000 project. The Company expects the major-
ity of the remaining costs to be directed primarily toward testing activ-
ities. These costs have been and will continue to be funded through
operating cash flow and are expensed in the period in which they
are incurred.
The Company’s expectations about future costs, the
timely completion and the potential risks of its Year 2000 modifi-
cations are subject to uncertainties that could cause actual results
to differ materially from what has been discussed above. Factors that
could influence the amount of future costs and the effective timing
of remediation efforts include the success of the Company in iden-
tifying computer programs and non-information technology systems
that contain two-digit year codes; the nature and amount of pro-
gramming and testing required to upgrade or replace each of the
affected programs and systems; the nature and amount of testing,
verification and reporting required by the Company’s regulators
around the world, including securities exchanges, central banks
and various governmental regulatory bodies; the rate and magnitude
of related labor and consulting costs; and the success of the
Company’s external counterparties and suppliers, as well as world-
wide exchanges, clearing organizations and depositories, in address-
ing the Year 2000 issue.
EMU
EMU replaces the national currencies of 11 participating European
Union countries with a single European currency — the euro. The
euro was launched on January 1, 1999, when the European Central
Bank assumed control of monetary policy for the participating
nations. During the transition period until the national currencies are
withdrawn from circulation (July 2002 at the latest), such curren-
cies will continue to exist but only as fixed denominations of the euro.
EMU will primarily impact the Company’s Securities and Asset
Management business.
The introduction of the euro presents major business
opportunities for financial market participants such as the Company.
The Company expects that the introduction of the euro will lead to
greater cross-border price transparency and will have a significant
impact on the markets in which the Company operates.
The Company prepared actively for the introduction of
the euro and implemented significant modifications to its informa-
tion technology systems and programs in order to prepare for tran-
sition to the euro. The Company engaged in extensive testing of the

* FORTY-SIX *
MORGAN STANLEY DEAN WITTER * 1998 ANNUAL REPORT
systems and processes affected by EMU and also communicated
extensively with its clients and counterparties regarding the impli-
cations of EMU. The Company considers that the initial redenomi-
nation exercise that took place between January 1 and January 3,
1999 was successful from the perspective of its internal systems and
books and records. Despite certain initial issues with the settlement
of euro payments, as of January 31, 1999 it appears that the
changeover to the euro has been successful across Europe.
Based upon current information, the Company esti-
mates that the costs associated with reviewing, amending and test-
ing its information technology systems to prepare for EMU for fiscal
1998 and through the project’s completion will be approximately
$76 million. Substantially all of such costs were incurred by the end
of fiscal 1998. These costs have been and will continue to be
funded through operating cash flow and are expensed in the period
in which they are incurred.
REGULATORY CAPITAL REQUIREMENTS
Dean Witter Reynolds Inc. (“DWR”) and MS&Co. are registered broker-
dealers and registered futures commission merchants and, accord-
ingly, are subject to the minimum net capital requirements of the
Securities and Exchange Commission (“SEC”), the New York Stock
Exchange and the Commodity Futures Trading Commission. MSIL, a
London-based broker-dealer subsidiary, is regulated by the Securities
and Futures Authority (“SFA”) in the United Kingdom and, accord-
ingly, is subject to the Financial Resources Requirements of the SFA.
Morgan Stanley Japan Limited (“MSJL”), a Tokyo-based broker-dealer,
is regulated by the Japanese Ministry of Finance with respect to reg-
ulatory capital requirements. DWR, MS&Co., MSIL and MSJL have con-
sistently operated in excess of their respective regulatory requirements
(see Note 11 to the consolidated financial statements).
Certain of the Company’s subsidiaries are Federal
Deposit Insurance Corporation (“FDIC”) insured financial institutions.
Such subsidiaries are therefore subject to the regulatory capital
requirements adopted by the FDIC. These subsidiaries have consis-
tently operated in excess of these and other regulatory requirements.
Certain other U.S. and non-U.S. subsidiaries are sub-
ject to various securities, commodities and banking regulations and
capital adequacy requirements promulgated by the regulatory and
exchange authorities of the countries in which they operate. These
subsidiaries have consistently operated in excess of their applica-
ble local capital adequacy requirements. In addition, Morgan Stanley
Derivative Products Inc., a triple-A rated subsidiary through which
the Company conducts some of its derivative activities, has estab-
lished certain operating restrictions which have been reviewed by
various rating agencies.
EFFECTS OF INFLATION AND CHANGES
IN FOREIGN EXCHANGE RATES
Because the Company’s assets to a large extent are liquid in nature,
they are not significantly affected by inflation. However, inflation may
result in increases in the Company’s expenses, which may not be
readily recoverable in the price of services offered. To the extent infla-
tion results in rising interest rates and has other adverse effects upon
the securities markets, on the value of financial instruments and upon
the markets for consumer credit services, it may adversely affect the
Company’s financial position and profitability.
A portion of the Company’s business is conducted in
currencies other than the U.S. dollar. Non-U.S. dollar assets typi-
cally are financed by direct borrowing or swap-based funding in the
same currency. Changes in foreign exchange rates affect non-U.S.
dollar revenues as well as non-U.S. dollar expenses. Those foreign
exchange exposures that arise and are not hedged by an offsetting
foreign currency exposure are actively managed by the Company to
minimize risk of loss due to currency fluctuations.
DERIVATIVE FINANCIAL INSTRUMENTS
The Company actively offers to clients and trades for its own account
a variety of financial instruments described as “derivative prod-
ucts” or “derivatives.” These products generally take the form of
futures, forwards, options, swaps, caps, collars, floors, swap options
and similar instruments which derive their value from underlying inter-
est rates, foreign exchange rates, or commodity or equity instruments
and indices. All of the Company’s trading-related divisions use
derivative products as an integral part of their respective trading
strategies, and such products are used extensively to manage the
market exposure that results from a variety of proprietary trading activ-
ities (see Note 9 to the consolidated financial statements). In addi-
tion, as a dealer in certain derivative products, most notably interest
rate and currency swaps, the Company enters into derivative contracts
to meet a variety of risk management and other financial needs of
its clients. Given the highly integrated nature of derivative products
and related cash instruments in the determination of overall trad-
ing division profitability and the context in which the Company

* FORTY-SEVEN *
MORGAN STANLEY DEAN WITTER * 1998 ANNUAL REPORT
manages its trading areas, it is not meaningful to allocate trading
revenues between the derivative and underlying cash instrument com-
ponents. Moreover, the risks associated with the Company’s deriv-
ative activities, including market and credit risks, are managed on
an integrated basis with associated cash instruments in a manner
consistent with the Company’s overall risk management policies
and procedures (see “Risk Management” following “Management’s
Discussion and Analysis of Financial Condition and Results of
Operations”). It should be noted that while particular risks may be
associated with the use of derivatives, in many cases derivatives serve
to reduce, rather than increase, the Company’s exposure to market,
credit and other risks.
The total notional value of derivative trading contracts
outstanding at November 30, 1998 was $2,860 billion (as compared
with $2,529 billion at November 30, 1997). While these amounts
are an indication of the degree of the Company’s use of derivatives
for trading purposes, they do not represent the Company’s market
or credit exposure and may be more indicative of customer utiliza-
tion of derivatives. The Company’s exposure to market risk relates
to changes in interest rates, foreign currency exchange rates or the
fair value of the underlying financial instruments or commodities.
The Company’s exposure to credit risk at any point in time is rep-
resented by the fair value of such contracts reported as assets.
Such total fair value outstanding as of November 30, 1998 was
$21.4 billion. Approximately $16.2 billion of that credit risk expo-
sure was with counterparties rated single-A or better (see Note 9 to
the consolidated financial statements).
The Company also uses derivative products (primarily
interest rate, currency and equity swaps) to assist in asset and lia-
bility management, reduce borrowing costs and hedge interest rate
risk (see Note 6 to the consolidated financial statements).
The Company believes that derivatives are valuable
tools that can provide cost-effective solutions to complex financial
problems and remains committed to providing its clients with inno-
vative financial products. The Company established Morgan Stanley
Derivative Products Inc. to offer derivative products to clients who will
enter into derivative transactions only with triple-A rated counterparties.
In addition, the Company, through its continuing involvement with reg-
ulatory, self-regulatory and industry activities such as the International
Swaps and Derivatives Association Inc. (“ISDA”), the Securities
Industry Association, the Group of 30 and the U.S. securities firms’
Derivatives Policy Group, provides leadership in the development of
policies and practices in order to maintain confidence in the markets
for derivative products, which is critical to the Company’s ability to
assist clients in meeting their overall financial needs.
RISK MANAGEMENT
RISK MANAGEMENT POLICY AND CONTROL STRUCTURE
Risk is an inherent part of the Company’s business and activities.
The extent to which the Company properly and effectively identifies,
assesses, monitors and manages each of the various types of risk
involved in its activities is critical to its soundness and profitabil-
ity. The Company’s broad-based portfolio of business activities helps
reduce the impact that volatility in any particular area or related areas
may have on its net revenues as a whole. The Company seeks to iden-
tify, assess, monitor and manage, in accordance with defined poli-
cies and procedures, the following principal risks involved in the
Company’s business activities: market risk, credit risk, operational
risk, legal risk and funding risk. Funding risk is discussed in the
Liquidity and Capital Resources section of Management’s Discussion
and Analysis of Financial Condition and Results of Operations begin-
ning on page 23.
Risk management at the Company is a multi-faceted
process with independent oversight that requires constant commu-
nication, judgment and knowledge of specialized products and mar-
kets. The Company’s senior management takes an active role in the
risk management process and has developed policies and procedures
that require specific administrative and business functions to assist
in the identification, assessment and control of various risks. In recog-
nition of the increasingly varied and complex nature of the global
financial services business, the Company’s risk management poli-
cies and procedures are evolutionary in nature and are subject to
ongoing review and modification.
The Management Committee, composed of the
Company’s most senior officers, establishes the overall risk man-
agement policies for the Company and reviews the Company’s per-
formance relative to these policies. The Management Committee has
created several Risk Committees to assist it in monitoring and
reviewing the Company’s risk management practices. These Risk
Committees, as well as other committees established to manage and
monitor specific risks, review the risk monitoring and risk manage-
ment policies and procedures relating to the Company’s market

* FORTY-EIGHT *
MORGAN STANLEY DEAN WITTER * 1998 ANNUAL REPORT
and credit risk profile, sales practices, pricing of consumer loans and
reserve adequacy, legal enforceability and operational and systems
risks. The Controllers, Treasury, Law, Compliance and Governmental
Affairs and Firm Risk Management Departments, which are all inde-
pendent of the Company’s business units, assist senior management
and the Risk Committees in monitoring and controlling the Company’s
risk profile. In addition, the Internal Audit Department, which also
reports to senior management, periodically examines and evaluates
the Company’s operations and control environment. The Company
continues to be committed to employing qualified personnel with
appropriate expertise in each of its various administrative and busi-
ness areas to implement effectively the Company’s risk management
and monitoring systems and processes.
The following is a discussion of the Company’s risk man-
agement policies and procedures for its principal risks (other than
funding risk). The discussion focuses on the Company’s securities trad-
ing (primarily its institutional trading activities) and consumer lend-
ing and related activities. The Company believes that these activities
generate a substantial portion of its principal risks. This discussion
and the estimated amounts of the Company’s market risk exposure
generated by the Company’s statistical analyses are forward-looking
statements. However, the analyses used to assess such risks are not
predictions of future events, and actual results may vary signifi-
cantly from such analyses due to actual events in the markets in which
the Company operates and certain other factors described below.
MARKET RISK
Market risk refers to the risk that a change in the level of one or more
market prices, rates, indices, volatilities, correlations or other market
factors, such as liquidity, will result in losses for a specified position
or portfolio. For a discussion of the Company’s currency exposure
relating to its net monetary investments in non-U.S. dollar functional
currency subsidiaries, see Note 11 to the consolidated
financial statements.
TRADING AND RELATED ACTIVITIES
Primary Market Risk Exposures and Market Risk Management
During fiscal 1998, the Company had exposures to a wide range of
interest rates, equity prices, foreign exchange rates and commod-
ity prices — and associated volatilities and spreads — related to a
broad spectrum of global markets in which it conducts its trading
activities. The Company is exposed to interest rate risk as a result
of maintaining market making and proprietary positions and trading
in interest rate sensitive financial instruments (e.g., risk arising
from changes in the level or volatility of interest rates, the timing of
mortgage prepayments, the shape of the yield curve and credit
spreads for corporate bonds and emerging market debt). The
Company is exposed to equity price risk as a result of making mar-
kets in equity securities and equity derivatives and maintaining
proprietary positions. The Company is exposed to foreign exchange
rate risk in connection with making markets in foreign currencies,
foreign currency options and maintaining foreign exchange positions.
The Company’s currency trading covers many foreign currencies,
including the yen, deutsche mark, pound sterling, French franc
and, on a going-forward basis, the euro. The Company is exposed to
commodity price risk as a result of trading in commodity-related deriv-
atives and physical commodities.
The Company manages its trading positions by employ-
ing a variety of strategies, which include diversification of risk expo-
sures and the purchase or sale of positions in related securities and
financial instruments, including a variety of derivative products
(e.g., swaps, options, futures and forwards). The Company manages
the market risk associated with its trading activities on a Company-
wide basis, on a trading division level worldwide and on an individ-
ual product basis. The Company manages and monitors its market
risk exposures in such a way as to maintain a portfolio that the
Company believes is well-diversified with respect to market risk
factors. Market risk limits have been approved for the Company and
each major trading division of the Company worldwide (equity, fixed
income, foreign exchange and commodities). Discrete market risk
limits are assigned to trading desks and, as appropriate, products
and regions, that are compatible with the trading division limits.
Trading division risk managers, desk risk managers and the Firm Risk
Management Department all monitor market risk measures against
limits and report major market and position events to senior management.
The Firm Risk Management Department independently
reviews the Company’s trading portfolios on a regular basis from a mar-
ket risk perspective utilizing Value-at-Risk and other quantitative and
qualitative risk measurements and analyses. The Company may use

* FORTY-NINE *
MORGAN STANLEY DEAN WITTER * 1998 ANNUAL REPORT
measures, such as rate sensitivity, convexity, volatility and time
decay measurements, to estimate market risk and to assess the sen-
sitivity of positions to changes in market conditions. Stress testing,
which measures the impact on the value of existing portfolios of spec-
ified changes in market factors, for certain products is performed peri-
odically and reviewed by trading division risk managers, desk risk
managers and the Firm Risk Management Department.
Value-at-Risk
The statistical technique known as Value-at-Risk (“VaR”) is one of
the tools used by management to measure, monitor and review the
market risk exposures of the Company’s trading portfolios. The
Company’s independent Firm Risk Management Department cal-
culates and distributes daily VaR-based risk measures to various
levels of management.
VaR Methodology, Assumptions and Limitations
The Company estimates VaR using a model based on historical sim-
ulation with a confidence level of 99%. Historical simulation involves
constructing a distribution of hypothetical daily changes in trading
portfolio value. The hypothetical changes in portfolio value are
based on daily observed percentage changes in key market indices
or other market factors (“market risk factors”) to which the portfo-
lio is sensitive. In the case of the Company’s VaR, the historical obser-
vation period is approximately four years. The Company’s one-day
99% VaR corresponds to the negative change in portfolio value
that, based on observed market risk factor movements, would have
been exceeded with a frequency of 1%, or once in 100 trading days.
The VaR model generally takes into account linear and
non-linear exposures to price and interest rate risk and linear expo-
sure to implied volatility risks. Market risks that are incorporated in
the VaR model include equity and commodity prices, interest rates,
foreign exchange rates and associated volatilities, as well as corre-
lation that exists among these variables. As a supplement to the use
of historical simulation for major market risk factors, the Company’s
VaR model uses Monte Carlo simulation to capture name-specific risk
in global equities and in U.S. corporate and high-yield bonds. As of
November 30, 1998, a total of approximately 500 market risk fac-
tor benchmark data series were incorporated in the Company’s VaR
model covering interest rates, equity prices, foreign exchange rates,
commodity prices and associated volatilities. In addition, the model
includes market risk factors for approximately 7,500 equity names
and 60 classes of corporate and high-yield bonds.
VaR models such as the Company’s are continually
evolving as the composition of trading portfolios change and as mod-
eling techniques and systems capabilities improve. During fiscal
1998, as part of the Company’s ongoing program of VaR model
enhancement, position and risk coverage were broadened and risk mea-
surement methodologies were refined. Included in such enhancements
were improved capture of implied volatility risks in certain derivative
products and interest rate related risks in mortgage-backed and
emerging-market financial instruments, which had the primary effect
of increasing the VaR for interest rate risk.
Among their benefits, VaR models permit estimation of
a portfolio’s aggregate market risk exposure, incorporating a range of
varied market risks; reflect risk reduction due to portfolio diversification;
and can cover a wide range of portfolio assets yet are relatively easy
to interpret. However, VaR risk measures should be interpreted in light
of the methodology’s limitations, which include the following: past
changes in market risk factors will not always yield accurate predic-
tions of the distributions and correlations of future market movements;
changes in portfolio value in response to market movements may dif-
fer from the responses implicit in a VaR model; published VaR results
reflect past trading positions while future risk depends on future
positions; VaR using a one-day time horizon does not fully capture the
market risk of positions that cannot be liquidated or hedged within
one day; and the historical market risk factor data used for VaR esti-
mation may provide only limited insight into losses that could be
incurred under certain unusual market movements. The Company is
aware of these and other limitations and therefore uses VaR as only
one component in its risk management review process. This process
also incorporates stress testing and extensive risk monitoring and con-
trol at the trading desk, division and Company levels.
VaR for Fiscal 1998
The table below presents the results of the Company’s VaR for each
of the Company’s primary market risk exposures and on an aggre-
gate basis at November 30, 1998 and November 30, 1997, incor-

* FIFTY *
MORGAN STANLEY DEAN WITTER * 1998 ANNUAL REPORT
porating substantially all financial instruments generating market risk
(including funding liabilities related to hedging trading positions, retail
trading activities and certain private equity positions that are not
reported separately because the aggregate impact on the Company’s
VaR was not material). However, a small proportion of trading posi-
tions generating market risk were not covered, and the modeling of
the risk characteristics of some positions involved approximations
which could be significant under certain circumstances. Market
risks that the Company has found particularly difficult to incorporate
in its VaR model include certain risks associated with mortgage-backed
securities, some commodity price risks (such as electricity price
risk) and liquidity risks in certain financial products.
Since VaR is based on historical data and changes in
market risk factor returns, VaR should not be viewed as predictive
of the Company’s future financial performance or its ability to man-
age and monitor risk, and there can be no assurance that the
Company’s actual losses on a particular day will not exceed the VaR
amounts indicated below or that such losses will not occur more than
once in 100 trading days.
99%/ONE-DAY VaRAT NOVEMBER 30, PRIMARY MARKET RISK CATEGORY
(dollars in millions, pre-tax) 1998 1997(1)
Interest rate $36 $42Equity price 17 17Foreign exchange rate 5 7Commodity price 6 6Subtotal 64 72Less diversification benefit(2) 26 26Aggregate Value-at-Risk $38 $46
(1)The Interest rate and Aggregate Value-at-Risk for fiscal 1997 have been restated to reflect the esti-mated impact of enhancements to the Company’s VaR model made during fiscal 1998 describedabove.
(2) Equals the difference between Aggregate VaR and the sum of the VaRs for the four risk categories.This benefit arises because the simulated 99%/one-day losses for each of the four primary mar-ket risk categories occur on different days; similar diversification benefits also are taken into accountwithin each such category.
The change in Aggregate Value-at-Risk from November 30, 1997 to
November 30, 1998 primarily reflected a reduction in certain inter-
est rate risk positions.
In order to facilitate comparison with other global
financial services firms, the Company notes that its Aggregate VaR
at November 30, 1998 for other confidence levels and time horizons
was as follows: $26 million for 95%/one-day VaR and $121 million
for 99%/two-week VaR.
The table below presents the average, high and low
99%/one-day VaR over the course of fiscal 1998 for substantially
all of the Company’s institutional trading activities. This measure of
VaR incorporates most of the Company’s trading-related market
risks. Certain market risks included in the year-end VaR discussed
above are excluded from this measure (i.e., those associated with
the Company’s retail trading activities, equity price risk in certain
private equity positions and funding liabilities related to hedging
trading positions).
DAILY 99%/ONE-DAY VaR FOR FISCAL 1998PRIMARY MARKET RISK CATEGORY(dollars in millions, pre-tax) High Low Average
Interest rate $50 $35 $41Equity price 19 12 15Foreign exchange rate 10 3 5Commodity price 8 5 6Aggregate Value-at-Risk $50 $35 $43
The Company evaluates the reasonableness of its VaR model by com-
paring the potential declines in portfolio values generated by the
model with actual trading results. Despite volatile market conditions
during fiscal 1998, there were no days during which the Company
incurred daily trading losses in its institutional trading business in
excess of the 99%/one-day VaR which incorporates the enhancements
to the Company’s VaR model made during fiscal 1998.
The chart below presents the Company’s daily 99%/one-day VaR for
its institutional trading activities over the course of fiscal 1998:
99% / ONE-DAY VALUE-AT-RISKfirst quarter second quarter third quarter fourth quarter
mill
ions
of
dolla
rs
25
30
35
40
45
50
55
60
20

* FIFTY-ONE *
MORGAN STANLEY DEAN WITTER * 1998 ANNUAL REPORT
CONSUMER LENDING AND RELATED ACTIVITIES
Interest Rate Risk and Management
In its consumer lending activities, the Company is exposed to mar-
ket risk primarily from changes in interest rates. Such changes in
interest rates impact interest earning assets, principally credit card
and other consumer loans and net servicing fees received in con-
nection with consumer loans sold through asset securitizations, as
well as the interest-sensitive liabilities which finance these assets,
including asset securitizations, commercial paper, medium-term
notes, long-term borrowings, deposits, asset-backed commercial
paper, Federal Funds and short-term bank notes.
The Company’s interest rate risk management policies
are designed to reduce the potential volatility of earnings which may
arise from changes in interest rates. This is accomplished primar-
ily by matching the repricing of credit card and consumer loans and
the related financing. To the extent that asset and related financing
repricing characteristics of a particular portfolio are not matched effec-
tively, the Company utilizes interest rate derivative contracts, such
as swap and cap agreements, to achieve its matched financing
objectives. Interest rate swap agreements effectively convert the
underlying asset or financing from fixed to variable repricing, from
variable to fixed repricing or, in more limited circumstances, from vari-
able to variable repricing. Interest rate cap agreements effectively
establish a maximum interest rate on certain variable rate financings.
Sensitivity Analysis Methodology, Assumptions and Limitations
For its consumer lending activities, the Company uses a variety of
techniques to assess its interest rate risk exposure, one of which is
interest rate sensitivity simulation. For purposes of presenting the
possible earnings effect of a hypothetical, adverse change in inter-
est rates over the 12-month period from its fiscal year-end, the
Company assumes that all interest rate sensitive assets and liabili-
ties will be impacted by a hypothetical, immediate 100 basis point
increase in interest rates as of the beginning of the period.
Interest rate sensitive assets are assumed to be those
for which the stated interest rate is not contractually fixed for the
next 12-month period. Thus, assets which have a market-based
index, such as the prime rate, which will reset before the end of the
12-month period, or assets with rates that are fixed at fiscal year-
end, but which will mature, or otherwise contractually reset to a
market-based indexed rate prior to the end of the 12-month period,
are rate-sensitive. The latter category includes certain credit card
loans which may be offered at below-market rates for an introduc-
tory period, such as for balance transfers and special promotional
programs, after which the loans will contractually reprice in accor-
dance with the Company’s normal market-based pricing structure.
For purposes of measuring rate-sensitivity for such loans, only the
effect of the hypothetical 100 basis point change in the underlying
market-based index, such as the prime rate, has been considered
rather than the full change in the rate to which the loan would con-
tractually reprice. For assets which have a fixed rate at fiscal year-
end, but which contractually will, or are assumed to, reset to a
market-based index during the next 12 months, earnings sensitiv-
ity is measured from the expected repricing date. In addition, for all
interest rate sensitive assets, earnings sensitivity is calculated net
of expected loan losses.
Interest rate sensitive liabilities are assumed to be
those for which the stated interest rate is not contractually fixed for
the next 12-month period. Thus, liabilities which have a market-based
index, such as the prime, commercial paper, or LIBOR rates, which
will reset before the end of the 12-month period, or liabilities whose
rates are fixed at fiscal year-end, but which will mature and be
replaced with a market-based indexed rate prior to the end of the
12-month period, are rate-sensitive. For liabilities which have a
fixed rate at fiscal year-end, but which are assumed to reset to a mar-
ket-based index during the next 12 months, earnings sensitivity is
measured from the expected repricing date.
Assuming a hypothetical, immediate 100 basis point
increase in the interest rates affecting all interest rate sensitive
assets and liabilities as of November 30, 1998, pre-tax income of
consumer lending and related activities over the following 12-month
period would be reduced by approximately $65 million. The com-
parable reduction of pre-tax income for the 12-month period following
November 30, 1997 was estimated to be approximately $66 million.
The hypothetical model assumes that the balances of
interest rate sensitive assets and liabilities at fiscal year-end will
remain constant over the next 12-month period. It does not assume
any growth, strategic change in business focus, change in asset pric-
ing philosophy or change in asset/liability funding mix. Thus, this
model represents a static analysis which cannot adequately portray
how the Company would respond to significant changes in market
conditions. Furthermore, the analysis does not necessarily reflect the
Company’s expectations regarding the movement of interest rates in
* FIFTY-TWO *
MORGAN STANLEY DEAN WITTER * 1998 ANNUAL REPORT
the near term, including the likelihood of an immediate 100 basis
point change in market interest rates nor necessarily the actual effect
on earnings if such rate changes were to occur.
The Company anticipates the repricing of a substan-
tial portion of its existing credit card receivables to a fixed interest
rate during fiscal 1999. The Company does not believe this repric-
ing will have a material impact on its interest rate sensitivity due to
the Company’s matched financing objectives.
CREDIT RISK
The Company’s exposure to credit risk arises from the possibility that
a customer or counterparty to a transaction might fail to perform
under its contractual commitment, which could result in the Company
incurring losses. With respect to its trading activities, the Company
has credit guidelines which limit the Company’s credit exposure to
any one counterparty. Specific credit risk limits based on the credit
guidelines also are in place for each type of counterparty (by rating
category) as well as for secondary positions in high-yield and emerg-
ing market debt. In addition to monitoring credit limits, the Company
manages the credit exposure relating to the Company’s trading
activities by reviewing counterparty financial soundness periodi-
cally, by entering into master netting agreements and collateral
arrangements with counterparties in appropriate circumstances and
by limiting the duration of exposure. With respect to its consumer
lending activities, potential credit card holders undergo credit
reviews by the Credit Department to establish that they meet stan-
dards of ability and willingness to pay. Credit card applications are
evaluated using scoring models (statistical evaluation models) based
on information obtained from credit bureaus. The Company’s credit
scoring systems include both industry and customized models using
the Company’s criteria and historical data. Each cardmember’s
credit line is reviewed at least annually, and actions resulting from
such review may include lowering a cardmember’s credit line or clos-
ing the account. In addition, the Company reviews the creditwor-
thiness of prospective Discover/NOVUS Network merchants and
conducts annual reviews of merchants, with the greatest scrutiny
given to merchants with substantial sales volume.
OPERATIONAL RISK
Operational risk refers to the risk of loss resulting from improper pro-
cessing of transactions or deficiencies in the Company’s operating sys-
tems or control processes. With respect to its trading activities, the
Company has developed and continues to enhance specific policies
and procedures that are designed to provide, among other things, that
all transactions are accurately recorded and properly reflected in the
Company’s books and records and confirmed on a timely basis; posi-
tion valuations are subject to periodic independent review procedures;
and adequate documentation (e.g., master agreements) is obtained
from counterparties in appropriate circumstances. With respect to its
consumer lending activities, operating systems are designed to pro-
vide for the efficient servicing of consumer loan accounts. The
Company manages operational risk through its system of internal con-
trols which provides checks and balances to ensure that transactions
and other account-related activity (e.g., new account solicitation, trans-
action authorization and processing, billing and collection of delin-
quent accounts) are properly approved, processed, recorded and
reconciled. Disaster recovery plans are in place on a Company-wide
basis for critical systems, and redundancies are built into the systems
as deemed appropriate.
LEGAL RISK
Legal risk includes the risk of non-compliance with applicable legal
and regulatory requirements and the risk that a counterparty’s per-
formance obligations will be unenforceable. The Company is generally
subject to extensive regulation in the different jurisdictions in which
it conducts its business. The Company has established procedures
based on legal and regulatory requirements on a worldwide basis that
are designed to ensure compliance with all applicable statutory
and regulatory requirements. The Company, principally through the
Law, Compliance and Governmental Affairs Department, also has
established procedures that are designed to ensure that senior man-
agement’s policies relating to conduct, ethics and business practices
are followed globally. In connection with its business, the Company
has various procedures addressing issues, such as regulatory capi-
tal requirements, sales and trading practices, new products, use and
safekeeping of customer funds and securities, credit granting, col-
lection activities, money-laundering and recordkeeping. The Company
also has established procedures to mitigate the risk that a counter-
party’s performance obligations will be unenforceable, including
consideration of counterparty legal authority and capacity, ade-
quacy of legal documentation, the permissibility of a transaction
under applicable law and whether applicable bankruptcy or insolvency
laws limit or alter contractual remedies.

* FIFTY-THREE *
MORGAN STANLEY DEAN WITTER * 1998 ANNUAL REPORT
REPORT OF INDEPENDENT AUD ITORS
TO THE BOARD OF DIRECTORS AND SHAREHOLDERS OF
MORGAN STANLEY DEAN WITTER & CO.
We have audited the accompanying consolidated statements of
financial condition of Morgan Stanley Dean Witter & Co. and sub-
sidiaries as of fiscal years ended November 30, 1998 and 1997, and
the related consolidated statements of income, cash flows and
changes in shareholders’ equity for each of the three fiscal years in
the period ended November 30, 1998. These consolidated financial
statements are the responsibility of the Company’s management. Our
responsibility is to express an opinion on these consolidated finan-
cial statements based on our audits. The consolidated financial
statements give retroactive effect to the merger of Morgan Stanley
Group Inc. and Dean Witter, Discover & Co., which has been
accounted for as a pooling of interests as described in Note 1 to the
consolidated financial statements. We did not audit the consolidated
statements of income, cash flows and changes in shareholders’
equity of Morgan Stanley Group Inc. and subsidiaries for the fiscal
year ended November 30, 1996, which statements reflect total
revenues of $13,144 million for the fiscal year then ended. Those
statements were audited by other auditors whose report has been fur-
nished to us, and our opinion, insofar as it relates to the amounts
included for Morgan Stanley Group Inc. and subsidiaries for such
period, is based solely on the report of such other auditors.
We conducted our audits in accordance with generally
accepted auditing standards. Those standards require that we plan
and perform the audit to obtain reasonable assurance about whether
the financial statements are free of material misstatement. An audit
includes examining, on a test basis, evidence supporting the amounts
and disclosures in the financial statements. An audit also includes
assessing the accounting principles used and significant estimates
made by management, as well as evaluating the overall financial
statement presentation. We believe that our audits and the report of
the other auditors provide a reasonable basis for our opinion.
In our opinion, based on our audits and the report of
the other auditors, the accompanying consolidated financial state-
ments present fairly, in all material respects, the consolidated finan-
cial position of Morgan Stanley Dean Witter & Co. and subsidiaries
at fiscal years ended November 30, 1998 and 1997, and the con-
solidated results of their operations and their cash flows for each of
the three fiscal years in the period ended November 30, 1998, in
conformity with generally accepted accounting principles.
As discussed in Note 2 to the consolidated financial
statements, in fiscal 1998, Morgan Stanley Dean Witter & Co. changed
its method of accounting for certain offering costs of closed-end funds.
New York, New York
January 22, 1999

(dollars in millions, except share data) NOVEMBER 30, 1998 NOVEMBER 30, 1997
ASSETS
Cash and cash equivalents $ 16,878 $ 8,255Cash and securities deposited with clearing organizations or segregated under federal and
other regulations (including securities at fair value of $7,518 at November 30, 1998and $4,655 at November 30, 1997) 10,531 6,890
Financial instruments owned:U.S. government and agency securities 12,350 12,901Other sovereign government obligations 15,050 22,900Corporate and other debt 22,388 24,499Corporate equities 14,289 10,329Derivative contracts 21,442 17,146Physical commodities 416 242
Securities purchased under agreements to resell 79,570 84,516Receivable for securities provided as collateral(1) 4,388 —Securities borrowed 69,338 55,266Receivables:
Consumer loans (net of allowances of $787 at November 30, 1998 and $884 at November 30, 1997) 15,209 20,033
Customers, net 18,785 12,259Brokers, dealers and clearing organizations 4,432 13,263Fees, interest and other 3,359 4,705
Office facilities, at cost (less accumulated depreciation and amortization of $1,837at November 30, 1998 and $1,279 at November 30, 1997) 1,834 1,705
Other assets 7,331 7,378
Total assets $ 317,590 $ 302,287
* FIFTY-FOUR *
CONSOL IDATED STATEMENTS OF F INANC IAL COND IT ION
MORGAN STANLEY DEAN WITTER * 1998 ANNUAL REPORT

(dollars in millions, except share data) NOVEMBER 30, 1998 NOVEMBER 30, 1997
LIABILITIES AND SHAREHOLDERS’ EQUITY
Commercial paper and other short-term borrowings $ 28,137 $ 22,614Deposits 8,197 8,993Financial instruments sold, not yet purchased:
U.S. government and agency securities 11,305 11,563Other sovereign government obligations 13,899 12,095Corporate and other debt 3,093 1,699Corporate equities 11,501 13,305Derivative contracts 21,198 15,599Physical commodities 348 68
Securities sold under agreements to repurchase 92,327 111,680Obligation to return securities received as collateral(1) 6,636 —Securities loaned 23,152 14,141Payables:
Customers 40,606 25,086Brokers, dealers and clearing organizations 5,244 16,097Interest and dividends 371 970
Other liabilities and accrued expenses 8,623 8,630Long-term borrowings 27,435 24,792
302,072 287,332
Capital Units 999 999
Preferred Securities Issued by Subsidiaries 400 —
Commitments and contingencies Shareholders’ equity:
Preferred stock 674 876Common stock ($0.01 par value, 1,750,000,000 shares authorized, 605,842,952 and
602,829,994 shares issued, 565,670,808 and 594,708,971 shares outstanding at November 30, 1998 and November 30, 1997) 6 6
Paid-in capital 3,746 3,727Retained earnings 12,080 9,330Employee stock trust 1,913 1,681Cumulative translation adjustments (12) (9)
Subtotal 18,407 15,611Note receivable related to sale of preferred stock to ESOP (60) (68)Common stock held in treasury, at cost ($0.01 par value, 40,172,144 and 8,121,023 shares
at November 30, 1998 and November 30, 1997) (2,702) (250)Common stock issued to employee trust (1,526) (1,337)
Total shareholders’ equity 14,119 13,956
Total liabilities and shareholders’ equity $ 317,590 $ 302,287
(1)These amounts relate to the Company’s adoption of SFAS No. 127.See Notes to Consolidated Financial Statements.
* FIFTY-FIVE *
MORGAN STANLEY DEAN WITTER * 1998 ANNUAL REPORT

fiscal year (dollars in millions, except share and per share data) 1998 1997 1996
Revenues:Investment banking $ 3,340 $ 2,694 $ 2,190Principal transactions:
Trading 3,291 3,191 2,659Investments 89 463 86
Commissions 2,353 2,086 1,776Fees:
Asset management, distribution and administration 2,849 2,505 1,732Merchant and cardmember 1,647 1,704 1,505Servicing 928 762 809
Interest and dividends 16,436 13,583 11,288Other 198 144 126
Total revenues 31,131 27,132 22,171Interest expense 13,514 10,806 8,934Provision for consumer loan losses 1,173 1,493 1,214
Net revenues 16,444 14,833 12,023
Non-interest expenses:Compensation and benefits 6,636 6,019 5,071Occupancy and equipment 583 526 493Brokerage, clearing and exchange fees 552 460 317Information processing and communications 1,140 1,080 996Marketing and business development 1,411 1,179 1,027Professional services 677 451 334Other 745 770 668Merger-related expenses — 74 —
Total non-interest expenses 11,744 10,559 8,906
Gain on sale of businesses 685 — —
Income before income taxes and cumulative effect of accounting change 5,385 4,274 3,117Provision for income taxes 1,992 1,688 1,137
Income before cumulative effect of accounting change 3,393 2,586 1,980Cumulative effect of accounting change (117) — —
Net income $ 3,276 $ 2,586 $ 1,980
Preferred stock dividend requirements $ 55 $ 66 $ 66
Earnings applicable to common shares(1) $ 3,221 $ 2,520 $ 1,914
Earnings per common share(2):Basic before cumulative effect of accounting change $ 5.80 $ 4.38 $ 3.34Cumulative effect of accounting change $ (0.20) $ — $ —
Basic $ 5.60 $ 4.38 $ 3.34
Diluted before cumulative effect of accounting change $ 5.52 $ 4.16 $ 3.16Cumulative effect of accounting change $ (0.19) $ — $ —
Diluted $ 5.33 $ 4.16 $ 3.16
Average common shares outstanding(2):Basic 575,822,725 574,818,233 573,356,930Diluted 606,294,065 606,306,475 606,790,754
(1) Amounts shown are used to calculate basic earnings per common share.(2) Per share and share data for fiscal 1997 and 1996 have been restated to reflect the Company’s adoption of SFAS No. 128.See Notes to Consolidated Financial Statements.
* FIFTY-SIX *
MORGAN STANLEY DEAN WITTER * 1998 ANNUAL REPORT
CONSOL IDATED STATEMENTS OF INCOME

MORGAN STANLEY DEAN WITTER * 1998 ANNUAL REPORT
* FIFTY-SEVEN *
fiscal year (dollars in millions) 1998 1997 1996
CASH FLOWS FROM OPERATING ACTIVITIES
Net income $ 3,276 $ 2,586 $ 1,980Adjustments to reconcile net income to net cash provided by (used for)
operating activities:Non-cash charges included in net income:
Cumulative effect of accounting change 117 — —Gain on sale of businesses (685) — —Deferred income taxes (55) (77) (426)Compensation payable in common or preferred stock 334 374 513Depreciation and amortization 575 338 251Provision for consumer loan losses 1,173 1,493 1,214
Changes in assets and liabilities:Cash and securities deposited with clearing organizations or segregated
under federal and other regulations (3,641) (1,691) (1,943)Financial instruments owned, net of financial instruments sold,
not yet purchased 11,127 1,730 (2,536)Securities borrowed, net of securities loaned (5,061) (10,561) (13,087)Receivables and other assets 2,114 (13,808) (8,227)Payables and other liabilities 6,095 19,058 6,910
Net cash provided by (used for) operating activities 15,369 (558) (15,351)
CASH FLOWS FROM INVESTING ACTIVITIES
Net (payments for) proceeds from:Office facilities (358) (301) (152)Sale of businesses, net of disposal costs 1,399 — —Purchase of Miller Anderson & Sherrerd, LLP, net of cash acquired — — (200)Purchase of Van Kampen American Capital, Inc., net of cash acquired — — (986)Net principal disbursed on consumer loans (2,314) (4,994) (7,532)Purchases of consumer loans — (11) (51)Sales of consumer loans 4,466 2,783 4,824Other investing activities — (5) (40)
Net cash provided by (used for) investing activities 3,193 (2,528) (4,137)
CASH FLOWS FROM FINANCING ACTIVITIES
Net proceeds from (payments for) short-term borrowings 5,620 (1,336) 8,106Securities sold under agreements to repurchase, net of securities purchased
under agreements to resell (14,407) 3,080 7,748Net proceeds from (payments for):
Deposits (796) 2,113 1,022Issuance of cumulative preferred stock — — 540Issuance of common stock 186 194 156Issuance of long-term borrowings 9,771 6,619 8,745Issuance of Preferred Securities Issued by Subsidiaries 400 — —Issuance of Capital Units — 134 —
Payments for:Repayments of long-term borrowings (7,069) (3,964) (2,637)Redemption of cumulative preferred stock (200) (345) (138)Repurchases of common stock (2,925) (124) (1,133)Cash dividends (519) (416) (313)
Net cash (used for) provided by financing activities (9,939) 5,955 22,096Dean Witter, Discover & Co.’s net cash activity for the month of December 1996 — (1,158) —Net increase in cash and cash equivalents 8,623 1,711 2,608Cash and cash equivalents, at beginning of period 8,255 6,544 3,936Cash and cash equivalents, at end of period $ 16,878 $ 8,255 $ 6,544
See Notes to Consolidated Financial Statements.
CONSOL IDATED STATEMENTS OF CASH FLOWS

NoteReceivableRelated to
Sale of Common CommonEmployee Cumulative Preferred Stock Held Stock Issued
Preferred Common Paid-in Retained Stock Translation Stock to in Treasury to Employee(dollars in millions) Stock Stock Capital Earnings Trust Adjustments ESOP at Cost( Trust Total
BALANCE AT FISCAL YEAR-END 1995 $ 818 $ 6 $ 3,456 $ 5,981 $ 1,050 $ (9) $ (89) $ (361) $ (844) $ 10,008Net income — — — 1,980 — — — — — 1,980Dividends — — — (323) — — — — — (323)Issuance of common stock in connection
with MAS acquisition — — 9 — — — — 74 — 83Redemption of 9.36%
Cumulative Preferred Stock (138) — — — — — — — — (138)Issuance of 7-3⁄4%
Cumulative Preferred Stock 200 — (3) — — — — — — 197Issuance of Series A Fixed/Adjustable Rate
Cumulative Preferred Stock 345 — (2) — — — — — — 343Conversion of ESOP Preferred Stock (2) — 2 — — — — — — —Issuance of common stock — — 97 — — — — 133 — 230Repurchases of common stock — — — — — — — (1,133) — (1,133)Retirement of treasury stock — — (4) (161) — — — 165 — —Compensation payable in common stock — — 34 — 445 — — 117 (150) 446ESOP shares allocated, at cost — — — — — — 11 — — 11Translation adjustments — — — — — (2) — — — (2)
BALANCE AT FISCAL YEAR-END 1996 $ 1,223 $ 6 $ 3,589 $ 7,477 $ 1,495 $ (11) $ (78) $ (1,005) $ (994) $ 11,702Net income — — — 2,586 — — — — — 2,586Dividends — — — (387) — — — — — (387)Redemption of 8.88%
Cumulative Preferred Stock (195) — — — — — — — — (195)Redemption of 8-3⁄4%
Cumulative Preferred Stock (150) — — — — — — — — (150)Conversion of ESOP Preferred Stock (2) — (1) — — — — 3 — —Issuance of common stock — — (22) — — — — 246 — 224Repurchases of common stock — — — — — — — (124) — (124)Compensation payable in common stock — — 243 — 186 — — 278 (343) 364ESOP shares allocated, at cost — — — — — — 10 — — 10Retirement of treasury stock — — (6) (265) — — — 271 — —Translation adjustments — — — — — 2 — — — 2Issuance of common stock in connection
with Lombard acquisition — — 14 — — — — 49 — 63Adjustment for change in
Dean Witter Discover’s year-end — — (90) (81) — — — 32 — (139)
* FIFTY-EIGHT *
MORGAN STANLEY DEAN WITTER * 1998 ANNUAL REPORT
CONSOL IDATED STATEMENTS OF CHANGES IN SHAREHOLDERS ’ EQU ITY

NoteReceivableRelated to
Sale of Common CommonEmployee Cumulative Preferred Stock Held Stock Issued
Preferred Common Paid-in Retained Stock Translation Stock to in Treasury to Employee(dollars in millions) Stock Stock Capital Earnings Trust Adjustments ESOP at Cost Trust Total
BALANCE AT NOVEMBER 30, 1997 $ 876 $ 6 $ 3,727 $ 9,330 $ 1,681 $ (9) $ (68) $ (250) $ (1,337) $ 13,956Net income — — — 3,276 — — — — — 3,276Dividends — — — (526) — — — — — (526)Redemption of 7-3⁄8%
Cumulative Preferred Stock (200) — — — — — — — — (200)Conversion of ESOP Preferred Stock (2) — (12) — — — — 14 — —Issuance of common stock — — (210) — — — — 417 — 207Repurchases of common stock — — — — — — — (2,925) — (2,925)Compensation payable in
common stock — — 241 — 232 — — 42 (189) 326ESOP shares allocated, at cost — — — — — — 8 — — 8Translation adjustments — — — — — (3) — — — (3)
BALANCE AT NOVEMBER 30, 1998 $ 674 $ 6 $ 3,746 $ 12,080 $ 1,913 $ (12) $ (60) $ (2,702) $ (1,526) $ 14,119
See Notes to Consolidated Financial Statements.
* FIFTY-NINE *
MORGAN STANLEY DEAN WITTER * 1998 ANNUAL REPORT
INTRODUCTION AND BASIS OF PRESENTATION
THE MERGER
On May 31, 1997, Morgan Stanley Group Inc. (“Morgan Stanley”)
was merged with and into Dean Witter, Discover & Co. (“Dean Witter
Discover”) (the “Merger”). At that time, Dean Witter Discover
changed its corporate name to Morgan Stanley, Dean Witter, Discover
& Co. (“MSDWD”). In conjunction with the Merger, MSDWD issued
260,861,078 shares of its common stock, as each share of Morgan
Stanley common stock then outstanding was converted into 1.65
shares of MSDWD’s common stock (the “Exchange Ratio”). In addi-
tion, each share of Morgan Stanley preferred stock was converted into
one share of a corresponding series of preferred stock of MSDWD.
The Merger was treated as a tax-free exchange.
On March 24, 1998, MSDWD changed its corporate
name to Morgan Stanley Dean Witter & Co. (the “Company”).
THE COMPANY
The consolidated financial statements include the accounts of the
Company and its U.S. and international subsidiaries, including
Morgan Stanley & Co. Incorporated (“MS&Co.”), Morgan Stanley &
Co. International Limited (“MSIL”), Morgan Stanley Japan Limited
(“MSJL”), Dean Witter Reynolds Inc. (“DWR”), Morgan Stanley
Dean Witter Advisors Inc. (formerly known as Dean Witter InterCapital
Inc.) and NOVUS Credit Services Inc.
The Company, through its subsidiaries, provides a
wide range of financial and securities services on a global basis and
provides credit and transaction services nationally. Its Securities and
Asset Management businesses include securities underwriting, dis-
tribution and trading; merger, acquisition, restructuring, real estate,
project finance and other corporate finance advisory activities; asset
management; private equity and other principal investment activi-
ties; brokerage and research services; the trading of foreign exchange
and commodities as well as derivatives on a broad range of asset
categories, rates and indices; and securities lending. The Company’s
Credit and Transaction Services businesses include the issuance of
the Discover® Card and other proprietary general purpose credit
cards, the operation of the Discover/NOVUS® Network, a proprietary
1 network of merchant and cash access locations, and direct-marketed
activities such as the online securities services offered by Discover
Brokerage Direct, Inc. The Company’s services are provided to a large
and diversified group of clients and customers, including corpora-
tions, governments, financial institutions and individuals.
BASIS OF FINANCIAL INFORMATION
The consolidated financial statements give retroactive effect to the
Merger, which was accounted for as a pooling of interests. The
pooling of interests method of accounting requires the restatement
of all periods presented as if Dean Witter Discover and Morgan
Stanley had always been combined. The consolidated statement of
changes in shareholders’ equity reflects the accounts of the Company
as if the preferred and additional common stock had been issued dur-
ing all of the periods presented.
Prior to the consummation of the Merger, Dean Witter
Discover’s year ended on December 31 and Morgan Stanley’s fiscal
year ended on November 30. Subsequent to the Merger, the Company
adopted a fiscal year-end of November 30. In recording the pooling
of interests combination, Dean Witter Discover’s financial statements
for the year ended December 31, 1996 were combined with Morgan
Stanley’s financial statements for the fiscal year ended November 30,
1996 (on a combined basis, “fiscal 1996”). The Company’s results
for the 12 months ended November 30, 1998 (“fiscal 1998”) and
November 30, 1997 (“fiscal 1997”) reflect the change in fiscal
year-end. Fiscal 1997 includes the results of Dean Witter Discover that
were restated to conform with the new fiscal year-end date. The
Company’s results of operations for fiscal 1997 and fiscal 1996
include the month of December 1996 for Dean Witter Discover.
The consolidated financial statements are prepared in
accordance with generally accepted accounting principles, which
require management to make estimates and assumptions regarding
certain trading inventory valuations, consumer loan loss levels, the
potential outcome of litigation and other matters that affect the con-
solidated financial statements and related disclosures. Management
believes that the estimates utilized in the preparation of the con-
MORGAN STANLEY DEAN WITTER * 1998 ANNUAL REPORT
* SIXTY *
NOTES TO CONSOL IDATED F INANC IAL STATEMENTS

solidated financial statements are prudent and reasonable. Actual
results could differ materially from these estimates.
Certain reclassifications have been made to prior-year
amounts to conform to the current presentation. All material inter-
company balances and transactions have been eliminated.
SUMMARY OF SIGNIFICANT ACCOUNTING POLICIES
CONSOLIDATED STATEMENTS OF CASH FLOWS
For purposes of these statements, cash and cash equivalents con-
sist of cash and highly liquid investments not held for resale with
maturities, when purchased, of three months or less.
In connection with the fiscal 1997 purchase of Discover
Brokerage Direct, Inc. (formerly Lombard Brokerage, Inc.), the Company
issued 1.9 million shares of common stock having a fair value on the
date of acquisition of approximately $63 million. In connection with
the purchase of Miller Anderson & Sherrerd, LLP (“MAS”) in fiscal
1996, the Company issued approximately $66 million of notes
payable, as well as 3.3 million shares of common stock having a fair
value on the date of acquisition of approximately $83 million. In addi-
tion, in connection with the purchase in fiscal 1996 of VK/AC Holding,
Inc., the parent of Van Kampen American Capital, Inc., the Company
assumed approximately $162 million of long-term debt.
CONSUMER LOANS
Consumer loans, which consist primarily of credit card and other con-
sumer installment loans, are reported at their principal amounts out-
standing, less applicable allowances. Interest on consumer loans is
credited to income as earned.
Interest is accrued on credit card loans until the date
of charge-off, which generally occurs at the end of the month dur-
ing which an account becomes 180 days past due, except in the case
of bankruptcies and fraudulent transactions, which are charged off
earlier. The interest portion of charged-off credit card loans is writ-
2
ten off against interest revenue. Origination costs related to the
issuance of credit cards are charged to earnings over periods not
exceeding 12 months.
ALLOWANCE FOR CONSUMER LOAN LOSSES
The allowance for consumer loan losses is a significant estimate that
is regularly evaluated by management for adequacy on a portfolio-
by-portfolio basis and is established through a charge to the provi-
sion for loan losses. The evaluations take into consideration factors
such as changes in the nature and volume of the loan portfolio, over-
all portfolio quality, review of specific problem loans and current eco-
nomic conditions that may affect the borrower’s ability to pay.
The Company uses the results of these evaluations to
provide an allowance for loan losses. The exposure for credit losses
for owned loans is influenced by the performance of the portfolio and
other factors discussed above, with the Company absorbing all
related losses. The exposure for credit losses for securitized loans
is represented by the Company retaining a contingent risk based on
the amount of credit enhancement provided.
SECURITIZATION OF CONSUMER LOANS
The Company periodically sells consumer loans through asset secu-
ritizations and continues to service these loans. In accordance with
Statement of Financial Accounting Standards (“SFAS”) No. 125,
“Accounting for Transfers and Servicing of Financial Assets and
Extinguishments of Liabilities” (“SFAS No. 125”), the present value
of the future net servicing revenues which the Company estimates
that it will receive over the term of the securitized loans is recognized
in income as the loans are securitized. A corresponding asset also
is recorded and then amortized as a charge to income over the
term of the securitized loans, with actual net servicing revenues con-
tinuing to be recognized in income as they are earned. The impact
of recognizing the present value of estimated future net servicing rev-
enues as loans are securitized has not been material to the consol-
idated statements of income.
* SIXTY-ONE *
MORGAN STANLEY DEAN WITTER * 1998 ANNUAL REPORT

FINANCIAL INSTRUMENTS USED
FOR TRADING AND INVESTMENT
Financial instruments, including derivatives, used in the Company’s
trading activities are recorded at fair value, and unrealized gains and
losses are reflected in trading revenues. Interest and dividend rev-
enue and interest expense arising from financial instruments used in
trading activities are reflected in the consolidated statements of
income as interest and dividend revenue or interest expense. The fair
values of the trading positions generally are based on listed market
prices. If listed market prices are not available or if liquidating the
Company’s positions would reasonably be expected to impact mar-
ket prices, fair value is determined based on other relevant factors,
including dealer price quotations and price quotations for similar
instruments traded in different markets, including markets located
in different geographic areas. Fair values for certain derivative con-
tracts are derived from pricing models which consider current mar-
ket and contractual prices for the underlying financial instruments
or commodities, as well as time value and yield curve or volatility fac-
tors underlying the positions. Purchases and sales of financial instru-
ments are recorded in the accounts on trade date. Unrealized gains
and losses arising from the Company’s dealings in over-the-counter
(“OTC”) financial instruments, including derivative contracts related
to financial instruments and commodities, are presented in the
accompanying consolidated statements of financial condition on a net-
by-counterparty basis, when appropriate.
Equity securities purchased in connection with private
equity and other principal investment activities initially are carried
in the consolidated financial statements at their original costs. The
carrying value of such equity securities is adjusted when changes in
the underlying fair values are readily ascertainable, generally as evi-
denced by listed market prices or transactions which directly affect
the value of such equity securities. Downward adjustments relating
to such equity securities are made in the event that the Company
determines that the eventual realizable value is less than the car-
rying value. The carrying value of investments made in connection
with principal real estate activities which do not involve equity
securities are adjusted periodically based on independent appraisals,
estimates prepared by the Company of discounted future cash flows
of the underlying real estate assets or other indicators of fair value.
Loans made in connection with private equity and
investment banking activities are carried at cost plus accrued inter-
est less reserves, if deemed necessary, for estimated losses.
FINANCIAL INSTRUMENTS USED
FOR ASSET AND LIABILITY MANAGEMENT
The Company has entered into various contracts as hedges against
specific assets, liabilities or anticipated transactions. These contracts
include interest rate swaps, foreign exchange forwards and foreign
currency swaps. The Company uses interest rate and currency swaps
to manage the interest rate and currency exposure arising from cer-
tain borrowings and to match the repricing characteristics of consumer
loans with those of the borrowings that fund these loans. For contracts
that are designated as hedges of the Company’s assets and liabili-
ties, gains and losses are deferred and recognized as adjustments to
interest revenue or expense over the remaining life of the underlying
assets or liabilities. For contracts that are hedges of asset securiti-
zations, gains and losses are recognized as adjustments to servicing
fees. Gains and losses resulting from the termination of hedge con-
tracts prior to their stated maturity are recognized ratably over the
remaining life of the instrument being hedged. The Company also uses
foreign exchange forward contracts to manage the currency exposure
relating to its net monetary investment in non-U.S. dollar functional
currency operations. The gain or loss from revaluing these contracts
is deferred and reported within cumulative translation adjustments
in shareholders’ equity, net of tax effects, with the related unrealized
amounts due from or to counterparties included in receivables from
or payables to brokers, dealers and clearing organizations.
SECURITIES TRANSACTIONS
Clients’ securities transactions are recorded on a settlement date
basis with related commission revenues and expenses recorded on
trade date. Securities purchased under agreements to resell (reverse
repurchase agreements) and securities sold under agreements to
repurchase (repurchase agreements), principally government and
* SIXTY-TWO *
MORGAN STANLEY DEAN WITTER * 1998 ANNUAL REPORT

agency securities, are treated as financing transactions and are
carried at the amounts at which the securities subsequently will be
resold or reacquired as specified in the respective agreements; such
amounts include accrued interest. Reverse repurchase and repurchase
agreements are presented on a net-by-counterparty basis, when
appropriate. It is the Company’s policy to take possession of secu-
rities purchased under agreements to resell. The Company monitors
the fair value of the underlying securities as compared with the related
receivable or payable, including accrued interest, and, as necessary,
requests additional collateral. Where deemed appropriate, the
Company’s agreements with third parties specify its rights to request
additional collateral.
Securities borrowed and securities loaned are carried
at the amounts of cash collateral advanced and received in connection
with the transactions. The Company measures the fair value of the
securities borrowed and loaned against the collateral on a daily
basis. Additional collateral is obtained as necessary to ensure such
transactions are adequately collateralized.
INVESTMENT BANKING
Underwriting revenues and fees for mergers and acquisitions and advi-
sory assignments are recorded when services for the transaction are
substantially completed. Transaction-related expenses are deferred
and later expensed to match revenue recognition.
OFFICE FACILITIES
Office facilities are stated at cost less accumulated depreciation and
amortization. Depreciation and amortization of buildings and lease-
hold improvements are provided principally by the straight-line
method, while depreciation and amortization of furniture, fixtures and
equipment are provided by both straight-line and accelerated meth-
ods. Property and equipment are depreciated over the estimated use-
ful lives of the related assets, while leasehold improvements are
amortized over the lesser of the economic useful life of the asset or,
where applicable, the remaining term of the lease.
INCOME TAXES
Income tax expense is provided for using the asset and liability
method, under which deferred tax assets and liabilities are deter-
mined based upon the temporary differences between the financial
statement and income tax bases of assets and liabilities, using cur-
rently enacted tax rates.
EARNINGS PER SHARE
The calculations of earnings per common share are based on the
weighted average number of common shares and share equivalents
outstanding and give effect to preferred stock dividend require-
ments. All per share and share amounts reflect stock splits effected
by Dean Witter Discover and Morgan Stanley prior to the Merger, as
well as the additional shares issued to Morgan Stanley sharehold-
ers pursuant to the Exchange Ratio.
As of December 1, 1997, the Company adopted SFAS
No. 128, “Earnings per Share” (“SFAS No. 128”). SFAS No. 128
replaces the previous earnings per share (“EPS”) categories of pri-
mary and fully diluted with “basic EPS,” which reflects no dilution
from common stock equivalents, and “diluted EPS,” which reflects
dilution from common stock equivalents and other dilutive securities
based on the average price per share of the Company’s common stock
during the period. The EPS amounts of prior periods have been
restated in accordance with SFAS No. 128. The adoption of SFAS No.
128 has not had a material effect on the Company’s EPS calculations.
CARDMEMBER REWARDS
Cardmember rewards, primarily the Cashback Bonus® award, pursuant
to which the Company annually pays Discover Cardmembers and
Private Issue® Cardmembers a percentage of their purchase amounts
ranging up to 1% (up to 2% for the Private Issue Card), are based
upon a cardmember’s level of annual purchases. The liability for card-
member rewards expense, included in other liabilities and accrued
expenses, is accrued at the time that qualified cardmember trans-
actions occur and is calculated on an individual cardmember basis.
* SIXTY-THREE *
MORGAN STANLEY DEAN WITTER * 1998 ANNUAL REPORT

STOCK-BASED COMPENSATION
SFAS No. 123, “Accounting for Stock-Based Compensation” encour-
ages, but does not require, companies to record compensation cost
for stock-based employee compensation plans at fair value. The
Company has elected to continue to account for its stock-based com-
pensation plans using the intrinsic value method prescribed by
Accounting Principles Board Opinion No. 25, “Accounting for Stock
Issued to Employees” (“APB No. 25”). Under the provisions of
APB No. 25, compensation cost for stock options is measured as the
excess, if any, of the quoted market price of the Company’s common
stock at the date of grant over the amount an employee must pay
to acquire the stock.
TRANSLATION OF FOREIGN CURRENCIES
Assets and liabilities of operations having non-U.S. dollar functional
currencies are translated at year-end rates of exchange, and the
income statements are translated at weighted average rates of
exchange for the year. In accordance with SFAS No. 52, “Foreign
Currency Translation,” gains or losses resulting from translating for-
eign currency financial statements, net of hedge gains or losses and
related tax effects, are reflected in cumulative translation adjustments,
a separate component of shareholders’ equity. Gains or losses result-
ing from foreign currency transactions are included in net income.
GOODWILL AND OTHER INTANGIBLE ASSETS
Goodwill and other intangible assets are amortized on a straight-line
basis over periods from five to 40 years, generally not exceeding 25
years, and are periodically evaluated for impairment. At November
30, 1998, goodwill of approximately $1.2 billion was included in
the Company’s consolidated statements of financial condition as a
component of Other Assets.
ACCOUNTING CHANGE
In the fourth quarter of fiscal 1998, the Company adopted American
Institute of Certified Public Accountants (“AICPA”) Statement of
Position 98-5, “Reporting on the Costs of Start-Up Activities” (“SOP
98-5”), with respect to the accounting for offering costs paid by invest-
ment advisors of closed-end funds where such costs are not specif-
ically reimbursed through separate advisory contracts. In accordance
with SOP 98-5 and per an announcement by the Financial Accounting
Standards Board (“FASB”) staff in September 1998, such costs are
to be considered start-up costs and expensed as incurred. Prior to the
adoption of SOP 98-5, the Company deferred such costs and amor-
tized them over the life of the fund. The Company recorded a charge
to earnings for the cumulative effect of the accounting change as of
December 1, 1997, of $117 million, net of taxes of $79 million. The
first three quarters of fiscal 1998 have been retroactively restated to
reflect this change (see Note 18). The effect of adopting these pro-
visions on the Company’s income before the cumulative effect of the
accounting change for fiscal year 1998 was a decrease of $24 mil-
lion, net of taxes. The effect on diluted and basic earnings per share
was $0.04. The pro forma effect on net income for fiscal years
1997 and 1996 would not have been material.
NEW ACCOUNTING PRONOUNCEMENTS
As of January 1, 1998, the Company adopted SFAS No. 127,
“Deferral of the Effective Date of Certain Provisions of FASB
Statement No. 125,” which was effective for transfers and pledges
of certain financial assets and collateral made after December 31,
1997. The adoption of SFAS No. 127 required the recognition of
assets and liabilities on the Company’s consolidated statement of
financial condition related to certain securities provided and received
as collateral. At November 30, 1998, the Company recorded an oblig-
ation to return securities received as collateral of $6,636 million.
The related collateral assets were recorded among various captions
included in the Company’s consolidated statement of financial con-
dition. After giving effect to reclassifications, the net increase in total
assets and total liabilities was $2,089 million.
In June 1997, the FASB issued SFAS No. 130,
“Reporting Comprehensive Income” and SFAS No. 131, “Disclosures
about Segments of an Enterprise and Related Information.” These
statements, which are effective for fiscal years beginning after
* SIXTY-FOUR *
MORGAN STANLEY DEAN WITTER * 1998 ANNUAL REPORT

December 15, 1997, establish standards for the reporting and pres-
entation of comprehensive income and the disclosure requirements
related to segments.
In February 1998, the FASB issued SFAS No. 132,
“Employers’ Disclosures about Pensions and Other Postretirement
Benefits,” which revises and standardizes pension and other postre-
tirement benefit plan disclosures that are to be included in the
employers’ financial statements. SFAS No. 132 does not change the
measurement or recognition rules for pensions and other postre-
tirement benefit plans and is effective for fiscal years beginning after
December 15, 1997.
In June 1998, the FASB issued SFAS No. 133,
“Accounting for Derivative Instruments and Hedging Activities,”
which establishes accounting and reporting standards for derivative
instruments, including certain derivative instruments embedded in
other contracts, and for hedging activities. The statement is effec-
tive for fiscal years beginning after June 15, 1999. The Company
is in the process of evaluating the impact of adopting SFAS No. 133.
In July 1998, the Emerging Issues Task Force (“EITF”)
reached a consensus on EITF Issue 97-14, “Accounting for Deferred
Compensation Arrangements Where Amounts Earned Are Held in a
Rabbi Trust and Invested” (“EITF 97-14”). Under EITF 97-14,
assets of the rabbi trust are to be consolidated with those of the
employer, and the value of the employer’s stock held in the rabbi trust
should be classified in shareholders’ equity and generally accounted
for in a manner similar to treasury stock. The Company therefore has
included its obligations under certain deferred compensation plans
in employee stock trust. Shares that the Company has issued to the
rabbi trusts are recorded in common stock issued to employee trust.
Both employee stock trust and common stock issued to employee trust
are components of shareholders’ equity. The adoption of EITF 97-14
did not result in any change to the Company’s consolidated statement
of income, total assets, total liabilities or total shareholders’ equity.
CONSUMER LOANS
Consumer loans were as follows:
NOV. 30, NOV. 30,(dollars in millions) 1998 1997
Credit card $15,993 $20,914Other consumer installment 3 3
15,996 20,917Less:
Allowance for loan losses 787 884Consumer loans, net $15,209 $20,033
Activity in the allowance for consumer loan losses was as follows:
FISCAL fiscal fiscal(dollars in millions) 1998 1997 1996
Balance beginning of period $ 884 $ 781)(2) $ 709
Additions:Provision for loan losses 1,173 1,493 1,214Purchase of loan portfolios 1 — 4Total additions 1,174 1,493 1,218Deductions:Charge-offs 1,423 1,639 1,182Recoveries (170) (196) (155)Net charge-offs 1,253 1,443 1,027Other(1) (18) 53 (98)Balance end of period $ 787 $ 884 $ 802
(1)These amounts primarily reflect net transfers related to asset securitizations and the sale ofconsumer loans associated with SPS, Prime Option and BRAVO (see Note 17).
(2) Beginning balance differs from the fiscal 1996 end-of-period balance due to theCompany’s change in fiscal year-end.
Interest accrued on loans subsequently charged off, recorded as a
reduction of interest revenue, was $199 million, $301 million and
$181 million in fiscal 1998, 1997 and 1996, respectively. The
amounts charged off in fiscal 1998 include only interest, whereas
amounts in fiscal 1997 and 1996 also include cardmember fees.
At November 30, 1998 and 1997, $3,999 million and
$5,385 million of the Company’s consumer loans had minimum con-
tractual maturities of less than one year. Because of the uncertainty
3
* SIXTY-FIVE *
MORGAN STANLEY DEAN WITTER * 1998 ANNUAL REPORT

regarding consumer loan repayment patterns, which historically
have been higher than contractually required minimum payments,
this amount may not necessarily be indicative of the Company’s actual
consumer loan repayments.
At November 30, 1998, the Company had commit-
ments to extend credit in the amount of $170.5 billion. Commitments
to extend credit arise from agreements to extend to customers
unused lines of credit on certain credit cards provided there is no
violation of conditions established in the related agreement. These
commitments, substantially all of which the Company can terminate
at any time and which do not necessarily represent future cash
requirements, are periodically reviewed based on account usage and
customer creditworthiness.
The Company received proceeds from asset securiti-
zations of $4,466 million, $2,783 million and $4,528 million in fis-
cal 1998, 1997 and 1996, respectively. The uncollected balances
of consumer loans sold through asset securitizations were $16,506
million and $15,033 million at November 30, 1998 and 1997.
The Company uses interest rate exchange agreements
to hedge the risk from changes in interest rates on servicing fee rev-
enues (which are derived from loans sold through asset securitizations).
Gains and losses from these agreements are recognized as adjustments
to servicing fees.
The estimated fair value of the Company’s consumer
loans approximated carrying value at November 30, 1998 and
1997. The Company’s consumer loan portfolio, including securitized
loans, is geographically diverse, with a distribution approximating that
of the population of the United States.
DEPOSITS
Deposits were as follows:
NOV. 30, NOV. 30,(dollars in millions) 1998 1997
Demand, passbook and money market accounts $1,355 $1,210
Consumer certificate accounts 1,635 1,498$100,000 minimum
certificate accounts 5,207 6,285Total $8,197 $8,993
4
The weighted average interest rates of interest bearing deposits out-
standing during fiscal 1998 and 1997 were 6.2%.
At November 30, 1998 and 1997, the notional
amounts of interest rate exchange agreements that hedged deposits
outstanding were $650 million and $535 million and had fair val-
ues of $15 million and $7 million. Under these interest rate
exchange agreements, the Company primarily pays floating rates and
receives fixed rates. At November 30, 1998, the weighted average
interest rate of the Company’s deposits, including the effect of
interest rate exchange agreements, was 6.1%.
At November 30, 1998, certificate accounts maturing
over the next five years were as follows:
(dollars in millions)
1999 $2,4482000 1,5022001 1,2612002 5922003 620
The estimated fair value of the Company’s deposits, using current
rates for deposits with similar maturities, approximated carrying value
at November 30, 1998 and 1997.
SHORT-TERM BORROWINGS
At November 30, 1998 and 1997, commercial paper in the amount
of $19,643 million and $15,447 million, with weighted average
interest rates of 5.3% and 5.5%, was outstanding.
At November 30, 1998 and 1997, the notional amounts
of interest rate contracts that hedged commercial paper outstanding
were $208 million and $732 million and had fair values of $(6) mil-
lion and $(5) million. These interest rate contracts effectively converted
the commercial paper to fixed rates. These contracts had no material
effect on the weighted average interest rates of commercial paper.
At November 30, 1998 and 1997, other short-term bor-
rowings of $8,494 million and $7,167 million were outstanding. These
borrowings included bank loans, Federal Funds and bank notes.
The Company maintains a senior revolving credit
agreement with a group of banks to support general liquidity needs,
including the issuance of commercial paper (the “MSDW Facility”).
5
* SIXTY-SIX *
MORGAN STANLEY DEAN WITTER * 1998 ANNUAL REPORT

Under the terms of the MSDW Facility, the banks are committed to
provide up to $6.0 billion. The MSDW Facility contains restrictive
covenants which require, among other things, that the Company main-
tain shareholders’ equity of at least $9.1 billion at all times. The
Company believes that the covenant restrictions will not impair the
Company’s ability to pay its current level of dividends. At November
30, 1998, no borrowings were outstanding under the MSDW Facility.
Riverwoods Funding Corporation (“RFC”), an entity
included in the consolidated financial statements of the Company,
maintains a senior bank credit facility to support the issuance of
asset-backed commercial paper in the amount of $2.6 billion.
Under the terms of the asset-backed commercial paper program, cer-
tain assets of RFC were subject to a lien in the amount of $2.6 bil-
lion at November 30, 1998. RFC has never borrowed from its senior
bank credit facility.
The Company maintains a master collateral facility that
enables MS&Co. to pledge certain collateral to secure loan arrange-
ments, letters of credit and other financial accommodations (the
“MS&Co. Facility”). As part of the MS&Co. Facility, MS&Co. also
maintains a secured committed credit agreement with a group of
banks that are parties to the master collateral facility under which
such banks are committed to provide up to $1.875 billion. The credit
agreement contains restrictive covenants which require, among
other things, that MS&Co. maintain specified levels of consolidated
shareholders’ equity and Net Capital, as defined. In January 1999,
the MS&Co. Facility was renewed. At November 30, 1998, no bor-
rowings were outstanding under the MS&Co. Facility.
The Company also maintains a revolving committed
financing facility that enables MSIL to secure committed funding from
a syndicate of banks by providing a broad range of collateral under
repurchase agreements (the “MSIL Facility”). Such banks are com-
mitted to provide up to an aggregate of $1.85 billion available in 12
major currencies and, effective January 1, 1999, the euro. The facil-
ity agreements contain restrictive covenants which require, among other
things, that MSIL maintain specified levels of Shareholders’ Equity
and Financial Resources, each as defined. At November 30, 1998,
no borrowings were outstanding under the MSIL Facility.
The Company anticipates that it will utilize the MSDW
Facility, the MS&Co. Facility or the MSIL Facility for short-term fund-
ing from time to time.
* SIXTY-SEVEN *
MORGAN STANLEY DEAN WITTER * 1998 ANNUAL REPORT
LONG-TERM BORROWINGS
MATURITIES AND TERMS
Long-term borrowings at fiscal year-end consist of the following:
U.S. DOLLAR NON-U.S. DOLLAR(1) AT NOVEMBER 30
Index/Fixed Floating Floating Fixed Floating 1998 1997
(dollars in millions) Rate Rate(2) Linked Rate Rate(2) TOTAL Total
Due in fiscal 1998 $ — $ — $ — $ — $ — $ — $ 6,170Due in fiscal 1999 842 2,627 587 208 767 5,031 4,693Due in fiscal 2000 1,568 4,396 347 62 490 6,863 2,418Due in fiscal 2001 1,496 1,596 88 115 604 3,899 2,282Due in fiscal 2002 1,077 1,033 42 17 332 2,501 2,623Due in fiscal 2003 1,093 1,034 105 428 235 2,895 1,621Thereafter 4,460 899 217 642 28 6,246 4,985Total $10,536 $11,585 $1,386 $1,472 $2,456 $27,435 $24,792Weighted average
coupon at fiscal year-end 7.4% 5.7% n/a 5.4% 4.9% 6.1% 6.1%
(1) Weighted average coupon was calculated utilizing non-U.S. dollar interest rates.(2) U.S. dollar contractual floating rate borrowings bear interest based on a variety of money market indices, including London Interbank Offered Rates (“LIBOR”) and Federal Funds rates.
Non-U.S. dollar contractual floating rate borrowings bear interest based on Euro floating rates.
6

MEDIUM-TERM NOTES
Included in the table above are medium-term notes of $17,011 mil-
lion and $14,049 million at November 30, 1998 and 1997. The
effective weighted average interest rate on all medium-term notes
was 5.7% in fiscal 1998 and 5.9% in fiscal 1997. Maturities of these
notes range from fiscal 1999 through fiscal 2028.
STRUCTURED BORROWINGS
U.S. dollar index/equity linked borrowings include various structured
instruments whose payments and redemption values are linked to
the performance of a specific index (i.e., Standard & Poor’s 500),
a basket of stocks or a specific equity security. To minimize the expo-
sure resulting from movements in the underlying equity position or
index, the Company has entered into various equity swap contracts
and purchased options which effectively convert the borrowing costs
into floating rates based upon LIBOR. These instruments are included
in the preceding table at their redemption values based on the per-
formance of the underlying indices, baskets of stocks or specific
equity securities at November 30, 1998 and 1997.
OTHER BORROWINGS
Included in the Company’s long-term borrowings are subordinated
notes of $1,309 million and $1,302 million at November 30, 1998
and 1997, respectively. The effective weighted average interest
rate on these subordinated notes was 7.1% in fiscal 1998 and
7.2% in fiscal 1997. Maturities of the subordinated notes range from
fiscal 1999 to fiscal 2016.
Certain of the Company’s long-term borrowings are
redeemable prior to maturity at the option of the holder. These
notes contain certain provisions which effectively enable notehold-
ers to put the notes back to the Company and therefore are sched-
uled in the foregoing table to mature in fiscal 1999 through fiscal
2001. The stated maturities of these notes, which aggregate $1,933
million, are from fiscal 2000 to fiscal 2011.
MS&Co., a registered U.S. broker-dealer subsidiary of
the Company, has outstanding $357 million of 8.22% fixed rate sub-
ordinated Series A notes, $243 million of 8.51% fixed rate subor-
dinated Series B notes, $313 million of 6.81% fixed rate subordi-
nated Series C notes, $96 million of 7.03% fixed rate subordinated
Series D notes, $82 million of 7.28% fixed rate subordinated Series
E notes and $25 million of 7.82% fixed rate subordinated Series F
notes. These notes have maturities from 2001 to 2016. The terms
of such notes contain restrictive covenants which require, among
other things, that MS&Co. maintain specified levels of Consolidated
Tangible Net Worth and Net Capital, each as defined.
ASSET AND LIABILITY MANAGEMENT
A portion of the Company’s fixed rate long-term borrowings is used
to fund highly liquid marketable securities, short-term receivables
arising from securities transactions and consumer loans. The
Company uses interest rate swaps to more closely match the dura-
tion of these borrowings to the duration of the assets being funded
and to minimize interest rate risk. These swaps effectively convert
certain of the Company’s fixed rate borrowings into floating rate oblig-
ations. In addition, for non-U.S. dollar currency borrowings that are
not used to fund assets in the same currency, the Company has
entered into currency swaps which effectively convert the borrowings
into U.S. dollar obligations. The Company’s use of swaps for asset
and liability management reduced its interest expense and effective
average borrowing rate as follows:
FISCAL fiscal fiscal(dollars in millions) 1998 1997 1996
Net reduction in interest expense fromswaps for the fiscal year $48 $21 $29
Weighted average coupon of long-term borrowings at fiscal year-end(1) 6.1% 6.1)% 6.2%
Effective average borrowingrate for long-term borrowingsafter swaps at fiscal year-end(1) 5.9% 6.0)% 6.1%
(1) Included in the weighted average and effective average calculations are non-U.S. dollar interest rates.
The effective weighted average interest rate on the Company’s
index/equity linked notes, which is not included in the table above,
was 5.2% and 5.7% in fiscal 1998 and fiscal 1997, respectively,
after giving effect to the related hedges.
* SIXTY-EIGHT *
MORGAN STANLEY DEAN WITTER * 1998 ANNUAL REPORT

The table below summarizes the notional or contract
amounts of these swaps by maturity and weighted average interest
rates to be received and paid at fiscal year-end 1998. Swaps utilized
to hedge the Company’s structured borrowings are presented at
their redemption values:
* SIXTY-NINE *
MORGAN STANLEY DEAN WITTER * 1998 ANNUAL REPORT
U.S. DOLLAR NON-U.S. DOLLAR(1)
Receive Receive Receive Receive Receive Fixed Floating Floating Index/ Fixed Floating NOV. 30, NOV. 30,
Pay Pay Pay Equity Pay Pay 1998 1997(dollars in millions) Floating Fixed Floating Linked Floating Floating(2) TOTAL TOTAL
Maturing in fiscal 1998 $ — $ — $ — $ — $ — $ — $ — $ 2,744Maturing in fiscal 1999 552 100 375 587 195 372 2,181 1,972Maturing in fiscal 2000 1,169 400 20 347 62 243 2,241 638Maturing in fiscal 2001 1,384 80 5 88 110 514 2,181 1,082Maturing in fiscal 2002 720 200 — 42 17 — 979 831Maturing in fiscal 2003 500 — — 105 428 219 1,252 1,029Thereafter 3,020 400 — 217 620 10 4,267 3,411
Total $7,345 $1,180 $400 $1,386 $1,432 $1,358 $13,101 $11,707Weighted average
at fiscal year-end(3)
Receive rate 6.53% 5.25% 4.88% n/a 5.24% 4.77%Pay rate 5.59% 6.22% 5.65% n/a 4.94% 5.44%
(1)The differences between the receive rate and the pay rate may reflect differences in the rate of interest associated with the underlying currency.(2) These amounts include currency swaps used to effectively convert borrowings denominated in one currency into obligations denominated in another currency.(3) The table was prepared under the assumption that interest rates remain constant at year-end levels.The variable interest rates to be received or paid will change to the extent that rates fluctu-
ate. Such changes may be substantial.Variable rates presented generally are based on LIBOR or Treasury bill rates.
As noted above, the Company uses interest rate and currency swaps
to modify the terms of its existing borrowings. Activity during the peri-
ods in the notional value of the swap contracts used by the Company
for asset and liability management (and the unrecognized gain at fis-
cal year-end) is summarized in the table below:
FISCAL fiscal(dollars in millions) 1998 1997
Notional value at beginning of period $11,707 $10,189Additions 4,520 3,567Matured (2,305) (1,657)Terminated (868) (216)Effect of foreign currency translation on
non-U.S. dollar notional values and changes in redemption values on structured borrowings 47 (176)
Notional value at fiscal year-end $13,101 $11,707Unrecognized gain at fiscal year-end $ 279 $ 104
The Company also uses interest rate swaps to modify certain of its
repurchase financing agreements. The Company had interest rate
swaps with notional values of approximately $1.3 billion and $1.8
billion at November 30, 1998 and 1997, and unrecognized gains
of approximately $28 million and $13 million at November 30, 1998
and 1997, for such purpose. The unrecognized gains on these
swaps were offset by unrecognized losses on certain of the Company’s
repurchase financing agreements.
The estimated fair value of the Company’s long-term bor-
rowings approximated carrying value based on rates available to the
Company at year-end for borrowings with similar terms and maturities.
Cash paid for interest for the Company’s borrowings
and deposits approximated interest expense in fiscal 1998, 1997
and 1996.
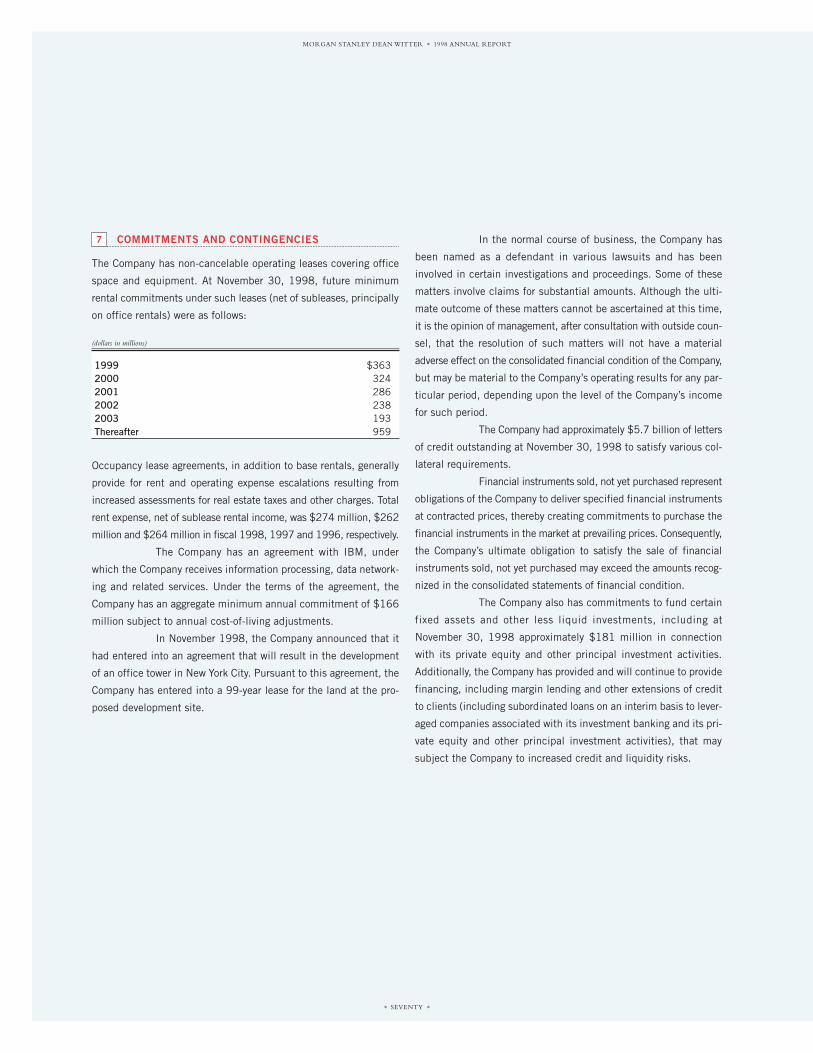
COMMITMENTS AND CONTINGENCIES
The Company has non-cancelable operating leases covering office
space and equipment. At November 30, 1998, future minimum
rental commitments under such leases (net of subleases, principally
on office rentals) were as follows:
(dollars in millions)
1999 $3632000 3242001 2862002 2382003 193Thereafter 959
Occupancy lease agreements, in addition to base rentals, generally
provide for rent and operating expense escalations resulting from
increased assessments for real estate taxes and other charges. Total
rent expense, net of sublease rental income, was $274 million, $262
million and $264 million in fiscal 1998, 1997 and 1996, respectively.
The Company has an agreement with IBM, under
which the Company receives information processing, data network-
ing and related services. Under the terms of the agreement, the
Company has an aggregate minimum annual commitment of $166
million subject to annual cost-of-living adjustments.
In November 1998, the Company announced that it
had entered into an agreement that will result in the development
of an office tower in New York City. Pursuant to this agreement, the
Company has entered into a 99-year lease for the land at the pro-
posed development site.
7 In the normal course of business, the Company has
been named as a defendant in various lawsuits and has been
involved in certain investigations and proceedings. Some of these
matters involve claims for substantial amounts. Although the ulti-
mate outcome of these matters cannot be ascertained at this time,
it is the opinion of management, after consultation with outside coun-
sel, that the resolution of such matters will not have a material
adverse effect on the consolidated financial condition of the Company,
but may be material to the Company’s operating results for any par-
ticular period, depending upon the level of the Company’s income
for such period.
The Company had approximately $5.7 billion of letters
of credit outstanding at November 30, 1998 to satisfy various col-
lateral requirements.
Financial instruments sold, not yet purchased represent
obligations of the Company to deliver specified financial instruments
at contracted prices, thereby creating commitments to purchase the
financial instruments in the market at prevailing prices. Consequently,
the Company’s ultimate obligation to satisfy the sale of financial
instruments sold, not yet purchased may exceed the amounts recog-
nized in the consolidated statements of financial condition.
The Company also has commitments to fund certain
fixed assets and other less liquid investments, including at
November 30, 1998 approximately $181 million in connection
with its private equity and other principal investment activities.
Additionally, the Company has provided and will continue to provide
financing, including margin lending and other extensions of credit
to clients (including subordinated loans on an interim basis to lever-
aged companies associated with its investment banking and its pri-
vate equity and other principal investment activities), that may
subject the Company to increased credit and liquidity risks.
* SEVENTY *
MORGAN STANLEY DEAN WITTER * 1998 ANNUAL REPORT

EARNINGS PER SHARE
Earnings per share was calculated as follows (in millions, except for
per share data):
FISCAL fiscal fiscalBASIC EPS: 1998 1997 1996
Income before cumulative effect of accounting change $3,393 $2,586 $1,980
Cumulative effect of accounting change (117) — —
Preferred stock dividend requirements (55) (66) (66)
Net income available to common shareholders $3,221 $2,520 $1,914
Weighted average common shares outstanding 576 575 573
Basic EPS before cumulative effect of accounting change $ 5.80 $ 4.38 $ 3.34
Cumulative effect of accounting change $ (0.20) — —
Basic EPS $ 5.60 $ 4.38 $ 3.34
FISCAL fiscal fiscalDILUTED EPS: 1998 1997 1996
Income before cumulative effect of accounting change $3,393 $2,586 $1,980
Cumulative effect of accounting change (117) — —
Preferred stock dividend requirements (47) (61) (62)
Net income available to common shareholders $3,229 $2,525 $1,918
Weighted average common shares outstanding 576 575 573
Effect of dilutive securities:Stock options 18 19 21ESOP convertible preferred stock 12 12 13
Weighted average common shares outstanding and common stock equivalents 606 606 607
Diluted EPS before cumulative effect of accounting change $ 5.52 $ 4.16 $ 3.16
Cumulative effect of accounting change $ (0.19) — —
Diluted EPS $ 5.33 $ 4.16 $ 3.16
8 TRADING ACTIVITIES
TRADING REVENUES
The Company’s trading activities include providing securities bro-
kerage, derivatives dealing and underwriting services to clients.
While trading activities are generated by client order flow, the
Company also takes proprietary positions based on expectations of
future market movements and conditions. The Company’s trading
strategies rely on the integrated management of its client-driven and
proprietary transactions, along with the hedging and financing of
these positions.
The Company manages its trading businesses by prod-
uct groupings and therefore has established distinct, worldwide
trading divisions having responsibility for equity, fixed income, for-
eign exchange and commodities products. Because of the inte-
grated nature of the markets for such products, each product area
trades cash instruments as well as related derivative products (i.e.,
options, swaps, futures, forwards and other contracts with respect
to such underlying instruments or commodities). Revenues related
to principal trading are summarized below by trading division:
FISCAL fiscal fiscal(dollars in millions) 1998 1997 1996
Equities $2,056 $1,310 $1,181Fixed Income 455 1,187 1,172Foreign Exchange 587 500 169Commodities 193 194 137Total principal trading revenues $3,291 $3,191 $2,659
Interest revenue and expense are integral components of trading activ-
ities. In assessing the profitability of trading activities, the Company
views net interest and principal trading revenues in the aggregate.
The Company’s trading portfolios are managed with a
view toward the risk and profitability of the portfolios to the Company.
The nature of the equities, fixed income, foreign exchange and
commodities activities conducted by the Company, including the use
of derivative products in these businesses, and the market, credit
and concentration risk management policies and procedures cover-
ing these activities are discussed below.
9
* SEVENTY-ONE *
MORGAN STANLEY DEAN WITTER * 1998 ANNUAL REPORT

EQUITIES
The Company makes markets and trades in the global secondary mar-
kets for equities and convertible debt and is a dealer in equity war-
rants, exchange traded and OTC equity options, index futures, equity
swaps and other sophisticated equity derivatives. The Company’s
activities as a dealer primarily are client-driven, with the objective
of meeting clients’ needs while earning a spread between the pre-
miums paid or received on its contracts with clients and the cost of
hedging such transactions in the cash or forward market or with other
derivative transactions. The Company limits its market risk related
to these contracts, which stems primarily from underlying equity/index
price and volatility movements, by employing a variety of hedging
strategies, such as delta hedging (delta is a measure of a derivative
contract’s price movement based on the movement of the price of
the security or index underlying the contract). The Company also takes
proprietary positions in the global equity markets by using deriva-
tives, most commonly futures and options, in addition to cash posi-
tions, intending to profit from market price and volatility movements
in the underlying equities or indices positioned.
Equity option contracts give the purchaser of the con-
tract the right to buy (call) or sell (put) the equity security or index
underlying the contract at an agreed-upon price (strike price) dur-
ing or at the conclusion of a specified period of time. The seller
(writer) of the contract is subject to market risk, and the purchaser
is subject to market risk (to the extent of the premium paid) and credit
risk. Equity swap contracts are contractual agreements whereby
one counterparty receives the appreciation (or pays the depreciation)
on an equity investment in return for paying another rate, often based
upon equity index movements or interest rates. The counterparties
to the Company’s equity transactions include commercial banks,
investment banks, broker-dealers, investment funds and
industrial companies.
FIXED INCOME
The Company is a market-maker for U.S. and non-U.S. government
securities, corporate bonds, money market instruments, medium-term
notes and Eurobonds, high-yield securities, emerging market secu-
rities, mortgage and other asset-backed securities, preferred stock
and tax-exempt securities. In addition, the Company is a dealer in
interest rate and currency swaps and other related derivative prod-
ucts, OTC options on U.S. and non-U.S. government bonds and mort-
gage-backed forward agreements (“TBA”), options and swaps. In this
capacity, the Company facilitates asset and liability management for
its customers in interest rate and currency swaps and related prod-
ucts and OTC government bond options.
Swaps used in fixed income trading are, for the most
part, contractual agreements to exchange interest payment streams
(i.e., an interest rate swap may involve exchanging fixed for float-
ing interest payments) or currencies (i.e., a currency swap may
involve exchanging yen for U.S. dollars in one year at an agreed-upon
exchange rate). The Company profits by earning a spread between
the premium paid or received for these contracts and the cost of hedg-
ing such contracts. The Company seeks to manage the market risk
of its swap portfolio, which stems from interest rate and currency
movements and volatility, by using modeling that quantifies the sen-
sitivity of its portfolio to movements in interest rates and currencies
and by adding positions to or selling positions from its portfolio as
needed to minimize such sensitivity. Typically, the Company adjusts
its positions by entering into additional swaps or interest rate and
foreign currency futures or foreign currency forwards and by pur-
chasing or selling additional underlying government bonds. The
Company manages the risk related to its option portfolio by using a
variety of hedging strategies such as delta hedging, which includes
the use of futures and forward contracts to hedge market risk. The
Company also is involved in using debt securities to structure products
with multiple risk/return factors designed to suit investor objectives.
The Company is an underwriter of and a market-maker
in mortgage-backed securities and collateralized mortgage obliga-
tions (“CMO”) as well as commercial, residential and real estate loan
products. The Company also structures mortgage-backed swaps for
its clients, enabling them to derive the cash flows from an under-
lying mortgage-backed security without purchasing the cash position.
The Company earns the spread between the premium inherent in the
swap and the cost of hedging the swap contract through the use of
cash positions or TBA contracts. The Company also uses TBAs in its
* SEVENTY-TWO *
MORGAN STANLEY DEAN WITTER * 1998 ANNUAL REPORT
role as a dealer in mortgage-backed securities and facilitates cus-
tomer trades by taking positions in the TBA market. Typically, these
positions are hedged by offsetting TBA contracts or underlying cash
positions. The Company profits by earning the bid-offer spread on
such transactions. Further, the Company uses TBAs to ensure deliv-
ery of underlying mortgage-backed securities in its CMO issuance
business. As is the case with all mortgage-backed products, market
risk associated with these instruments results from interest rate fluc-
tuations and changes in mortgage prepayment speeds. The coun-
terparties to the Company’s fixed income transactions include
investment advisors, commercial banks, insurance companies,
investment funds and industrial companies.
FOREIGN EXCHANGE
The Company is a market-maker in a number of foreign currencies.
In this business, it actively trades currencies in the spot and forward
markets earning a dealer spread. The Company seeks to manage its
market risk by entering into offsetting positions. The Company con-
ducts an arbitrage business in which it seeks to profit from ineffi-
ciencies between the futures, spot and forward markets. The Company
also makes a market in foreign currency options. This business
largely is client-driven and involves the purchasing and writing of
European and American style options and certain sophisticated
products to meet specific client needs. The Company profits in this
business by earning spreads between the options’ premiums and the
cost of the hedging of such positions. The Company limits its mar-
ket risk by using a variety of hedging strategies, including the buy-
ing and selling of the currencies underlying the options based upon
the options’ delta equivalent. Foreign exchange option contracts give
the purchaser of the contract the right to buy (call) or sell (put) the
currency underlying the contract at an agreed-upon strike price at
or over a specified period of time. Forward contracts and futures rep-
resent commitments to purchase or sell the underlying currencies
at a specified future date at a specified price. The Company also takes
proprietary positions in currencies to profit from market price and
volatility movements in the currencies positioned.
The majority of the Company’s foreign exchange busi-
ness relates to major foreign currencies such as deutsche marks, yen,
pound sterling, French francs, Swiss francs, Italian lire, Canadian
dollars and, effective January 1, 1999, the euro. The balance of the
business covers a broad range of other currencies. The counterpar-
ties to the Company’s foreign exchange transactions include com-
mercial banks, investment banks, broker-dealers, investment funds
and industrial companies.
COMMODITIES
The Company, as a major participant in the world commodities
markets, trades in physical precious, base and platinum group met-
als, electricity, energy products (principally oil, refined oil products
and natural gas) as well as a variety of derivatives related to these
commodities such as futures, forwards and exchange traded and OTC
options and swaps. Through these activities, the Company provides
clients with a ready market to satisfy end users’ current raw mate-
rial needs and facilitates their ability to hedge price fluctuations
related to future inventory needs. The former activity at times
requires the positioning of physical commodities. Derivatives on those
commodities, such as futures, forwards and options, often are used
to hedge price movements in the underlying physical inventory. The
Company profits as a market-maker in physical commodities by
capturing the bid-offer spread inherent in the physical markets.
To facilitate hedging for its clients, the Company often
is required to take positions in the commodity markets in the form
of forward, option and swap contracts involving oil, natural gas, pre-
cious and base metals, and electricity. The Company generally
hedges these positions by using a variety of hedging techniques such
as delta hedging, whereby the Company takes positions in the phys-
ical markets and/or positions in other commodity derivatives such
as futures and forwards to offset the market risk in the underlying
derivative. The Company profits from this business by earning a
spread between the premiums paid or received for these derivatives
and the cost of hedging such derivatives.
* SEVENTY-THREE *
MORGAN STANLEY DEAN WITTER * 1998 ANNUAL REPORT

The Company also maintains proprietary trading posi-
tions in commodity derivatives, including futures, forwards and
options in addition to physical commodities, to profit from price and
volatility movements in the underlying commodities markets.
Forward, option and swap contracts on commodities
are structured similarly to like-kind derivative contracts for cash finan-
cial instruments. The counterparties to OTC commodity contracts
include precious metals producers, refiners and consumers as well
as shippers, central banks, and oil, gas and electricity producers.
The following discussions of risk management, mar-
ket risk, credit risk, concentration risk and customer activities relate
to the Company’s trading activities.
RISK MANAGEMENT
Risk management at the Company is a multi-faceted process with
independent oversight which requires constant communication,
judgment and knowledge of specialized products and markets. The
Company’s senior management takes an active role in the risk man-
agement process and has developed policies and procedures that
require specific administrative and business functions to assist in
the identification, assessment and control of various risks. In recog-
nition of the increasingly varied and complex nature of the global
financial services business, the Company’s risk management poli-
cies and procedures are evolutionary in nature and are subject to
ongoing review and modification. Many of the Company’s risk man-
agement and control practices are subject to periodic review by the
Company’s internal auditors as well as to interactions with various
regulatory authorities.
The Management Committee, composed of the
Company’s most senior officers, establishes the overall risk man-
agement policies for the Company and reviews the Company’s per-
formance relative to these policies. The Management Committee has
created several Risk Committees to assist it in monitoring and
reviewing the Company’s risk management practices. These Risk
Committees, among other matters, review the general framework, lev-
els and monitoring procedures relating to the Company’s market and
credit risk profile, sales practices, legal enforceability and operational
and systems risks. The Controllers, Treasury, Law, Compliance and
Governmental Affairs and Firm Risk Management Departments,
which are all independent of the Company’s business units, assist
senior management and the Risk Committees in monitoring and con-
trolling the Company’s risk profile. In addition, the Internal Audit
Department, which also reports to senior management, periodically
examines and evaluates the Company’s operations and control envi-
ronment. The Company continues to be committed to employing qual-
ified personnel with appropriate expertise in each of its various
administrative and business areas to implement effectively the
Company’s risk management and monitoring systems and processes.
MARKET RISK
Market risk refers to the risk that a change in the level of one or more
market prices, rates, indices, volatilities, correlations or other mar-
ket factors, such as liquidity, will result in losses for a specified posi-
tion or portfolio.
The Company manages the market risk associated with
its trading activities on a Company-wide basis, on a trading division
level worldwide and on an individual product basis. Market risk lim-
its have been approved for the Company and each trading division of
the Company worldwide. Discrete market risk limits are assigned to
trading divisions and trading desks and, as appropriate, products
and regions, that are compatible with the trading division limits.
Trading division risk managers, desk risk managers and the Firm
Risk Management Department all monitor market risk measures
against limits and report major market and position events to
senior management.
The Firm Risk Management Department independently
reviews the Company’s trading portfolios on a regular basis from a
market risk perspective utilizing Value-at-Risk and other quantita-
tive and qualitative risk measurements and analyses. The Company
may use measures, such as rate sensitivity, convexity, volatility and
time decay measurements, to estimate market risk and to assess the
sensitivity of positions to changes in market conditions. Stress test-
ing, which measures the impact on the value of existing portfolios
* SEVENTY-FOUR *
MORGAN STANLEY DEAN WITTER * 1998 ANNUAL REPORT

of specified changes in market factors, for certain products is per-
formed periodically and is reviewed by trading division risk managers,
desk risk managers and the Firm Risk Management Department.
CREDIT RISK
The Company’s exposure to credit risk arises from the possibility that
a counterparty to a transaction might fail to perform under its con-
tractual commitment, which could result in the Company incurring
losses. The Company has credit guidelines which limit the Company’s
credit exposure to any one counterparty. Specific credit risk limits
based on the credit guidelines also are in place for each type of coun-
terparty (by rating category) as well as for secondary positions of high-
yield and emerging market debt.
The Credit Department administers and monitors the
credit limits among trading divisions on a worldwide basis. In addi-
tion to monitoring credit limits, the Company manages the credit
exposure relating to the Company’s trading activities by reviewing
counterparty financial soundness periodically, by entering into mas-
ter netting agreements and collateral arrangements with counter-
parties in appropriate circumstances and by limiting the duration of
exposure. In certain cases, the Company also may close out trans-
actions or assign them to other counterparties to mitigate credit risk.
CONCENTRATION RISK
The Company is subject to concentration risk by holding large posi-
tions in certain types of securities or commitments to purchase secu-
rities of a single issuer, including sovereign governments and other
entities, issuers located in a particular country or geographic area,
public and private issuers involving developing countries or issuers
engaged in a particular industry. Financial instruments owned by the
Company include U.S. government and agency securities and secu-
rities issued by other sovereign governments (principally Japan,
Germany and Italy), which, in the aggregate, represented approxi-
mately 9% of the Company’s total assets at November 30, 1998.
In addition, substantially all of the collateral held by the Company
for resale agreements or bonds borrowed, which together repre-
sented approximately 33% of the Company’s total assets at November
30, 1998, consists of securities issued by the U.S. government, fed-
eral agencies or other sovereign government obligations. Positions
taken and commitments made by the Company, including positions
taken and underwriting and financing commitments made in con-
nection with its private equity and principal investment activities,
often involve substantial amounts and significant exposure to indi-
vidual issuers and businesses, including non-investment grade
issuers. The Company seeks to limit concentration risk through the
use of the systems and procedures described in the preceding dis-
cussions of market and credit risk.
CUSTOMER ACTIVITIES
The Company’s customer activities involve the execution, settlement
and financing of various securities and commodities transactions on
behalf of customers. Customer securities activities are transacted on
either a cash or margin basis. Customer commodities activities,
which include the execution of customer transactions in commod-
ity futures transactions (including options on futures), are transacted
on a margin basis.
The Company’s customer activities may expose it to off-
balance sheet credit risk. The Company may have to purchase or sell
financial instruments at prevailing market prices in the event of the
failure of a customer to settle a trade on its original terms or in the
event cash and securities in customer margin accounts are not suf-
ficient to fully cover customer losses. The Company seeks to con-
trol the risks associated with customer activities by requiring
customers to maintain margin collateral in compliance with various
regulations and Company policies.
NOTIONAL/CONTRACT AMOUNTS
AND FAIR VALUES OF DERIVATIVES
The gross notional or contract amounts of derivative instruments and
fair value (carrying amount) of the related assets and liabilities at
November 30, 1998 and 1997, as well as the average fair value of
those assets and liabilities for fiscal 1998 and 1997, are presented
in the table which follows. Fair value represents the cost of replac-
ing these instruments and is further described in Note 2. Future
* SEVENTY-FIVE *
MORGAN STANLEY DEAN WITTER * 1998 ANNUAL REPORT

changes in interest rates, foreign currency exchange rates or the fair
values of the financial instruments, commodities or indices under-
lying these contracts may ultimately result in cash settlements
exceeding fair value amounts recognized in the consolidated state-
ments of financial condition. Assets represent unrealized gains on
purchased exchange traded and OTC options and other contracts
(including interest rate, foreign exchange and other forward contracts
and swaps) net of any unrealized losses owed to the counterparties
on offsetting positions in situations where netting is appropriate.
Similarly, liabilities represent net amounts owed to counterparties.
These amounts will vary based on changes in the fair values of under-
lying financial instruments and/or the volatility of such
underlying instruments:
* SEVENTY-SIX *
MORGAN STANLEY DEAN WITTER * 1998 ANNUAL REPORT
The gross notional or contract amounts of these instruments are indica-
tive of the Company’s degree of use of derivatives for trading purposes
but do not represent the Company’s exposure to market or credit risk.
Credit risk arises from the failure of a counterparty to perform accord-
ing to the terms of the contract. The Company’s exposure to credit
risk at any point in time is represented by the fair value of the con-
tracts reported as assets. These amounts are presented on a net-by-
counterparty basis when appropriate, but are not reported net of
collateral, which the Company obtains with respect to certain of these
transactions to reduce its exposure to credit losses. The Company mon-
itors the creditworthiness of counterparties to these transactions on
an ongoing basis and requests additional collateral when deemed nec-
essary. The Company believes the ultimate settlement of the trans-
actions outstanding at November 30, 1998 will not have a material
effect on the Company’s financial condition.
FISCAL YEAR-ENDGROSS NOTIONAL/CONTRACT AMOUNT(1)(2) FISCAL YEAR-END FAIR VALUES(3) AVERAGE FAIR VALUES(3)(4)
(dollars in billions at fiscal year-end) Assets Liabilities Assets Liabilities
1998 1997 1998 1997 1998 1997 1998 1997 1998 1997
Interest rate and currency swaps and options (including caps, floors and swap options) and other fixed
$1,719 $1,262 income securities contracts $10.1 $ 7.1 $10.4 $ 6.4 $ 9.5 $ 4.8 $ 8.6 $ 5.9Foreign exchange forward and futures
903 1,035 contracts and options 3.7 4.6 4.1 4.2 4.6 3.4 4.4 3.2Equity securities contracts (including
equity swaps, futures contracts, and 107 112 warrants and options) 5.2 3.8 4.8 3.8 4.8 2.6 4.6 2.6
Commodity forwards, futures, options 91 78 and swaps 2.2 1.3 1.9 1.2 2.0 1.1 1.7 0.9
Mortgage-backed securities forward 40 42 contracts, swaps and options 0.2 0.3 — — 0.2 0.3 — —
$2,860 $2,529 Total $21.4 $17.1 $21.2 $15.6 $21.1 $12.2 $19.3 $12.6
(1)The notional amounts of derivatives have been adjusted to reflect the effects of leverage, where applicable.(2) Notional amounts include purchased and written options of $485 billion and $442 billion, respectively, at November 30, 1998, and $572 billion and $549 billion, respectively, at
November 30, 1997.(3)These amounts represent carrying value (exclusive of collateral) at November 30, 1998 and 1997, respectively, and do not include receivables or payables related to exchange traded futures contracts.(4) Amounts are calculated using a monthly average.

The remaining maturities of the Company’s swaps and
other derivative products at November 30, 1998 and 1997 are sum-
marized in the following table, showing notional values by year of
expected maturity:
* SEVENTY-SEVEN *
MORGAN STANLEY DEAN WITTER * 1998 ANNUAL REPORT
Less than 1 to 3 3 to 5 More than (dollars in billions) 1 Year Years Years 5 Years TOTAL
AT NOVEMBER 30, 1998
Interest rate and currency swaps and options (including caps, floors and swap options) and other fixed income securities contracts $ 457 $479 $371 $412 $1,719
Foreign exchange forward and futures contracts and options 892 11 — — 903Equity securities contracts (including equity swaps, futures contracts,
and warrants and options) 82 17 7 1 107Commodity forwards, futures, options and swaps 53 22 8 8 91Mortgage-backed securities forward contracts, swaps and options 25 1 2 12 40
Total $1,509 $530 $388 $433 $2,860Percent of total 53% 19% 13% 15% 100%
AT NOVEMBER 30, 1997
Interest rate and currency swaps and options (including caps, floors and swap options) and other fixed income securities contracts $ 319 $398 $235 $310 $1,262
Foreign exchange forward and futures contracts and options 1,026 7 2 — 1,035Equity securities contracts (including equity swaps, futures contracts,
and warrants and options) 87 17 7 1 112Commodity forwards, futures, options and swaps 58 14 4 2 78Mortgage-backed securities forward contracts, swaps and options 20 1 4 17 42
Total $1,510 $437 $252 $330 $2,529Percent of total 60)% 17)% 10)% 13)% 100%

The credit quality of the Company’s trading-related derivatives at
November 30, 1998 and 1997 is summarized in the table below,
showing the fair value of the related assets by counterparty credit
rating. The actual credit ratings are determined by external rating
agencies or by equivalent ratings used by the Company’s
Credit Department:
* SEVENTY-EIGHT *
MORGAN STANLEY DEAN WITTER * 1998 ANNUAL REPORT
Collateralized OtherNon- Non-
Investment Investment(dollars in millions) AAA AA A BBB Grade Grade TOTAL
AT NOVEMBER 30, 1998
Interest rate and currency swaps and options (including caps, floors and swap options) and other fixed income securities contracts $ 894 $3,727 $3,694 $1,181 $ 98 $ 510 $10,104
Foreign exchange forward contracts and options 306 1,413 1,435 337 — 263 3,754Equity securities contracts (including equity swaps,
warrants and options) 1,995 1,105 478 61 1,364 165 5,168Commodity forwards, options and swaps 71 448 401 708 46 534 2,208Mortgage-backed securities forward contracts,
swaps and options 130 51 21 3 — 3 208Total $3,396 $6,744 $6,029 $2,290 $1,508 $1,475 $21,442Percent of total 16% 31% 28% 11% 7% 7% 100%
AT NOVEMBER 30, 1997
Interest rate and currency swaps and options (including caps, floors and swap options) and other fixed income securities contracts $ 754 $2,761 $2,544 $ 436 $ 33 $ 568 $ 7,096
Foreign exchange forward contracts and options 788 2,504 1,068 72 — 176 4,608Equity securities contracts (including equity swaps,
warrants and options) 1,141 917 567 233 780 152 3,790Commodity forwards, options and swaps 70 425 380 312 12 145 1,344Mortgage-backed securities forward contracts,
swaps and options 156 90 50 2 — 10 308Total $2,909 $6,697 $4,609 $1,055 $825 $1,051 $17,146Percent of total 17% 39% 27% 6% 5% 6% 100%
The Company also has obtained assets posted as collateral by invest-
ment grade counterparties amounting to $2.5 billion and $1.2 billion
at November 30, 1998 and November 30, 1997, respectively.

PREFERRED STOCK, CAPITAL UNITS AND PREFERRED SECURITIES ISSUED BY SUBSIDIARIES
Preferred stock of the Company is composed of the following issues:
Shares Outstanding at Balance atNovember 30 November 30
(dollars in millions) 1998 1997 1998 1997
ESOP Convertible Preferred Stock, liquidation preference $35.88 3,581,964 3,646,664 $129 $131Series A Fixed/Adjustable Rate Cumulative Preferred Stock, stated value $200 1,725,000 1,725,000 345 3457-3⁄4% Cumulative Preferred Stock, stated value $200 1,000,000 1,000,000 200 2007-3⁄8% Cumulative Preferred Stock, stated value $200 — 1,000,000 — 200
Total $674 $876
10
In January 1999, the Company and MS plc called for
redemption all of the outstanding 7.82% Capital Units and 7.80%
Capital Units on February 28, 1999. The aggregate principal amount
of the Capital Units to be redeemed is $352 million.
The estimated fair value of the Capital Units
approximated carrying value at November 30, 1998 and
November 30, 1997.
SHAREHOLDERS’ EQUITY
MS&Co. and DWR are registered broker-dealers and registered
futures commission merchants and, accordingly, are subject to the
minimum net capital requirements of the Securities and Exchange
Commission, the New York Stock Exchange and the Commodity
Futures Trading Commission. MS&Co. and DWR have consistently
operated in excess of these requirements. MS&Co.’s net capital
totaled $3,205 million at November 30, 1998, which exceeded the
amount required by $2,699 million. DWR’s net capital totaled
$752 million at November 30, 1998, which exceeded the amount
required by $668 million. MSIL, a London-based broker-dealer sub-
sidiary, is subject to the capital requirements of the Securities and
Futures Authority, and MSJL, a Tokyo-based broker-dealer, is sub-
ject to the capital requirements of the Japanese Ministry of Finance.
MSIL and MSJL have consistently operated in excess of their respec-
tive regulatory capital requirements.
Under regulatory net capital requirements adopted
by the Federal Deposit Insurance Corporation (“FDIC”) and other reg-
ulatory capital guidelines, FDIC-insured financial institutions must
11
* SEVENTY-NINE *
MORGAN STANLEY DEAN WITTER * 1998 ANNUAL REPORT
Each issue of outstanding preferred stock ranks in parity with all other
outstanding preferred stock of the Company.
During fiscal 1998, MSDW Capital Trust I, a Delaware
statutory business trust (the “Capital Trust”), all of the common secu-
rities of which are owned by the Company, issued $400 million of
7.10% Capital Securities (the “Capital Securities”) that are guar-
anteed by the Company. The Capital Trust issued the Capital
Securities and invested the proceeds in 7.10% Junior Subordinated
Deferrable Interest Debentures issued by the Company, which are due
February 28, 2038.
During fiscal 1998, the Company redeemed all
1,000,000 outstanding shares of its 7-3/8% Cumulative Preferred
Stock at a redemption price of $200 per share. The Company also
simultaneously redeemed all corresponding Depositary Shares at a
redemption price of $25 per Depositary Share. Each Depositary Share
represented 1/8 of a share of the Company’s 7-3/8% Cumulative
Preferred Stock.
The Company has Capital Units outstanding which
were issued by the Company and Morgan Stanley Finance plc (“MS
plc”), a U.K. subsidiary. A Capital Unit consists of (a) a Subordinated
Debenture of MS plc guaranteed by the Company and having matu-
rities from 2013 to 2017 and (b) a related Purchase Contract
issued by the Company, which may be accelerated by the Company
beginning approximately one year after the issuance of each Capital
Unit, requiring the holder to purchase one Depositary Share repre-
senting shares (or fractional shares) of the Company’s Cumulative
Preferred Stock. The aggregate amount of Capital Units outstand-
ing was $999 million at November 30, 1998 and 1997.

maintain (a) 3% to 5% of Tier 1 capital, as defined, to total assets
(“leverage ratio”) and (b) 8% combined Tier 1 and Tier 2 capital, as
defined, to risk-weighted assets (“risk-weighted capital ratio”). At
November 30, 1998, the leverage ratio and risk-weighted capital ratio
of each of the Company’s FDIC-insured financial institutions exceeded
these and all other regulatory minimums.
Certain other U.S. and non-U.S. subsidiaries are sub-
ject to various securities, commodities and banking regulations,
and capital adequacy requirements promulgated by the regulatory
and exchange authorities of the countries in which they operate.
These subsidiaries have consistently operated in excess of their
local capital adequacy requirements. Morgan Stanley Derivative
Products Inc., the Company’s triple-A rated derivative products sub-
sidiary, also has established certain operating restrictions which
have been reviewed by various rating agencies.
The regulatory capital requirements referred to above,
and certain covenants contained in various agreements governing
indebtedness of the Company, may restrict the Company’s ability to
withdraw capital from its subsidiaries. At November 30, 1998,
approximately $4.9 billion of net assets of consolidated subsidiaries
may be restricted as to the payment of cash dividends and advances
to the Company.
Cumulative translation adjustments include gains or
losses resulting from translating foreign currency financial statements
from their respective functional currencies to U.S. dollars, net of
hedge gains or losses and related tax effects. The Company uses for-
eign currency contracts and designates certain non-U.S. dollar cur-
rency debt as hedges to manage the currency exposure relating to
its net monetary investments in non-U.S. dollar functional currency
subsidiaries. Increases or decreases in the value of the Company’s
net foreign investments generally are tax-deferred for U.S. pur-
poses, but the related hedge gains and losses are taxable currently.
Therefore, the gross notional amounts of the contracts and debt des-
ignated as hedges exceed the Company’s net foreign investments to
result in effective hedging on an after-tax basis. The Company
attempts to protect its net book value from the effects of fluctua-
tions in currency exchange rates on its net monetary investments in
non-U.S. dollar subsidiaries by selling the appropriate non-U.S.
dollar currency in the forward market. However, under some cir-
cumstances, the Company may elect not to hedge its net monetary
investments in certain foreign operations due to market conditions,
including the availability of various currency contracts at acceptable
costs. Information relating to the hedging of the Company’s net mon-
etary investments in non-U.S. dollar functional currency subsidiaries
and their effects on cumulative translation adjustments is
summarized below:
At November 30(dollars in millions) 1998 1997
Net monetary investments in non-U.S. dollar functional currency subsidiaries $1,364 $1,128
Gross notional amounts of foreign exchange contracts and non-U.S. dollar debt designated as hedges(1) $2,239 $1,881
Cumulative translation adjustments resulting from net investments in subsidiaries with a non-U.S. dollar functional currency $ 29 $ 6
Cumulative translation adjustments resulting from realized or unrealized gains or losses on hedges, net of tax $ (41) $ (15)
Total cumulative translation adjustments $ (12) $ (9)
(1) Notional amounts represent the contractual currency amount translated at respective fiscalyear-end spot rates.
EMPLOYEE COMPENSATION PLANS
The Company has adopted a variety of compensation plans for cer-
tain of its employees as well as the Company’s non-employee direc-
tors. These plans are designed to facilitate a pay-for-performance
policy, provide compensation commensurate with other leading finan-
cial services companies and provide for internal ownership in order
to align the interests of employees with the long-term interests of the
Company’s shareholders. These plans are summarized below.
EQUITY-BASED COMPENSATION PLANS
The Company is authorized to issue up to approximately 270 million
shares of its common stock in connection with awards under its equity-
12
* EIGHTY *
MORGAN STANLEY DEAN WITTER * 1998 ANNUAL REPORT

based compensation plans. At November 30, 1998, approximately
150 million shares were available for future grant under these plans.
Stock Option Awards
Stock option awards have been granted pursuant to several equity-
based compensation plans. Historically, these plans have generally
provided for the granting of stock options having an exercise price
not less than the fair value of the Company’s common stock (as
defined in the plan) on the date of grant. Such options generally
become exercisable over a one-to-five year period and expire seven
to 10 years from the date of grant.
The following table sets forth activity relating to the
Company’s stock option awards (share data in millions):
* EIGHTY-ONE *
MORGAN STANLEY DEAN WITTER * 1998 ANNUAL REPORT
FISCAL 1998 FISCAL 1997 FISCAL 1996
WEIGHTED Weighted Weighted NUMBER AVERAGE Number Average Number Average
OF EXERCISE of Exercise of Exercise SHARES PRICE Shares Price Shares Price
Options outstanding at beginning of period 64.1 $27.85 60.3 $17.04 63.1 $14.46Granted 15.6 68.77 20.2 48.16 7.5 30.15Exercised (15.3) 18.23 (14.9) 11.68 (9.0) 9.45Forfeited (1.1) 39.40 (1.5) 26.66 (1.3) 21.14Options outstanding at end of period 63.3 $40.08 64.1 $27.85 60.3 $17.04Options exercisable at end of period 40.6 $39.37 44.3 $26.67 36.4 $13.82
The following table presents information relating to the Company’s
stock options outstanding at November 30, 1998 (share data in millions):
OPTIONS OUTSTANDING OPTIONS EXERCISABLE
Weighted Average WeightedAverage Remaining Average
Range of Number Exercise Life Number ExerciseExercise Prices Outstanding Price (Years) Exercisable Price
$ 8.00 – $19.99 22.7 $17.29 5.9 17.9 $17.09$20.00 – $29.99 2.0 24.02 3.3 1.0 23.35$30.00 – $39.99 7.9 32.13 5.5 1.3 32.42$40.00 – $49.99 4.4 43.47 8.6 3.8 43.47$50.00 – $59.99 15.0 54.90 8.1 9.2 55.64$60.00 – $69.99 0.5 63.08 7.1 0.5 62.88$70.00 – $79.99 9.5 71.56 9.8 5.7 71.73$80.00 – $96.00 1.3 89.90 7.1 1.2 90.00
Total 63.3 7.1 40.6
Deferred Compensation Awards
The Company has made deferred compensation awards pursuant to
several equity-based compensation plans. These plans provide for
the deferral of a portion of certain key employees’ compensation with
payments made in the form of the Company’s common stock or in
the right to receive unrestricted shares (collectively, “Restricted
Stock”). Compensation expense for all such awards (including those
subject to forfeiture) amounted to $415 million, $347 million and
$534 million in fiscal 1998, fiscal 1997 and fiscal 1996, respec-
tively. Compensation expense for Restricted Stock awards was deter-
mined based on the fair value of the Company’s common stock (as
defined in the plans). The number of Restricted Stock shares out-
standing were 59 million at fiscal year-end 1998, 62 million at fis-
cal year-end 1997, and 65 million at fiscal year-end 1996.
Restricted Stock awarded under these plans are sub-
ject to restrictions on sale, transfer or assignment until the end of
a specified restriction period, generally 5 to 10 years from the date
of grant. Holders of Restricted Stock generally may forfeit ownership
of a portion of their award if employment is terminated before the
end of the relevant restriction period. Holders of vested Restricted
Stock generally will forfeit ownership only in certain limited situa-
tions, including termination for cause during the restriction period.
Employee Stock Purchase Plan
Under the Employee Stock Purchase Plan, eligible employees may
purchase shares of the Company’s common stock at not less than

85% of the fair value on the date of purchase. Employees of the
Company purchased 0.6 million shares of common stock in fiscal
1998, 0.5 million shares in fiscal 1997 and 0.7 million shares in
fiscal 1996.
The discount to fair value was $6 million for fiscal
1998 and $3 million for both fiscal 1997 and fiscal 1996. The plan
is “non-compensatory” under APB No. 25, and, accordingly, no
charge to earnings has been recorded for the amount of the discount
to fair value.
Non-Employee Director Awards
The Company sponsors an equity-based plan for non-employee
directors under which shares of the Company’s common stock have
been authorized for issuance in the form of option grants, stock
awards or deferred compensation. The effect of these grants on results
of operations was not material.
OTHER COMPENSATION PLANS
Capital Accumulation Plan
Under the Capital Accumulation Plan (“CAP”), vested units consisting
of unsecured rights to receive payments based on notional interests
in existing and future risk-capital investments made directly or indi-
rectly by the Company (“CAP Units”) are granted to key employees.
The value of the CAP Units awarded for services rendered in fiscal
1998, 1997 and 1996 was approximately $15 million, $14 million
and $7 million, respectively, all of which relate to vested units.
Carried Interest Plans
Under various Carried Interest Plans, certain key employees effectively
participate in a portion of the Company’s realized gains from certain
of its equity investments in private equity transactions. Compensation
expense for fiscal 1998, 1997 and 1996 related to these plans aggre-
gated $33 million, $38 million and $0.2 million, respectively.
Real Estate Fund Plans
Under various plans, select employees and consultants to certain part-
nerships may participate in certain gains realized by the Company’s
real estate funds. Compensation expense relating to these plans
aggregated $3 million, $8 million and $13 million for fiscal 1998,
fiscal 1997 and fiscal 1996, respectively.
Profit Sharing Plans
The Company sponsors qualified profit sharing plans covering sub-
stantially all U.S. employees and also provides cash payment of profit
sharing to employees of its international subsidiaries. Contributions
are made to eligible employees at the discretion of management
based upon the financial performance of the Company. Total profit
sharing expense for fiscal 1998, fiscal 1997 and fiscal 1996 was
$115 million, $113 million and $72 million, respectively.
Employee Stock Ownership Plan
The Company has a $140 million leveraged employee stock owner-
ship plan, funded through an independently managed trust. The
Employee Stock Ownership Plan (“ESOP”) was established to
broaden internal ownership of the Company and to provide benefits
to its employees in a cost-effective manner. Each of the 3,581,964
preferred shares outstanding at November 30, 1998 is held by the
ESOP trust, is convertible into 3.3 shares of the Company’s common
stock and is entitled to annual dividends of $2.78 per preferred share.
The ESOP trust funded its stock purchase through a loan of $140
million from the Company. The ESOP trust note, due September 19,
2005 (extendible at the option of the ESOP trust to September 19,
2010), bears a 10-3/8% interest rate per annum with principal
payable without penalty on or before the due date. The ESOP trust
expects to make principal and interest payments on the note from
funds provided by dividends on the shares of convertible preferred
stock and contributions from the Company. The note receivable
* EIGHTY-TWO *
MORGAN STANLEY DEAN WITTER * 1998 ANNUAL REPORT

from the ESOP trust is reflected as a reduction in the Company’s
shareholders’ equity. Shares allocated to employees generally may
not be withdrawn until the employee’s death, disability, retirement
or termination. Upon withdrawal, each share of ESOP preferred
stock generally will be converted into 3.3 shares of the Company’s
common stock. If the fair value of such 3.3 common shares at con-
version is less than the $35.88 liquidation value of an ESOP pre-
ferred share, the Company will pay the withdrawing employee the
difference in additional common shares or cash.
Contributions to the ESOP by the Company and allo-
cation of ESOP shares to employees are made annually at the dis-
cretion of the Board of Directors. The cost of shares allocated to
participants’ accounts amounted to $8 million in both fiscal 1998
and fiscal 1997, and $9 million in fiscal 1996. The ESOP debt ser-
vice costs for fiscal 1998, fiscal 1997 and fiscal 1996 were paid
from dividends received on preferred stock held by the plan and from
Company contributions.
PRO FORMA EFFECT OF SFAS NO. 123
Had the Company elected to recognize compensation cost pursuant
to SFAS No. 123 for its stock option plans and the Employee Stock
Purchase Plan, net income would have been reduced by $214 mil-
lion, $196 million and $41 million for fiscal 1998, 1997 and
1996, respectively. Basic and diluted earnings per common share
would have been reduced by $0.38, $0.34 and $0.07 for fiscal
1998, 1997 and 1996, respectively.
The weighted average fair value at date of grant for
stock options granted during fiscal 1998, 1997 and 1996 was
$22.37, $16.76 and $9.08 per option, respectively. The fair value
of stock options at date of grant was estimated using the Black-
Scholes option pricing model utilizing the following weighted aver-
age assumptions:
FISCAL fiscal fiscal1998 1997 1996
Risk-free interest rate 4.9% 6.0)% 5.5%Expected option life in years 4.8 6.0) 5.3Expected stock price volatility 33.2% 28.0)% 27.5%Expected dividend yield 1.3% 1.3)% 1.6%
EMPLOYEE BENEFIT PLANS
The Company sponsors various pension plans for the majority of its
worldwide employees. The Company provides certain other postre-
tirement benefits, primarily health care and life insurance, to eligi-
ble employees. The Company also provides certain benefits to former
or inactive employees prior to retirement. The following summarizes
these plans:
PENSION PLANS
Substantially all of the U.S. employees of the Company and its U.S.
affiliates are covered by non-contributory pension plans that are qual-
ified under Section 401(a) of the Internal Revenue Code (the
“Qualified Plans”). Unfunded supplementary plans (the
“Supplemental Plans”) cover certain executives. In addition to the
Qualified Plans and the Supplemental Plans (collectively, the “U.S.
Plans”), nine of the Company’s international subsidiaries also have
pension plans covering substantially all of their employees. These
pension plans generally provide pension benefits that are based on
each employee’s years of credited service and on compensation
levels specified in the plans. For the Qualified Plans and the other
international plans, the Company’s policy is to fund at least the
amounts sufficient to meet minimum funding requirements under
applicable employee benefit and tax regulations. Liabilities for ben-
efits payable under the Supplemental Plans are accrued by the
Company and are funded when paid to the beneficiaries.
13
* EIGHTY-THREE *
MORGAN STANLEY DEAN WITTER * 1998 ANNUAL REPORT

The following tables present information for the
Company’s pension plans on an aggregate basis.
Pension expense includes the following components:
FISCAL fiscal fiscal(dollars in millions) 1998 1997 1996
U.S. Plans:Service cost, benefits earned
during the period $ 72 $ 54 $ 48Interest cost on projected
benefit obligation 78 67 58Return on plan assets (7) (170) (111)Difference between actual and
expected return on assets (80) 104 53Net amortization 1 1 2Total U.S. plans 64 56 50International plans 12 9 12Total pension expense $ 76 $ 65 $ 62
The following table provides the assumptions used in determining
the projected benefit obligation for the U.S. Plans:
FISCAL fiscal1998 1997
Weighted average discount rate 6.75)% 7.25%Rate of increase in future compensation levels 5.00)% 5.00%Expected long-term rate of return on plan assets 9.00)% 9.00%
The following table sets forth the funded status of the U.S. Plans:
NOVEMBER 30, 1998 NOVEMBER 30, 1997ACCUMULATED Accumulated
ASSETS EXCEED BENEFITS Assets Exceed BenefitsACCUMULATED EXCEED Accumulated Exceed
(dollars in millions) BENEFITS ASSETS Benefits Assets
Actuarial present value of vested benefit obligation $(269) $(616) $ (735) $ (34)
Accumulated benefit obligation $(314) $(693) $ (807) $ (71)
Effect of future salary increases (114) (93) (181) (30)
Projected benefit obligation (428) (786) (988) (101)
Plan assets at fair value (primarily listed stocks and bonds) 384 597 1,006 —
Projected benefit obligation (in excess of) or less than plan assets (44) (189) 18 (101)
Unrecognized net loss or (gain) 53 83 (4) 27
Unrecognized prior service cost 1 28 31 (4)
Unrecognized net transition obligation — 8 3 5
Prepaid (accrued) pension cost at fiscal year-end $ 10 $ (70) $ 48 $ (73)
Additional liability for unfunded accumulatedbenefit obligation — (30) — —
Pension asset (liability) $ 10 $(100) $ 48 $ (73)
The Company also maintains a separate defined con-
tribution pension plan which covers substantially all employees of
the Company’s U.K. subsidiaries (the “U.K. Plan”). Under the U.K.
Plan, benefits are determined by the purchasing power of the accu-
mulated value of contributions paid. In fiscal 1998 and 1997, the
Company’s expense related to the U.K. Plan was $17 million and
$15 million, respectively.
* EIGHTY-FOUR *
MORGAN STANLEY DEAN WITTER * 1998 ANNUAL REPORT

POSTRETIREMENT BENEFITS
The Company has unfunded postretirement benefit plans that pro-
vide medical and life insurance for eligible retirees, employees and
dependents. At November 30, 1998 and 1997, the Company’s
accrued postretirement benefit costs were $95 million and
$91 million, respectively.
POSTEMPLOYMENT BENEFITS
Postemployment benefits include, but are not limited to, salary con-
tinuation, supplemental unemployment benefits, severance benefits,
disability-related benefits, and continuation of health care and life insur-
ance coverage provided to former or inactive employees after employ-
ment but before retirement. These benefits were not material to the
consolidated financial statements in fiscal 1998, 1997 and 1996.
INCOME TAXES
The provision for income taxes consists of:
FISCAL fiscal fiscal(dollars in millions) 1998 1997 1996
CurrentU.S. federal $1,199 $1,079 $1,096U.S. state and local 372 348 290Non-U.S. 476 338 177
2,047 1,765 1,563Deferred
U.S. federal (26) (45) (326)U.S. state and local 1 (17) (74)Non-U.S. (30) (15) (26)
(55) (77) (426)Provision for income taxes $1,992 $1,688 $1,137
14
The following table reconciles the provision to the U.S. federal
statutory income tax rate:
FISCAL fiscal fiscal1998 1997 1996
U.S. federal statutory income tax rate 35.0% 35.0% 35.0%
U.S. state and local income taxes, net of U.S. federal income tax benefits 4.6 5.1 4.6
Lower tax rates applicable to non-U.S. earnings (2.4) (1.1) (1.7)
Reduced tax rate applied to dividends (0.1) (0.1) (0.1)
Other (0.1) 0.6 (1.3)Effective income tax rate 37.0% 39.5% 36.5%
As of November 30, 1998, the Company had approximately $2.6
billion of earnings attributable to foreign subsidiaries for which no
provisions have been recorded for income tax that could occur upon
repatriation. Except to the extent such earnings can be repatriated
tax efficiently, they are permanently invested abroad. It is not prac-
ticable to determine the amount of income taxes payable in the event
all such foreign earnings are repatriated.
Deferred income taxes reflect the net tax effects of tem-
porary differences between the financial reporting and tax bases of
assets and liabilities and are measured using the enacted tax rates
and laws that will be in effect when such differences are expected
to reverse. Significant components of the Company’s deferred tax
assets and liabilities at November 30, 1998 and 1997 are as follows:
NOV. 30, NOV. 30,(dollars in millions) 1998 1997
Deferred tax assetsEmployee compensation and benefit plans $1,289 $1,168Loan loss allowance 371 459Other valuation and liability allowances 604 545Other 167 180
Total deferred tax assets 2,431 2,352Deferred tax liabilities
Prepaid commissions 239 233Valuation of inventory, investments
and receivables 127 298Other 237 265
Total deferred tax liabilities 603 796Net deferred tax assets $1,828 $1,556
* EIGHTY-FIVE *
MORGAN STANLEY DEAN WITTER * 1998 ANNUAL REPORT
Cash paid for income taxes was $1,591 million, $1,251 million and
$1,190 million in fiscal 1998, 1997 and 1996, respectively.
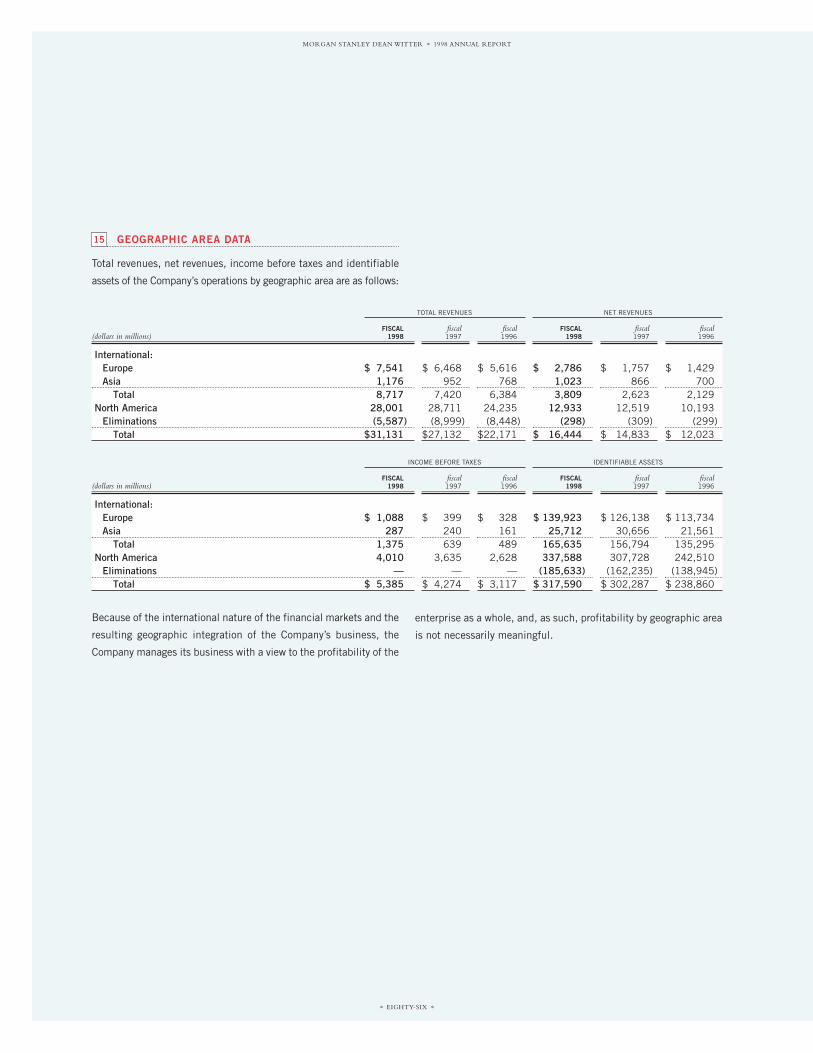
GEOGRAPHIC AREA DATA
Total revenues, net revenues, income before taxes and identifiable
assets of the Company’s operations by geographic area are as follows:
15
enterprise as a whole, and, as such, profitability by geographic area
is not necessarily meaningful.
* EIGHTY-SIX *
MORGAN STANLEY DEAN WITTER * 1998 ANNUAL REPORT
TOTAL REVENUES NET REVENUES
FISCAL fiscal fiscal FISCAL fiscal fiscal (dollars in millions) 1998 1997 1996 1998 1997 1996
International:Europe $ 7,541 $ 6,468 $ 5,616 $ 2,786 $ 1,757 $ 1,429Asia 1,176 952 768 1,023 866 700
Total 8,717 7,420 6,384 3,809 2,623 2,129North America 28,001 28,711 24,235 12,933 12,519 10,193
Eliminations (5,587) (8,999) (8,448) (298) (309) (299)Total $31,131 $27,132 $22,171 $ 16,444 $ 14,833 $ 12,023
INCOME BEFORE TAXES IDENTIFIABLE ASSETS
FISCAL fiscal fiscal FISCAL fiscal fiscal (dollars in millions) 1998 1997 1996 1998 1997 1996
International:Europe $ 1,088 $ 399 $ 328 $ 139,923 $ 126,138 $ 113,734Asia 287 240 161 25,712 30,656 21,561
Total 1,375 639 489 165,635 156,794 135,295North America 4,010 3,635 2,628 337,588 307,728 242,510
Eliminations — — — (185,633) (162,235) (138,945)Total $ 5,385 $ 4,274 $ 3,117 $ 317,590 $ 302,287 $ 238,860
Because of the international nature of the financial markets and the
resulting geographic integration of the Company’s business, the
Company manages its business with a view to the profitability of the

SEGMENT INFORMATION
The Company is in the business of providing financial services, and
operates in two business segments — Securities and Asset
Management and Credit and Transaction Services. Securities and
Asset Management engages in delivering a broad range of financial
products and services, including asset management, to individual
and institutional investors. Credit and Transaction Services is engaged
in the issuance and servicing of general purpose credit cards, con-
sumer lending and electronic transaction processing services.
The following table presents certain information regard-
ing these business segments:
FISCAL fiscal fiscal(dollars in millions) 1998 1997 1996
Total revenues:Securities and Asset
Management $ 25,763 $ 21,499 $ 17,136Credit and Transaction
Services 5,368 5,633 5,035Income before income
taxes(1):Securities and Asset
Management 4,187 3,597 2,426Credit and Transaction
Services 1,198 751 691Identifiable assets at end
of period(2):Securities and Asset
Management 297,054 277,878 213,967Credit and Transaction
Services 20,536 24,409 24,893
(1) Excludes merger-related expenses of $74 million in fiscal 1997.(2) Corporate assets have been fully allocated to the Company’s business segments.
16 BUSINESS DISPOSITIONS
In fiscal 1998, the Company entered into several transactions
reflecting its strategic decision to focus on growing its core
Securities and Asset Management and Credit and Transaction
Services businesses.
In the fourth quarter of fiscal 1998, the Company com-
pleted the sale of its Global Custody business. The Company also sold
its interest in the operations of SPS Transaction Services, Inc., a
73%-owned, publicly held subsidiary of the Company. In addition,
the Company sold certain credit card receivables relating to its dis-
continued BRAVO Card. The Company’s aggregate net pre-tax gain
resulting from these transactions was $685 million.
In addition, during fiscal 1998 the Company sold its
Prime OptionSM MasterCard® portfolio, a business it had operated with
NationsBank of Delaware, N.A., and its Correspondent Clearing
business. The gains resulting from the sale of these businesses
were not material to the Company’s results of operations or
financial condition.
17
* EIGHTY-SEVEN *
MORGAN STANLEY DEAN WITTER * 1998 ANNUAL REPORT

* EIGHTY-EIGHT *
MORGAN STANLEY DEAN WITTER * 1998 ANNUAL REPORT
QUARTERLY RESULTS (UNAUDITED)1998 FISCAL QUARTER 1997 FISCAL QUARTER
(dollars in millions, FIRST SECOND THIRDexcept share and per share data) (RESTATED) (1) (RESTATED) (1) (RESTATED) (1) FOURTH First Second Third Fourth
Revenues:Investment banking $ 800 $ 988 $ 819 $ 733 $ 522 $ 581 $ 818 $ 773Principal transactions:
Trading 903 1,091 499 798 869 722 778 822Investments 72 101 (174) 90 56 136 206 65
Commissions 547 611 608 587 490 484 559 553Fees:
Asset management, distribution and administration 676 741 718 714 587 610 656 652
Merchant and cardmember 428 404 438 377 436 424 433 411Servicing 171 232 255 270 202 184 196 180
Interest and dividends 3,933 4,213 4,283 4,007 3,369 3,197 3,570 3,447Other 55 47 52 44 29 38 41 36Total revenues 7,585 8,428 7,498 7,620 6,560 6,376 7,257 6,939
Interest expense 3,145 3,554 3,377 3,438 2,709 2,478 2,765 2,854Provision for consumer
loan losses 405 275 280 213 379 376 385 353Net revenues 4,035 4,599 3,841 3,969 3,472 3,522 4,107 3,732
Non-interest expenses:Compensation and benefits 1,788 2,017 1,609 1,222 1,490 1,505 1,849 1,175Occupancy and equipment 140 143 148 152 128 127 134 137Brokerage, clearing and
exchange fees 121 135 160 136 95 113 130 122Information processing and
communications 267 275 291 307 270 267 249 294Marketing and business
development 294 286 354 477 288 274 293 324Professional services 128 156 176 217 93 99 127 132Other 165 190 193 197 180 180 219 191Merger-related expenses — — — — — 74 — —Total non-interest expenses 2,903 3,202 2,931 2,708 2,544 2,639 3,001 2,375
Gain on sale of businesses — — — 685 — — — —Income before income taxes
and cumulative effect ofaccounting change 1,132 1,397 910 1,946 928 883 1,106 1,357
Provision for income taxes 441 545 284 722 357 356 428 547Income before
cumulative effect of accounting change 691 852 626 1,224 571 527 678 810
Cumulative effect of accounting change (117) — — — — — — —
Net income $ 574 $ 852 $ 626 $1,224 $ 571 $ 527 $ 678 $ 810Earnings applicable to
common shares(2) $ 559 $ 838 $ 612 $1,212 $ 552 $ 509 $ 663 $ 796Basic earnings per share(3):
Income before cumulative effect ofaccounting change $ 1.15 $ 1.44 $ 1.07 $ 2.16 $ 0.96 $ 0.88 $ 1.15 $ 1.37
Cumulative effect of accounting change (0.20) — — — — — — —
Net income $ 0.95 $ 1.44 $ 1.07 $ 2.16 $ 0.96 $ 0.88 $ 1.15 $ 1.37Diluted earnings per share(3):
Income before cumulative effect of accounting change $ 1.10 $ 1.37 $ 1.01 $ 2.07 $ 0.91 $ 0.84 $ 1.09 $ 1.30
Cumulative effect of accounting change (0.19) — — — — — — —
Net income $ 0.91 $ 1.37 $ 1.01 $ 2.07 $ 0.91 $ 0.84 $ 1.09 $ 1.30Dividends to common
shareholders $ 0.20 $ 0.20 $ 0.20 $ 0.20 $ 0.14 $ 0.14 $ 0 .14 $ 0.14Book value $22.48 $21.95 $22.13 $23.88 $18.70 $19.37 $20.25 $22.11
Average common and equivalent shares:
Basic 586,751,340 581,326,618 573,170,507 560,108,890 573,410,658 577,985,371 578,082,806 580,985,871Diluted 616,377,562 612,625,354 604,779,594 585,533,337 605,691,066 610,430,898 610,019,122 612,092,405
Stock price range(4) $52.25-70.50 $69.75-84.44 $58.06-96.88 $38.44-74.75 $32.19-43.75 $34.50-41.50 $41.00-53.88 $47.31-58.75
(1) The quarterly results for the first, second and third quarters of fiscal 1998 have been restated to reflect the effects of the accounting change adopted in the fourth quarter, effective December 1, 1997.As a resultof this restatement, net income has been decreased by $117 million, $2 million and $21 million for the first, second and third quarters of fiscal 1998, respectively. For further information regarding the changein accounting, see Note 2.
(2) Amounts shown are used to calculate basic earnings per share.(3) Summation of the quarters’ earnings per common share may not equal the annual amounts due to the averaging effect of the number of shares and share equivalents throughout the year.(4) Prices represent the range of sales per share on the New York Stock Exchange for the periods indicated.The number of stockholders of record at November 30, 1998 approximated 186,000.The number of beneficial
owners of common stock is believed to exceed this number.
18
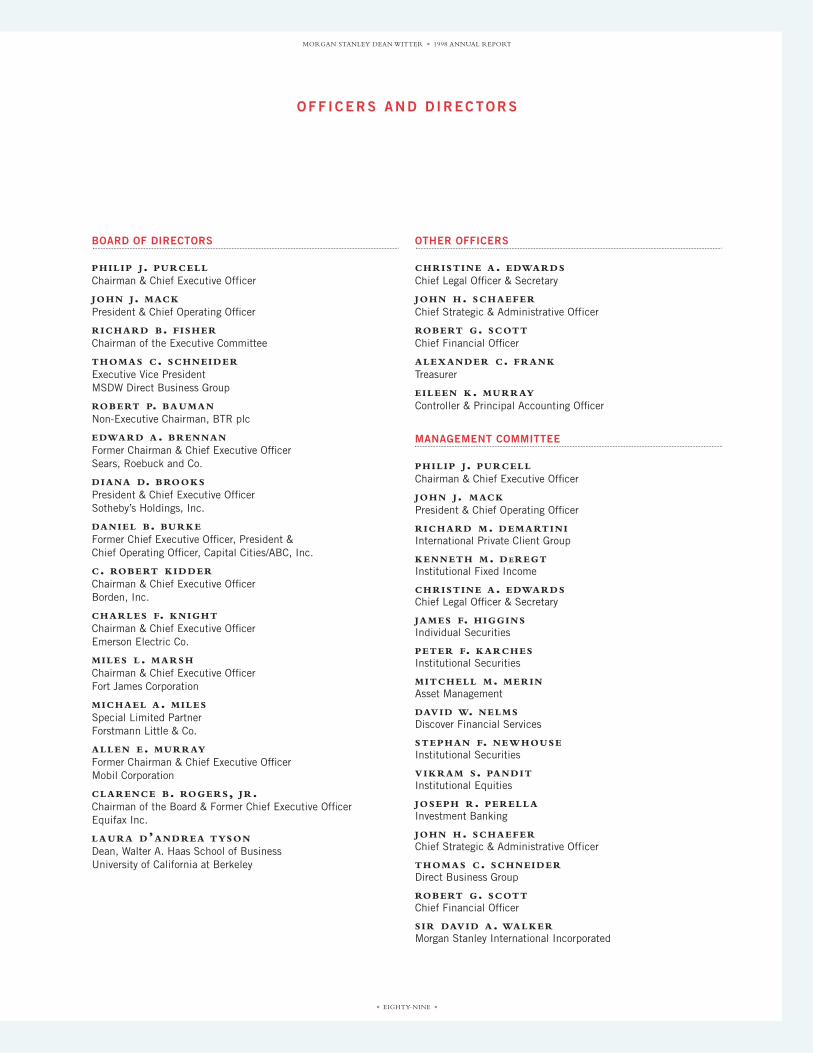
* EIGHTY-NINE *
MORGAN STANLEY DEAN WITTER * 1998 ANNUAL REPORT
BOARD OF DIRECTORS
PHILIP J. PURCELL
Chairman & Chief Executive Officer
JOHN J. MACK
President & Chief Operating Officer
RICHARD B. FISHER
Chairman of the Executive Committee
THOMAS C. SCHNEIDER
Executive Vice PresidentMSDW Direct Business Group
ROBERT P. BA UMAN
Non-Executive Chairman, BTR plc
EDWARD A. BRENNAN
Former Chairman & Chief Executive Officer Sears, Roebuck and Co.
DIANA D. BROOKS
President & Chief Executive OfficerSotheby’s Holdings, Inc.
DANIEL B. BURKE
Former Chief Executive Officer, President & Chief Operating Officer, Capital Cities/ABC, Inc.
C. ROBERT KIDDER
Chairman & Chief Executive OfficerBorden, Inc.
CHARLES F. KNIGHT
Chairman & Chief Executive Officer Emerson Electric Co.
MILES L. MARSH
Chairman & Chief Executive Officer Fort James Corporation
MICHAEL A. MILES
Special Limited PartnerForstmann Little & Co.
ALLEN E. MURRAY
Former Chairman & Chief Executive OfficerMobil Corporation
CLARENCE B. ROGERS, JR.Chairman of the Board & Former Chief Executive Officer Equifax Inc.
LA URA D’ANDREA TYSON
Dean, Walter A. Haas School of BusinessUniversity of California at Berkeley
OTHER OFFICERS
CHRISTINE A. EDWARDS
Chief Legal Officer & Secretary
JOHN H. SCHAEFER
Chief Strategic & Administrative Officer
ROBERT G. SCOTT
Chief Financial Officer
ALEXANDER C. FRANK
Treasurer
EILEEN K. MURRAY
Controller & Principal Accounting Officer
MANAGEMENT COMMITTEE
PHILIP J. PURCELL
Chairman & Chief Executive Officer
JOHN J. MACK
President & Chief Operating Officer
RICHARD M. DEMARTINIInternational Private Client Group
KENNETH M. DEREGTInstitutional Fixed Income
CHRISTINE A. EDWARDSChief Legal Officer & Secretary
JAMES F. HIGGINSIndividual Securities
PETER F. KARCHESInstitutional Securities
MITCHELL M. MERINAsset Management
DAVID W. NELMSDiscover Financial Services
STEPHAN F. NEWHOUSEInstitutional Securities
VIKRAM S. PANDITInstitutional Equities
JOSEPH R. PERELLAInvestment Banking
JOHN H. SCHAEFERChief Strategic & Administrative Officer
THOMAS C. SCHNEIDERDirect Business Group
ROBERT G. SCOTTChief Financial Officer
SIR DAVID A. WALKERMorgan Stanley International Incorporated
OFF ICERS AND D IRECTORS

* NINETY *
MORGAN STANLEY DEAN WITTER * 1998 ANNUAL REPORT
INTERNAT IONAL LOCAT IONS
WORLDWIDE HEADQUARTERS—NEW YORK1585 Broadway New York, NY 10036Telephone: (212) 761-4000Fax: (212) 761-0086
AMSTERDAMRembrandt Tower, 11th Floor Amstelplein 11096 HA AmsterdamThe NetherlandsTelephone: (31 20) 462-1300Fax: (31 20) 462-1310
BANGKOK153/3 Soi Mahadlekluang 1Rajdamri RoadBangkok 10330, ThailandTelephone: (66 2) 652-1245-6Fax: (66 2) 652-1248
BEIJINGRoom 1706, Everbright Building6 Fu Xing Men Wai AvenueBeijing 100045, People’s Republic of ChinaTelephone: (86 10) 6856-1368Fax: (86 10) 6856-1369
BUENOS AIRESAv. Alicia Moreau de Justo 7402do. piso, oficina 61107 — Buenos AiresArgentinaTelephone: (54 11) 4349-0700Fax: (54 11) 4349-0707
FRANKFURTRahmhofstrasse 2-460313 Frankfurt, GermanyTelephone: (49 69) 2166-0Fax: (49 69) 2166-2099
GENEVA12 Place de la Fusterie 1211 Geneva, SwitzerlandTelephone: (41 22) 319-8000Fax: (41 22) 319-8090
HONG KONG30th Floor, Three Exchange Square, Central Hong Kong, SARTelephone: (852) 2848-5200Fax: (852) 2845-1012
JOHANNESBURGTen Sixty Six Building, 11th Floor35 Pritchard Street Johannesburg, 2001 South AfricaTelephone: (27 11) 836-6672Fax: (27 11) 836-6657
LONDON25 Cabot Square, Canary Wharf London E14 4QA, EnglandTelephone: (44 171) 425-8000Fax: (44 171) 425-8990
LUXEMBOURG6B, Route de Treves L-2633 Senningerberg, LuxembourgTelephone: (352) 346-461Fax: (352) 3464-6220
MADRIDFortuny 6, planta 5 28010 Madrid, SpainTelephone: (34) 91 700-7200Fax: (34) 91 700-7299
MELBOURNELevel 53, 101 Collins Street Melbourne, Victoria, 3000AustraliaTelephone: (61 3) 9256-8900Fax: (61 3) 9256-8951
MEXICO CITYAndres Bello 10Piso 8Colonia Polanco11560 Mexico, D.F.Telephone: (52 5) 282-6700Fax: (52 5) 282-9200
MILANPalazzo SerbelloniCorso Venezia, 16 20121 Milan, ItalyTelephone: (39 02) 760 351Fax: (39 02) 783 057

* NINETY-ONE *
MORGAN STANLEY DEAN WITTER * 1998 ANNUAL REPORT
MONTREAL1501 McGill College Avenue, Suite 2310 Montreal, Quebec, Canada H3A 3M8Telephone: (514) 847-7400Fax: (514) 847-7429
MOSCOWDucat Plaza II, 7 Gasheka StreetMoscow 123056, RussiaTelephone: (7 501) 785-2200Fax: (7 501) 785-2229
MUMBAI4th Floor Forbes BuildingCharanjit Rai Marg, FortMumbai 400 001IndiaTelephone: (91 22) 209-6600Fax: (91 22) 209-6601
PARIS25, rue Balzac75406 Paris Cedex 08 FranceTelephone: (33 1) 5377-7000Fax: (33 1) 5377-7099
SÃO PAULOAv. Pres. Juscelino Kubitschek50-8 andar 04543-000 São Paulo-SPBrazilTelephone: (55 11) 3048-6000Fax: (55 11) 3048-6099
SEOUL19th Floor, Kwanghwamoon Building211-1, Sejongro, Chongro-kuSeoul 110-730, KoreaTelephone: (82 2) 399-4848Fax: (82 2) 399-4827
SHANGHAISuite 700B, 7th Floor, West WingShanghai Center1376 Nan Jing Xi LuShanghai 200040, People’s Republic of ChinaTelephone: (86 21) 6279-7150Fax: (86 21) 6279-7157
SINGAPORE23 Church Street#16-01 Capital SquareSingapore 049481Telephone: (65) 834-6888Fax: (65) 834-6861
SYDNEYLevel 33, The Chifley Tower2 Chifley SquareSydney, NSW 2000 AustraliaTelephone: (61 2) 9770-1111Fax: (61 2) 9770-1121
TAIPEIRoom 1503, Chia Hsin Building96 Chung Shan North Road, Sec. 2 Taipei, TaiwanTelephone: (886 2) 2561-5125Fax: (886 2) 2536-3070
TOKYOYebisu Garden Place Tower20-3, Ebisu 4-chomeShibuya-ku, Tokyo 150-6008 JapanTelephone: (81 3) 5424-5000Fax: (81 3) 5424-5099
TORONTOBCE Place, 181 Bay StreetSuite 3700, P.O. Box 776Toronto, Ontario, Canada M5J 2T3Telephone: (416) 943-8400Fax: (416) 943-8444
ZURICHBahnhofstrasse 92CH-8023 Zurich, SwitzerlandTelephone: (41 1) 220-9111Fax: (41 1) 220-9800
* NINETY-TWO *
MORGAN STANLEY DEAN WITTER * 1998 ANNUAL REPORT
STOCKHOLDER INFORMAT ION
COMMON STOCK
Ticker Symbol: MWD
The common stock of Morgan Stanley Dean Witter & Co. is listedon the New York Stock Exchange and on the Pacific Exchange.
DIVIDENDS
Effective January 1999, Morgan Stanley Dean Witter & Co.’s Boardof Directors increased the quarterly cash dividend to $0.24 pershare of common stock.
INDEPENDENT AUDITORS
Deloitte & Touche LLPTwo World Financial CenterNew York, NY 10281212-436-2000
SHARE PURCHASE AND DIVIDENDREINVESTMENT PLAN & STOCKHOLDER SERVICES
Morgan Stanley Dean Witter Trust FSB is the Record Keeper forthe Share Purchase and Dividend Reinvestment Plan and theTransfer Agent for the Company’s common stock. For more infor-mation about the plan or assistance with address changes, loststock certificates and share ownership, contact:
Morgan Stanley Dean Witter Trust FSBHarborside Financial Center, Plaza TwoJersey City, NJ 07311-3977800-622-2393
ANNUAL REPORT ON FORM 10-K ANDSTOCKHOLDER INQUIRIES
General information about the Company and copies of theCompany’s Annual Report on Form 10-K filed with the Securitiesand Exchange Commission can be obtained at:
Online:HTTP://WWW.MSDW.COM
Stockholder Helpline:800-733-2307
INVESTOR RELATIONS
Security analysts, portfolio managers and representatives of finan-cial institutions seeking information about the Company are invitedto contact:
Investor Relations:212-762-8131