DEAR CLIENT, INVITATIONEDENRED Zurich Cross-country Company Roadshow 10/11/2016 ... ELTEL SS...
50
ESN Analyser Investment Research Page 1 of 50 Produced & Distributed by the Members of ESN (see last page of this report) ESN Analyser Investment Research 9 November 2016 DEAR CLIENT, INVITATION “31st ESN EUROPEAN CONFERENCE” London, 13 December 2016 Merchant Taylors’ Hall (30 Threadneedle Street, London, EC2R 8JB) Companies available for one-to-one meetings Please consult the ESN website conference dedicated page http://www.esnpartnership.eu/conferences/actual ESN Top Picks Roadshows Corporate Events Tactical Sector Views ESN European Top Picks OPAP (OUT)- SMALL & MID CAPS RECOMMENDATION CHANGES Campari upgraded to Accumulate from Neutral 9M sales higher than expected end EBIT in line NEWS BY SECTOR BANKS Sector News Portugal: Use of ECB funds stable in October 2016 (EUR 23.5bn) Sector News Bank of Portugal statistical data - September 2016 Banca Carige (Neutral) Q3 16 results Creval (Neutral) Q3 16 results Deutsche Pfandbriefbank (Buy) Preview Q3 results (14.11.) Natixis (Accumulate) A lacklustre quarter Poste Italiane (Accumulate) 3Q 2016 preview: insurance ought to lead the performance ELECTRONIC & ELECTRICAL EQUIPMENT Alstom (Buy) Very good half-year results FINANCIAL SERVICES Banca Generali (Not rated) 3Q 16 results better than consensus FinecoBank (Buy) 3Q16 results in line with expectations FOOD & BEVERAGE Campari (Accumulate) 9M sales higher than expected end EBIT in line Raisio (Buy) Raisio’s Q3 results below forecasts, guidance downgraded as a result of GBP depreciation GENERAL RETAILERS Yoox Net-A-Porter (Buy) Further top line growth expected in Q3
Transcript of DEAR CLIENT, INVITATIONEDENRED Zurich Cross-country Company Roadshow 10/11/2016 ... ELTEL SS...

ESN Analyser
Investment Research
Page 1 of 50
Produced & Distributed by the Members of ESN (see last page of this report)
ESN Analyser
Investment Research
9 November 2016
DEAR CLIENT,
INVITATION
“31st ESN EUROPEAN CONFERENCE”
London, 13 December 2016
Merchant Taylors’ Hall (30 Threadneedle Street, London, EC2R 8JB)
Companies available for one-to-one meetings Please consult the ESN website conference dedicated page
http://www.esnpartnership.eu/conferences/actual
ESN Top Picks
Roadshows
Corporate Events
Tactical Sector Views
ESN European Top Picks
OPAP (OUT)- SMALL & MID CAPS
RECOMMENDATION CHANGES
Campari upgraded to Accumulate from Neutral 9M sales higher than expected end EBIT in line
NEWS BY SECTOR
BANKS Sector News Portugal: Use of ECB funds stable in October 2016 (EUR 23.5bn) Sector News Bank of Portugal statistical data - September 2016 Banca Carige (Neutral) Q3 16 results Creval (Neutral) Q3 16 results Deutsche Pfandbriefbank (Buy) Preview Q3 results (14.11.) Natixis (Accumulate) A lacklustre quarter Poste Italiane (Accumulate) 3Q 2016 preview: insurance ought to lead the performance
ELECTRONIC & ELECTRICAL EQUIPMENT Alstom (Buy) Very good half-year results
FINANCIAL SERVICES Banca Generali (Not rated) 3Q 16 results better than consensus FinecoBank (Buy) 3Q16 results in line with expectations
FOOD & BEVERAGE Campari (Accumulate) 9M sales higher than expected end EBIT in line Raisio (Buy) Raisio’s Q3 results below forecasts, guidance downgraded as a result of GBP depreciation
GENERAL RETAILERS Yoox Net-A-Porter (Buy) Further top line growth expected in Q3

ESN Analyser
Investment Research
Page 2 of 50
Produced & Distributed by the Members of ESN (see last page of this report)
HEALTHCARE Epigenomics AG (Buy) Q3 2016, guidance range narrowed, capital increase
INDUSTRIAL ENGINEERING Prysmian (Accumulate) Q3 results: in line with expectations
INSURANCE Banca Mediolanum (Accumulate) 3Q 16 results slightly higher than expected Munich Re (Neutral) Q3 results above our forecast
MATERIALS, CONSTRUCTION & INFRASTRUCTURE Astaldi (Reduce) Decent results expected in Q3 Maire Tecnimont (Accumulate) Good and better than expected results
MEDIA M6-Métropole Télévision (Neutral) Q3 revenues: M6 continues to outperform the TV advertising market Mediaset (Accumulate) 9m 2016 Post: mixed picture Mediaset Espana (Buy) Estimates revised: lower revenues, higher profitability Rcs MediaGroup (Neutral) Q3 2016 Pre: no big expectations
OIL SERVICES Vallourec (Buy) Less-strong-than-expected EBITDA loss, transformation plan progress
PERSONAL GOODS Geox (Accumulate) 9M 16E sales preview Moncler (Buy) 9M 16 sales: another good release Safilo (Neutral) 9M 2016 results preview
REAL ESTATE IGD (Buy) Good results as expected
SOFTWARE & COMPUTER SERVICES Atos (Buy) 2019 plan: a new model across the entire group
SUPPORT SERVICES Batenburg (Accumulate) Positive market trends continued in Q3
TECHNOLOGY HARDWARE & EQUIPMENT Ericsson (Accumulate) Ericsson organises a Capital Markets Day on Thursday in New York Süss MicroTec (Neutral) 3Q16 Review: Disappointing results – guidance confirmed
TELECOMMUNICATIONS Freenet (Buy) Strong results especially in its Media/TV business OTE Hellenic Telecom (Buy) Release of 3Q/9M16 results tomorrow before market opening United Internet (Buy) Hats off to management for fetching a rich valuation
UTILITIES Erg (Accumulate) We expect mixed results in Q3 2016 Hera (Buy) Efficiencies and M&A ought to sustain 9M 2016 results

ESN Top Picks
Page 3 of 50
Produced & Distributed by the Members of ESN (see last page of this report)
Blue Chips Top Picks
Compa ny Count r y S e c t or I de a Ra t i ngP r i c e a s of
0 8 / 11/ 2 0 16
Ta r ge t
P r i c e
Upsi de /
Downsi deEnt r y da t e
Ent r y
pr i c e
Ent r y
pr i c e
( D i v .
Adj )
Tot a l
Re t ur n
Ent r y To
Da t e
Re l . Cml . d
pe r f . v s Eur o
S t ox x
AM ADEUS Spain Sof t ware & Comput er Services Long Buy 41.74 49.20 18% 18/ 08/ 2016 41.96 41.96 - 0 . 5 % -1.2%
CI E FI N . R I CHEM ONT Swit zerland Personal Goods Long Buy 67.05 76.00 13% 17/ 10/ 2016 66.30 66.30 1. 1% 1.6%
I NDI TEX Spain General Ret ailers Long Accumulat e 31.18 36.10 16% 18/ 08/ 2016 30.93 30.33 2 . 8 % 2.1%
KP N TELECOM Net herlands Telecommunicat ions Long Buy 2.85 3.55 25% 20/ 09/ 2016 2.82 2.82 0 . 8 % -0.0%
P OS TE I TALI ANE It aly Banks Long Accumulat e 6.03 7.90 31% 03/ 11/ 2016 5.96 5.96 1. 2 % 0.1%
RELX Net herlands Media Long Accumulat e 14.90 16.75 12% 27/ 10/ 2016 15.14 15.14 - 1. 6 % 0.4%
S TORA ENS O Finland Basic Resources Long Accumulat e 8.51 9.30 9% 17/ 10/ 2016 8.16 8.16 4 . 2 % 4.7%
TECHNI P France Oil Services Long Buy 60.54 67.00 11% 18/ 102016 58.60 58.60 3 . 3 % 3.3% source: ESN Members’ estimates
M/S Caps Top Picks
Compa ny Count r y S e c t or I de a Ra t i ngP r i c e a s of
0 8 / 11/ 2 0 16
Ta r ge t
P r i c e
Upsi de /
Downsi deEnt r y da t e
Ent r y
pr i c e
Ent r y pr i c e
( D i v . Adj )
Tot a l
Re t ur n
Ent r y To
Da t e
Re l . Cml . d
pe r f . v s
Eur o
S t ox x
ACERI NOX Spain Basic Resources Long Buy 10.85 14.00 29% 18/ 08/ 2016 11.71 11.71 - 7 . 4 % -8.1%
ALTRAN France Sof t ware & Comput er Services Long Buy 12.60 15.00 19% 17/ 10/ 2016 13.20 13.20 - 4 . 6 % -4.1%
CAF Spain Indust r ial Transport at ion Long Accumulat e 352.60 390.00 11% 18/ 08/ 2016 342.80 342.80 2 . 9 % 2.1%
DEUTS CHE P FANDBRI EFBANK Germany Banks Long Buy 9.20 12.30 34% 22/ 08/ 2016 8.10 8.10 13 . 6 % 12.7%
FOLLI FOLLI E GROUP Greece General Ret ailers Long Buy 21.33 25.00 17% 07/ 11/ 2016 20.91 20.91 2 . 0 % -0.1%
FORFARM ERS Net herlands Food & Beverage Long Buy 6.82 8.30 22% 28/ 09/ 2016 6.48 6.48 5 . 3 % 4.5%
FUGRO Net herlands Oil Services Long Buy 15.13 19.00 26% 20/ 10/ 2016 15.56 15.56 - 2 . 8 % -1.2%
J UM BO Greece General Ret ailers Long Buy 12.22 14.99 23% 21/ 10/ 2016 12.62 12.35 - 1. 1% 0.9%
NH HOTEL GROUP Spain Travel & Leisure Long Buy 4.06 6.80 68% 18/ 08/ 2016 4.00 4.00 1. 4 % 0.7%
NOS Port ugal Telecommunicat ions Long Buy 5.89 7.00 19% 17/ 10/ 2016 5.89 5.89 0 . 0 % 0.5%
RI B S OFTWARE Germany Sof t ware & Comput er Services Long Buy 13.10 14.00 7% 20/ 06/ 2016 8.29 8.29 5 8 . 0 % 51.8%
TECHNOGYM It aly Personal Goods Long Buy 3.86 4.95 28% 15/ 06/ 2016 3.78 3.78 2 . 2 % -5.6%
THE NAVI GATOR COM P ANY Port ugal Basic Resources Long Buy 2.63 4.60 75% 22/ 06/ 2016 2.72 2.72 - 3 . 2 % -5.4%
YOOX NET- A- P ORTER It aly General Ret ailers Long Buy 25.33 31.30 24% 17/ 10/ 2016 27.82 27.82 - 9 . 0 % -8.5%
source: ESN Members’ estimates
This selection of stocks is not intended to provide a recommended portfolio; therefore there is no point in comparing its performance with any benchmark. The performance of each stock has to be considered independently. Risk factors are taken into account when selecting individual stocks but the risk profile of the selection as a whole is not considered. The approach used to select each investment idea is opportunistic with an absolute return target.

ESN Top Picks
Page 4 of 50
Produced & Distributed by the Members of ESN (see last page of this report)
OPAP (OUT)- SMALL & MID CAPS
Following the outperformance of the stock in the last 4 months and ahead of US elections, we are taking our profits and waiting for a more attractive entry point. OPAP leaves with a 41.8% performance.
Roadshows
Page 5 of 50
Produced & Distributed by the Members of ESN (see last page of this report)
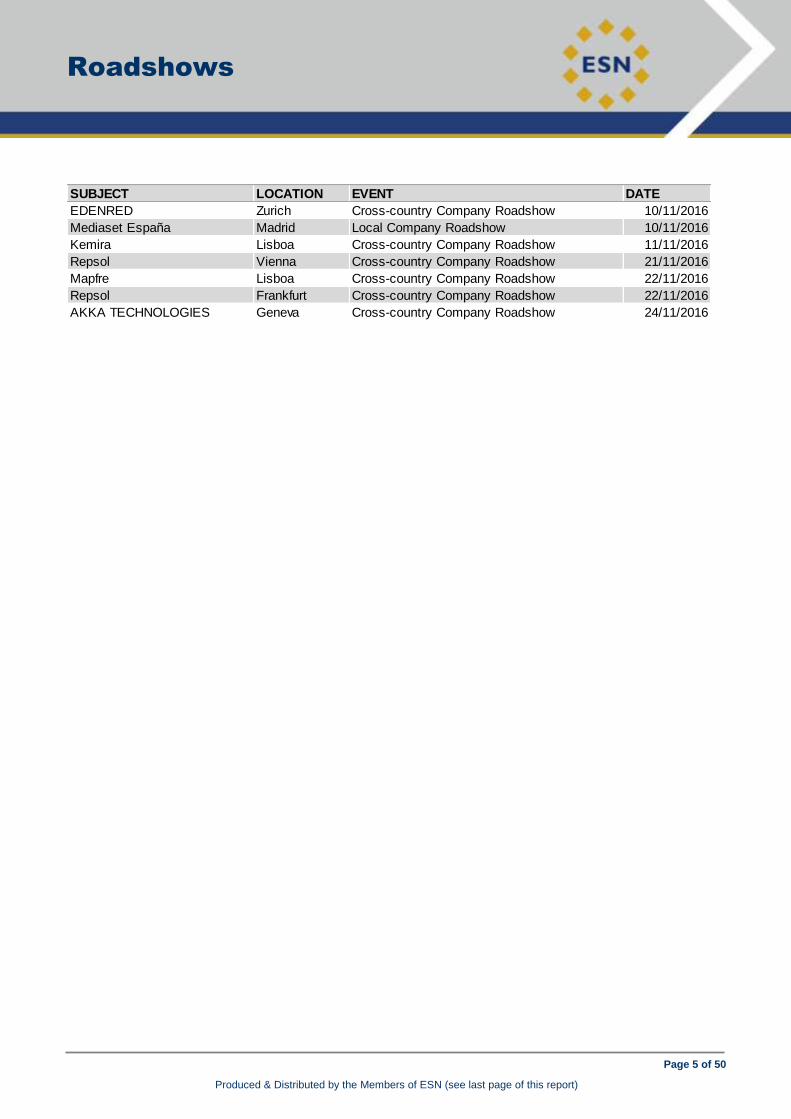
SUBJECT LOCATION EVENT DATE
EDENRED Zurich Cross-country Company Roadshow 10/11/2016
Mediaset España Madrid Local Company Roadshow 10/11/2016
Kemira Lisboa Cross-country Company Roadshow 11/11/2016
Repsol Vienna Cross-country Company Roadshow 21/11/2016
Mapfre Lisboa Cross-country Company Roadshow 22/11/2016
Repsol Frankfurt Cross-country Company Roadshow 22/11/2016
AKKA TECHNOLOGIES Geneva Cross-country Company Roadshow 24/11/2016

Corporate Events
Page 6 of 50
Produced & Distributed by the Members of ESN (see last page of this report)
Corporate Events today
Source: Precise
CompanyBloomberg
codeDate Event Type Description
AIR FRANCE KLM AF FP 09/11/16 Sales October Traffic Figures
AKKA TECHNOLOGIES AKA FP 09/11/16 Trading Update Q3 2016 Sales
ALSTOM ALO FP 09/11/16 Results Interim 2017 Earnings conference call / Webcast
ALO FP 09/11/16 Results Interim 2017 Results
ASTALDI AST IM 09/11/16 Results Q3 2016 Results
BCP BCP PL 09/11/16 Results Q3 2016 Press conference
BCP PL 09/11/16 AGM General Meeting re changes to AoA & board
BENETEAU BEN FP 09/11/16 Results Full year 2016 Results
DANIELI DAN IM 09/11/16 Dividend Payment Full year 2016 Dividend payment date - proposed EUR 0.10
ELTEL ELTEL SS 09/11/16 Results Q3 2016 Results
ELTEL SS 09/11/16 Analyst Meeting Q3 2016 Results presentation / Webcast
EPIGENOMICS AG ECX GR 09/11/16 Results Q3 2016 Results
EURONEXT ENX FP 09/11/16 Results Q3 2016 Results
EUROPCAR EUCAR FP 09/11/16 Results Q3 2016 Results
FREENET FNTN GY 09/11/16 Results Q3 2016 Results
GENERALI G IM 09/11/16 Results Q3 2016 Results
GEOX GEO IM 09/11/16 Trading Update Q3 2016 Sales conference call
GEO IM 09/11/16 Trading Update Q3 2016 Sales
HEIDELBERG CEMENT AG HEI GR 09/11/16 Results Q3 2016 Earnings conference call
HEI GR 09/11/16 Results Q3 2016 Results
HERA HER IM 09/11/16 Results Q3 2016 Earnings conference call / Webcast
HER IM 09/11/16 Results Q3 2016 Results
MAIRE TECNIMONT MT IM 09/11/16 Results Q3 2016 Earnings conference call / Webcast
MT IM 09/11/16 Results Q3 2016 Results
MUNICH RE MUV2 GY 09/11/16 Results Q3 2016 Results
MUV2 GY 09/11/16 Results Q3 2016 Earnings conference call / Webcast
NATIXIS KN FP 09/11/16 Results Q3 2016 Earnings conference call / Webcast
NEURONES NRO FP 09/11/16 Trading Update Q3 2016 Sales
OSRAM LICHT AG OSR GY 09/11/16 Results Full year 2016 Preliminary results
POSTE ITALIANE PST IM 09/11/16 Results Q3 2016 Results
PST IM 09/11/16 Results Q3 2016 Earnings conference call
QGEP QGEP3 BZ 09/11/16 Results Q3 2016 Results
RAISIO RAIVV FH 09/11/16 Results Q3 2016 Results
RCS MEDIAGROUP RCS IM 09/11/16 Results Q3 2016 Results
RUBIS RUI FP 09/11/16 Trading Update Q3 2016 Sales
SAFILO SFL IM 09/11/16 Trading Update Q3 2016 Sales conference call / Webcast
SFL IM 09/11/16 Trading Update Q3 2016 Sales
SBM OFFSHORE SBMO NA 09/11/16 Trading Update Q3 2016 Trading statement
SONAE SON PL 09/11/16 Results Q3 2016 Results
SUESS MICROTEC SMHN GY 09/11/16 Results Q3 2016 Earnings conference call
VIB VERMOEGEN VIH GY 09/11/16 Results Q3 2016 Results
VIVENDI VIV FP 09/11/16 Results Q3 2016 Results
VIV FP 09/11/16 Results Q3 2016 Earnings conference call / Webcast

ESN Tactical Sector Views
Page 7 of 50
Produced & Distributed by the Members of ESN (see last page of this report)
Tactical Sector Allocation Matrix July 2016
SectorCurrent Tactical
ViewAction
Previous
Tactical View
Stoxx 600
Weighting
LATEST REVIEW
DATE
Automobiles & Parts + upgrade = 3% Jul-16
Banks - - 10% Jul-16
Basic Resources = = 2% Jul-16
Chemicals = = 5% Jul-16
Construction & Materials + + 3% Jul-16
Financial Services - dow ngrade = 2% Jul-16
Food & Beverage + + 7% Jul-16
Healthcare + upgrade = 14% Jul-16
Industrial Good & Services + upgrade = 11% Jul-16
Insurance - dow ngrade + 6% Jul-16
Media - dow ngrade = 3% Jul-16
Oil & Gas = = 5% Jul-16
Personal & Household Goods + + 9% Jul-16
Real Estate + upgrade - 2% Jul-16
Retail - dow ngrade = 3% Jul-16
Technology + upgrade = 4% Jul-16
Telecommunications = dow ngrade + 5% Jul-16
Travel & Leisure + + 2% Jul-16
Utilities + upgrade - 4% Jul-16
Legend: + (Overw eight); =/+ (Slightly Overw eight); = (Market Weight); =/- (Slightly Underw eight); - (Underw eight);
Note: The tactical sector view is the shorter term trading view of the ESN strategy team and it can vary from the longer term
fundamental view of the relevant ESN sector analyst team

Page 8 of 50
Produced & Distributed by the Members of ESN (see last page of this report)
Portuguese Banks
Analyser
BANKS
Portugal: Use of ECB funds stable in October 2016 (EUR 23.5bn)
Portugal: Use of ECB funds stable in October 2016 (EUR
23.5bn)
110
120
130
140
150
160
170
180
190
200
out 15 nov 15 dez 15 jan 16 fev 16 mar 16 abr 16 mai 16 jun 16 jul 16 ago 16 set 16 out 16 nov 16
vvdsvdvsdy
The facts: According to Bank of Portugal, the use of ECB funds by Portuguese
banks stood broadly stable in October 2016 (EUR 23.5bn).
Our analysis: October data points out to stabilization in the monthly use of
liquidity provided by the European Central Bank.
As we have highlighted in previous comments, the downward trend in the use of
this type of funding has been quite evident, with a cumulative reduction of EUR
2.6bn or 10.1% YtD. In fact, it should also be referred that the figure reported in
October is close to a 6 years minimum (being the 5th lowest since May 2010).
Overall, the use of ECB funds has been presenting a consistent downward
trend. This variable initiated a strong decline in 3Q13 (with a cumulative
reduction of EUR 28.3bn or 55% between 30 September 2013 and 31 October
2016). Since 9M13, there were 27 monthly reductions in the use of ECB funds
by Portuguese banks in the last 37 months.
On the other hand, we highlight that the bulk of this funding (88% or EUR
20.7bn) is related to the use of Long Term Refinancing Operations (LTRO & T-
LTRO).
Exhibit 1: Portuguese banks – total funding via ECB (EUR bn)
Source: Bank of Portugal & CaixaBI Equity Research
From our point of view, the evolution of this variable is a strong signal of the
positive developments in the funding position of Portuguese banks (the
consolidated Loans-to-Deposits ratio of the banking system is now close to
100% vs. 128% in December 2012 and 158% in December 2010).
Conclusion & Action: Our central scenario is that banks will continue to
present a gradual reduction in the use of these funds. In any case, we expect
those banks to continue to take benefits from the (very) low cost of the current
T-LTRO funding operations made available by ECB. Moreover, the
deleveraging process also continued in the banking system (reduction of
outstanding loans of 2.5% YoY in the corporate segment and 2.2% in the
households segment by the end of August 2016) with a resilient evolution of
deposits from households (+2.4% YoY by the end of September 2016).
---------- Stoxx Banks,
DJ Stoxx TMI rebased on sector
Analyst(s):
André Rodrigues Caixa-Banco de Investimento
+351 21 389 68 39
23.5
0.0
10.0
20.0
30.0
40.0
50.0
60.0
Feb-12 Oct-12 Jun-13 Feb-14 Oct-14 Jun-15 Feb-16 Oct-16

Page 9 of 50
Produced & Distributed by the Members of ESN (see last page of this report)
Portuguese Banks II
Analyser
BANKS
Portugal: Use of ECB funds stable in October 2016 (EUR 23.5bn)
Bank of Portugal statistical data - September 2016
110
120
130
140
150
160
170
180
190
200
out 15 nov 15 dez 15 jan 16 fev 16 mar 16 abr 16 mai 16 jun 16 jul 16 ago 16 set 16 out 16 nov 16
vvdsvdvsdy
The facts: Bank of Portugal published its monthly statistical data with the
evolution of credit and deposits (latest figures refer to the end of September
2016).
Our analysis: September figures presented 11bps improvement in the total
NPL ratio to 9.05% from 9.16% in August 2016. In any case, and on a yearly
basis, this data is equivalent to 21bps deterioration from the 9.26% NPL ratio
reported by the end of September 2015. We highlight that this monthly evolution
is contrary to the general trend observed in the last months (as it was visible an
asset quality deterioration throughout 2016) and should likely be related to some
seasonal (end of period) adjustments.
In terms of credit segments, these monthly figures reflected a 17bps YoY
improvement in the private segment NPL ratio to 4.25% from 4.42% in
September 2015 and a 2bps deterioration in the corporate segment to 16.27%
(in spite of the 21bps monthly improvement from the 16.48% ratio disclosed in
August).
On the other hand, the stock of deposits maintained a positive YoY evolution
(+3.5% YoY), with an increase of 2.4% YoY in the case of deposits from
households and 8.5% YoY in the corporate segment. Interest rates on new
deposits from households drop by 3bp MoM to 0.35%, being 21bps below the
0.56% disclosed by the end of September 2015.
Exhibit 1: Portuguese Banks – Credit and Deposits data, September 2016
Source: BoP & CaixaBI Research. Data as EUR thousands and excludes securitised
loans. YoY variations adjusted for write-offs and reclassifications.
For more details see our flash note: “Bank of Portugal statistical data -
September 2016”, published yesterday after the market close.
---------- Stoxx Banks,
DJ Stoxx TMI rebased on sector
Analyst(s):
André Rodrigues Caixa-Banco de Investimento
+351 21 389 68 39
Sep-16 Sep-15 D YoY Aug-16 D MoM
A. Loans
Private individuals (1. + 2- + 3.) 117,950 121,166 -2.20% 118,142 -0.16%
Non-performing loans - private 5,012 5,358 -6.46% 5,070 -1.14%
As a % of loans 4.25% 4.42% -0.17 pp 4.29% -0.042 pp
1. Consumption 12,986 11,946 10.70% 12,877 0.85%
Non-performing loans - Consumption 968 1,262 -23.30% 955 1.36%
As a % of loans 7.45% 10.56% -3.11 pp 7.42% 0.04 pp
2. Housing 95,792 99,571 -3.70% 95,999 -0.22%
Non-performing loans - Housing 2,606 2,557 1.92% 2,608 -0.08%
As a % of loans 2.72% 2.57% 0.15 pp 2.72% 0 pp
3. Other purposes 9,172 9,649 -3.20% 9,266 -1.01%
Non-performing loans - Other 1,438 1,539 -6.56% 1,507 -4.58%
As a % of loans 15.68% 15.95% -0.27 pp 16.26% -0.59 pp
Corporate 78,478 83,720 -2.50% 78,636 -0.20%
Non-performing loans - Corporate 12,772 13,611 -6.16% 12,960 -1.45%
As a % of loans 16.27% 16.26% 0.02 pp 16.48% -0.21 pp
Total Loans (Private + Corporate) 196,428 204,886 -2.32% 196,778 -0.18%
Non-performing loans 17,784 18,969 -6.25% 18,030 -1.36%
As a % of loans 9.05% 9.26% -0.205 pp 9.16% -0.109 pp
B. Deposits
Deposits - Private individuals 140,199 136,959 2.37% 140,691 -0.35%
Deposits - Corporate 33,489 30,854 8.54% 33,334 0.46%
Total Deposits 173,688 167,813 3.50% 174,025 -0.19%

Page 10 of 50
Produced & Distributed by the Members of ESN (see last page of this report)
Banca Carige
Italy/Banks Analyser
BANKS
Banca Carige (Neutral) Bank of Portugal statistical data - September 2016
Q3 16 results
The facts: Banca Carige published and presented Q3 16 results overnight.
Our analysis: Banca Carige closed Q3 16 with a net loss of EUR -39m,
substantially in line with our EUR -37m forecast.
(EUR m) Q3 16A Q3 16E Differ. Q3 15A Y/Y Q2 16A Q/Q
Revenues 159 154 3.2% 166 -4.2% 181 -12.2%
Operating
costs -151 -139 8.6% -143 5.6% -139 8.6%
GOP 8 15 -46.7% 23 -65.2% 42 -81.0%
Loan
provisions -73 -73 0.0% -65 12.3% -252 -71.0%
Net Profit -39 -37 5.4% -17 nm -165 nm
At the operating level, the performance was weaker than expected due to higher
expenses, with a gross profit (GOP) of just EUR 8m vs. our 15m estimate and a
C/I ratio of 95%. Total revenues decreased 4.5% Y/Y to EUR 158.5m but were
3% better than expected due to a trading income up 26% Y/Y to EUR 17m vs. our
8m forecast, while the NII was down 5% Y/Y to EUR 71.5m vs. our flattish
estimate and net commissions declined 10.5% Y/Y to EUR 59m or 6% worse than
anticipated. Operating costs increased 5.6% Y/Y to EUR 151m or 8.5% worse
than expected, weighted by EUR 15.5m systemic/one-off costs.
Loan impairments increased 12% Y/Y to EUR 73m and were bang in line, with a
still high cost of credit risk of ca. 150bps as the coverage of impaired loans further
increased 30bps Q/Q to 45.9%.
During the presentation, the CEO pointed out that 12.3% CET1 ratio benefitted in
9M of 55bps transitional adj. on the result for the period, due to be reabsorbed in
Q4; net of it, the ratio would be 11.7%, a touch higher than 11.25% SREP
requirement referred to last year. Discussions are ongoing with the ECB following
the recent Draft Decisions, but he stressed NPL requests for 2017 are in line with
the bank’s business plan targets, while 2018-19 still have to be confirmed. The
CEO sees some flexibility in capital mgmt. given new SREP floor and guidance.
Top mgmt stressing initiatives for NPL securitization are ongoing and should be
finalized in Q1 17 for around EUR 1bn, while overall funding is accelerating at
better conditions and should be beneficial on NII starting from Q4.
Conclusion & Action: No major surprises in this set of numbers. We reiterate
Neutral with EUR 0.3 TP.
Analyst(s):
Luigi Tramontana, Banca Akros
+39 02 4344 4239
Neutral
0.31
closing price as of 08/11/2016
0.30
Target Price unchanged
Recommendation unchanged
Target price: EUR
Share price: EUR
Reuters/Bloomberg CRGI.MI/CRG IM
Market capitalisation (EURm) 257
Current N° of shares (m) 830
Free float 74%
Daily avg. no. trad. sh. 12 mth 10,316
Daily avg. trad. vol. 12 mth (m) 956
Price high 12 mth (EUR) 1.65
Price low 12 mth (EUR) 0.28
Abs. perf. 1 mth 0.55%
Abs. perf. 3 mth -0.13%
Abs. perf. 12 mth -81.56%
Key financials (EUR) 12/15 12/16e 12/17e
Total Revenue (m) 791 671 695
Pre-Provision Profit (PPP) (m) 71 88 135
Operating profit (OP) -215 -412 -57
Earnings Before Tax (m) -258 -517 -147
Net Profit (adj.) (m) -173 -299 -56
Shareholders Equity (m) 2,544 2,170 2,023
Tangible BV (m) 2,467 2,112 1,966
RWA (m) 19,978 18,385 18,299
ROTE -8.3% -13.1% -2.8%
Total Capital Ratio (B3) 14.9% 14.2% 13.5%
Cost/Income 89.8% 83.8% 78.3%
NPL ratio (gross) 14.3% 11.2% 10.7%
P/PPP 14.8 2.9 1.9
P/E (adj.) nm nm nm
P/BV 0.4 0.1 0.1
P/TBV 0.4 0.1 0.1
Dividend Yield 0.0% 0.0% 0.0%
PPPPS 0.09 0.11 0.16
EPS (adj.) -0.21 -0.36 -0.07
BVPS 3.06 2.61 2.44
TBVPS 2.97 2.54 2.37
DPS 0.00 0.00 0.00
0.2
0.4
0.6
0.8
1.0
1.2
1.4
1.6
1.8
ott 15 nov 15 dic 15 gen 16 feb 16 mar 16 apr 16 mag 16 giu 16 lug 16 ago 16 set 16 ott 16 nov 16
vvdsvdvsdy
BANCA CARIGE Stoxx Banks (Rebased)Source: Factset
Shareholders: Malacalza 17%; BPCE 1.90%; local
Foundations 6%; Volpi 6%;

Page 11 of 50
Produced & Distributed by the Members of ESN (see last page of this report)
Creval
Italy/Banks Analyser
BANKS
Creval (Neutral) Q3 16 results
Q3 16 results
The facts: Creval published overnight the Q3 16 results. A conference call
presentation is scheduled today at 10.00am CET.
Our analysis: As we anticipated, Creval reported a very negative quarter, ending
with a net loss of EUR -155m vs. our -125m forecast, due to the first step to
increase the NPL coverage ratios. Indeed, the coverage has been increased
110bps Q/Q to 53.9% on the bad loans and 460bps to 28% on UTP loans,
leading to an overall 40.3% coverage on all impaired loans vs. 37.8% in Q2 16.
The loan impairments to increase this coverage was EUR 237m vs. 217m we
anticipated, with a cost of credit risk of 286bps in 9M 16.
Following the quarterly loss, the CET1 ratio decreased 60bps Q/Q to 12.4%.
(EUR m) Q3 16A Q3 16E Differ. Q3 15A Y/Y Q2 16A Q/Q
Revenues 163 156 4.5% 203 -19.7% 209 -22.0%
Operating costs -123 -123 0.0% -123 0.0% -130 -5.4%
GOP 40 33 21.2% 80 -50.0% 79 -49.4%
Loan provisions -237 -217 9.2% -67 nm -103 nm
Net Profit -155 -125 24.0% 12 nm 14 nm
At the operating level, total revenues decreased 20% Y/Y to EUR 163m vs. our
163m estimate, with the NII down almost 9% Y/Y to EUR 105m as expected and
net commissions flat Y/Y at EUR 69m, while the financial income was negative for
EUR -15m vs. our -20m forecast and was impacted by a one-off loss on the
disposal of a gross NPL secured portfolio of EUR 106m to Credito Fondiario.
Operating costs were flat Y/Y and bang in line at EUR 123m, leading to a gross
operating profit (GOP) of EUR 40m, halved Y/Y with a C/I ratio of 75.5%.
Conclusion & Action: Creval will communicate today the 2017-18 Action plan in
a separate notice. Neutral reiterated.
Analyst(s):
Luigi Tramontana, Banca Akros
+39 02 4344 4239
Neutral
0.38
closing price as of 08/11/2016
0.45
Target Price unchanged
Recommendation unchanged
Target price: EUR
Share price: EUR
Reuters/Bloomberg PCVI.MI/CVAL IM
Market capitalisation (EURm) 417
Current N° of shares (m) 1,109
Free float 100%
Daily avg. no. trad. sh. 12 mth 6,472
Daily avg. trad. vol. 12 mth (m) 1,428
Price high 12 mth (EUR) 1.17
Price low 12 mth (EUR) 0.30
Abs. perf. 1 mth 21.48%
Abs. perf. 3 mth 7.43%
Abs. perf. 12 mth -66.89%
Key financials (EUR) 12/15 12/16e 12/17e
Total Revenue (m) 855 759 773
Pre-Provision Profit (PPP) (m) 287 240 254
Operating profit (OP) -156 -352 86
Earnings Before Tax (m) 24 -426 86
Net Profit (adj.) (m) -160 -292 52
Shareholders Equity (m) 2,183 1,875 1,927
Tangible BV (m) 2,078 1,770 1,821
RWA (m) 15,479 16,936 17,244
ROTE -8.1% -15.2% 2.9%
Total Capital Ratio (B3) 15.1% 11.9% 11.7%
Cost/Income 64.4% 67.6% 66.3%
NPL ratio (gross) 13.1% 12.3% 12.7%
P/PPP 4.2 1.7 1.6
P/E (adj.) nm nm 8.1
P/BV 0.6 0.2 0.2
P/TBV 0.6 0.2 0.2
Dividend Yield 8.0% 0.0% 2.7%
PPPPS 0.26 0.22 0.23
EPS (adj.) -0.14 -0.26 0.05
BVPS 1.97 1.69 1.74
TBVPS 1.87 1.60 1.64
DPS 0.03 0.00 0.01
0.30
0.40
0.50
0.60
0.70
0.80
0.90
1.00
1.10
1.20
Oct 15 Nov 15 Dec 15 Jan 16 Feb 16 Mar 16 Apr 16 May 16 Jun 16 Jul 16 Aug 16 Sep 16 Oct 16 Nov 16
vvdsvdvsdy
CREVAL Stoxx Banks (Rebased)Source: Factset
Shareholders:

Page 12 of 50
Produced & Distributed by the Members of ESN (see last page of this report)
Deutsche Pfandbriefbank
Germany/Banks Analyser
BANKS
Deutsche Pfandbriefbank (Buy) Q3 16 results
Preview Q3 results (14.11.)
The facts: As we expect PBB to book the proceeds from the Heta write-down in
Q3 we forecast a record result for Q3. Even if assuming that PBB will use part of
the proceeds to book some provisions (as a buffer) we expect pretax profit to
come in at EUR 141m (+166% yoy). The adjusted pretax profit should amount to
EUR 41m which would be on the Q2 ’16 level (EUR 42m). CT1 ratio should have
increased by 10 bp’s qoq to 18.5% (excluding the 9M profit). Hopefully, the bank
will give some guidance on 2017 and say something about this year’s dividend
policy, i.e. how much of the positive one-off will be paid out as dividend.
Our analysis: We expect PAT to book provisions of EUR 32m as a buffer for
future potential risks out of the EUR 132m Heta proceeds. By doing this the bank
has some buffer going forward and does not have to pay a too high extra
dividend. Underlying pretax profit should have been more or less stable qoq at
EUR 41m. While both net interest and commission income should have been
slightly up by EUR 1m qoq, this should have been offset by slightly higher costs
and higher risk provisions of EUR 3m (on a net level we forecast PBB to have
released risk provisions of EUR 6m in Q3 as part of the Heta one-off should have
been booked under risk provisions).
Conclusion & Action: Due to a positive one-off we expect PBB to post a
quarterly record result next Monday; the underlying profit development should
have been stable qoq. Key question will be how much of the positive one-off will
be paid out as an extra dividend (equinet estimate: at least EUR 0.20).
While pbb is clearly not a growth story, we like the shares as they offer a high
normal dividend yield of 6% for 2016 which should be even at 8% if including the
positive one-off related to Heta. Additionally PBB is strongly capitalized (CT1 B3
FL: 18%) and has a high asset quality (NPL ratio of 1%) while trading at 2017e
P/B of 0.4x. While margins in real estate financing, pbb’s main earnings
contributor, should remain under pressure in 2016, earnings should benefit from a
capital shift from low margin (non-core) assets to higher margin (core) assets in
the medium term.
Analyst(s):
Philipp Häßler, CFA, equinet Bank
+49 69 58997 414
Buy
9.20
closing price as of 08/11/2016
12.30
Target Price unchanged
Recommendation unchanged
Target price: EUR
Share price: EUR
Reuters/Bloomberg PBBG.DE/PBB GR
Market capitalisation (EURm) 1,238
Current N° of shares (m) 134
Free float 80%
Daily avg. no. trad. sh. 12 mth 316
Daily avg. trad. vol. 12 mth (m) 2,004
Price high 12 mth (EUR) 11.30
Price low 12 mth (EUR) 7.43
Abs. perf. 1 mth 5.54%
Abs. perf. 3 mth 6.05%
Abs. perf. 12 mth -17.42%
Key financials (EUR) 12/15 12/16e 12/17e
Total Revenue (m) 421 402 424
Pre-Provision Profit (PPP) (m) 214 191 210
Operating profit (OP) 215 166 175
Earnings Before Tax (m) 195 186 185
Net Profit (adj.) (m) 230 154 155
Shareholders Equity (m) 2,731 2,746 2,805
Tangible BV (m) 2,731 2,746 2,805
RWA (m) 13,402 13,804 14,218
ROTE 7.4% 5.6% 5.6%
Total Capital Ratio (B3) 0.0% 0.0% 0.0%
Cost/Income 49.2% 52.5% 50.3%
NPL ratio (gross) 1.3% 1.2% 1.2%
P/PPP 7.0 6.5 5.9
P/E (adj.) 6.5 8.0 8.0
P/BV 0.6 0.5 0.4
P/TBV 0.6 0.5 0.4
Dividend Yield 4.7% 6.2% 6.3%
PPPPS 1.59 1.42 1.56
EPS (adj.) 1.71 1.15 1.15
BVPS 20.31 20.42 20.86
TBVPS 20.31 20.42 20.86
DPS 0.43 0.57 0.58
6.5
7.0
7.5
8.0
8.5
9.0
9.5
10.0
10.5
11.0
11.5
Oct 15 Nov 15 Dec 15 Jan 16 Feb 16 Mar 16 Apr 16 May 16 Jun 16 Jul 16 Aug 16 Sep 16 Oct 16 Nov 16
vvdsvdvsdy
DEUTSCHE PFANDBRIEFBANK Stoxx Banks (Rebased)Source: Factset
Shareholders: Federal Republic of Germany 20%;
Deutsche Pfandbriefbank - Preview Q3 2016
EUR m Q3 2016e (eq) Q3 2015 yoy Consensus delta
Revenues 185 98 89% na
of which NII 94 95 -1% na
Expenses 50 52 -4% na
CIR 27.0% 53.1% -2603 BP na
Risk provis. -6 -3 na na
EBT 141 53 166% na
Net income 139 53 162% na
Sources: PBB, equinet Research

Page 13 of 50
Produced & Distributed by the Members of ESN (see last page of this report)
Natixis
France/Banks Analyser
BANKS
Natixis (Accumulate) Preview Q3 results (14.11.)
A lacklustre quarter
The facts: Q3-2016 in line with expectations. Presentation of a draft
transformation and operating excellence plan aimed at achieving full-year savings
of EUR250m from 2019, after an investment of EUR220m (between 2017 and
2018).
Our analysis: Revenue was down 2% (+7% for core businesses) at EUR1,924m
(vs EUR1,916m for the consensus); expenses totalled EUR1,447m (+4%), vs
EUR1,416m, and EBITDA was down a significant 17% at EUR477m (vs
EUR500m). The cost of risk was down 17% yoy (CoR on core businesses of
30bp, vs 37bp in Q2-2016). Attributable net profit was up 2% at EUR298m (vs
EUR282m), including a capital gain of EUR97m. The savings solutions division
reported revenue down 4%. In asset management (-9%), net outflows were again
recorded in the amount of EUR8bn, mainly on equity funds at Harris. AuM totalled
EUR798bn, vs EUR787bn in Q2-2016, with a market effect offsetting outflows.
Note however that margins firmed to 13bp in Europe (DNCA). Insurance revenue
was up 10%. In P&C, the combined ratio was a very good 92.3% over nine
months. CIB revenues were EUR813m, excluding CVA/DVA (+15%): FICC up
36% (Asia and America) and equities up 14%. The SFS division posted revenue
up 3% thanks to deposits (31%) and factoring (+15%), and will now centralise
payment activities including digital formats on behalf of BPCE. The CT1 was
10.5% (+30bp) with a 2017 SREP of 7.75% (of which 2% of P2R, which seems
high vs peers). ROE was 12.6% for core businesses in 9M. ROTE was 9.9%. The
company has an amount of EUR700m (22 cents per share) for distribution
beyond the minimum payout ratio of 50% (15 cents) in the absence of external
growth.
Conclusion & Action: The company continues to suffer in asset management,
deemed a strength, and will have trouble meeting its ROTE target of 11.5% in
2017. The potential yield remains attractive. TP of EUR5.3 (P/TBV of 1.2x) and
recommendation unchanged.
Analyst(s):
Pierre Chedeville, CM - CIC Market Solutions
+33 1 53 48 80 97
Accumulate
4.62
closing price as of 08/11/2016
5.30
Target Price unchanged
Recommendation unchanged
Target price: EUR
Share price: EUR
Reuters/Bloomberg CNAT.PA/KN FP
Market capitalisation (EURm) 14,264
Current N° of shares (m) 3,086
Free float 30%
Daily avg. no. trad. sh. 12 mth 5,498
Daily avg. trad. vol. 12 mth (m) 39,568
Price high 12 mth (EUR) 5.86
Price low 12 mth (EUR) 3.08
Abs. perf. 1 mth 4.10%
Abs. perf. 3 mth 27.68%
Abs. perf. 12 mth -22.15%
Key financials (EUR) 12/15 12/16e 12/17e
Total Revenue (m) 8,704 8,438 8,276
Pre-Provision Profit (PPP) (m) 2,749 2,389 2,638
Operating profit (OP) 2,457 2,120 2,397
Earnings Before Tax (m) 2,472 2,157 2,432
Net Profit (adj.) (m) 1,233 1,059 1,228
Shareholders Equity (m) 19,160 18,106 18,742
Tangible BV (m) 15,601 14,547 15,183
RWA (m) 113,300 113,300 113,300
ROTE 6.5% 5.7% 6.7%
Total Capital Ratio (B3) 15.0% 16.0% 17.0%
Cost/Income 68.4% 71.7% 68.1%
NPL ratio (gross) 3.7% 3.6% 3.6%
P/PPP 5.8 6.0 5.4
P/E (adj.) 13.0 13.4 11.6
P/BV 1.0 0.9 0.9
P/TBV 1.0 1.0 0.9
Dividend Yield 7.6% 5.1% 5.9%
PPPPS 0.89 0.78 0.86
EPS (adj.) 0.40 0.34 0.40
BVPS 5.31 5.30 5.30
TBVPS 5.07 4.72 4.93
DPS 0.35 0.24 0.27
3.0
3.5
4.0
4.5
5.0
5.5
6.0
Oct 15 Nov 15 Dec 15 Jan 16 Feb 16 Mar 16 Apr 16 May 16 Jun 16 Jul 16 Aug 16 Sep 16 Oct 16 Nov 16
vvdsvdvsdy
NATIXIS Stoxx Banks (Rebased)Source: Factset
Shareholders: BPCE 70%;

Page 14 of 50
Produced & Distributed by the Members of ESN (see last page of this report)
Poste Italiane
Italy/Banks Analyser
BANKS
Poste Italiane (Accumulate) A lacklustre quarter
3Q 2016 preview: insurance ought to lead the performance
The facts: Poste is due to report its 3Q 16 results today during trading hours. A
conference call is going to be held at 18.00 CET.
Our analysis: we summarize our preview in the following table.
3Q16E Y/Y 9M16E Y/Y 3Q15 9M15
-mail and parcel services 850 -5.3% 2,734 -3.6% 898 2,836
-financial services 1,280 -1.1% 4,110 3.4% 1,294 3,974
-insurance services 5,835 2.0% 18,689 10.4% 5,721 16,930
-other services 55 -5.2% 169 -6.6% 58 181
Total revenues 8,020 0.6% 25,702 7.4% 7,971 23,921
Total expenses -7,716 0.5% -24,555 6.8% -7,679 -22,991
-mail and parcel services -55 14.6% 19 -113.9% -48 -137
-financial services 215 -1.8% 700 1.9% 219 687
-insurance services 138 20.0% 408 16.2% 115 351
-other services 6 0.0% 20 -31.0% 6 29
Operating profit 304 4.1% 1,147 23.3% 292 930
Net profit 205 9.8% 770 23.8% 187 622
Source: Company data, Banca Akros estimates
We expect total revenues of c. EUR 8,020bn, +0.6% Y/Y, mainly thanks to the
insurance services, which, despite the strong increase in the first two quarter of
the year, we expect still growing, better than the Italian market as a whole (-11.7%
at the end of September). The financial services business unit (-11% Y/Y) we
expect is still suffering the low interest rates, while in the mail and parcels
business (-5.3% Y/Y), we believe the growth in parcels is likely to be less strong
than previous expected. After costs we estimate slightly higher than last year
(+0.5% Y/Y), the operating profit ought to close around EUR 304m, +4.1% Y/Y,
mainly thanks to the exploit we estimate in the insurance segment (+20% Y/Y)
again. The net profit is seen around EUR 205m, +9.8% Y/Y.
Conclusion & Action: we expect a good set of results, coherent with our current
FY16 estimates. We believe the expected EPS growth (c. +15% in 2016 -2018)
can be bought at a reasonable price (Adj. P/E 2016 and 2017 at c. 10x and 8x
respectively).The insurance and financial services are likely to play a key role in
focusing and diversifying the offer on more profitable and marketable products,
such as asset management services and P&C (Non-Auto). The capillarity of the
distribution network and one of the largest client bases in Italy ought to underpin
the upside in the medium term. However, it takes time to deliver value. Investors
ought to bet on the group’s enormous potential, which could emerge in 3 years at
least, when Poste is likely to end the current restructuring process and take
further steps towards its competitive repositioning. In the meantime, the huge
amount of unrealised capital gains (c. EUR 17bn at group level at the end of
2015) could temporarily cushion the negative impact from the low interest rates.
In the short term, Poste could also consider some acquisitions in the parcel
business and in payment platform operators. The RE assets could represent
further hidden value in the long term. The offer on Pioneer is still pending: if the
price offered is around EUR 4bn, the stock could react negatively in the short
term, although we believe the acquisition could create value in the medium term.
The delivery of the plan and its execution remain the main risks.
Analyst(s):
Enrico Esposti, CIIA, Banca Akros
+39 02 4344 4022
Accumulate
6.03
closing price as of 08/11/2016
7.90
Target Price unchanged
Recommendation unchanged
Target price: EUR
Share price: EUR
Reuters/Bloomberg PST.MI/PST IM
Market capitalisation (EURm) 7,869
Current N° of shares (m) 1,306
Free float 35%
Daily avg. no. trad. sh. 12 mth 3,629
Daily avg. trad. vol. 12 mth (m) 9,776
Price high 12 mth (EUR) 7.20
Price low 12 mth (EUR) 5.17
Abs. perf. 1 mth -0.17%
Abs. perf. 3 mth -6.08%
Abs. perf. 12 mth -9.40%
Key financials (EUR) 12/15 12/16e 12/17e
Total Revenue (m) 30,738 32,667 33,304
Pre-Provision Profit (PPP) (m) 880 910 1,096
Operating profit (OP) 880 910 1,096
Earnings Before Tax (m) 933 933 1,120
Net Profit (adj.) (m) 825 813 958
Shareholders Equity (m) 9,658 9,785 10,036
Tangible BV (m) 9,658 9,785 10,036
RWA (m) 12,613 13,119 13,639
ROTE 8.5% 8.3% 9.5%
Total Capital Ratio (B3) 0.0% 0.0% 0.0%
Cost/Income 97.1% 97.2% 96.7%
NPL ratio (gross) 0.0% 0.0% 0.0%
P/PPP 10.5 8.6 7.2
P/E (adj.) 11.2 9.7 8.2
P/BV 1.0 0.8 0.8
P/TBV 1.0 0.8 0.8
Dividend Yield 5.6% 5.8% 7.2%
PPPPS 0.67 0.70 0.84
EPS (adj.) 0.63 0.62 0.73
BVPS 7.39 7.49 7.68
TBVPS 7.39 7.49 7.68
DPS 0.34 0.35 0.43
4.5
5.0
5.5
6.0
6.5
7.0
7.5
Oct 15 Nov 15 Dec 15 Jan 16 Feb 16 Mar 16 Apr 16 May 16 Jun 16 Jul 16 Aug 16 Sep 16 Oct 16 Nov 16
vvdsvdvsdy
POSTE ITALIANE FTSE MIB (Rebased)Source: Factset
Shareholders: Ministry of Economy and Finance 65%;
Page 15 of 50
Produced & Distributed by the Members of ESN (see last page of this report)
Alstom
France/Electronic & Electrical Equipment Analyser
ELECTRONIC & ELECTRICAL EQUIPMENT
Alstom (Buy) 3Q 2016 preview: insurance ought to lead the performance
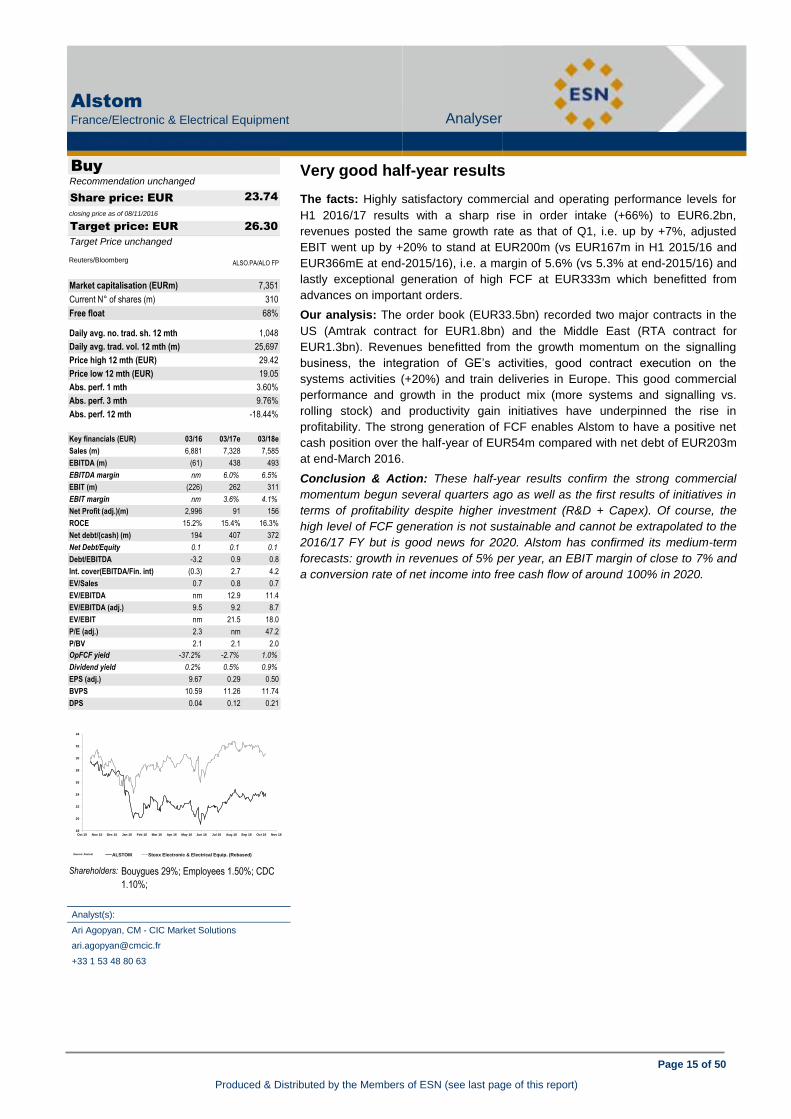
Very good half-year results
The facts: Highly satisfactory commercial and operating performance levels for
H1 2016/17 results with a sharp rise in order intake (+66%) to EUR6.2bn,
revenues posted the same growth rate as that of Q1, i.e. up by +7%, adjusted
EBIT went up by +20% to stand at EUR200m (vs EUR167m in H1 2015/16 and
EUR366mE at end-2015/16), i.e. a margin of 5.6% (vs 5.3% at end-2015/16) and
lastly exceptional generation of high FCF at EUR333m which benefitted from
advances on important orders.
Our analysis: The order book (EUR33.5bn) recorded two major contracts in the
US (Amtrak contract for EUR1.8bn) and the Middle East (RTA contract for
EUR1.3bn). Revenues benefitted from the growth momentum on the signalling
business, the integration of GE’s activities, good contract execution on the
systems activities (+20%) and train deliveries in Europe. This good commercial
performance and growth in the product mix (more systems and signalling vs.
rolling stock) and productivity gain initiatives have underpinned the rise in
profitability. The strong generation of FCF enables Alstom to have a positive net
cash position over the half-year of EUR54m compared with net debt of EUR203m
at end-March 2016.
Conclusion & Action: These half-year results confirm the strong commercial
momentum begun several quarters ago as well as the first results of initiatives in
terms of profitability despite higher investment (R&D + Capex). Of course, the
high level of FCF generation is not sustainable and cannot be extrapolated to the
2016/17 FY but is good news for 2020. Alstom has confirmed its medium-term
forecasts: growth in revenues of 5% per year, an EBIT margin of close to 7% and
a conversion rate of net income into free cash flow of around 100% in 2020.
Analyst(s):
Ari Agopyan, CM - CIC Market Solutions
+33 1 53 48 80 63
Buy
23.74
closing price as of 08/11/2016
26.30
Target Price unchanged
Recommendation unchanged
Target price: EUR
Share price: EUR
Reuters/Bloomberg ALSO.PA/ALO FP
Market capitalisation (EURm) 7,351
Current N° of shares (m) 310
Free float 68%
Daily avg. no. trad. sh. 12 mth 1,048
Daily avg. trad. vol. 12 mth (m) 25,697
Price high 12 mth (EUR) 29.42
Price low 12 mth (EUR) 19.05
Abs. perf. 1 mth 3.60%
Abs. perf. 3 mth 9.76%
Abs. perf. 12 mth -18.44%
Key financials (EUR) 03/16 03/17e 03/18e
Sales (m) 6,881 7,328 7,585
EBITDA (m) (61) 438 493
EBITDA margin nm 6.0% 6.5%
EBIT (m) (226) 262 311
EBIT margin nm 3.6% 4.1%
Net Profit (adj.)(m) 2,996 91 156
ROCE 15.2% 15.4% 16.3%
Net debt/(cash) (m) 194 407 372
Net Debt/Equity 0.1 0.1 0.1
Debt/EBITDA -3.2 0.9 0.8
Int. cover(EBITDA/Fin. int) (0.3) 2.7 4.2
EV/Sales 0.7 0.8 0.7
EV/EBITDA nm 12.9 11.4
EV/EBITDA (adj.) 9.5 9.2 8.7
EV/EBIT nm 21.5 18.0
P/E (adj.) 2.3 nm 47.2
P/BV 2.1 2.1 2.0
OpFCF yield -37.2% -2.7% 1.0%
Dividend yield 0.2% 0.5% 0.9%
EPS (adj.) 9.67 0.29 0.50
BVPS 10.59 11.26 11.74
DPS 0.04 0.12 0.21
18
20
22
24
26
28
30
32
34
Oct 15 Nov 15 Dec 15 Jan 16 Feb 16 Mar 16 Apr 16 May 16 Jun 16 Jul 16 Aug 16 Sep 16 Oct 16 Nov 16
vvdsvdvsdy
ALSTOM Stoxx Electronic & Electrical Equip. (Rebased)Source: Factset
Shareholders: Bouygues 29%; Employees 1.50%; CDC
1.10%;

Page 16 of 50
Produced & Distributed by the Members of ESN (see last page of this report)
Banca Generali
Italy/Financial Services Analyser
FINANCIAL SERVICES
Banca Generali (Not rated) Very good half-year results
3Q 16 results better than consensus
The facts: Banca Generali reported its 3Q 16 numbers yesterday during trading
hours. A conference call was held the same day at 15.00 CET.
3Q16 Y/Y A/E 9M16 3Q16E 9M16E 3Q15 9M15
Total Revenues 121 71% 18% 323 103 305 71 367
Ebit 72 140% 23% 184 58 171 30 244
PBT 59 87% 15% 142 52 134 32 201
Net profit 51 97% 19% 119 43 110 26 166
Our analysis: the total banking income achieved EUR 121m, +71% Y/Y (-7% Y/Y
in 2Q 16; -47% Y/Y in 1Q 16), mainly thanks to the increase in management fees
(EUR 125m, +7.1% Y/Y), leaded by asset growth and stable margins during the
year (28 bps in terms of management fees on total average assets), although a
little less than 3Q15 (30bps). The top line results was also boosted by
performance fees (EUR 27m vs EUR 1m in 3Q15) as well as by a resilient NII
(EUR 14.2m vs EUR 15.4m in 3Q15). The operating expenses rose c.19.8% Y/Y,
in accordance with the business development and also due to one-off items.
Anyway, cost income ratio closed around 39.5% vs 56% of last year, also due to
the reduction in the pay-out to the network (50% vs 57%) justified by the change
in the periodicity of the incentive scheme (from 6 months to 12 months). On the
back of this brief consideration, the net profit closed around EUR 51m vs EUR
26m of last year, better than consensus estimates (EUR 43m), the second best
quarter ever and the best one in the last six quarter. October’s net inflows
achieved EUR 400m vs EUR 415m in October 2015, EUR 4.487bn YTD at the
end of October, +31% Y/Y.
Conclusion & Action: The results were better than consensus and the
management team increased the previous guidance 2016 with net inflows seen
around EUR 5bn from EUR 4bn - EUR 4.5bn of the previous one.
Analyst(s):
Enrico Esposti, CIIA, Banca Akros
+39 02 4344 4022
Not rated
21.19
closing price as of 08/11/2016
Recommendation unchanged
Share price: EUR
Reuters/Bloomberg BGN.MI/BGN IM
Market capitalisation (EURm) 2,459
Current N° of shares (m) 116
Free float 49%
Daily avg. no. trad. sh. 12 mth 219
Daily avg. trad. vol. 12 mth (m) 8,220
Price high 12 mth (EUR) 29.23
Price low 12 mth (EUR) 16.02
Abs. perf. 1 mth 24.57%
Abs. perf. 3 mth 15.04%
Abs. perf. 12 mth -25.31%
16
18
20
22
24
26
28
30
ott 15 nov 15 dic 15 gen 16 feb 16 mar 16 apr 16 mag 16 giu 16 lug 16 ago 16 set 16 ott 16 nov 16
vvdsvdvsdy
BANCA GENERALI FTSE Italy STAR (Rebased)Source: Factset
Shareholders: Generali 51%;
Page 17 of 50
Produced & Distributed by the Members of ESN (see last page of this report)
FinecoBank
Italy/Financial Services Analyser
FINANCIAL SERVICES
FinecoBank (Buy) 3Q 16 results better than consensus
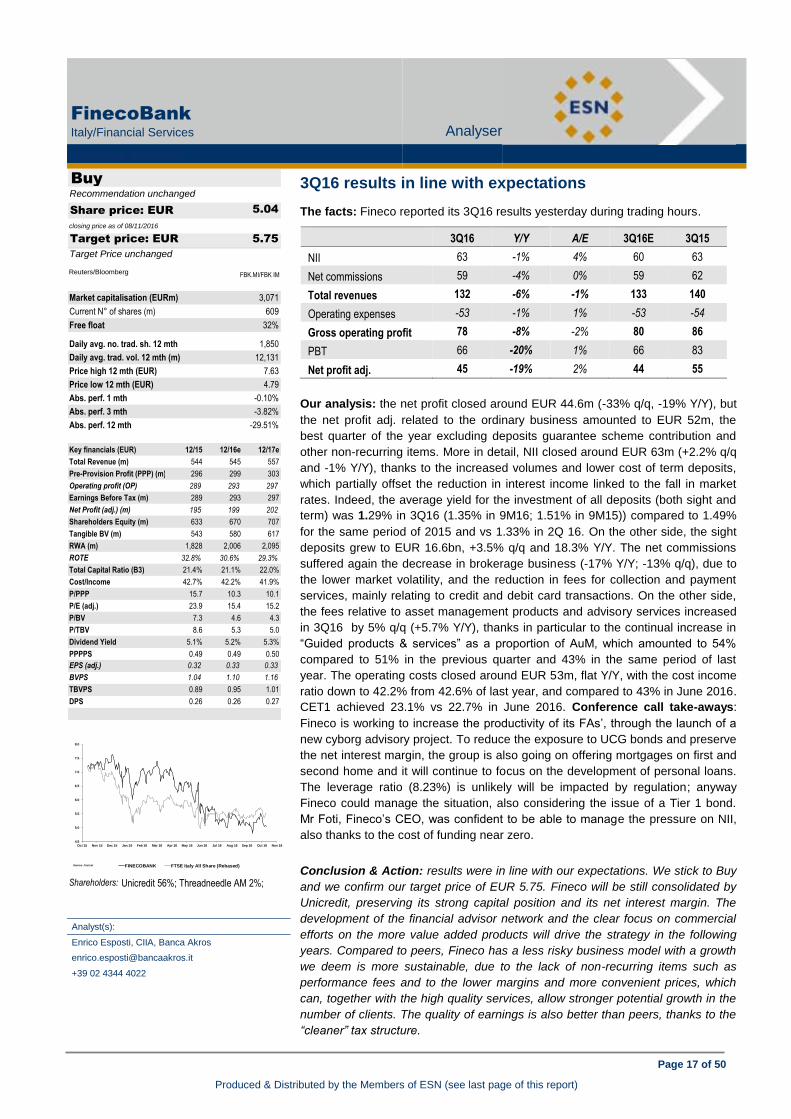
3Q16 results in line with expectations
The facts: Fineco reported its 3Q16 results yesterday during trading hours.
3Q16 Y/Y A/E 3Q16E 3Q15
NII 63 -1% 4% 60 63
Net commissions 59 -4% 0% 59 62
Total revenues 132 -6% -1% 133 140
Operating expenses -53 -1% 1% -53 -54
Gross operating profit 78 -8% -2% 80 86
PBT 66 -20% 1% 66 83
Net profit adj. 45 -19% 2% 44 55
Our analysis: the net profit closed around EUR 44.6m (-33% q/q, -19% Y/Y), but
the net profit adj. related to the ordinary business amounted to EUR 52m, the
best quarter of the year excluding deposits guarantee scheme contribution and
other non-recurring items. More in detail, NII closed around EUR 63m (+2.2% q/q
and -1% Y/Y), thanks to the increased volumes and lower cost of term deposits,
which partially offset the reduction in interest income linked to the fall in market
rates. Indeed, the average yield for the investment of all deposits (both sight and
term) was 1.29% in 3Q16 (1.35% in 9M16; 1.51% in 9M15)) compared to 1.49%
for the same period of 2015 and vs 1.33% in 2Q 16. On the other side, the sight
deposits grew to EUR 16.6bn, +3.5% q/q and 18.3% Y/Y. The net commissions
suffered again the decrease in brokerage business (-17% Y/Y; -13% q/q), due to
the lower market volatility, and the reduction in fees for collection and payment
services, mainly relating to credit and debit card transactions. On the other side,
the fees relative to asset management products and advisory services increased
in 3Q16 by 5% q/q (+5.7% Y/Y), thanks in particular to the continual increase in
“Guided products & services” as a proportion of AuM, which amounted to 54%
compared to 51% in the previous quarter and 43% in the same period of last
year. The operating costs closed around EUR 53m, flat Y/Y, with the cost income
ratio down to 42.2% from 42.6% of last year, and compared to 43% in June 2016.
CET1 achieved 23.1% vs 22.7% in June 2016. Conference call take-aways:
Fineco is working to increase the productivity of its FAs’, through the launch of a
new cyborg advisory project. To reduce the exposure to UCG bonds and preserve
the net interest margin, the group is also going on offering mortgages on first and
second home and it will continue to focus on the development of personal loans.
The leverage ratio (8.23%) is unlikely will be impacted by regulation; anyway
Fineco could manage the situation, also considering the issue of a Tier 1 bond.
Mr Foti, Fineco’s CEO, was confident to be able to manage the pressure on NII,
also thanks to the cost of funding near zero.
Conclusion & Action: results were in line with our expectations. We stick to Buy
and we confirm our target price of EUR 5.75. Fineco will be still consolidated by
Unicredit, preserving its strong capital position and its net interest margin. The
development of the financial advisor network and the clear focus on commercial
efforts on the more value added products will drive the strategy in the following
years. Compared to peers, Fineco has a less risky business model with a growth
we deem is more sustainable, due to the lack of non-recurring items such as
performance fees and to the lower margins and more convenient prices, which
can, together with the high quality services, allow stronger potential growth in the
number of clients. The quality of earnings is also better than peers, thanks to the
“cleaner” tax structure.
Analyst(s):
Enrico Esposti, CIIA, Banca Akros
+39 02 4344 4022
Buy
5.04
closing price as of 08/11/2016
5.75
Target Price unchanged
Recommendation unchanged
Target price: EUR
Share price: EUR
Reuters/Bloomberg FBK.MI/FBK IM
Market capitalisation (EURm) 3,071
Current N° of shares (m) 609
Free float 32%
Daily avg. no. trad. sh. 12 mth 1,850
Daily avg. trad. vol. 12 mth (m) 12,131
Price high 12 mth (EUR) 7.63
Price low 12 mth (EUR) 4.79
Abs. perf. 1 mth -0.10%
Abs. perf. 3 mth -3.82%
Abs. perf. 12 mth -29.51%
Key financials (EUR) 12/15 12/16e 12/17e
Total Revenue (m) 544 545 557
Pre-Provision Profit (PPP) (m) 296 299 303
Operating profit (OP) 289 293 297
Earnings Before Tax (m) 289 293 297
Net Profit (adj.) (m) 195 199 202
Shareholders Equity (m) 633 670 707
Tangible BV (m) 543 580 617
RWA (m) 1,828 2,006 2,095
ROTE 32.8% 30.6% 29.3%
Total Capital Ratio (B3) 21.4% 21.1% 22.0%
Cost/Income 42.7% 42.2% 41.9%
P/PPP 15.7 10.3 10.1
P/E (adj.) 23.9 15.4 15.2
P/BV 7.3 4.6 4.3
P/TBV 8.6 5.3 5.0
Dividend Yield 5.1% 5.2% 5.3%
PPPPS 0.49 0.49 0.50
EPS (adj.) 0.32 0.33 0.33
BVPS 1.04 1.10 1.16
TBVPS 0.89 0.95 1.01
DPS 0.26 0.26 0.27
4.5
5.0
5.5
6.0
6.5
7.0
7.5
8.0
Oct 15 Nov 15 Dec 15 Jan 16 Feb 16 Mar 16 Apr 16 May 16 Jun 16 Jul 16 Aug 16 Sep 16 Oct 16 Nov 16
vvdsvdvsdy
FINECOBANK FTSE Italy All Share (Rebased)Source: Factset
Shareholders: Unicredit 56%; Threadneedle AM 2%;

Page 18 of 50
Produced & Distributed by the Members of ESN (see last page of this report)
Campari
Italy/Food & Beverage Analyser
FOOD & BEVERAGE
Campari (Accumulate) 3Q16 results in line with expectations
9M sales higher than expected end EBIT in line
The facts: CAMPARI: 9M 16 results
9M 15a 9M 16a % Chg Akros 9M 16e
Sales 1,144.7 1,180.4 +3.1% 1,149.1 +0.4%
EBIT adj 220.7 234.0 +6.0% 233.1 +5.7%
% margin 19.3% 19.8% 20.3%
9M 16 sales were EUR 1,180.4m, with an increase of 3.1% Y/Y. This sales
performance was due to: 1) strong organic growth +5.4%, driven by the
outperformance of Global Priorities (+8.6%) and Regional Priorities (+9.8%) in
the high margin developed markets, such as North America and Western Europe;
2) negative forex effect -3.7%, mainly due the devaluation of ASR (-38.4%) and
BRL (-11.3%); 3) a positive perimeter impact of +1.4% due to the combined effect
of the Grand Marnier acquisition and the termination of some distribution
agreements and the sale of non-core businesses.
9M 16 EBIT grew by 6.0% Y/Y. The growth was especially due to: 1) the
improvement in the gross profit by +37.3% Y/Y (57.4% in 9M 16 vs 55.2% in 9M
15) due to the favourable sales mix by product (driven by Aperol +19.3% and
Campari +8.1%) in the key high-margin markets and despite a strong growth in
low-margin Argentina and Russia, a decline in single-serve drinks in Italy and the
negative performance in the non-core sugar business in Jamaica (around EUR
10m); 2) A&P expenses up by 9.0% owing to an acceleration in the A&P
investments (e.g. campaigns for Campari and Wild Turkey); 3) SG&A expenses
up by 7.2% for strengthening of the group’s distribution structures in new markets,
enhancement of the on-premise capabilities in the US to leverage Grand Marnier
and the premium spirits’ potential in this strategic channel, and South Africa
ahead of subsidiary set up.
9M 16 Pretax profit was EUR 131.5m, down by -26.3% Y/Y, entirely driven by
overall pretax adjustments of EUR 52.2m due to Grand Marnier acquisition costs,
restructuring projects and debt refinancing.
Higher Net Debt due to SPML acquisition: Net debt at EUR 1,358.6m as of 30
September 2016 (vs EUR 825.8m at the end December 2015), including the
effects of the SPML acquisition on 29 June 2016 for a total amount of EUR
682.9m; therefore, Net debt/EBITDA ratio increased at 3.3x as of 30 September
2016 vs 2.2x as of 31 December 2015.
Outlook on FY 16: during yesterday conference call, the management said that
the outlook on the rest of the year remains broadly unchanged: the volatility in
some emerging markets and the uncertainty on the movements of the group’s key
foreign currencies are expected to continue. At the same time, the management
is confident to deliver a further positive performance in profitability driven by the
continuous growth of high margin Global Priorities and the positive performance
of the group’s core strategic markets. Furthermore, the investments to strengthen
the brand building and distribution capabilities, after the acceleration in Q3, will
continue to be sustained for the rest of the year.
Our analysis: based on the good 9M results and on the management’s outlook,
we set FY 16e Net sales at EUR 1,701.3m and FY 16e EBIT at EUR 352.3m
(20.7% on sales).
Conclusion & Action: based on our estimates, we confirm our target price of
EUR 10.0 per share (DCF model – 2.0% perpetual growth rates and WACC of
6.6%). The stock price shows currently a decent potential upside compared to our
target price, so we move our recommendation from Neutral to Accumulate.
Analyst(s):
Paola Saglietti, Banca Akros
+39 02 4344 4287
Accumulate
8.96
closing price as of 08/11/2016
10.00
Target Price unchanged
from Neutral
Target price: EUR
Share price: EUR
Reuters/Bloomberg CPRI.MI/CPR IM
Market capitalisation (EURm) 5,204
Current N° of shares (m) 581
Free float 49%
Daily avg. no. trad. sh. 12 mth 1,401
Daily avg. trad. vol. 12 mth (m) 24,283
Price high 12 mth (EUR) 10.09
Price low 12 mth (EUR) 6.94
Abs. perf. 1 mth -6.08%
Abs. perf. 3 mth -5.29%
Abs. perf. 12 mth 14.14%
Key financials (EUR) 12/15 12/16e 12/17e
Sales (m) 1,657 1,701 1,850
EBITDA (m) 357 401 445
EBITDA margin 21.6% 23.6% 24.0%
EBIT (m) 310 352 396
EBIT margin 18.7% 20.7% 21.4%
ROCE 7.2% 6.9% 7.5%
Net debt/(cash) (m) 826 1,167 1,013
Net Debt/Equity 0.4 0.6 0.4
Debt/EBITDA 2.3 2.9 2.3
Int. cover(EBITDA/Fin. int) 5.9 4.5 9.1
EV/Sales 3.3 3.8 3.4
EV/EBITDA 15.5 16.1 14.1
EV/EBITDA (adj.) 15.5 16.1 14.1
EV/EBIT 17.9 18.3 15.8
P/E (adj.) 24.3 28.8 21.2
P/BV 2.5 2.6 2.3
OpFCF yield 9.0% -1.6% 8.3%
Dividend yield 0.6% 0.6% 0.6%
EPS (adj.) 0.33 0.31 0.42
BVPS 3.18 3.47 3.88
DPS 0.05 0.05 0.05
6.5
7.0
7.5
8.0
8.5
9.0
9.5
10.0
10.5
Oct 15 Nov 15 Dec 15 Jan 16 Feb 16 Mar 16 Apr 16 May 16 Jun 16 Jul 16 Aug 16 Sep 16 Oct 16 Nov 16
vvdsvdvsdy
CAMPARI Stoxx Food & Beverage (Rebased)Source: Factset
Shareholders: Alicros SpA 51%;

Page 19 of 50
Produced & Distributed by the Members of ESN (see last page of this report)
Raisio
Q3/2015a
EURm Q3a vs. Cons. OP Cons. Diff. Low High
Sales
Brands 68 #DIV/0! 72 #DIV/0! 95.9
Raisioagro 37 #DIV/0! 32 #DIV/0! 40.3
Others 0 #DIV/0! 0 #DIV/0! 0.3
Eliminations -3 #DIV/0! -2 #DIV/0! -2.1
Sales 103 -3% 102 106 -3% 102 118 134
Sales growth -23.5 % -24.0 % -21.5 %
EBIT
Brands 10.5 #DIV/0! 15.8 #DIV/0! 15.8
Raisioagro 2.3 #DIV/0! 1.7 #DIV/0! 1.3
Others 1.1 #DIV/0! -1.0 #DIV/0! -1.2
Eliminations 0.0 #DIV/0! 0.0 #DIV/0! 0.0
EBIT 13.9 -13% 16.5 16.0 3% 16.0 16.6 16.0
EBIT excl. NRI 14.0 -13% 16.5 16.0 3% 16.0 16.6 16.0
EBIT margin
Brands 15.4 % 22.1 % #DIV/0! 16.5 %
Raisioagro 6.2 % 5.3 % #DIV/0! 3.3 %
Eliminations 0.0 % 0.0 % #DIV/0! 0.0 %
EBIT margin 13.5 % 16.1 % 15.2 % 11.9 %
EBIT margin excl. NRI 13.6 % 16.1 % 15.2 % 11.9 %
PTP 13.4 -16% 15.8 15.9 -1% 15.0 16.0 15.2
EPS 0.07 -13% 0.08 0.08 0% 0.07 0.08 0.08
EPS excl. NRI 0.07 -13% 0.08 0.08 0.08 0.08 0.08
DPS
Source : OP and FactSet
Q3/2016e
Raisio
Finland/Food & Beverage Analyser
FOOD & BEVERAGE
Raisio (Buy) 9M sales higher than expected end EBIT in line
Raisio’s Q3 results below forecasts, guidance downgraded as a result of GBP depreciation
The facts: Raisio reported its Q3 results this morning that were weaker than
anticipated as GBP depreciation affected the Brands Division’s earnings more
than expected.
Our analysis: The company downgrades its euro-denominated earnings
guidance for 2016; the company predicts that its EBIT will exceed the 2015 level
with comparable exchange rates but due to uncertainty caused by GBP
depreciation, the reported comparable EBIT is expected to be about EUR 50m.
Previously, the euro-denominated EBIT was also expected to improve. In 2015,
the group’s comparable EBIT was EUR 51.7m and consensus for 2016 has been
EUR 53.5m (OP: EUR 53.6m).
Conclusion & Action: Even though the depreciation that has taken place in
recent weeks is reflected on the guidance downgrade, a negative share price
reaction is expected after the preliminary election result in the US. Despite of the
downside pressure on earnings forecasts, we do not expect a downside pressure
on dividend forecasts for the spring (consensus and OP: 18c).
Analyst(s):
Niclas Catani, OP Corporate Bank
+358 10 252 8780
Buy
3.74
closing price as of 08/11/2016
4.60
Target Price unchanged
Recommendation unchanged
Target price: EUR
Share price: EUR
Reuters/Bloomberg RAIVV.HE/RAIVV FH
Market capitalisation (EURm) 589
Current N° of shares (m) 157
Free float 98%
Daily avg. no. trad. sh. 12 mth 125
Daily avg. trad. vol. 12 mth (m) 275
Price high 12 mth (EUR) 4.43
Price low 12 mth (EUR) 3.69
Abs. perf. 1 mth -4.35%
Abs. perf. 3 mth -6.50%
Abs. perf. 12 mth -15.38%
Key financials (EUR) 12/15 12/16e 12/17e
Sales (m) 494 521 435
EBITDA (m) 28 72 45
EBITDA margin 5.7% 13.8% 10.4%
EBIT (m) 7 42 32
EBIT margin 1.4% 8.1% 7.5%
Net Profit (adj.)(m) 1 31 19
ROCE 6.8% 10.2% 11.2%
Net debt/(cash) (m) 40 41 4
Net Debt/Equity 0.1 0.1 0.0
Debt/EBITDA 1.4 0.6 0.1
Int. cover(EBITDA/Fin. int) high high high
EV/Sales 1.4 1.2 1.3
EV/EBITDA 24.9 8.7 12.9
EV/EBITDA (adj.) 12.5 7.7 8.8
EV/EBIT nm 14.7 18.0
P/E (adj.) nm 18.8 30.9
P/BV 1.9 1.7 1.6
OpFCF yield 3.6% 7.7% 4.7%
Dividend yield 4.3% 4.8% 5.1%
EPS (adj.) 0.00 0.20 0.12
BVPS 2.23 2.20 2.29
DPS 0.16 0.18 0.19
3.60
3.70
3.80
3.90
4.00
4.10
4.20
4.30
4.40
4.50
4.60
Oct 15 Nov 15 Dec 15 Jan 16 Feb 16 Mar 16 Apr 16 May 16 Jun 16 Jul 16 Aug 16 Sep 16 Oct 16 Nov 16
vvdsvdvsdy
RAISIO Stoxx Food & Beverage (Rebased)Source: Factset
Shareholders: Keskinäinen Eläkevakuutusyhtiö
Ilmarinen 4%; Maa- ja
metsätaloustuottajain Keskusliitto MTK
r.y. 2%; Central Union of Agricultural
Page 20 of 50
Produced & Distributed by the Members of ESN (see last page of this report)
Yoox Net-A-Porter
Italy/General Retailers Analyser
GENERAL RETAILERS
Yoox Net-A-Porter (Buy) Raisio’s Q3 results below forecasts, guidance downgraded as a result of GBP depreciation
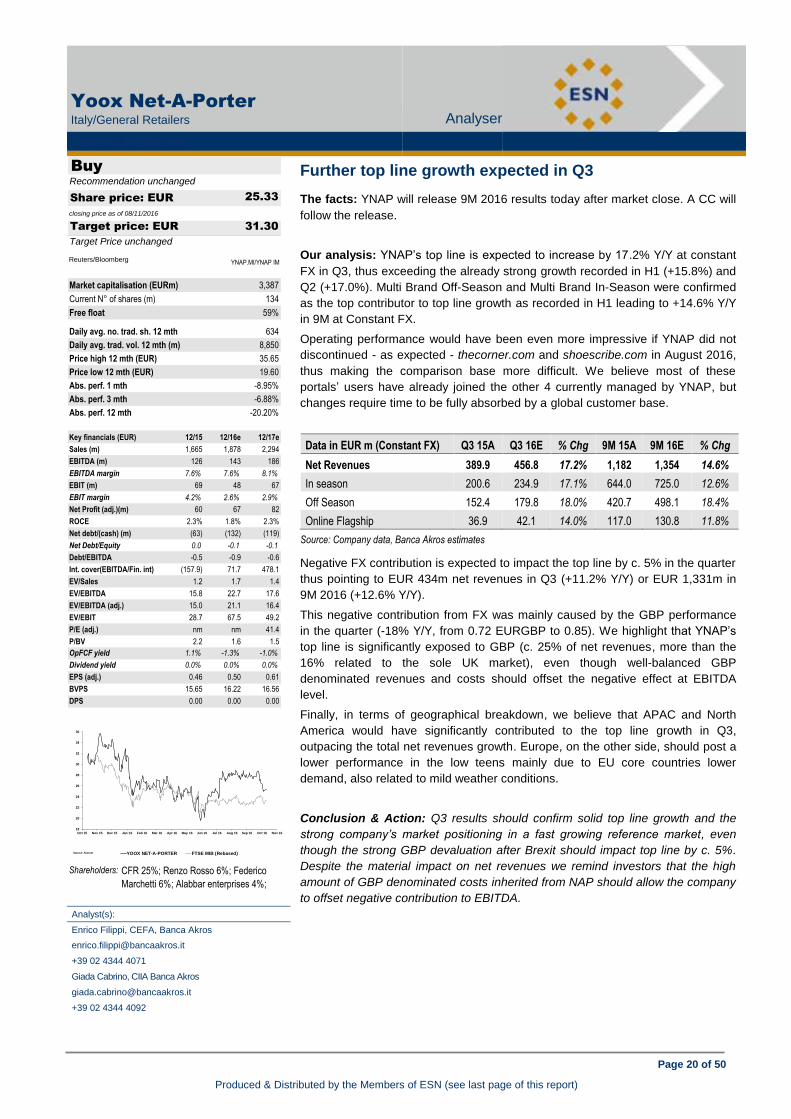
Further top line growth expected in Q3
The facts: YNAP will release 9M 2016 results today after market close. A CC will
follow the release.
Our analysis: YNAP’s top line is expected to increase by 17.2% Y/Y at constant
FX in Q3, thus exceeding the already strong growth recorded in H1 (+15.8%) and
Q2 (+17.0%). Multi Brand Off-Season and Multi Brand In-Season were confirmed
as the top contributor to top line growth as recorded in H1 leading to +14.6% Y/Y
in 9M at Constant FX.
Operating performance would have been even more impressive if YNAP did not
discontinued - as expected - thecorner.com and shoescribe.com in August 2016,
thus making the comparison base more difficult. We believe most of these
portals’ users have already joined the other 4 currently managed by YNAP, but
changes require time to be fully absorbed by a global customer base.
Data in EUR m (Constant FX) Q3 15A Q3 16E % Chg 9M 15A 9M 16E % Chg
Net Revenues 389.9 456.8 17.2% 1,182 1,354 14.6%
In season 200.6 234.9 17.1% 644.0 725.0 12.6%
Off Season 152.4 179.8 18.0% 420.7 498.1 18.4%
Online Flagship 36.9 42.1 14.0% 117.0 130.8 11.8%
Source: Company data, Banca Akros estimates
Negative FX contribution is expected to impact the top line by c. 5% in the quarter
thus pointing to EUR 434m net revenues in Q3 (+11.2% Y/Y) or EUR 1,331m in
9M 2016 (+12.6% Y/Y).
This negative contribution from FX was mainly caused by the GBP performance
in the quarter (-18% Y/Y, from 0.72 EURGBP to 0.85). We highlight that YNAP’s
top line is significantly exposed to GBP (c. 25% of net revenues, more than the
16% related to the sole UK market), even though well-balanced GBP
denominated revenues and costs should offset the negative effect at EBITDA
level.
Finally, in terms of geographical breakdown, we believe that APAC and North
America would have significantly contributed to the top line growth in Q3,
outpacing the total net revenues growth. Europe, on the other side, should post a
lower performance in the low teens mainly due to EU core countries lower
demand, also related to mild weather conditions.
Conclusion & Action: Q3 results should confirm solid top line growth and the
strong company’s market positioning in a fast growing reference market, even
though the strong GBP devaluation after Brexit should impact top line by c. 5%.
Despite the material impact on net revenues we remind investors that the high
amount of GBP denominated costs inherited from NAP should allow the company
to offset negative contribution to EBITDA.
Analyst(s):
Enrico Filippi, CEFA, Banca Akros
+39 02 4344 4071
Giada Cabrino, CIIA Banca Akros
+39 02 4344 4092
Buy
25.33
closing price as of 08/11/2016
31.30
Target Price unchanged
Recommendation unchanged
Target price: EUR
Share price: EUR
Reuters/Bloomberg YNAP.MI/YNAP IM
Market capitalisation (EURm) 3,387
Current N° of shares (m) 134
Free float 59%
Daily avg. no. trad. sh. 12 mth 634
Daily avg. trad. vol. 12 mth (m) 8,850
Price high 12 mth (EUR) 35.65
Price low 12 mth (EUR) 19.60
Abs. perf. 1 mth -8.95%
Abs. perf. 3 mth -6.88%
Abs. perf. 12 mth -20.20%
Key financials (EUR) 12/15 12/16e 12/17e
Sales (m) 1,665 1,878 2,294
EBITDA (m) 126 143 186
EBITDA margin 7.6% 7.6% 8.1%
EBIT (m) 69 48 67
EBIT margin 4.2% 2.6% 2.9%
Net Profit (adj.)(m) 60 67 82
ROCE 2.3% 1.8% 2.3%
Net debt/(cash) (m) (63) (132) (119)
Net Debt/Equity 0.0 -0.1 -0.1
Debt/EBITDA -0.5 -0.9 -0.6
Int. cover(EBITDA/Fin. int) (157.9) 71.7 478.1
EV/Sales 1.2 1.7 1.4
EV/EBITDA 15.8 22.7 17.6
EV/EBITDA (adj.) 15.0 21.1 16.4
EV/EBIT 28.7 67.5 49.2
P/E (adj.) nm nm 41.4
P/BV 2.2 1.6 1.5
OpFCF yield 1.1% -1.3% -1.0%
Dividend yield 0.0% 0.0% 0.0%
EPS (adj.) 0.46 0.50 0.61
BVPS 15.65 16.22 16.56
DPS 0.00 0.00 0.00
18
20
22
24
26
28
30
32
34
36
Oct 15 Nov 15 Dec 15 Jan 16 Feb 16 Mar 16 Apr 16 May 16 Jun 16 Jul 16 Aug 16 Sep 16 Oct 16 Nov 16
vvdsvdvsdy
YOOX NET-A-PORTER FTSE MIB (Rebased)Source: Factset
Shareholders: CFR 25%; Renzo Rosso 6%; Federico
Marchetti 6%; Alabbar enterprises 4%;

Page 21 of 50
Produced & Distributed by the Members of ESN (see last page of this report)
Epigenomics AG
Germany/Healthcare Analyser
HEALTHCARE
Epigenomics AG (Buy) Further top line growth expected in Q3
Q3 2016, guidance range narrowed, capital increase
The facts: On November 9th
, Epigenomics announced its Q3 2016 results. Sales
rose to €0.9m (+83% yoy) in Q3 2016, bringing the 9 months total to €2.4m (also
+83%), with the sharp rise attributable to an increase in product sales in the wake
of the Epi proColon colorectal cancer screening test in the US earlier this year.
Operating losses reduced slightly in Q3 2016, with EBITDA (before charges for
quasi-share programs) of €-2.4m (Q3 2015: €-2.5m), but widened in 9m 2016 (€-
8.2m, vs €--6.9m in 9m 2015). Whilst the losses fell through to the bottom-line,
this was mitigated at the EPS level by a higher number of shares, with Q3 2016
EPS of €-0.11 (vs €-0.14 in Q3 2015) and a 9m 2016 figure of €-0.50 (9m 2015:
€-0.48). Following cash use of €8.8m in 2016, cash and cash equivalents
amounted to €7.3m at the end of September
The guidance range for FY 2016 was narrowed as follows: expected revenues of
between €3.5m and €5m (previously: €3-7m), EBITDA (before charges for quasi
share program) of €-9.5m to €-10.5m (whereas previously, a more negative of
EBITDA of up to €-11.5m had been included in the range).
Including a capital increase announced in the last couple of days, the company
estimates cash reach well into 2017. On November 7, the company announced its
decision to raise €5m in gross proceeds through a private placement of 1,035,196
new shares at a price of €4.83 per share. The shares will mainly be placed with
Chinese investors: UChip Technology Limited, a subsidiary of SummitView
Capital based in Shanghai, which is thus set to become the company’s second
largest shareholder, and to a lesser extent, Epigenomics’ largest shareholder,
Chinese partner BioChain.
With respect to operating developments, Epigenomics has announced that four
out of the six leading US labs offer its colorectal cancer screening blood test. The
company also signed an exclusive distribution agreement in respect of South
East Asia (Thailand, Vietnam, Malaysia, Singapore), with additional distribution
agreements planned for Epi proColon in the international space.
Our analysis: We believe that the recently announced planned capital increase
in conjunction with the solid cash position as of Q3 2016 provides Epigenomics
with additional flexibility to invest into the ongoing US Epi proColon product
launch. We expect to have more visibility on the launch trajectory in 2017 and
note bipartisan draft legislation dated late September 2016 on colorectal cancer
screening that supports reimbursement of blood-based colorectal cancer
screening tests (i.e. Epi proColon) by Medicare as a positive factor. We also
interpret BioChain’s participation in the capital increase (following participation in
earlier fund raising efforts) as a positive signal. Any sales in South East Asia
would be incremental to our forecasts.
Conclusion & Action: With the company’s recent announcement of a planned
capital increase and progress on the operational front, including a new distribution
agreement in South East Asia, we believe that many of the key success factors
for Epi proColon have now been put in place. We continue to expect strong
uptake of Epi proColon in the US in 2017, with any sales in SouthEast Asia or
additional international regions outside of the Western hemisphere providing
upside to our forecasts.
Analyst(s):
Marietta Miemietz CFA, equinet Bank
+49-69-58997-439
Buy
5.06
closing price as of 08/11/2016
6.70
Target Price unchanged
Recommendation unchanged
Target price: EUR
Share price: EUR
Reuters/Bloomberg ECX.DE/ECX GR
Market capitalisation (EURm) 100
Current N° of shares (m) 20
Free float 86%
Daily avg. no. trad. sh. 12 mth 108
Daily avg. trad. vol. 12 mth (m) 35
Price high 12 mth (EUR) 6.58
Price low 12 mth (EUR) 1.80
Abs. perf. 1 mth -0.51%
Abs. perf. 3 mth 9.52%
Abs. perf. 12 mth 80.84%
Key financials (EUR) 12/15 12/16e 12/17e
Sales (m) 2 5 20
EBITDA (m) (9) (10) (6)
EBITDA margin nm nm nm
EBIT (m) (9) (11) (6)
EBIT margin nm nm nm
Net Profit (adj.)(m) (9) (11) (6)
ROCE -861.0% 5970.4% -1358.6%
Net debt/(cash) (m) (6) (15) (36)
Net Debt/Equity -0.6 -0.8 -0.9
Debt/EBITDA 0.7 1.5 6.1
Int. cover(EBITDA/Fin. int) 573.1 1,097.0 148.5
EV/Sales 16.1 17.8 3.3
EV/EBITDA nm nm nm
EV/EBITDA (adj.) nm nm nm
EV/EBIT nm nm nm
P/E (adj.) nm nm nm
P/BV 3.8 5.0 2.5
OpFCF yield -21.2% -9.8% -6.3%
Dividend yield 0.0% 0.0% 0.0%
EPS (adj.) (0.52) (0.54) (0.29)
BVPS 0.58 1.02 2.02
DPS 0.00 0.00 0.00
1.5
2.0
2.5
3.0
3.5
4.0
4.5
5.0
5.5
6.0
6.5
7.0
Oct 15 Nov 15 Dec 15 Jan 16 Feb 16 Mar 16 Apr 16 May 16 Jun 16 Jul 16 Aug 16 Sep 16 Oct 16 Nov 16
vvdsvdvsdy
EPIGENOMICS AG Stoxx Biotechnology (Rebased)Source: Factset
Shareholders: BioChain 9%; Abingworth 5%;

Page 22 of 50
Produced & Distributed by the Members of ESN (see last page of this report)
Prysmian
Italy/Industrial Engineering Analyser
INDUSTRIAL ENGINEERING
Prysmian (Accumulate) Q3 2016, guidance range narrowed, capital increase
Q3 results: in line with expectations
The facts: PRY released bang-in-line Q3 results yesterday during trading hours.
PRY confirmed that it is likely to post a higher-than EUR 700m Adj. EBITDA in
2016, although not at the top of the FY16 guidance of EUR 670/720m.
Our analysis: Here follow Q3 results compared with our estimates.
(EUR m) Q3 16 Q3 15 Δ% Y/Y Q3 16e 9M16 9M 15
Revenues 1,875 1,833 2.3% 1,955 5,660 5,570
Adj. EBITDA 180 159 12.9% 179 527 473
As a % of revenues 9.6% 8.7%
9.2%
8.5%
Adj. Operating Income 137 122 12.3% 134 398 364
As a % of revenues 7.3% 6.7%
6.9% 7.0% 6.5%
Operating Income Adj. -21 -11 90.9% -14 -65 -80
Operating Income 116 111 4.5% 120 333 284
As a % of revenues 6.2% 6.1%
6.1% 5.9% 5.1%
Net Financial charges (21) (24) -12.5% (20) (58) (77)
Profit before taxes 95 87 9.2% 100 275 207
Taxes (21) (26) -19.2% (30) (77) (68)
Tax rate -22.1% -29.9%
-30.4% -28.0%
Net Income/(loss) 73 61 19.7% 70 188 141
- Energy Projects grew organically ~18% Y/Y in Q3; Adj. EBITDA (EUR 61m,
+15% Y/Y) benefitted from project execution and a stronger installation fleet.
- Energy Products fell organically 3.7% Y/Y in Q3; PRY reduced sales in low-
margin countries; Adj. EBITDA (EUR 66m, -1.5% Y/Y at constant perimeter)
remained flat, with a 50 bps improvement Y/Y in terms of margin.
- Oil & Gas fell organically ~25% Y/Y; Adj. EBITDA was EUR 2m (-50% Y/Y).
- Telecom grew organically 13.8% Y/Y; Adj. EBITDA reached EUR 51m
(+46% Y/Y), at 17% or revenues (+430 bps) thanks to YOC and better
efficiency.
The NFP (EUR -1.03bn as at the end of June) improved to EUR 1.02bn, in line
with estimates. The scenario for Energy Projects and Telecom remain positive,
while the outlook for Energy Products is more mixed in our understanding. We
adjusted our estimates to factor in a stronger impact of metal derivatives on
revenues, lower growth for Products, higher margins for TLC and a lower tax rate.
2016 e 2017 e
New Old ∆ New Old ∆
Revenues 7,584 8,189 -7.4% 7,757 8,418 -7.8%
Adj. EBITDA 710 710 0.0% 778 778 0.0%
Adj. EBIT 552 527 4.7% 618 593 4.2%
Adj. Net Profit 330 302 9.1% 375 347 8.0%
NFP (648) (654) 6 (493) (502) 9
Conclusion & Action: Q3 results were in line; the outlook for EP is not brilliant,
but Projects and TLC bode well. Rating and target confirmed.
Analyst(s):
Gabriele Gambarova, Banca Akros
+39 02 43 444 289
Accumulate
22.17
closing price as of 08/11/2016
24.50
Target Price unchanged
Recommendation unchanged
Target price: EUR
Share price: EUR
Reuters/Bloomberg PRY.MI/PRY IM
Market capitalisation (EURm) 4,753
Current N° of shares (m) 214
Free float 85%
Daily avg. no. trad. sh. 12 mth 976
Daily avg. trad. vol. 12 mth (m) 26,990
Price high 12 mth (EUR) 23.90
Price low 12 mth (EUR) 16.45
Abs. perf. 1 mth -6.73%
Abs. perf. 3 mth 3.36%
Abs. perf. 12 mth 14.28%
Key financials (EUR) 12/15 12/16e 12/17e
Sales (m) 7,361 7,584 7,757
EBITDA (m) 622 652 738
EBITDA margin 8.4% 8.6% 9.5%
EBIT (m) 399 469 553
EBIT margin 5.4% 6.2% 7.1%
Net Profit (adj.)(m) 244 330 374
ROCE 9.4% 13.2% 14.6%
Net debt/(cash) (m) 750 648 493
Net Debt/Equity 0.5 0.4 0.3
Debt/EBITDA 1.2 1.0 0.7
Int. cover(EBITDA/Fin. int) 7.0 9.3 11.0
EV/Sales 0.7 0.7 0.7
EV/EBITDA 8.1 8.3 7.1
EV/EBITDA (adj.) 8.5 7.6 6.7
EV/EBIT 12.6 11.5 9.5
P/E (adj.) 17.8 14.4 12.7
P/BV 3.4 3.3 2.9
OpFCF yield 3.8% 3.7% 6.8%
Dividend yield 1.9% 1.9% 2.5%
EPS (adj.) 1.14 1.54 1.74
BVPS 5.96 6.79 7.74
DPS 0.42 0.42 0.56
16
17
18
19
20
21
22
23
24
Oct 15 Nov 15 Dec 15 Jan 16 Feb 16 Mar 16 Apr 16 May 16 Jun 16 Jul 16 Aug 16 Sep 16 Oct 16 Nov 16
vvdsvdvsdy
PRYSMIAN Stoxx Industrial Engineering (Rebased)Source: Factset
Shareholders: CLUBTRE 6%; BLACKROCK 5%; JP
MORGAN 4%;

Page 23 of 50
Produced & Distributed by the Members of ESN (see last page of this report)
Banca Mediolanum
Italy/Insurance Analyser
INSURANCE
Banca Mediolanum (Accumulate) Q3 results: in line with expectations
3Q 16 results slightly higher than expected
The facts: Mediolanum reported 3Q16 results yesterday during trading hours,
followed by a conference call.
EUR m 3Q16 9M16 Y/Y A/E 3Q16E 9M16E
Fees & Commissions 339 922 22% 2% 333 916
Net Life Revenues ex Commission 7 18 21% 78% 4 15
Net financial income 57 164 -6% 5% 55 161
Total Operating Costs -272 -809 4% 0% -271 -808
PBT 153 350 50% 9% 140 337
Net Profit 135 305 60% 11% 121 291
Our analysis: the numbers were slightly higher than our estimates, mainly due to
the revenues side, with management fees and performance fees better than our
expectations around 1.3% and 3.2% respectively. More in detail, the management
fees closed around EUR 218m, +5% Y/Y and compared to EUR 215m we
estimated. The performance fees achieved EUR 75m vs EUR 20m in 3Q15 and
EUR 73m we expected. The net life revenues also achieved EUR 7m vs EUR vs
EUR 6m in 3Q15 but compared to EUR 4m we estimated. The net financial
income was also slightly higher than expected (EUR 57m vs EUR 55m), despite
lower Y/Y (EUR 61m in 3Q15). On the cost side, the quarter’s numbers were
substantially in line with ours. On the back of these considerations, the net profit
closed at EUR 135m, +60% Y/Y, due also to the lower performance fees in 3Q15.
The interim DPS was set at EUR 0.16 (payable on 23rd
November; ex-dividend
date on 21st November), in line both with our expectation and with last year. The
net inflows in October amounted to c. EUR 321m (EUR 338m ours estimates)
bringing the total year-to-date to EUR 4.2bn, +30% Y/Y.
Outlook. Overall the 2016 outlook was confirmed: NII ought to be lower by c.
10% Y/Y, due to the low interest rates; G&A costs are likely to be higher than last
year; the net inflows, which ought to be strong also in November, are likely to be
around EUR 5bn; DPS confirmed at EUR 0.30 for the time being; CET1 target at
20%, with the prospect to increase the pay-out if the CET1 is around 21% (CET1
c. 20.4% at the end of September). The performance fees matter was still
important during the conference call: Mr Doris confirmed that Banca Mediolanum
is going to reconsider its performance fees scheme, also on the benchmark side;
the bank’s target will be to offset any possible negative impact through the
introduction of other sources of recurring revenues (such as P&C insurance and
lending) relying on the current customer base, with the final aim to reduce
revenues’ volatility.
Conclusion & Action: after the results, we updated our estimates, increasing our
EPS Adj. around 14% and 4% for 2016 and 2017 respectively. Anyway, we
confirm our target price of EUR 7.2 and we stick to accumulate. Banca
Mediolanum has one of the best business-model to face the challenging context
of the banking sector. Some positive surprises could arise from the increase in
the number of clients in the medium term, which are likely to switch from AuA to
the more profitable AuM. The strategic desire to play a key role in the new mobile
and internet banking sector could also make the difference in the long run.
Analyst(s):
Enrico Esposti, CIIA, Banca Akros
+39 02 4344 4022
Accumulate
6.27
closing price as of 08/11/2016
7.20
Target Price unchanged
Recommendation unchanged
Target price: EUR
Share price: EUR
Reuters/Bloomberg BMED.MI/BMED IM
Market capitalisation (EURm) 4,609
Current N° of shares (m) 736
Free float 30%
Daily avg. no. trad. sh. 12 mth 1,477
Daily avg. trad. vol. 12 mth (m) 7,634
Price high 12 mth (EUR) 7.91
Price low 12 mth (EUR) 5.32
Abs. perf. 1 mth 2.37%
Abs. perf. 3 mth -1.73%
Abs. perf. 12 mth -19.63%
Key financials (EUR) 12/15 12/16e 12/17e
Life Gross premiums (m) 2,283 2,246 2,143
Non-Life Gross prem.(m) 0 0 0
Total Net Revenues (m) 3,939 3,753 3,689
EBIT (m) 561 434 413
Net Profit (adj.) (m) 470 356 336
Shareholders Equity (m) 2,070 2,205 2,317
ANAV (m) 1,876 2,012 2,123
ROE (adj.) (%) 25.5 17.6 15.6
Combined ratio (%) 0.0 0.0 0.0
Solvency Ratio 128.0% 127.9% 134.5%
P/E (adj.) 11.5 13.0 13.7
P/BV 2.6 2.1 2.0
P/ANAV 2.9 2.3 2.2
P/EbV 1.6 1.3 1.2
Dividend Yield 4.8% 4.8% 4.8%
EPS (adj.) 0.64 0.48 0.46
BVPS 2.81 3.00 3.15
ANAVPS 2.55 2.73 2.89
EbVPS 4.65 4.91 5.13
DPS 0.30 0.30 0.30
5.0
5.5
6.0
6.5
7.0
7.5
8.0
8.5
Oct 15 Nov 15 Dec 15 Jan 16 Feb 16 Mar 16 Apr 16 May 16 Jun 16 Jul 16 Aug 16 Sep 16 Oct 16 Nov 16
vvdsvdvsdy
BANCA MEDIOLANUM Stoxx Insurance (Rebased)Source: Factset
Shareholders: Doris family 40%; Fininvest 30%;

Page 24 of 50
Produced & Distributed by the Members of ESN (see last page of this report)
Munich Re
Germany/Insurance Analyser
INSURANCE
Munich Re (Neutral) 3Q 16 results slightly higher than expected
Q3 results above our forecast
The facts: Munich Re has just reported Q3 results which were above our forecast
but slightly below consensus on a net profit level. Net profit in Q3 increased by
32% yoy to EUR 684m which was well above our forecast of EUR 400m
(consensus: EUR 753m); main reasons for the better than expected result were a
higher investment income and a better than forecasted non-operating result. Net
investment income increased by 6% yoy to EUR 1,619m which was above our
forecast of EUR 1,480m. C/R in P/C reinsurance stood at 92.0% (equinet:
92.5%). Having achieved a net profit of EUR 2.1bn after 9 months, Munich Re
increases its full-year profit guidance. It now expects to significantly exceed its
original target of a net profit of EUR 2.3bn.
Our analysis:
Conclusion & Action: We stick to our Neutral recommendation with a target
price of EUR 180.00. Mainly due to a higher than forecasted net investment
income Munich Re posted a better than expected Q3 profit and thus increased its
full-year net profit guidance. This is clearly positive news but adequately reflected
in the current share price level, in our view.
Analyst(s):
Philipp Häßler, CFA, equinet Bank
+49 69 58997 414
Neutral
174.80
closing price as of 08/11/2016
180.00
Target Price unchanged
Recommendation unchanged
Target price: EUR
Share price: EUR
Reuters/Bloomberg MUVGn.DE/MUV2 GY
Market capitalisation (EURm) 28,632
Current N° of shares (m) 164
Free float 100%
Daily avg. no. trad. sh. 12 mth 657
Daily avg. trad. vol. 12 mth (m) 76,075
Price high 12 mth (EUR) 190.75
Price low 12 mth (EUR) 141.20
Abs. perf. 1 mth 6.07%
Abs. perf. 3 mth 14.55%
Abs. perf. 12 mth -2.59%
Key financials (EUR) 12/15 12/16e 12/17e
Life Gross premiums (m) 19,962 20,478 21,011
Non-Life Gross prem.(m) 20,842 21,082 21,325
Total Net Revenues (m) 46,361 46,899 47,516
Life Ins.Tech.Result (m) -4,134 -4,014 -3,869
Non-Life Ins. Tech.Result 1,778 823 1,004
EBIT (m) 4,114 3,673 3,669
Net Profit (adj.) (m) 3,122 2,503 2,479
Shareholders Equity (m) 30,668 34,135 35,287
ANAV (m) 24,515 27,693 28,546
ROE (adj.) (%) 10.3 7.7 7.1
Combined ratio (%) 94.2 98.3 97.6
Solvency Ratio 333.1% 357.4% 356.0%
P/E (adj.) 9.9 11.4 11.3
P/BV 1.0 0.8 0.8
P/ANAV 1.3 1.0 1.0
P/EbV 0.8 0.7 0.7
Dividend Yield 4.7% 4.7% 4.7%
EPS (adj.) 18.73 15.28 15.41
BVPS 183.97 208.39 219.45
ANAVPS 147.06 169.07 177.53
EbVPS 225.75 248.92 259.89
DPS 8.25 8.25 8.25
120
130
140
150
160
170
180
190
Oct 15 Nov 15 Dec 15 Jan 16 Feb 16 Mar 16 Apr 16 May 16 Jun 16 Jul 16 Aug 16 Sep 16 Oct 16 Nov 16
vvdsvdvsdy
MUNICH RE Stoxx Insurance (Rebased)Source: Factset
Shareholders:
Munich Re - Preview Q3 2016
EUR m Q3 '16 Q3 16e (eq) 3Q 15 yoy Cons. delta
Net premiums 11,884 11,800 11,956 -1% na na
C/R P/R Reins. 93% 92% 95% -200 BP 92% 0%
C/R P/C Ergo GER 96% 95% 96% 0 BP 98% -3%
C/R P/C Ergo INT 99% 102% 104% -550 BP 100% 2%
Investm. Inc. 1,619 1,480 1,531 6% 1,810 -18%
Operating res. 1,014 700 579 75% 1,115 -37%
Pretax Profit 848 500 424 100% na
Net income 685 400 520 32% 753 -47%
Sources: M unich Re, equinet Research

Page 25 of 50
Produced & Distributed by the Members of ESN (see last page of this report)
Astaldi
Italy/Materials, Construction & Infrastructure Analyser
MATERIALS, CONSTRUCTION & INFRASTRUCTURE
Astaldi (Reduce) Q3 results above our forecast
Decent results expected in Q3
The facts: Astaldi is due to publish its third quarter results today.
Our analysis: we summarize our preview in the following table. We highlight that
the profits arising from associates are no longer accounted above the EBIT but
are included in the EBITDA
Q3 15 Q3 16e Y/Y 9M 15 9M 16e Y/Y
Revenues 675.1 742.0 9.9% 2,066.7 2,142.4 3.7%
Ebitda 63.0 81.0 28.5% 242.8 280.5 15.5%
margin 9.3% 10.9%
11.7% 13.1%
Ebit 44.7 64.6 44.3% 185.0 224.4 21.3%
margin 6.6% 8.7%
9.0% 10.5%
financial charges -34.5 -47.0
-119.6 -142.5
stakes at equity 8.6 0.0
42.2 0.0
PBT 18.8 17.6 -6.7% 107.6 81.8 -24.0%
Taxes -5.2 -4.2
-32.3 -19.6
Net income 13.6 13.3 -1.9% 75.3 44.1 -41.4%
Minorities 0.1 0.3
0.7 -0.4
Net income 13.7 13.0 -4.5% 76.0 44.5 -41.4%
Source: Company data, Banca Akros estimates
Conclusion & Action: the main issue for Astaldi is still the deleveraging. In this
respect the visibility is very low. Recommendation and target confirmed.
Analyst(s):
Francesco Sala, Banca Akros
+39 02 4344 4240
Reduce
3.94
closing price as of 08/11/2016
3.40
Target Price unchanged
Recommendation unchanged
Target price: EUR
Share price: EUR
Reuters/Bloomberg AST.MI/AST IM
Market capitalisation (EURm) 395
Current N° of shares (m) 100
Free float 48%
Daily avg. no. trad. sh. 12 mth 866
Daily avg. trad. vol. 12 mth (m) 3,427
Price high 12 mth (EUR) 7.76
Price low 12 mth (EUR) 3.21
Abs. perf. 1 mth 19.49%
Abs. perf. 3 mth 7.37%
Abs. perf. 12 mth -47.69%
Key financials (EUR) 12/15 12/16e 12/17e
Sales (m) 2,855 2,972 3,204
EBITDA (m) 356 350 372
EBITDA margin 12.5% 11.8% 11.6%
EBIT (m) 277 267 288
EBIT margin 9.7% 9.0% 9.0%
Net Profit (adj.)(m) 81 64 91
ROCE 19.6% 15.3% -29.4%
Net debt/(cash) (m) 989 1,118 1,156
Net Debt/Equity 1.6 1.6 1.5
Debt/EBITDA 2.8 3.2 3.1
Int. cover(EBITDA/Fin. int) 2.2 2.1 2.5
EV/Sales 0.5 0.5 0.5
EV/EBITDA 4.4 4.3 4.2
EV/EBITDA (adj.) 4.4 4.3 4.2
EV/EBIT 5.6 5.7 5.4
P/E (adj.) 6.9 6.1 4.4
P/BV 0.9 0.6 0.5
OpFCF yield -26.9% -40.1% -9.8%
Dividend yield 5.1% 5.4% 5.8%
EPS (adj.) 0.81 0.64 0.90
BVPS 6.35 6.73 7.37
DPS 0.20 0.21 0.23
3.0
3.5
4.0
4.5
5.0
5.5
6.0
6.5
7.0
ott 15 nov 15 dic 15 gen 16 feb 16 mar 16 apr 16 mag 16 giu 16 lug 16 ago 16 set 16 ott 16 nov 16
vvdsvdvsdy
ASTALDI Stoxx Construction & Materials (Rebased)Source: Factset
Shareholders: Astaldi family 52%;

Page 26 of 50
Produced & Distributed by the Members of ESN (see last page of this report)
Maire Tecnimont
Italy/Materials, Construction & Infrastructure Analyser
MATERIALS, CONSTRUCTION & INFRASTRUCTURE
Maire Tecnimont (Accumulate) Decent results expected in Q3
Good and better than expected results
The facts: Maire Tecnimont published its third quarter results after market
closing. A conference call is scheduled today at 8am CET.
Our analysis: the company’s results were good and better than expected
Q3 15 Q3 16 Y/Y % Q3 16e 9M 15 9M 16 Y/Y %
Revenues 417.6 586.0 40.3% 562.3 1,117.8 1,702.2 52.3%
EBITDA 28.9 40.0 38.3% 36.8 90.1 112.8 25.2%
margin 6.9% 6.8%
6.5% 8.1% 6.6%
EBIT 21.0 38.3 82.2% 35.1 78.1 108.3 38.7%
margin 5.0% 6.5%
6.2% 7.0% 6.4%
EBT 12.3 33.4 171.4% 29.9 51.3 88.9 73.2%
Taxes -4.7 -12.0
-10.9 -17.8 -32.3
Minorities -0.3 -0.4
0.0 -0.2 -9.1
Net Profit 7.3 20.9 186.7% 19.0 33.3 47.6 42.7%
Net debt down – the net debt came in at EUR 56.2m vs. EUR 96.0m at the end of
June.
Conclusion & Action: the company’s results were sound and better than
expected. Recommendation and target confirmed.
Analyst(s):
Francesco Sala, Banca Akros
+39 02 4344 4240
Accumulate
2.28
closing price as of 08/11/2016
3.20
Target Price unchanged
Recommendation unchanged
Target price: EUR
Share price: EUR
Reuters/Bloomberg MTCM.MI/MT IM
Market capitalisation (EURm) 696
Current N° of shares (m) 306
Free float 35%
Daily avg. no. trad. sh. 12 mth 854
Daily avg. trad. vol. 12 mth (m) 1,927
Price high 12 mth (EUR) 2.72
Price low 12 mth (EUR) 1.86
Abs. perf. 1 mth 9.52%
Abs. perf. 3 mth 6.25%
Abs. perf. 12 mth -14.43%
Key financials (EUR) 12/15 12/16e 12/17e
Sales (m) 1,670 2,280 2,432
EBITDA (m) 131 150 175
EBITDA margin 7.8% 6.6% 7.2%
EBIT (m) 115 143 167
EBIT margin 6.9% 6.3% 6.9%
Net Profit (adj.)(m) 44 66 91
ROCE 35.0% 47.7% 62.5%
Net debt/(cash) (m) 126 53 (39)
Net Debt/Equity 1.0 0.3 -0.1
Debt/EBITDA 1.0 0.4 -0.2
Int. cover(EBITDA/Fin. int) 3.6 6.1 9.2
EV/Sales 0.5 0.3 0.3
EV/EBITDA 6.8 5.1 3.8
EV/EBITDA (adj.) 6.8 5.1 3.8
EV/EBIT 7.7 5.3 4.0
P/E (adj.) 17.6 10.5 7.7
P/BV 6.2 3.6 2.6
OpFCF yield 38.7% 12.1% 15.0%
Dividend yield 2.1% 2.2% 2.2%
EPS (adj.) 0.14 0.22 0.30
BVPS 0.41 0.62 0.87
DPS 0.05 0.05 0.05
1.80
1.90
2.00
2.10
2.20
2.30
2.40
2.50
2.60
2.70
2.80
ott 15 nov 15 dic 15 gen 16 feb 16 mar 16 apr 16 mag 16 giu 16 lug 16 ago 16 set 16 ott 16 nov 16
vvdsvdvsdy
MAIRE TECNIMONT FTSE Italy All Share (Rebased)Source: Factset
Shareholders: GLV capital 55%; Ardeco 10%;

Page 27 of 50
Produced & Distributed by the Members of ESN (see last page of this report)
M6-Métropole Télévision
France/Media Analyser
MEDIA
M6-Métropole Télévision (Neutral) Good and better than expected results
Q3 revenues: M6 continues to outperform the TV advertising market
The facts: Publication of Q3 revenues last night. Company contact.
Our analysis: We note in particular: 1) as expected TV advertising slowed to
+0.7% in Q3 (+1.4%e) vs +4.7% in H1, with a difficult month in September for the
entire TV market; 2) a difficult comparison base for Production and Audiovisual
Rights; 3) Diversification: -17% for French football league (Les Girondins) rights
(no Europa League), stabilisation of Ventadis (+0,9%), good performance by M6
Web excluding mobile licence (+12%, dynamic 6play advertising); 4) EBITA (not
detailed) came out at EUR31.1m vs EUR30.5m in Q3-15, the cost of the Euro
was covered by advertising in July.
€m
Q3-16 sales reported
Var. Q3-16e sales
CM-CIC Var.
Q3-16 sales Consensus
Total 262 -1.3% 260 -1.9% 263 TV 173 +1.9% 172 +1.2% 172 Production and Audiovisual rights
20 -8.4% 19 -15.0% 20
Diversification 68 -6.8% 70 -5.1% 70
No guidance for the end of the year: the group anticipates a continuation of
audience trends and that it will continue to outperform a TV advertising market
that offers little visibility. We are lowering our TV advertising growth forecast for
2016E from +3.8% to +3.2%, EBITA almost unchanged at EUR230m.
Conclusion & Action: Publication close to anticipations, confirmation of M6’s
outperformance in relation to the TV advertising market and TF1. We believe that
this relatively strong trend is already incorporated into the price, which is close to
our IV of EUR16.
Analyst(s):
Eric Ravary, CM - CIC Market Solutions
+33 1 53 48 80 71
Emmanuel Chevalier CM - CIC Market Solutions
+33 1 53 48 80 72
Neutral
15.55
closing price as of 08/11/2016
16.00
Target Price unchanged
Recommendation unchanged
Target price: EUR
Share price: EUR
Reuters/Bloomberg MMTP.PA/MMT FP
Market capitalisation (EURm) 1,965
Current N° of shares (m) 126
Free float 44%
Daily avg. no. trad. sh. 12 mth 121
Daily avg. trad. vol. 12 mth (m) 1,087
Price high 12 mth (EUR) 17.80
Price low 12 mth (EUR) 13.69
Abs. perf. 1 mth -0.86%
Abs. perf. 3 mth -4.34%
Abs. perf. 12 mth -12.18%
Key financials (EUR) 12/15 12/16e 12/17e
Sales (m) 1,250 1,264 1,279
EBITDA (m) 323 360 356
EBITDA margin 25.8% 28.5% 27.8%
EBIT (m) 199 230 223
EBIT margin 15.9% 18.2% 17.5%
Net Profit (adj.)(m) 114 136 132
ROCE 24.9% 25.5% 23.6%
Net debt/(cash) (m) (129) (116) (105)
Net Debt/Equity -0.2 -0.2 -0.2
Debt/EBITDA -0.4 -0.3 -0.3
Int. cover(EBITDA/Fin. int) (293.5) (884.8) (787.6)
EV/Sales 1.5 1.5 1.5
EV/EBITDA 5.8 5.1 5.2
EV/EBITDA (adj.) 5.8 5.1 5.2
EV/EBIT 9.4 8.1 8.3
P/E (adj.) 17.6 14.5 14.9
P/BV 3.4 3.2 3.1
OpFCF yield 1.5% 4.5% 5.2%
Dividend yield 5.5% 5.8% 6.4%
EPS (adj.) 0.90 1.07 1.04
BVPS 4.62 4.85 4.99
DPS 0.85 0.90 1.00
13.5
14.0
14.5
15.0
15.5
16.0
16.5
17.0
17.5
18.0
18.5
Oct 15 Nov 15 Dec 15 Jan 16 Feb 16 Mar 16 Apr 16 May 16 Jun 16 Jul 16 Aug 16 Sep 16 Oct 16 Nov 16
vvdsvdvsdy
M6-METROPOLE TELEVISION Stoxx Media (Rebased)Source: Factset
Shareholders: RTL Group 48%; CNP-A.Fr¿re 7%;
Autod¿tention 0.08%;

Page 28 of 50
Produced & Distributed by the Members of ESN (see last page of this report)
Mediaset
Italy/Media Analyser
MEDIA
Mediaset (Accumulate) Q3 revenues: M6 continues to outperform the TV advertising market
9m 2016 Post: mixed picture
The facts: publication of Q3 2016 results. MSE and EIT pre-reported.
Our analysis: Following the decision of Vivendi not to comply with the acquisition
agreement, Mediaset is consolidating Pay-TV in its accounts since Q2. The
company said it sustained a total of EUR 50m one-off costs related to the deal, of
which EUR 8.3m impacted the EBIT, the rest were accounted as financial costs.
The Pay unit posted as expected a very modest growth given the uncertainties in
Q3; however it met our estimates and the consensus. The advertising
performance was slightly negative but still in an acceptable range given the
negative issues of this quarter. A positive surprise at the EBIT line thanks to cost
control. The net income was supported by EUR 24m positive tax item. The net
debt position was in line with estimates at EUR 1.24bn at group level. Mediaset
Espana posted a top-line weak and below estimates (net adv revenues -1.4% Y/Y
vs. TV market +1%), but EBITDA and net profit were above our estimates and the
consensus. EIT pre-reported solid results in line with the previous quarter's trend
and supported by tower acquisition.
Mediaset 9m 2016 results (EUR m)
Q3 15a Q3 16e Q3 16a Y/Y 9M 15a 9M 16a Y/Y
Revenues 693 695 693 0.0% 2,414 2,564 6.2%
Italy 497 503 503 1.2% 1,741 1,853 6.4%
ITA 482 485 486 0.9% 1,696 1,801 6.2%
Adv collection 352 352 349 -0.9% 1,363 1,397 2.6%
Pay 141 145 149 5.9% 406 457 12.7%
EIT 61 63 63 3.8% 180 188 4.4%
Spain 196 192 190 -3.1% 675 712 5.5%
EBIT -54 -80 -65 20% 83 33 -61%
Italy -75 -95 -86 15% -48 -138 190%
ITA -99 -115 -107 8% -102 -199 96%
EIT 19 20 21 9.8% 54 61 12.2%
Spain 20 15 21 0.6% 131 171 29.9%
EBT -66 -90 -75 nm 64 -19 nm
Net Income -60 -120 -89 48% -36 -117 226%
Source: Company data, BANCA AKROS estimates
Outlook. Italy: For Italy, we expect c 2.7% advertising growth for the full year.
Mediaset gave a guidance of 2.8/3.1% based on a TV market growing 2.5% ex-
sports (+4.5% incl. sports). October was positive at +4.1%, implying +2.8% in the
first 10 months. The management indicated no impact from the external
environment in Q4 while signalled "some clouds" on 2017. No guidance on
premium, which will not recover in Q4 the growth pace of the first six months
(+16%). The organic increase (ex-radio, ex-premium) in the cost base is kept at
EUR 10m; Spain. With H1 release, MSE increased the cost base by EUR 10m to
EUR 780m, but the management brought this level back to EUR 770m following
the 9m results. We have cut our estimates on revenues in 2016/17 by 1.7%,
0.4%, but increased the EBITDA by 1.8/2.2% and cut our FCF forecasts due to
worse NWC dynamics. EIT confirmed the targets of EUR 120m EBITDA.
Conclusion & Action: mixed picture, as Q3 adv was light, October was good
and Q4 view encouraging; at the same time the perspectives for next year
become less rosy. Large loss but lower than expected at the EBIT level. We
maintain a positive view assuming that a) Premium will be fixed or sold sooner
or later b) the market is pricing a negative value for this asset. We cut our FV to
EUR4.0 due to the move on MSE (-5% to EUR 13.4m) and other modest
adjustments in Italy. We cut our TP to EUR 3.5 which would include a zero value
for premium.
Analyst(s):
Andrea Devita, CFA, Banca Akros
+39 02 4344 4031
Accumulate
2.42
closing price as of 08/11/2016
3.50
4.20from Target Price: EUR
Recommendation unchanged
Target price: EUR
Share price: EUR
Reuters/Bloomberg MS.MI/MS IM
Market capitalisation (EURm) 2,859
Current N° of shares (m) 1,181
Free float 63%
Daily avg. no. trad. sh. 12 mth 7,150
Daily avg. trad. vol. 12 mth (m) 9,598
Price high 12 mth (EUR) 4.72
Price low 12 mth (EUR) 2.42
Abs. perf. 1 mth -10.37%
Abs. perf. 3 mth -13.57%
Abs. perf. 12 mth -48.42%
Key financials (EUR) 12/15 12/16e 12/17e
Sales (m) 3,525 3,166 3,295
EBITDA (m) 369 551 635
EBITDA margin 10.5% 17.4% 19.3%
EBIT (m) 231 425 510
EBIT margin 6.6% 13.4% 15.5%
Net Profit (adj.)(m) 18 80 134
ROCE 3.4% 8.1% 9.6%
Net debt/(cash) (m) 863 822 606
Net Debt/Equity 0.3 0.2 0.2
Debt/EBITDA 2.3 1.5 1.0
Int. cover(EBITDA/Fin. int) 7.5 11.0 15.9
EV/Sales 1.9 1.5 1.4
EV/EBITDA 17.7 8.8 7.3
EV/EBITDA (adj.) 17.7 8.8 7.3
EV/EBIT 28.2 11.3 9.0
P/E (adj.) nm 35.5 21.4
P/BV 2.0 1.2 1.1
OpFCF yield -21.5% -17.4% -11.7%
Dividend yield 0.8% 0.9% 0.9%
EPS (adj.) 0.01 0.07 0.11
BVPS 1.95 2.01 2.14
DPS 0.02 0.02 0.02
2.4
2.6
2.8
3.0
3.2
3.4
3.6
3.8
4.0
4.2
4.4
ott 15 nov 15 dic 15 gen 16 feb 16 mar 16 apr 16 mag 16 giu 16 lug 16 ago 16 set 16 ott 16 nov 16
vvdsvdvsdy
MEDIASET Stoxx Media (Rebased)Source: Factset
Shareholders: Silvio Berlusconi 34%; Treasury Shares
4%;
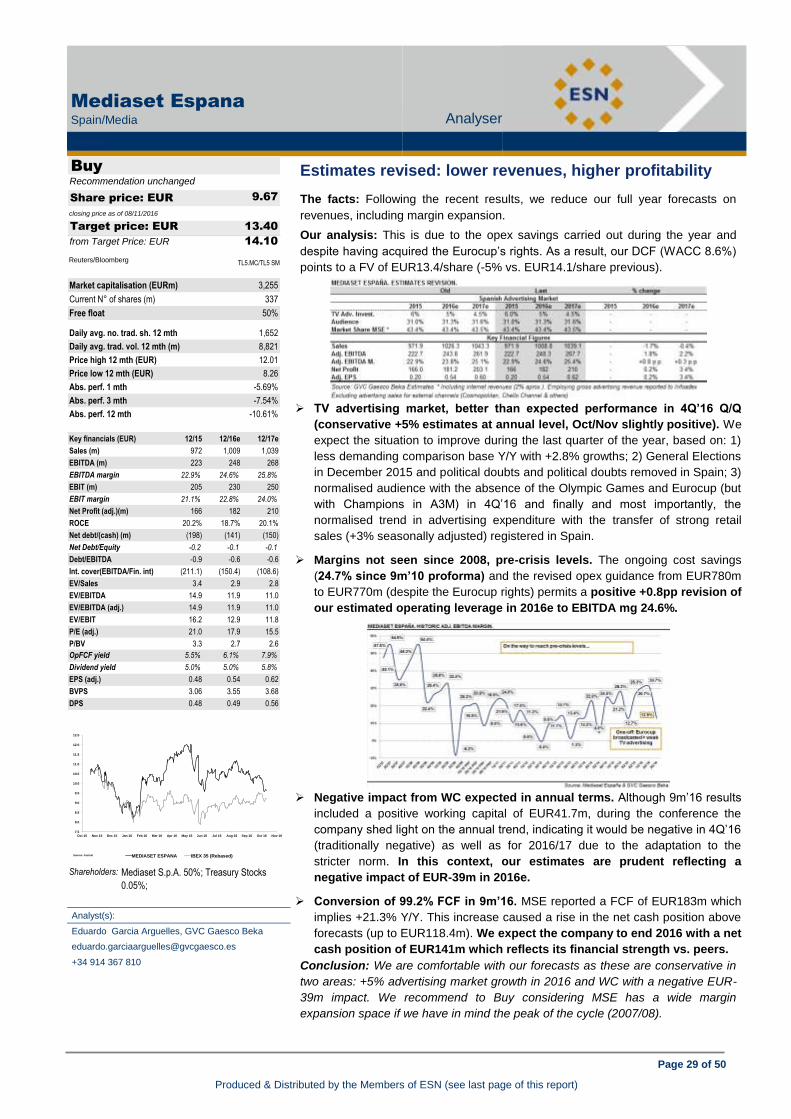
Page 29 of 50
Produced & Distributed by the Members of ESN (see last page of this report)
Mediaset Espana
Spain/Media Analyser
MEDIA
Mediaset Espana (Buy) 9m 2016 Post: mixed picture
Estimates revised: lower revenues, higher profitability
The facts: Following the recent results, we reduce our full year forecasts on
revenues, including margin expansion.
Our analysis: This is due to the opex savings carried out during the year and
despite having acquired the Eurocup’s rights. As a result, our DCF (WACC 8.6%)
points to a FV of EUR13.4/share (-5% vs. EUR14.1/share previous).
TV advertising market, better than expected performance in 4Q’16 Q/Q
(conservative +5% estimates at annual level, Oct/Nov slightly positive). We
expect the situation to improve during the last quarter of the year, based on: 1)
less demanding comparison base Y/Y with +2.8% growths; 2) General Elections
in December 2015 and political doubts and political doubts removed in Spain; 3)
normalised audience with the absence of the Olympic Games and Eurocup (but
with Champions in A3M) in 4Q’16 and finally and most importantly, the
normalised trend in advertising expenditure with the transfer of strong retail
sales (+3% seasonally adjusted) registered in Spain.
Margins not seen since 2008, pre-crisis levels. The ongoing cost savings
(24.7% since 9m’10 proforma) and the revised opex guidance from EUR780m
to EUR770m (despite the Eurocup rights) permits a positive +0.8pp revision of
our estimated operating leverage in 2016e to EBITDA mg 24.6%.
Negative impact from WC expected in annual terms. Although 9m’16 results
included a positive working capital of EUR41.7m, during the conference the
company shed light on the annual trend, indicating it would be negative in 4Q’16
(traditionally negative) as well as for 2016/17 due to the adaptation to the
stricter norm. In this context, our estimates are prudent reflecting a
negative impact of EUR-39m in 2016e.
Conversion of 99.2% FCF in 9m’16. MSE reported a FCF of EUR183m which
implies +21.3% Y/Y. This increase caused a rise in the net cash position above
forecasts (up to EUR118.4m). We expect the company to end 2016 with a net
cash position of EUR141m which reflects its financial strength vs. peers.
Conclusion: We are comfortable with our forecasts as these are conservative in
two areas: +5% advertising market growth in 2016 and WC with a negative EUR-
39m impact. We recommend to Buy considering MSE has a wide margin
expansion space if we have in mind the peak of the cycle (2007/08).
Analyst(s):
Eduardo Garcia Arguelles, GVC Gaesco Beka
+34 914 367 810
Buy
9.67
closing price as of 08/11/2016
13.40
14.10from Target Price: EUR
Recommendation unchanged
Target price: EUR
Share price: EUR
Reuters/Bloomberg TL5.MC/TL5 SM
Market capitalisation (EURm) 3,255
Current N° of shares (m) 337
Free float 50%
Daily avg. no. trad. sh. 12 mth 1,652
Daily avg. trad. vol. 12 mth (m) 8,821
Price high 12 mth (EUR) 12.01
Price low 12 mth (EUR) 8.26
Abs. perf. 1 mth -5.69%
Abs. perf. 3 mth -7.54%
Abs. perf. 12 mth -10.61%
Key financials (EUR) 12/15 12/16e 12/17e
Sales (m) 972 1,009 1,039
EBITDA (m) 223 248 268
EBITDA margin 22.9% 24.6% 25.8%
EBIT (m) 205 230 250
EBIT margin 21.1% 22.8% 24.0%
Net Profit (adj.)(m) 166 182 210
ROCE 20.2% 18.7% 20.1%
Net debt/(cash) (m) (198) (141) (150)
Net Debt/Equity -0.2 -0.1 -0.1
Debt/EBITDA -0.9 -0.6 -0.6
Int. cover(EBITDA/Fin. int) (211.1) (150.4) (108.6)
EV/Sales 3.4 2.9 2.8
EV/EBITDA 14.9 11.9 11.0
EV/EBITDA (adj.) 14.9 11.9 11.0
EV/EBIT 16.2 12.9 11.8
P/E (adj.) 21.0 17.9 15.5
P/BV 3.3 2.7 2.6
OpFCF yield 5.5% 6.1% 7.9%
Dividend yield 5.0% 5.0% 5.8%
EPS (adj.) 0.48 0.54 0.62
BVPS 3.06 3.55 3.68
DPS 0.48 0.49 0.56
7.5
8.0
8.5
9.0
9.5
10.0
10.5
11.0
11.5
12.0
12.5
Oct 15 Nov 15 Dec 15 Jan 16 Feb 16 Mar 16 Apr 16 May 16 Jun 16 Jul 16 Aug 16 Sep 16 Oct 16 Nov 16
vvdsvdvsdy
MEDIASET ESPANA IBEX 35 (Rebased)Source: Factset
Shareholders: Mediaset S.p.A. 50%; Treasury Stocks
0.05%;

Page 30 of 50
Produced & Distributed by the Members of ESN (see last page of this report)
Rcs MediaGroup
Italy/Media Analyser
MEDIA
Rcs MediaGroup (Neutral) Estimates revised: lower revenues, higher profitability
Q3 2016 Pre: no big expectations
The facts: Q3 2016 preview (release due today).
Our analysis: we expect a modest top-line decline and broadly stable/slightly up
EBITDA in traditionally light quarter. The change in top management took place in
early August so Mr Cairo could hardly claim the first tangible results in Q3. On the
other hand, the departing CEO left with a faster/higher-than-expected cost cutting
in Q2, basically achieving the full-year savings targets already in H1. The Italian
advertising figures for July/August indicate further deterioration for newspapers (-
7.7% Y/Y vs -5.5% in Q2) and magazines (-6.6% vs. -1.8%) while internet and
radio definitely improved (+1.6% from -4.1% and 3.9% from –0.3% respectively).
In Spain, Infoadex data show a still weak but modestly improving trend in
newspapers (-5.7% Y/Y in Q3 from -6.5% in Q2), positive acceleration in internet
(+21% from +15%) and radio (+7.5% from +1.7%).
We expect net debt to have increased by EUR 10/15m from the June 2016 level,
mainly due to the net working capital dynamics and the cash impact of
restructuring actions.
RCS Media Group 9m 2016 estimates (EUR m)
Q3 2015a Q3 16 Y/Y 9M 2015a 9m 16 Y/Y
Turnover 224 219 -2.2% 743 723 -2.7%
Italian Media 92 84 -9.5% 302 273 -9.5%
Newspapers Spain 47 45 -3.0% 156 150 -3.3%
Sports 74 78 6.0% 245 259 5.6%
EBITDA adjusted 6.8 8.9 31% 17.4 49.1 182%
Margin 3.0% 4.1% 1.0% 2.3% 6.8% 4.4%
Exceptional items -5.7 -2.0 -64.9% -12.9 -8.3 -36%
EBITDA reported 1.1 6.9 527% 4.5 40.8 nm
EBIT -13.5 -6.1 nm -75.4 0.2 nm
Net Income -31.0 -11.6 nm -126 -13.7 nm
Net Debt 500 433 -13.4% 500 433 -13.4%
Source: Company data, Banca Akros estimates (adjusted for Jinny).
Outlook. RCS had said that the total EUR 60m efficiencies originally planned for
2018 should be reached already this year. This achievement should allow the
company to surpass the EBITDA target of EUR 100m in spite of a probably
weaker top-line development.
New management, new targets. The actual economic developments will now be
driven by the new actions to be implemented by the new controlling shareholder
Cairo Communication, which has announced a target of EUR 170m in FY 2018
EBITDA; vs. EUR 140m of the previous plan. Our estimates are still based on an
inertial trend of the past plan, while our target price already considers the
expected value of the recently announced actions by Cairo.
Conclusion & Action: we expect a neutral release, taking into account the
reshuffle of the top management. It is likely that a new plan will be presented with
the publication of full-year results in early 2017.
Analyst(s):
Andrea Devita, CFA, Banca Akros
+39 02 4344 4031
Neutral
0.99
closing price as of 08/11/2016
1.05
Target Price unchanged
Recommendation unchanged
Target price: EUR
Share price: EUR
Reuters/Bloomberg RCSM.MI/RCS IM
Market capitalisation (EURm) 514
Current N° of shares (m) 522
Free float 12%
Daily avg. no. trad. sh. 12 mth 4,169
Daily avg. trad. vol. 12 mth (m) 318
Price high 12 mth (EUR) 1.05
Price low 12 mth (EUR) 0.41
Abs. perf. 1 mth 3.90%
Abs. perf. 3 mth 13.74%
Abs. perf. 12 mth 28.26%
Key financials (EUR) 12/15 12/16e 12/17e
Sales (m) 1,032 1,002 1,006
EBITDA (m) 16 92 107
EBITDA margin 1.6% 9.2% 10.6%
EBIT (m) (107) 37 55
EBIT margin nm 3.7% 5.5%
Net Profit (adj.)(m) (49) 3 16
ROCE -4.0% 4.9% 3.9%
Net debt/(cash) (m) 487 424 396
Net Debt/Equity 4.6 3.7 3.0
Debt/EBITDA 29.7 4.6 3.7
Int. cover(EBITDA/Fin. int) 0.5 3.1 4.1
EV/Sales 0.8 1.0 0.9
EV/EBITDA 51.9 10.7 8.9
EV/EBITDA (adj.) 11.8 9.6 8.1
EV/EBIT nm 26.7 17.3
P/E (adj.) nm nm 31.4
P/BV 3.0 4.5 3.9
OpFCF yield 13.6% -9.6% 5.6%
Dividend yield 0.0% 0.0% 0.0%
EPS (adj.) (0.09) 0.01 0.03
BVPS 0.20 0.22 0.25
DPS 0.00 0.00 0.00
0.40
0.50
0.60
0.70
0.80
0.90
1.00
1.10
ott 15 nov 15 dic 15 gen 16 feb 16 mar 16 apr 16 mag 16 giu 16 lug 16 ago 16 set 16 ott 16 nov 16
vvdsvdvsdy
RCS MEDIAGROUP Stoxx Media (Rebased)Source: Factset
Shareholders: Cairo Communication 60%; IMH 23%;

Page 31 of 50
Produced & Distributed by the Members of ESN (see last page of this report)
Vallourec
France/Oil Services Analyser
OIL SERVICES
Vallourec (Buy) Q3 2016 Pre: no big expectations
Less-strong-than-expected EBITDA loss, transformation plan progress
The facts: For Q3, Vallourec published revenues of EUR693m (-20% y-o-y), an
EBITDA loss of EUR52m (vs EUR-66m in Q3 2015) and a net loss of EUR160m
(EUR-164m in Q3 2015).
Our analysis: These results, which show that market conditions have stopped
deteriorating, are slightly better than our expectations for the year (EBITDA EUR-
271m) and consensus expectations, mainly thanks to more concentrated activity in
Brazil in Q3 to prepare the tie-in between VSB and Vallourec rubis do Brasil which
will take place in Q4. Vallourec will also finalise the acquisition of Tianda Oil Pipe in
China).
Even though still posting a marked fall (-24.6% vs Q3 3015), the contribution of oil
revenues at EUR439m are showing positive signs (9M revenues down by 32%)
and benefitted from a gradual recovery of the drilling activity in North America. In
other regions, Vallourec indicated that the low level of bids for tender, particularly
in the Middle East will result in a still fairly weak level of activity in H1 2017 and
should increase in H2, benefitting from the full effect of transformation plan
measures.
During its conference call, Vallourec gave guidance over its EBITDA forecasts for
the entire year after having reduced the loss in Q3. This should come to under
EUR-230m/EUR-240m in 2016E, whereas we and the consensus were expecting
a lower result (CM-CIC EUR-271m, consensus EUR-244m).
Implementation of the plan continues and after finalisation in Brazil of the VSB
(new Jeceaba facility) and VTB (Belo Horizonte historical facility) merger, which
will enable significant efficiency gains, Vallourec will shortly finalise the 100%
acquisition of Tianda Oil Pipe.
Conclusion & Action: In a still difficult environment over the next few quarters,
signs of improvement in the US and progress made on the transformation plan
are good signs.
Analyst(s):
Jean-Luc Romain, CM - CIC Market Solutions
+33 1 53 48 80 66
Buy
4.12
closing price as of 08/11/2016
8.00
Target Price unchanged
Recommendation unchanged
Target price: EUR
Share price: EUR
Reuters/Bloomberg VLLP.PA/VK FP
Market capitalisation (EURm) 1,884
Current N° of shares (m) 458
Free float 82%
Daily avg. no. trad. sh. 12 mth 7,232
Daily avg. trad. vol. 12 mth (m) 33,203
Price high 12 mth (EUR) 5.03
Price low 12 mth (EUR) 1.22
Abs. perf. 1 mth -7.46%
Abs. perf. 3 mth 20.83%
Abs. perf. 12 mth 11.27%
Key financials (EUR) 12/15 12/16e 12/17e
Sales (m) 3,803 3,391 3,756
EBITDA (m) (77) (271) 113
EBITDA margin nm nm 3.0%
EBIT (m) (838) (569) (178)
EBIT margin nm nm nm
Net Profit (adj.)(m) (865) (427) (151)
ROCE -11.9% -8.5% -2.7%
Net debt/(cash) (m) 1,519 781 842
Net Debt/Equity 0.5 0.2 0.2
Debt/EBITDA -19.7 -2.9 7.5
Int. cover(EBITDA/Fin. int) (0.9) (4.2) 2.4
EV/Sales 0.8 1.5 1.4
EV/EBITDA nm nm 46.6
EV/EBITDA (adj.) nm nm 46.6
EV/EBIT nm nm nm
P/E (adj.) nm nm nm
P/BV 0.2 0.6 0.6
OpFCF yield -41.7% -4.3% -3.4%
Dividend yield 0.0% 0.0% 2.4%
EPS (adj.) (6.49) (0.93) (0.33)
BVPS 19.50 6.93 6.59
DPS 0.00 0.00 0.10
1.0
1.5
2.0
2.5
3.0
3.5
4.0
4.5
5.0
5.5
Oct 15 Nov 15 Dec 15 Jan 16 Feb 16 Mar 16 Apr 16 May 16 Jun 16 Jul 16 Aug 16 Sep 16 Oct 16 Nov 16
vvdsvdvsdy
VALLOUREC CAC Small & Mid 190 (Rebased)Source: Factset
Shareholders: BPIFrance Participations 5%; CDC Fonds
d'Epargne 2%; Nippon Steel Sumitomo
1.51%; employees 8%; Company held
shares 1.36%;

Page 32 of 50
Produced & Distributed by the Members of ESN (see last page of this report)
Geox
Italy/Personal Goods Analyser
PERSONAL GOODS
Geox (Accumulate) Less-strong-than-expected EBITDA loss, transformation plan progress
9M 16E sales preview
The facts: Geox is due to release its 9M 16E sales today after market closure, a
conference call will follow @ 5:30 pm CET (from Italy: +39 02 805 88 11; UK: +
44 121 281 8003; from the US: +1 718 7058794; from the US -toll-free number- :
+1 855 2656959).
Our analysis: On the back of the brilliant performance of the order backlog, we
expect wholesale sales up double digits in Q3 16E and in 9M 16E. We estimate
flat DOS sales in 9M 16E and revenues from franchising up 2.2% in 9M 16E.
Geox: 9M 16E sales estimates
EUR m Q3 15 Q3 16E % Chg. 9M 15 9M 16E % Chg.
DOS 92.3 90.5 -2.0% 276.6 277.8 0.4%
Franchising 51.2 50.7 -1.0% 121.5 124.2 2.2%
Wholesale 138.4 153.7 11.0% 310.8 343.1 10.4%
Total sales 281.9 294.8 4.6% 708.9 745.1 5.1%
Source: Company data and Banca Akros estimates
Conclusion & Action: we warn investors that, short term, the stock risk profile
has increased: indeed, the management said that profitability expectations for
2016 are challenging and the current year is transitional. We keep our
Accumulate betting on sales surprises in Q3 16E and Q4 16E.
Analyst(s):
Giada Cabrino, CIIA, Banca Akros
+39 02 4344 4092
Accumulate
1.93
closing price as of 08/11/2016
3.20
Target Price unchanged
Recommendation unchanged
Target price: EUR
Share price: EUR
Reuters/Bloomberg GEO.MI/GEO IM
Market capitalisation (EURm) 499
Current N° of shares (m) 259
Free float 27%
Daily avg. no. trad. sh. 12 mth 551
Daily avg. trad. vol. 12 mth (m) 473
Price high 12 mth (EUR) 4.36
Price low 12 mth (EUR) 1.91
Abs. perf. 1 mth -5.91%
Abs. perf. 3 mth -21.11%
Abs. perf. 12 mth -54.92%
Key financials (EUR) 12/14 12/15e 12/16e
Sales (m) 824 874 932
EBITDA (m) 43 62 63
EBITDA margin 5.2% 7.1% 6.8%
EBIT (m) 5 25 25
EBIT margin 0.6% 2.8% 2.7%
Net Profit (adj.)(m) (3) 10 14
ROCE 1.0% 5.3% 4.8%
Net debt/(cash) (m) 15 (21) (8)
Net Debt/Equity 0.0 -0.1 0.0
Debt/EBITDA 0.3 -0.3 -0.1
Int. cover(EBITDA/Fin. int) 6.7 10.6 19.7
EV/Sales 0.9 1.2 0.6
EV/EBITDA 18.1 17.6 8.6
EV/EBITDA (adj.) 18.1 17.6 8.6
EV/EBIT nm 43.8 21.6
P/E (adj.) nm nm 35.5
P/BV 1.9 2.9 1.3
OpFCF yield -2.7% 3.9% -2.0%
Dividend yield 0.0% 3.1% 3.1%
EPS (adj.) (0.01) 0.04 0.05
BVPS 1.44 1.43 1.48
DPS 0.00 0.06 0.06
1.5
2.0
2.5
3.0
3.5
4.0
4.5
ott 15 nov 15 dic 15 gen 16 feb 16 mar 16 apr 16 mag 16 giu 16 lug 16 ago 16 set 16 ott 16 nov 16
vvdsvdvsdy
GEOX Stoxx Personal Goods (Rebased)Source: Factset
Shareholders: Mario Moretti Polegato 71%; FMR LLC
2%;

Page 33 of 50
Produced & Distributed by the Members of ESN (see last page of this report)
Moncler
Italy/Personal Goods Analyser
PERSONAL GOODS
Moncler (Buy) 9M 16E sales preview
9M 16 sales: another good release
The facts: Moncler released its 9M 16 sales yesterday after market closure, a conf. call
followed. Revenues, up 14% (current and constant forex), were in line with our estimates
and consensus.
Our analysis: By area: Europe grew 10% at constant forex in 9M 16 (+10% in Q3 16) with
good performance in the UK (est. 5% of total sales) and Germany in both channels, driven
by tourists and local clientele; France (est. 8% of total sales) and Belgium were still
impacted by lowering tourists flow (although, there were signs of improvement by the local
demand in France). Revenues in Italy decreased in the wholesale, coherently with the
doors selection strategy; despite a reasonable number of wholesalers has been reached,
expectations are for no sales improvements in FY 17E. Asia beat our expectations with
+18% growth at constant forex in 9M 16 and +25% in Q3 16: Mainland China (est. 12% of
total sales) was supported by the local consumption, comps were the best in the region;
Korea ranked second (est. 4% of total sales) in terms of comps. followed by Hong Kong
(est. 5% of total sales); Japan (est. 13% of total sales) suffered from the Yen appreciation.
Moncler didn’t put in place any price adjustments to offset currency movements (neither in
the UK nor in Japan) thus leaving a big price gap between Europe and Japan; however, the
new S/S 17 collection already incorporates price adjustments and the F/W 17 collection will
incorporate price adjustments (in both collections: only for new products and not for carry
over).
Revenues in the Americas grew 18% at constant forex in 9M 16 and 13% in Q3 16, driven
by both channels; Canada, Hawaii and the West Coast outperformed.
The retail channel recorded +20% increase in 9M 16 and +16% in Q3 16, driven by positive
comps and new openings; wholesale grew 5% in 9M 16 and 4% in Q3 16. At the end of
September there were 186 retail stores (+7 in Q3 16) and 40 wholesale stores (+4 in Q3
16).
Moncler 9M 16 sales
EUR m Q3 15 Q3 16 Y/Y Chg. 9M 15 9M 16 Y/Y Chg.
Italy 56.0 55.5 -0.9% 107.4 106.6 -0.7%
% on sales 21.1% 19.0%
19.1% 16.8%
EMEA (ex-Italy) 91.1 97.9 7.5% 190.0 203.8 7.2%
% on sales 34.3% 33.4%
33.8% 32.0%
Americas 50.9 57.2 12.4% 93.6 109.7 17.2%
% on sales 19.2% 19.5%
16.7% 17.2%
Asia and RoW 67.7 82.2 21.4% 170.5 216.2 26.8%
% on sales 25.5% 28.1%
30.4% 34.0%
TOTAL 265.7 292.8 10.2% 561.5 636.3 13.3%
Source: company data
Outlook: FY 16E EUR 1bn revenues is a reasonable target as well as 33.4% FY 16E
EBITDA margin. 12 new store are already secured: they are spread in all the regions (some
in APAC o/w the 1st in Australia; 1 in Mainland China, some in Europe, 2 in North America
o/w 1 in Canada); there will also be some relocations, among them the shop in Milano
Montenapoleone and the one in Hong Kong Caolun. Q4 16E started with October better
than September, a good beginning of November and a better sell-through in the department
stores in the US for the F/W season.
Conclusion & Action: These results testify to still strong brand momentum. The
company’s excellence is one of the main feature our investment case is based on. Buy
confirmed.
Analyst(s):
Giada Cabrino, CIIA, Banca Akros
+39 02 4344 4092
Buy
14.86
closing price as of 08/11/2016
19.60
Target Price unchanged
Recommendation unchanged
Target price: EUR
Share price: EUR
Reuters/Bloomberg MONC.MI/MONC IM
Market capitalisation (EURm) 3,718
Current N° of shares (m) 250
Free float 59%
Daily avg. no. trad. sh. 12 mth 1,120
Daily avg. trad. vol. 12 mth (m) 14,012
Price high 12 mth (EUR) 16.00
Price low 12 mth (EUR) 12.19
Abs. perf. 1 mth -1.00%
Abs. perf. 3 mth -4.87%
Abs. perf. 12 mth -5.17%
Key financials (EUR) 12/15 12/16e 12/17e
Sales (m) 880 977 1,089
EBITDA (m) 300 331 370
EBITDA margin 34.1% 33.9% 34.0%
EBIT (m) 264 287 322
EBIT margin 30.0% 29.4% 29.6%
Net Profit (adj.)(m) 175 190 213
ROCE 27.7% 29.1% 30.7%
Net debt/(cash) (m) 50 (37) (179)
Net Debt/Equity 0.1 -0.1 -0.2
Debt/EBITDA 0.2 -0.1 -0.5
Int. cover(EBITDA/Fin. int) 175.7 110.2 123.3
EV/Sales 3.8 3.8 3.3
EV/EBITDA 11.0 11.2 9.6
EV/EBITDA (adj.) 11.0 11.2 9.6
EV/EBIT 12.5 13.0 11.1
P/E (adj.) 18.4 19.6 17.4
P/BV 5.9 5.3 4.3
OpFCF yield 3.4% 3.1% 5.1%
Dividend yield 0.9% 1.1% 1.3%
EPS (adj.) 0.70 0.76 0.85
BVPS 2.18 2.80 3.49
DPS 0.14 0.17 0.19
10
11
12
13
14
15
16
17
ott 15 nov 15 dic 15 gen 16 feb 16 mar 16 apr 16 mag 16 giu 16 lug 16 ago 16 set 16 ott 16 nov 16
vvdsvdvsdy
MONCLER FTSE Italy All Share (Rebased)Source: Factset
Shareholders: Remo Ruffini 27%; Eurazeo 10%; T.
Rowe Price Associates Inc. 5%;

Page 34 of 50
Produced & Distributed by the Members of ESN (see last page of this report)
Safilo
Italy/Personal Goods Analyser
PERSONAL GOODS
Safilo (Neutral) 9M 16 sales: another good release
9M 2016 results preview
The facts: Safilo is due to release its 9M 16E results today after market closure,
a conf. call will follow @ 6:30 pm CET (dial in: +39 02 99749000, +44 20
34270503, or +1 646 2543366 - confirmation code: 5733323).
Our analysis: We expect going forward brands to have delivered a positive
performance in Q3 16, in line with Q2 16 (however, we remind readers that Q2
16 benefitted from the partially recovery of the Q1 16 order book, not
accomplished directly in Q1 16 because of a service shortfall).
The small increase in EBITDA in Q3 16E reflects the actions undertaken to
improve operating leverage despite the dilution driven by Gucci (it follows a drop
in Q1 16 and a strong recovery in Q2 16).
Safilo: 9M 16E estimates
EUR m Q3 15 Q3 16E Y/Y 9M 15 9M 16E Y/Y
Total sales 284.8 281.5 -1.1% 959.7 932.6 -2.8%
EBITDA adj. 14.7 14.5 0.7% 77.4 72.8 -6.0%
EBITDA margin adj. 5.2% 5.1%
8.1% 7.8%
Source: Company data, Banca Akros estimates
Conclusion & Action: We keep our neutral on the stock. Positive licences-
related news flow (=Céline renewal announcement, due to expire at the end of
the year) could be a short term trigger.
Analyst(s):
Giada Cabrino, CIIA, Banca Akros
+39 02 4344 4092
Neutral
9.50
closing price as of 08/11/2016
8.00
Target Price unchanged
Recommendation unchanged
Target price: EUR
Share price: EUR
Reuters/Bloomberg SFLG.MI/SFL IM
Market capitalisation (EURm) 594
Current N° of shares (m) 63
Free float 49%
Daily avg. no. trad. sh. 12 mth 118
Daily avg. trad. vol. 12 mth (m) 1,278
Price high 12 mth (EUR) 11.58
Price low 12 mth (EUR) 6.27
Abs. perf. 1 mth -0.11%
Abs. perf. 3 mth 16.15%
Abs. perf. 12 mth -16.78%
Key financials (EUR) 12/15 12/16e 12/17e
Sales (m) 1,279 1,230 1,186
EBITDA (m) 82 85 76
EBITDA margin 6.4% 6.9% 6.4%
EBIT (m) 1 47 36
EBIT margin 0.1% 3.8% 3.0%
Net Profit (adj.)(m) (16) 22 17
ROCE 0.1% 2.8% -4.2%
Net debt/(cash) (m) 90 77 26
Net Debt/Equity 0.1 0.1 0.0
Debt/EBITDA 1.1 0.9 0.4
Int. cover(EBITDA/Fin. int) 3.1 9.4 9.4
EV/Sales 0.6 0.5 0.5
EV/EBITDA 8.9 7.8 8.2
EV/EBITDA (adj.) 8.9 7.8 8.2
EV/EBIT nm 14.2 17.1
P/E (adj.) nm 26.6 35.9
P/BV 0.7 0.6 0.6
OpFCF yield -12.0% 6.6% 6.0%
Dividend yield 0.0% 0.0% 0.0%
EPS (adj.) (0.25) 0.36 0.26
BVPS 15.95 16.31 17.01
DPS 0.00 0.00 0.00
6
7
8
9
10
11
12
ott 15 nov 15 dic 15 gen 16 feb 16 mar 16 apr 16 mag 16 giu 16 lug 16 ago 16 set 16 ott 16 nov 16
vvdsvdvsdy
SAFILO Stoxx Personal Goods (Rebased)Source: Factset
Shareholders: Tabacchi Family 9%; Hal Holding 42%;
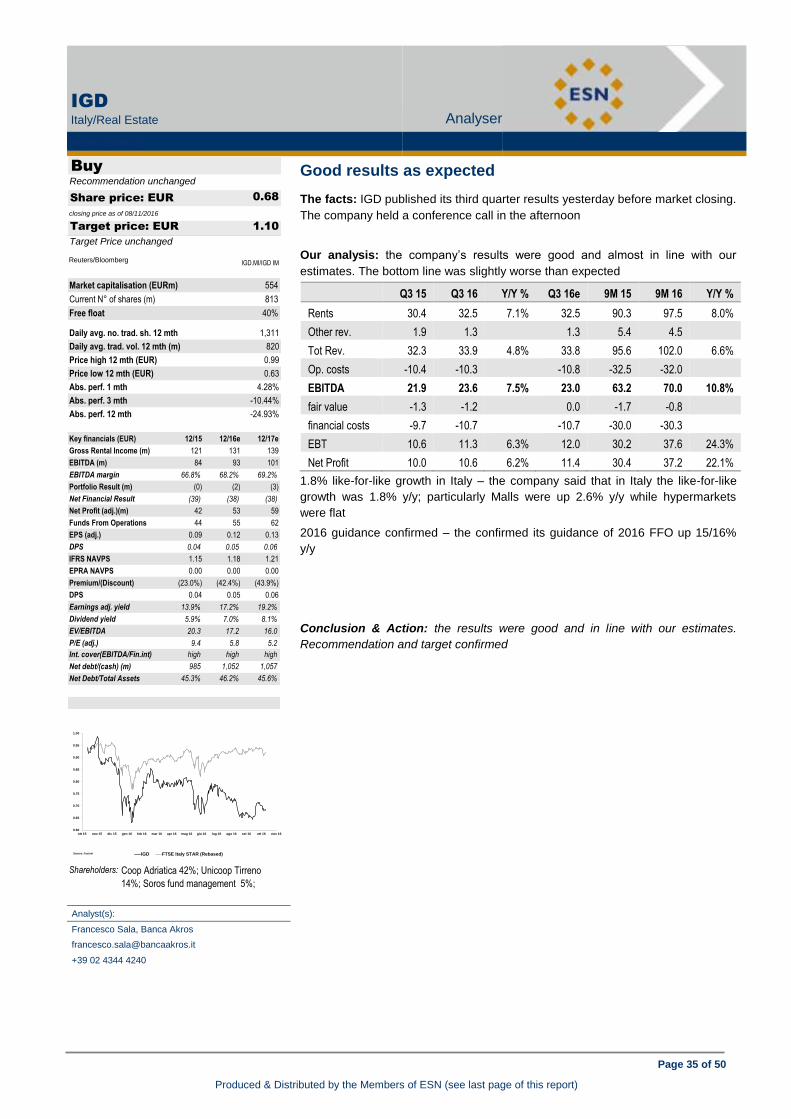
Page 35 of 50
Produced & Distributed by the Members of ESN (see last page of this report)
IGD
Italy/Real Estate Analyser
REAL ESTATE
IGD (Buy) 9M 2016 results preview
Good results as expected
The facts: IGD published its third quarter results yesterday before market closing.
The company held a conference call in the afternoon
Our analysis: the company’s results were good and almost in line with our
estimates. The bottom line was slightly worse than expected
Q3 15 Q3 16 Y/Y % Q3 16e 9M 15 9M 16 Y/Y %
Rents 30.4 32.5 7.1% 32.5 90.3 97.5 8.0%
Other rev. 1.9 1.3
1.3 5.4 4.5
Tot Rev. 32.3 33.9 4.8% 33.8 95.6 102.0 6.6%
Op. costs -10.4 -10.3
-10.8 -32.5 -32.0
EBITDA 21.9 23.6 7.5% 23.0 63.2 70.0 10.8%
fair value -1.3 -1.2
0.0 -1.7 -0.8
financial costs -9.7 -10.7
-10.7 -30.0 -30.3
EBT 10.6 11.3 6.3% 12.0 30.2 37.6 24.3%
Net Profit 10.0 10.6 6.2% 11.4 30.4 37.2 22.1%
1.8% like-for-like growth in Italy – the company said that in Italy the like-for-like
growth was 1.8% y/y; particularly Malls were up 2.6% y/y while hypermarkets
were flat
2016 guidance confirmed – the confirmed its guidance of 2016 FFO up 15/16%
y/y
Conclusion & Action: the results were good and in line with our estimates.
Recommendation and target confirmed
Analyst(s):
Francesco Sala, Banca Akros
+39 02 4344 4240
Buy
0.68
closing price as of 08/11/2016
1.10
Target Price unchanged
Recommendation unchanged
Target price: EUR
Share price: EUR
Reuters/Bloomberg IGD.MI/IGD IM
Market capitalisation (EURm) 554
Current N° of shares (m) 813
Free float 40%
Daily avg. no. trad. sh. 12 mth 1,311
Daily avg. trad. vol. 12 mth (m) 820
Price high 12 mth (EUR) 0.99
Price low 12 mth (EUR) 0.63
Abs. perf. 1 mth 4.28%
Abs. perf. 3 mth -10.44%
Abs. perf. 12 mth -24.93%
Key financials (EUR) 12/15 12/16e 12/17e
Gross Rental Income (m) 121 131 139
EBITDA (m) 84 93 101
EBITDA margin 66.8% 68.2% 69.2%
Portfolio Result (m) (0) (2) (3)
Net Financial Result (39) (38) (38)
Net Profit (adj.)(m) 42 53 59
Funds From Operations 44 55 62
EPS (adj.) 0.09 0.12 0.13
DPS 0.04 0.05 0.06
IFRS NAVPS 1.15 1.18 1.21
EPRA NAVPS 0.00 0.00 0.00
Premium/(Discount) (23.0%) (42.4%) (43.9%)
DPS 0.04 0.05 0.06
Earnings adj. yield 13.9% 17.2% 19.2%
Dividend yield 5.9% 7.0% 8.1%
EV/EBITDA 20.3 17.2 16.0
P/E (adj.) 9.4 5.8 5.2
Int. cover(EBITDA/Fin.int) high high high
Net debt/(cash) (m) 985 1,052 1,057
Net Debt/Total Assets 45.3% 46.2% 45.6%
0.60
0.65
0.70
0.75
0.80
0.85
0.90
0.95
1.00
ott 15 nov 15 dic 15 gen 16 feb 16 mar 16 apr 16 mag 16 giu 16 lug 16 ago 16 set 16 ott 16 nov 16
vvdsvdvsdy
IGD FTSE Italy STAR (Rebased)Source: Factset
Shareholders: Coop Adriatica 42%; Unicoop Tirreno
14%; Soros fund management 5%;

Page 36 of 50
Produced & Distributed by the Members of ESN (see last page of this report)
Atos
France/Software & Computer Services Analyser
SOFTWARE & COMPUTER SERVICES
Atos (Buy) Good results as expected
2019 plan: a new model across the entire group
The facts: Atos is looking for organic growth of 2-3% and an operating margin of
10.5-11% by 2019 (vs our 2016 forecast of 9.3%). The transformation of the
model seen in Outsourcing in recent years is set to continue and be extended into
other areas.
Our analysis: Outsourcing: from pure Legacy currently migrating to the Cloud
Canopy, activity stands to benefit from the implementation of the management
platform of various new-generation infrastructures (Legacy/Private-Public Cloud).
The legacy activity will continue to decline, but the mix will allow growth to remain
positive. Automation should reduce its workforce, thereby improving profitability.
Consulting & Systems Integration: a classic ERP integration business, activity is
changing and leveraging the Bull assets. Atos will now focus on the deployment
of SAP HANA, a cloud-hosted ERP platform, allowing new services (data/security
analysis) and requiring significant computing power. This should revitalise its
growth profile (+3-4%) and profitability (+2-2.5pp). Big Data & Cybersecurity:
leveraging Bull technology, Atos is launching Codex, a platform integrating the
foundations needed to offer deals on cybersecurity measurement and analysis of
predictive data to guide business decisions. Worldline: post-IPO objectives
maintained, i.e. organic growth of 5-7% from H1-2017 (VOSA and Radar effect).
Worldline intends to capitalise on a volume effect linked to transaction growth and
recent M&A to achieve an operating margin of c.22% (+350-400bp). Moreover,
Atos expects to maintain its dividend policy (payout of 25-30%) despite acquisitive
momentum that should continue in the image of the recent Anthelio deal.
Conclusion & Action: These announcements are reassuring about the
continuation of the momentum seen in recent quarters. The legacy activity is
declining, but Atos has demonstrated its ability to reposition on disruptive
developments and become a leader (witness the cloud in outsourcing). We are
lifting our BD & CS forecasts to integrate Atos Codex, but remain cautious for now
on Atos’s growth ambitions in C&SI and the profitability of Worldline. We now take
a GARP approach, valuing the share of EUR157 in 2021E, i.e. a present value of
EUR112 (unchanged EV/EBIT multiple of 10x).
Analyst(s):
Kévin Woringer, CM - CIC Market Solutions
+33 1 53 48 80 69
Buy
94.70
closing price as of 08/11/2016
112.00
102.00from Target Price: EUR
Recommendation unchanged
Target price: EUR
Share price: EUR
Reuters/Bloomberg ATOS.PA/ATO FP
Market capitalisation (EURm) 9,658
Current N° of shares (m) 102
Free float 84%
Daily avg. no. trad. sh. 12 mth 321
Daily avg. trad. vol. 12 mth (m) 42,053
Price high 12 mth (EUR) 97.81
Price low 12 mth (EUR) 62.66
Abs. perf. 1 mth -1.14%
Abs. perf. 3 mth 7.09%
Abs. perf. 12 mth 23.79%
Key financials (EUR) 12/15 12/16e 12/17e
Sales (m) 10,686 11,731 12,251
EBITDA (m) 911 1,235 1,425
EBITDA margin 8.5% 10.5% 11.6%
EBIT (m) 589 813 981
EBIT margin 5.5% 6.9% 8.0%
Net Profit (adj.)(m) 600 756 886
ROCE 12.5% 13.3% 14.8%
Net debt/(cash) (m) (593) (536) (1,048)
Net Debt/Equity -0.1 -0.1 -0.2
Debt/EBITDA -0.7 -0.4 -0.7
Int. cover(EBITDA/Fin. int) 52.2 47.0 55.8
EV/Sales 0.7 0.8 0.7
EV/EBITDA 7.9 7.4 6.0
EV/EBITDA (adj.) 6.4 6.5 5.5
EV/EBIT 12.3 11.2 8.8
P/E (adj.) 13.2 12.8 10.9
P/BV 2.1 2.2 2.0
OpFCF yield 5.2% 5.8% 6.9%
Dividend yield 1.2% 1.5% 1.9%
EPS (adj.) 5.89 7.42 8.68
BVPS 37.68 42.19 48.02
DPS 1.10 1.40 1.81
60
65
70
75
80
85
90
95
100
Oct 15 Nov 15 Dec 15 Jan 16 Feb 16 Mar 16 Apr 16 May 16 Jun 16 Jul 16 Aug 16 Sep 16 Oct 16 Nov 16
vvdsvdvsdy
ATOS Stoxx Software & Computer Services (Rebased)Source: Factset
Shareholders: Siemens 12%; Board of Directors 0.60%;
Employees 3%; Treasury shares 1.20%;

Page 37 of 50
Produced & Distributed by the Members of ESN (see last page of this report)
Batenburg
Netherlands/Support Services Analyser
SUPPORT SERVICES
Batenburg (Accumulate) 2019 plan: a new model across the entire group
Accumulate
24.65
closing price as of 08/11/2016
21.50
Target Price unchanged
Recommendation unchanged
Target price: EUR
Share price: EUR
Reuters/Bloomberg BTBN.AS/BATEN NA
Market capitalisation (EURm) 59
Current N° of shares (m) 2
Free float 6%
Daily avg. no. trad. sh. 12 mth 1
Daily avg. trad. vol. 12 mth (m) 0
Price high 12 mth (EUR) 25.97
Price low 12 mth (EUR) 18.00
Abs. perf. 1 mth -1.79%
Abs. perf. 3 mth 24.78%
Abs. perf. 12 mth 27.32%
Key financials (EUR) 12/15 12/16e 12/17e
Sales (m) 133 138 143
EBITDA (m) 5 7 8
EBITDA margin 3.9% 4.9% 5.4%
EBIT (m) 3 5 6
EBIT margin 2.5% 3.5% 4.1%
Net Profit (adj.)(m) 3 4 5
ROCE 6.9% 8.6% 10.6%
Net debt/(cash) (m) (10) (13) (16)
Net Debt/Equity -0.3 -0.3 -0.4
Debt/EBITDA -1.9 -1.9 -2.1
Int. cover(EBITDA/Fin. int) 194.5 (83.8) (48.1)
EV/Sales 0.3 0.3 0.3
EV/EBITDA 7.0 7.0 5.7
EV/EBITDA (adj.) 6.2 7.0 5.7
EV/EBIT 11.1 9.6 7.3
P/E (adj.) 16.5 16.1 13.0
P/BV 1.2 1.5 1.4
OpFCF yield 5.1% 7.6% 8.6%
Dividend yield 3.0% 3.2% 3.9%
EPS (adj.) 1.17 1.54 1.90
BVPS 15.44 16.23 17.33
DPS 0.75 0.80 0.95
Positive market trends continued in Q3
The facts: Batenburg published its qualitative Q3 trading update. Positive
revenue trends have continued in the third quarter and both revenues and profits
were higher compared to last year. Batenburg reiterated its full year forecast of
higher operating profit compared to last year.
Our analysis: Management stated that the company experienced a solid third
quarter, which hints on further good growth and margin improvement in the
quarter. Both revenues and profits were indeed higher compared to last year
without giving any more details.
The trend of increasing demand within Industrial Automation has continued into
Q3 with particularly good growth in process automation but horticulture is
stabilising following strong results in 1H. Order book in this division remains well
filled. Within Trade & Assembly the picture remains mixed with good growth in
energy offset by lower revenues in oil services. Order book has remained stable
for this division. Batenburg has shown modest growth in Building-related
Installation where market conditions remained challenging with continued low
price levels. Order book for Q4 is well filled, which suggests that Batenburg might
end up the year with a positive operating result following break-even in the first
half.
For 2016, management reiterated its guidance of a higher operating profit
compared to 2015. Given the improvement in the first half, the higher results in
Q3 and the contribution of Bellt for 2 months (annual revenues of EUR 13m), this
guidance is too conservative. Our estimates currently assume 3.5% revenue
growth and a 70bps improvement in EBIT margin, which are also too
conservative.
Conclusion & Action: Batenburg’s qualitative trading update confirmed the
positive trends in its markets (revenue growth of 12% in 1H). Acquired Bellt will
contribute to results as from November 2016. Company guidance of a higher
operating profit for the full year is too conservative as we think that profits in 2H
will also be clearly higher compared to last year following the doubling in EBIT in
1H. We expect market conditions to further improve and the company’s focus on
the better performing segments industry and infrastructure to gradually pay-off.
The company is valued at an EV/EBITDA 2016 of only 5.5, with a dividend yield
of 3-4%: Accumulate.
17
18
19
20
21
22
23
24
25
26
Oct 15 Nov 15 Dec 15 Jan 16 Feb 16 Mar 16 Apr 16 May 16 Jun 16 Jul 16 Aug 16 Sep 16 Oct 16 Nov 16
vvdsvdvsdy
BATENBURG Amsterdam Small Cap Index (Rebased)Source: Factset Shareholders: Bech NV 77%; Decico 9%; J.L. van den
Heuvel 5%; Oddo Meriten 3%;
Analyst(s):
Johan van den Hooven, NIBC Markets N.V.
+312 0 5508518
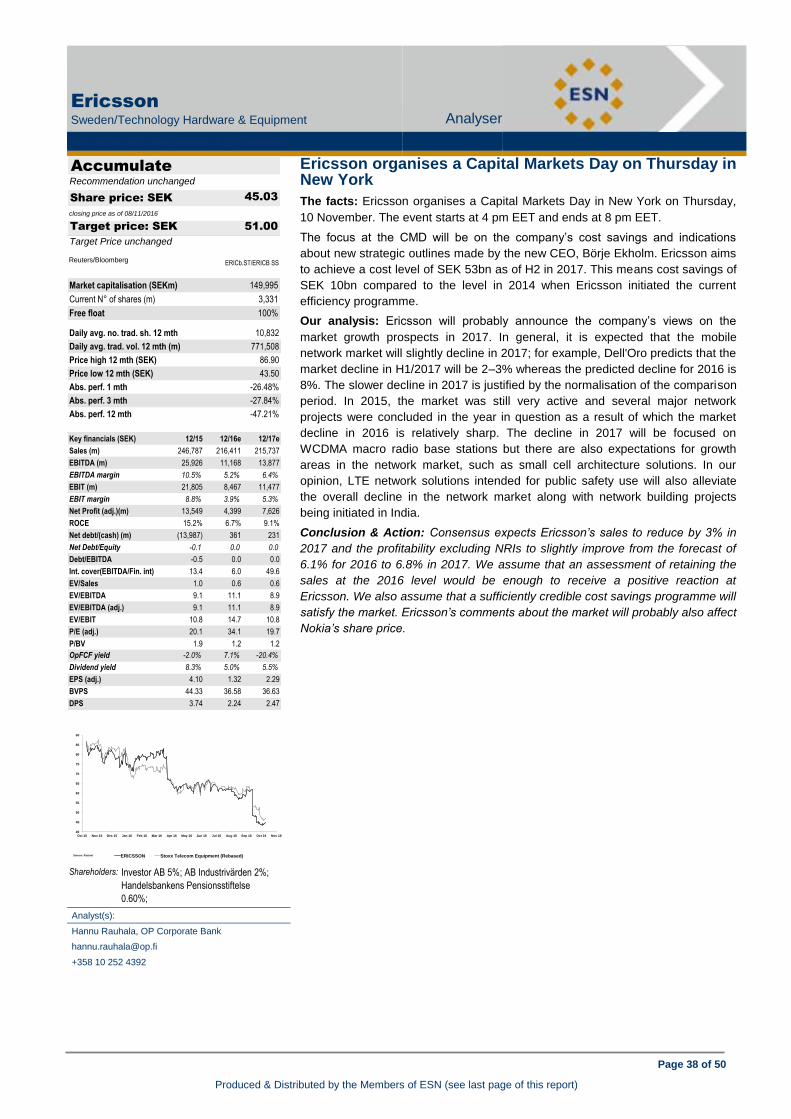
Page 38 of 50
Produced & Distributed by the Members of ESN (see last page of this report)
Ericsson
Sweden/Technology Hardware & Equipment Analyser
TECHNOLOGY HARDWARE & EQUIPMENT
Ericsson (Accumulate) Positive market trends continued in Q3
Ericsson organises a Capital Markets Day on Thursday in New York
The facts: Ericsson organises a Capital Markets Day in New York on Thursday,
10 November. The event starts at 4 pm EET and ends at 8 pm EET.
The focus at the CMD will be on the company’s cost savings and indications
about new strategic outlines made by the new CEO, Börje Ekholm. Ericsson aims
to achieve a cost level of SEK 53bn as of H2 in 2017. This means cost savings of
SEK 10bn compared to the level in 2014 when Ericsson initiated the current
efficiency programme.
Our analysis: Ericsson will probably announce the company’s views on the
market growth prospects in 2017. In general, it is expected that the mobile
network market will slightly decline in 2017; for example, Dell'Oro predicts that the
market decline in H1/2017 will be 2–3% whereas the predicted decline for 2016 is
8%. The slower decline in 2017 is justified by the normalisation of the comparison
period. In 2015, the market was still very active and several major network
projects were concluded in the year in question as a result of which the market
decline in 2016 is relatively sharp. The decline in 2017 will be focused on
WCDMA macro radio base stations but there are also expectations for growth
areas in the network market, such as small cell architecture solutions. In our
opinion, LTE network solutions intended for public safety use will also alleviate
the overall decline in the network market along with network building projects
being initiated in India.
Conclusion & Action: Consensus expects Ericsson’s sales to reduce by 3% in
2017 and the profitability excluding NRIs to slightly improve from the forecast of
6.1% for 2016 to 6.8% in 2017. We assume that an assessment of retaining the
sales at the 2016 level would be enough to receive a positive reaction at
Ericsson. We also assume that a sufficiently credible cost savings programme will
satisfy the market. Ericsson’s comments about the market will probably also affect
Nokia’s share price.
Analyst(s):
Hannu Rauhala, OP Corporate Bank
+358 10 252 4392
Accumulate
45.03
closing price as of 08/11/2016
51.00
Target Price unchanged
Recommendation unchanged
Target price: SEK
Share price: SEK
Reuters/Bloomberg ERICb.ST/ERICB SS
Market capitalisation (SEKm) 149,995
Current N° of shares (m) 3,331
Free float 100%
Daily avg. no. trad. sh. 12 mth 10,832
Daily avg. trad. vol. 12 mth (m) 771,508
Price high 12 mth (SEK) 86.90
Price low 12 mth (SEK) 43.50
Abs. perf. 1 mth -26.48%
Abs. perf. 3 mth -27.84%
Abs. perf. 12 mth -47.21%
Key financials (SEK) 12/15 12/16e 12/17e
Sales (m) 246,787 216,411 215,737
EBITDA (m) 25,926 11,168 13,877
EBITDA margin 10.5% 5.2% 6.4%
EBIT (m) 21,805 8,467 11,477
EBIT margin 8.8% 3.9% 5.3%
Net Profit (adj.)(m) 13,549 4,399 7,626
ROCE 15.2% 6.7% 9.1%
Net debt/(cash) (m) (13,987) 361 231
Net Debt/Equity -0.1 0.0 0.0
Debt/EBITDA -0.5 0.0 0.0
Int. cover(EBITDA/Fin. int) 13.4 6.0 49.6
EV/Sales 1.0 0.6 0.6
EV/EBITDA 9.1 11.1 8.9
EV/EBITDA (adj.) 9.1 11.1 8.9
EV/EBIT 10.8 14.7 10.8
P/E (adj.) 20.1 34.1 19.7
P/BV 1.9 1.2 1.2
OpFCF yield -2.0% 7.1% -20.4%
Dividend yield 8.3% 5.0% 5.5%
EPS (adj.) 4.10 1.32 2.29
BVPS 44.33 36.58 36.63
DPS 3.74 2.24 2.47
40
45
50
55
60
65
70
75
80
85
90
Oct 15 Nov 15 Dec 15 Jan 16 Feb 16 Mar 16 Apr 16 May 16 Jun 16 Jul 16 Aug 16 Sep 16 Oct 16 Nov 16
vvdsvdvsdy
ERICSSON Stoxx Telecom Equipment (Rebased)Source: Factset
Shareholders: Investor AB 5%; AB Industrivärden 2%;
Handelsbankens Pensionsstiftelse
0.60%;

Page 39 of 50
Produced & Distributed by the Members of ESN (see last page of this report)
Süss MicroTec
Germany/Technology Hardware & Equipment Analyser
TECHNOLOGY HARDWARE & EQUIPMENT
Süss MicroTec (Neutral) Ericsson organises a Capital Markets Day on Thursday in New York
3Q16 Review: Disappointing results – guidance confirmed
The facts: Today Süss MicroTec has published its final results for 3Q 2016. The
company will host the conference call at 9 a.m (dial in: +49 069 222 22 90 43).
Our analysis: Despite our expectations of strong order monetization, group’s
sales have increased only marginally to EUR39.1m (~2.1% yoy) however
declined by more than 5% sequentially. Süss’ profitability has also deteriorated
delivering EBIT margin of only 2.6% compared to 5.7% the year before and
virtually unchanged compared to the last quarter. Such results are significantly
below our estimates and those of a consensus, missing our market estimates by
22% for sales and 78% for EBIT. Earnings figures contain one off effect from
resignation of the CEO in the late August of EU1.8m. Adjusting for those EBIT
margin would have been around 7.2% - which however still below our
expectations.
Süss’ order inflow was also below our expectations of EUR40m generating
around EUR32.2m vs EUR39.2m in the prior quarter and year. Order inflow in
Lithography segment has seen some major deterioration falling by roughly 43%
yoy and 25% qoq with Bonder as well as Photomask Equipment recording
encouraging surge in bookings. The reason for such disappointing order bookings
in Lithography were attributed to the challenging market situation as well as the
lack of new orders for UV projection scanners from the Photonic Systems area.
Outlook 2016/17: The company has reiterated its forecast for FY16 with sales in
the range of EUR 170-180m and EBIT between EUR 9-13m vs. our estimate of
EUR 175m (15.8% yoy) and EBIT EUR 11.1m (margin 6.3%) and FactSet
consensus of EUR 189.1m (27.3% yoy) and EBIT EUR 12.3m (margin 6.5%). For
2017, Süss expects sales of around EUR 160m given slowing down of operating
activity.
For Q4 Süss expects to generate at least EUR50m in new bookings to fulfil its
borderline guidance for new orders. It also needs to generate at least EUR 60m in
sales (~12% yoy) to meet its guidance for FY2016.
Conclusion & Action: The overall performance was very disappointing with the
company didn’t manage to monetize its existing backlog. For the time being we
stick to our Neutral recommendation with the TP EUR 7.00.
Analyst(s):
Victoria Kruchevska (CFA,FRM), equinet Bank
+49 69 5 89 97 416
Neutral
6.00
closing price as of 08/11/2016
7.00
Target Price unchanged
Recommendation unchanged
Target price: EUR
Share price: EUR
Reuters/Bloomberg SMHNn.DE/SMHN GY
Market capitalisation (EURm) 115
Current N° of shares (m) 19
Free float 100%
Daily avg. no. trad. sh. 12 mth 162
Daily avg. trad. vol. 12 mth (m) 477
Price high 12 mth (EUR) 9.90
Price low 12 mth (EUR) 5.95
Abs. perf. 1 mth -8.60%
Abs. perf. 3 mth -3.95%
Abs. perf. 12 mth -15.92%
Key financials (EUR) 12/15 12/16e 12/17e
Sales (m) 149 175 160
EBITDA (m) 9 15 11
EBITDA margin 6.2% 8.7% 7.0%
EBIT (m) 5 11 7
EBIT margin 3.3% 6.3% 4.4%
Net Profit (adj.)(m) 0 7 5
ROCE 0.3% 7.5% 5.2%
Net debt/(cash) (m) (40) (40) (48)
Net Debt/Equity -0.3 -0.3 -0.4
Debt/EBITDA -4.4 -2.6 -4.2
Int. cover(EBITDA/Fin. int) 34.2 81.9 63.6
EV/Sales 0.8 0.5 0.4
EV/EBITDA 13.5 5.2 6.4
EV/EBITDA (adj.) 13.5 5.2 6.4
EV/EBIT 24.9 7.2 10.0
P/E (adj.) nm 16.2 25.4
P/BV 1.3 0.9 0.9
OpFCF yield 0.8% -0.1% 6.6%
Dividend yield 0.0% 0.0% 0.0%
EPS (adj.) 0.01 0.37 0.24
BVPS 6.21 6.58 6.82
DPS 0.00 0.00 0.00
5.5
6.0
6.5
7.0
7.5
8.0
8.5
9.0
9.5
10.0
Okt 15 Nov 15 Dez 15 Jan 16 Feb 16 Mrz 16 Apr 16 Mai 16 Jun 16 Jul 16 Aug 16 Sep 16 Okt 16 Nov 16
vvdsvdvsdy
SUESS MICROTEC Tec Dax (Rebased)Source: Factset
Shareholders:
Süss MicroTec - Review Q3 2016
EUR m Q3 2016 Q3 2015 yoy equinet Delta Cons. Delta
Revenues 39.1 38.3 2% 50.0 -22% 50.1 -22%
EBIT 1.0 2.2 -55% 4.6 -78% 4.2 -76%
EBIT Margin 2.6% 5.7% -55% 9.2% -664 BP 8.4% -583 BP
EBT 0.9 2.1 -55% 4.6 -80% 3.4 -72%
EBT Margin 2.4% 5.5% -56% 9.2% -681 BP 6.8% -439 BP
EPS -0.01 0.06 -117% 0.18 -106% 0.16 -106%
Source: Aixtron, Factset, equinet Research Source: Süss, Factset, equinet Research

Page 40 of 50
Produced & Distributed by the Members of ESN (see last page of this report)
Freenet
Germany/Telecommunications Analyser
TELECOMMUNICATIONS
Freenet (Buy) 3Q16 Review: Disappointing results – guidance confirmed
Strong results especially in its Media/TV business
The facts: Freenet (FNTN) reported excellent top and bottom line results with
revenues increasing to EUR 867m (equinet: EUR 840m and cons at EUR 843m)
on the back of strong Media Broadcast and mobile service revenue in Q3.
EBITDA rises to EUR 118m (equinet: EUR 110m and cons at EUR 109m) mainly
due to higher operational leverage on the back of higher net adds (+263k yoy and
51k qoq) and stable postpaid ARPU of EUR 21.6 (EUR +0.2 qoq, down -1%).
Increase in customers mainly driven by high margin postpaid (+197k yoy) and no
frills/discount customers (+67k yoy) while prepaid declined significantly.
As stated before, we give FNTN 12 to 18 months for its DVBT2 (Media Broadcast)
and fiber optic infrastructure (Exaring) build-up and show a valid strategy to
penetrate at least 6-7m households (approximately 3m “single source” DVB TV
households and around 3-4m additional “second source” TV HHs) and more than
23m potential fiber network households.
Our analysis: In our latest SOTP calculation, attracting around 500k HHs via new
DVBT2 contracts would result in a share price attribution of EUR 2 per share.
Net income mostly impacted by higher interest expenses due to FNTN's higher
leverage ratios in FY16 and increasing net debt to around EUR 788m (excluding
financial investment in Sunrise Communications, SRCG SW) from EUR 429m last
year.
FCF (EUR 71m) was weaker than expected (equinet: EUR 125m, cons EUR 78m)
as we assumed lower capex, lower financing costs due to realized acquisitions
and lower WC requirements by Media Broadcast
Conclusion & Action: In toto, results confirm our positive stance on FNTN
shares and retain our BUY rating as well as our target price of EUR 36 per share.
FNTN confirms its FY16 guidance of above EUR 400m in EBITDA (plus EUR 10m
from SRCG SW stake), FCF of EUR 300m (plus EUR 30m from Sunrise SRCG
stake) and dividend of EUR 1.60 per share.
Conf call @ 10am CET: dial in +49 30 232 531 508, UK +44 203 367 92 55, US +1 408 916 98 39, http://www.freenet-
group.de/investor/latest-results
Analyst(s):
Cengiz Sen, equinet Bank
+4969 58997 435
Buy
25,47
closing price as of 08/11/2016
36,00
Target Price unchanged
Recommendation unchanged
Target price: EUR
Share price: EUR
Reuters/Bloomberg FNTGn.DE/FNTN GY
Market capitalisation (EURm) 3.260
Current N° of shares (m) 128
Free float 87%
Daily avg. no. trad. sh. 12 mth 458
Daily avg. trad. vol. 12 mth (m) 8.836
Price high 12 mth (EUR) 32,45
Price low 12 mth (EUR) 22,35
Abs. perf. 1 mth 0,22%
Abs. perf. 3 mth 2,33%
Abs. perf. 12 mth -18,40%
Key financials (EUR) 12/15 12/16e 12/17e
Sales (m) 3.118 3.351 3.425
EBITDA (m) 370 426 414
EBITDA margin 11,9% 12,7% 12,1%
EBIT (m) 299 325 328
EBIT margin 9,6% 9,7% 9,6%
Net Profit (adj.)(m) 221 276 281
ROCE 14,5% 12,8% 13,3%
Net debt/(cash) (m) 369 720 588
Net Debt/Equity 0,3 0,5 0,4
Debt/EBITDA 1,0 1,7 1,4
Int. cover(EBITDA/Fin. int) 8,6 47,4 54,8
EV/Sales 1,4 1,2 1,1
EV/EBITDA 12,0 9,5 9,4
EV/EBITDA (adj.) 12,0 9,5 9,4
EV/EBIT 14,8 12,4 11,9
P/E (adj.) 18,1 11,8 11,6
P/BV 3,0 2,3 2,2
OpFCF yield 6,5% 8,1% 10,3%
Dividend yield 6,1% 6,3% 6,5%
EPS (adj.) 1,73 2,16 2,19
BVPS 10,35 10,96 11,55
DPS 1,55 1,60 1,65
22
24
26
28
30
32
34
Okt 15 Nov 15 Dez 15 Jan 16 Feb 16 Mrz 16 Apr 16 Mai 16 Jun 16 Jul 16 Aug 16 Sep 16 Okt 16 Nov 16
vvdsvdvsdy
FREENET Stoxx Telecommunications (Rebased)Source: Factset
Shareholders: Dt. Asset 5%; Allianz GI 5%; Blackrock
Inc., NY 3%;

Page 41 of 50
Produced & Distributed by the Members of ESN (see last page of this report)
OTE Hellenic Telecom
Greece/Telecommunications Analyser
TELECOMMUNICATIONS
OTE Hellenic Telecom (Buy) Strong results especially in its Media/TV business
Release of 3Q/9M16 results tomorrow before market opening
The facts: OTE will release its 3Q16 results today, before the opening of the
market. We look for revenues of EUR 980m (+0.9% y-o-y), pro-forma EBITDA of
EUR 340m (-2.8% y-o-y) and ‘clean’ net profits of EUR 68m (+0.7% y-o-y). We
note that 3Q16 profitability will be burdened by a EUR 35m cost relating to the
latest voluntary exit scheme at OTE Group. For the 9-month period of 2016, we
forecast revenues of EUR 2,863m (flat y-o-y), pro-forma EBITDA of EUR 960m (-
3.4% y-o-y) and ‘clean’ net profits of EUR 142m (-16% y-o-y).
Our Analysis: Per business unit, OTE-fixed is expected to report revenues of
EUR 390m (+3.5% y-o-y) and pro-forma EBITDA of EUR 164m (+4% y-o-y) in
3Q16 reflecting growing revenues for OTE TV and broadband, as well as cost
cutting efforts. Cosmote Greece’s revenues are seen down by 4% y-o-y at EUR
307m in the quarter, mirroring the combined effect of reduced service revenues
and handset sales, driving EBITDA at EUR 116m (-9% y-o-y). International mobile
revenues are seen up by 5% y-o-y to EUR 138m but EBITDA is expected to drop
6% y-o-y due to the dilutive effect of growing low-margin handset sales and
increased costs in Romania. Finally, we expect another weak quarter for Telekom
Romania (flat revenues, reduced EBITDA are on the back of a tough competitive
environment, while we expect a positive performance for other subsidiaries
(revenues: +4% y-o-y, EBITDA: +11% y-o-y).
3Q / 9M 2016 results: Key P&L estimates
EUR m 9M15a 9M16e IBG % YoY
Revenues 2,866 2,863 -0.1%
EBITDA adj* 995 960 -3.4%
margin 34.7% 33.5%
Net adj** 168 142 -15.5%
Source: The Company, IBG, * Excluding VRS costs, ** Excluding VRS costs and other one-offs
Conclusion & Action: On the whole, we forecast mediocre results for 3Q16
characterized by the positive performance of the Greek-fixed unit (growing
revenues and EBITDA), a soft performance for the Greek mobile business (low-
single digit drop in service revenues, reduced EBITDA) and pressure on the
profitability of the Romanian operations. A conference call will follow tomorrow at
17:00 Athens time (15:00 UK time) today. Dial: Greek participants: 00800 4413
1378, UK participants: 0800 953 0329, US participants: 1866 819 7111.
Analyst(s):
Dimitris Birbos, Investment Bank of Greece
+30 210 81 73 392
Buy
8.03
closing price as of 08/11/2016
10.60
Target Price unchanged
Recommendation unchanged
Target price: EUR
Share price: EUR
Reuters/Bloomberg OTEr.AT/HTO GA
Market capitalisation (EURm) 3,936
Current N° of shares (m) 490
Free float 50%
Daily avg. no. trad. sh. 12 mth 630
Daily avg. trad. vol. 12 mth (m) 1,639
Price high 12 mth (EUR) 9.58
Price low 12 mth (EUR) 6.75
Abs. perf. 1 mth 3.88%
Abs. perf. 3 mth -4.40%
Abs. perf. 12 mth -9.27%
Key financials (EUR) 12/15 12/16e 12/17e
Sales (m) 3,903 3,880 3,857
EBITDA (m) 1,221 1,241 1,258
EBITDA margin 31.3% 32.0% 32.6%
EBIT (m) 391 408 430
EBIT margin 10.0% 10.5% 11.1%
Net Profit (adj.)(m) 240 193 213
ROCE 9.3% 9.3% 9.9%
Net debt/(cash) (m) 860 590 302
Net Debt/Equity 0.3 0.2 0.1
Debt/EBITDA 0.7 0.5 0.2
Int. cover(EBITDA/Fin. int) 7.9 9.2 10.4
EV/Sales 1.5 1.3 1.2
EV/EBITDA 4.8 4.0 3.7
EV/EBITDA (adj.) 4.6 4.0 3.8
EV/EBIT 15.0 12.2 10.9
P/E (adj.) 18.8 20.4 18.5
P/BV 2.0 1.7 1.6
OpFCF yield 6.3% 11.4% 12.3%
Dividend yield 1.2% 1.7% 1.9%
EPS (adj.) 0.49 0.39 0.43
BVPS 4.60 4.75 4.96
DPS 0.10 0.13 0.15
6.5
7.0
7.5
8.0
8.5
9.0
9.5
10.0
Oct 15 Nov 15 Dec 15 Jan 16 Feb 16 Mar 16 Apr 16 May 16 Jun 16 Jul 16 Aug 16 Sep 16 Oct 16 Nov 16
vvdsvdvsdy
OTE Stoxx Telecommunications (Rebased)Source: Factset
Shareholders: Deutsche Telecom 40%; Greek State
10%;
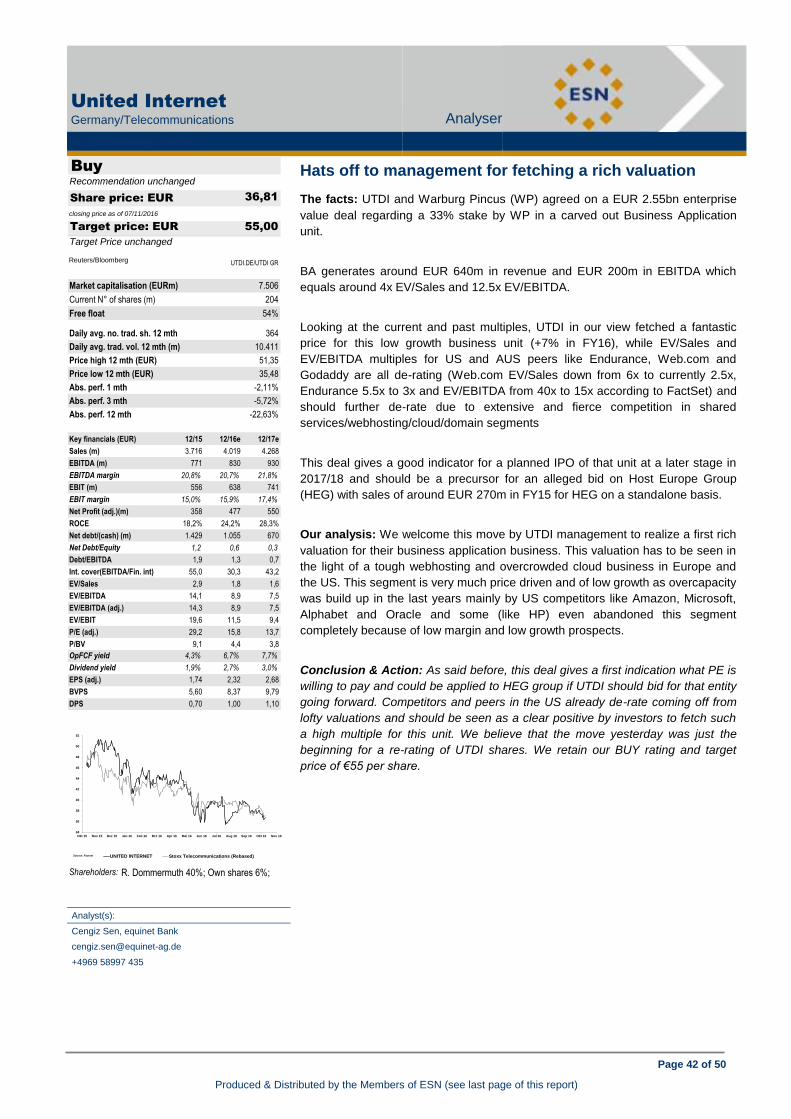
Page 42 of 50
Produced & Distributed by the Members of ESN (see last page of this report)
United Internet
Germany/Telecommunications Analyser
TELECOMMUNICATIONS
United Internet (Buy) Release of 3Q/9M16 results tomorrow before market opening
Hats off to management for fetching a rich valuation
The facts: UTDI and Warburg Pincus (WP) agreed on a EUR 2.55bn enterprise
value deal regarding a 33% stake by WP in a carved out Business Application
unit.
BA generates around EUR 640m in revenue and EUR 200m in EBITDA which
equals around 4x EV/Sales and 12.5x EV/EBITDA.
Looking at the current and past multiples, UTDI in our view fetched a fantastic
price for this low growth business unit (+7% in FY16), while EV/Sales and
EV/EBITDA multiples for US and AUS peers like Endurance, Web.com and
Godaddy are all de-rating (Web.com EV/Sales down from 6x to currently 2.5x,
Endurance 5.5x to 3x and EV/EBITDA from 40x to 15x according to FactSet) and
should further de-rate due to extensive and fierce competition in shared
services/webhosting/cloud/domain segments
This deal gives a good indicator for a planned IPO of that unit at a later stage in
2017/18 and should be a precursor for an alleged bid on Host Europe Group
(HEG) with sales of around EUR 270m in FY15 for HEG on a standalone basis.
Our analysis: We welcome this move by UTDI management to realize a first rich
valuation for their business application business. This valuation has to be seen in
the light of a tough webhosting and overcrowded cloud business in Europe and
the US. This segment is very much price driven and of low growth as overcapacity
was build up in the last years mainly by US competitors like Amazon, Microsoft,
Alphabet and Oracle and some (like HP) even abandoned this segment
completely because of low margin and low growth prospects.
Conclusion & Action: As said before, this deal gives a first indication what PE is
willing to pay and could be applied to HEG group if UTDI should bid for that entity
going forward. Competitors and peers in the US already de-rate coming off from
lofty valuations and should be seen as a clear positive by investors to fetch such
a high multiple for this unit. We believe that the move yesterday was just the
beginning for a re-rating of UTDI shares. We retain our BUY rating and target
price of €55 per share.
Analyst(s):
Cengiz Sen, equinet Bank
+4969 58997 435
Buy
36,81
closing price as of 07/11/2016
55,00
Target Price unchanged
Recommendation unchanged
Target price: EUR
Share price: EUR
Reuters/Bloomberg UTDI.DE/UTDI GR
Market capitalisation (EURm) 7.506
Current N° of shares (m) 204
Free float 54%
Daily avg. no. trad. sh. 12 mth 364
Daily avg. trad. vol. 12 mth (m) 10.411
Price high 12 mth (EUR) 51,35
Price low 12 mth (EUR) 35,48
Abs. perf. 1 mth -2,11%
Abs. perf. 3 mth -5,72%
Abs. perf. 12 mth -22,63%
Key financials (EUR) 12/15 12/16e 12/17e
Sales (m) 3.716 4.019 4.268
EBITDA (m) 771 830 930
EBITDA margin 20,8% 20,7% 21,8%
EBIT (m) 556 638 741
EBIT margin 15,0% 15,9% 17,4%
Net Profit (adj.)(m) 358 477 550
ROCE 18,2% 24,2% 28,3%
Net debt/(cash) (m) 1.429 1.055 670
Net Debt/Equity 1,2 0,6 0,3
Debt/EBITDA 1,9 1,3 0,7
Int. cover(EBITDA/Fin. int) 55,0 30,3 43,2
EV/Sales 2,9 1,8 1,6
EV/EBITDA 14,1 8,9 7,5
EV/EBITDA (adj.) 14,3 8,9 7,5
EV/EBIT 19,6 11,5 9,4
P/E (adj.) 29,2 15,8 13,7
P/BV 9,1 4,4 3,8
OpFCF yield 4,3% 6,7% 7,7%
Dividend yield 1,9% 2,7% 3,0%
EPS (adj.) 1,74 2,32 2,68
BVPS 5,60 8,37 9,79
DPS 0,70 1,00 1,10
34
36
38
40
42
44
46
48
50
52
Okt 15 Nov 15 Dez 15 Jan 16 Feb 16 Mrz 16 Apr 16 Mai 16 Jun 16 Jul 16 Aug 16 Sep 16 Okt 16 Nov 16
vvdsvdvsdy
UNITED INTERNET Stoxx Telecommunications (Rebased)Source: Factset
Shareholders: R. Dommermuth 40%; Own shares 6%;
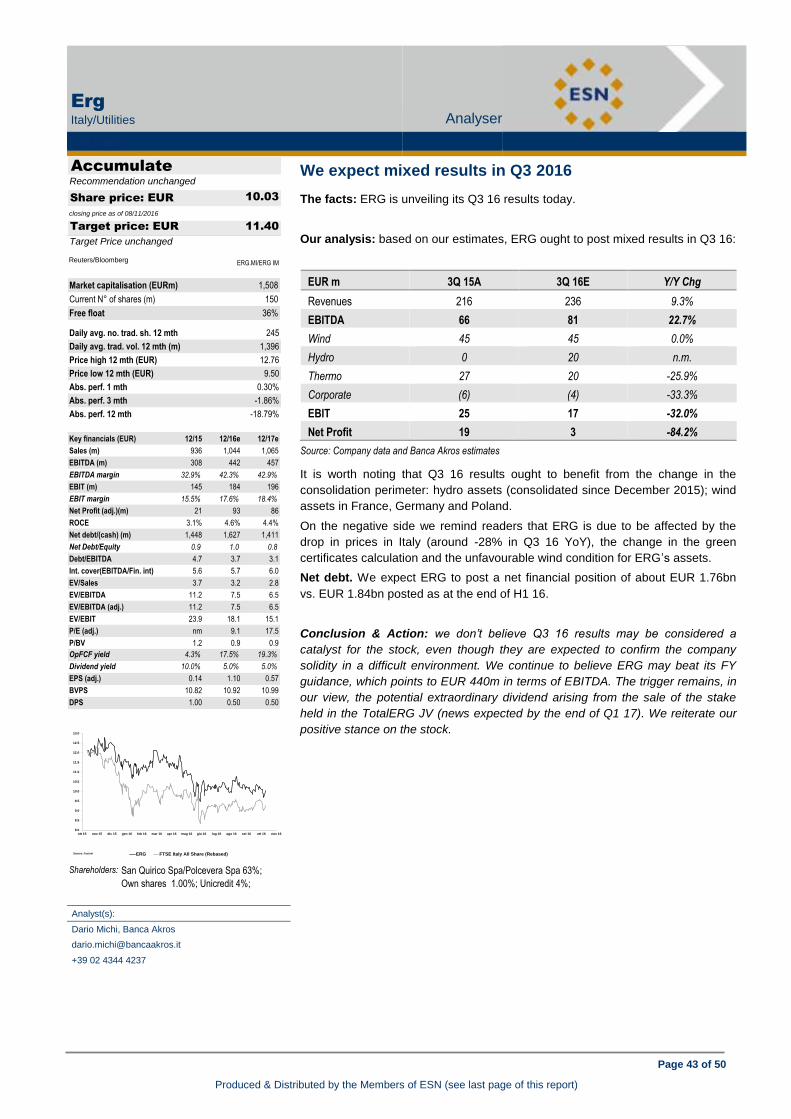
Page 43 of 50
Produced & Distributed by the Members of ESN (see last page of this report)
Erg
Italy/Utilities Analyser
UTILITIES
Erg (Accumulate) Hats off to management for fetching a rich valuation
We expect mixed results in Q3 2016
The facts: ERG is unveiling its Q3 16 results today.
Our analysis: based on our estimates, ERG ought to post mixed results in Q3 16:
EUR m 3Q 15A 3Q 16E Y/Y Chg
Revenues 216 236 9.3%
EBITDA 66 81 22.7%
Wind 45 45 0.0%
Hydro 0 20 n.m.
Thermo 27 20 -25.9%
Corporate (6) (4) -33.3%
EBIT 25 17 -32.0%
Net Profit 19 3 -84.2%
Source: Company data and Banca Akros estimates
It is worth noting that Q3 16 results ought to benefit from the change in the
consolidation perimeter: hydro assets (consolidated since December 2015); wind
assets in France, Germany and Poland.
On the negative side we remind readers that ERG is due to be affected by the
drop in prices in Italy (around -28% in Q3 16 YoY), the change in the green
certificates calculation and the unfavourable wind condition for ERG’s assets.
Net debt. We expect ERG to post a net financial position of about EUR 1.76bn
vs. EUR 1.84bn posted as at the end of H1 16.
Conclusion & Action: we don’t believe Q3 16 results may be considered a
catalyst for the stock, even though they are expected to confirm the company
solidity in a difficult environment. We continue to believe ERG may beat its FY
guidance, which points to EUR 440m in terms of EBITDA. The trigger remains, in
our view, the potential extraordinary dividend arising from the sale of the stake
held in the TotalERG JV (news expected by the end of Q1 17). We reiterate our
positive stance on the stock.
Analyst(s):
Dario Michi, Banca Akros
+39 02 4344 4237
Accumulate
10.03
closing price as of 08/11/2016
11.40
Target Price unchanged
Recommendation unchanged
Target price: EUR
Share price: EUR
Reuters/Bloomberg ERG.MI/ERG IM
Market capitalisation (EURm) 1,508
Current N° of shares (m) 150
Free float 36%
Daily avg. no. trad. sh. 12 mth 245
Daily avg. trad. vol. 12 mth (m) 1,396
Price high 12 mth (EUR) 12.76
Price low 12 mth (EUR) 9.50
Abs. perf. 1 mth 0.30%
Abs. perf. 3 mth -1.86%
Abs. perf. 12 mth -18.79%
Key financials (EUR) 12/15 12/16e 12/17e
Sales (m) 936 1,044 1,065
EBITDA (m) 308 442 457
EBITDA margin 32.9% 42.3% 42.9%
EBIT (m) 145 184 196
EBIT margin 15.5% 17.6% 18.4%
Net Profit (adj.)(m) 21 93 86
ROCE 3.1% 4.6% 4.4%
Net debt/(cash) (m) 1,448 1,627 1,411
Net Debt/Equity 0.9 1.0 0.8
Debt/EBITDA 4.7 3.7 3.1
Int. cover(EBITDA/Fin. int) 5.6 5.7 6.0
EV/Sales 3.7 3.2 2.8
EV/EBITDA 11.2 7.5 6.5
EV/EBITDA (adj.) 11.2 7.5 6.5
EV/EBIT 23.9 18.1 15.1
P/E (adj.) nm 9.1 17.5
P/BV 1.2 0.9 0.9
OpFCF yield 4.3% 17.5% 19.3%
Dividend yield 10.0% 5.0% 5.0%
EPS (adj.) 0.14 1.10 0.57
BVPS 10.82 10.92 10.99
DPS 1.00 0.50 0.50
8.0
8.5
9.0
9.5
10.0
10.5
11.0
11.5
12.0
12.5
13.0
ott 15 nov 15 dic 15 gen 16 feb 16 mar 16 apr 16 mag 16 giu 16 lug 16 ago 16 set 16 ott 16 nov 16
vvdsvdvsdy
ERG FTSE Italy All Share (Rebased)Source: Factset
Shareholders: San Quirico Spa/Polcevera Spa 63%;
Own shares 1.00%; Unicredit 4%;

Page 44 of 50
Produced & Distributed by the Members of ESN (see last page of this report)
Hera
Italy/Utilities Analyser
UTILITIES
Hera (Buy) We expect mixed results in Q3 2016
Efficiencies and M&A ought to sustain 9M 2016 results
The facts: Hera is unveiling its 9M 16 results today.
Our analysis: the company ought to post almost flat results in 9M 2016 YoY:
EUR m 9M 15A 9M 16E Chg
Sales 3,246 3,345 3.1%
EBITDA 640 649 1.4%
Electricity 75 103 37.3%
Gas 204 187 -8.3%
Water Cycle Management 175 174 -0.6%
Waste Management 173 172 -0.6%
Other businesses 13 13 0.0%
EBIT 317 326 2.8%
Pre-tax Profit 218 236 8.3%
Net Profit 125 141 12.8%
Source: Company data and Banca Akros estimates
Results are due to be affected by the regulatory review in the gas, water and
electricity distribution sectors. We expect the impact in the range of EUR 19m at
an EBITDA level in 9M 16 or around EUR 25m on a yearly basis. This negative is
expected to be offset by the efficiency programme the company is successfully
carrying on and by the M&A deals performed in 2015 (we expect an EBITDA
contribution of roughly EUR 13m in 9M 16).
In 9M 2016, electricity division performance was affected by: lower prices (PUN
ca -27% YoY) and electricity demand (ca -3% YoY). On the positive we mention
the higher volumes sold due to the enlarged customer base and the efficiency
programme the company is successfully carrying on, which more than offset the
negative scenario. Furthermore, still on the positive side, it is worth noting that the
company is due to benefit from a one-off of ca. EUR 14m related to the regulatory
delibera AEEGSI 654/2015, which eliminated the so called “regulatory lag”.
Gas. Hera is expected to post decreasing results mainly as a consequence of the
negative impact of the regulatory review. This ought to be partially offset by cost
cutting and thus higher efficiencies.
In the water division, Hera ought to benefit from the increase in tariffs already
agreed with the reference ATOs and by the efficiency programmes the company
is successfully carrying on, which offset the regulatory review. On the negative
side, the company was hit by the WACC revision (estimated impact around EUR
15m).
Waste. Hera was hit by the lack of landfills availability, which reduced the unitary
margins for the volumes treated (this effect ought to be partially reabsorbed
during the year). Overall, special waste volumes ought to be up by circa 20%
YoY, while we expect urban waste volumes almost flat YoY.
Net profit is due to benefit from slightly lower tax rate (we expect nearly 36% vs.
38% in 9M 15) and from lower financial charges (interest rate dynamic; the cost of
debt was around 3.7%), we estimate roughly EUR 98m vs. 105m in 9M 15.
Net debt ought to be ca. EUR 2.6bn, almost flat vs. the level recorded as at the
end of H1 16 and roughly EUR 2.65bn as at the end of 2015.
Conclusion & Action: the company’s business mix is due to protect from turmoil
related to the economic environment and from negative one-offs (regulatory
review in the distribution and the landfill availability). The sound results expected
and the still present trigger related to the M&A, which we expect to materialise
soon, are strengthening our positive stance on the stock. BUY.
Analyst(s):
Dario Michi, Banca Akros
+39 02 4344 4237
Buy
2.16
closing price as of 08/11/2016
2.80
Target Price unchanged
Recommendation unchanged
Target price: EUR
Share price: EUR
Reuters/Bloomberg HRA.MI/HER IM
Market capitalisation (EURm) 3,172
Current N° of shares (m) 1,470
Free float 48%
Daily avg. no. trad. sh. 12 mth 1,811
Daily avg. trad. vol. 12 mth (m) 4,649
Price high 12 mth (EUR) 2.66
Price low 12 mth (EUR) 2.16
Abs. perf. 1 mth -1.01%
Abs. perf. 3 mth -14.64%
Abs. perf. 12 mth -10.90%
Key financials (EUR) 12/15 12/16e 12/17e
Sales (m) 4,818 4,838 4,905
EBITDA (m) 884 888 941
EBITDA margin 18.4% 18.4% 19.2%
EBIT (m) 442 462 494
EBIT margin 9.2% 9.6% 10.1%
Net Profit (adj.)(m) 181 188 206
ROCE 4.9% 5.1% 5.3%
Net debt/(cash) (m) 2,652 2,714 2,738
Net Debt/Equity 1.1 1.1 1.0
Debt/EBITDA 3.0 3.1 2.9
Int. cover(EBITDA/Fin. int) 7.0 6.6 6.9
EV/Sales 1.3 1.2 1.2
EV/EBITDA 6.9 6.4 6.1
EV/EBITDA (adj.) 6.9 6.4 6.1
EV/EBIT 13.8 12.4 11.6
P/E (adj.) 20.0 16.9 15.4
P/BV 1.5 1.3 1.3
OpFCF yield 3.5% 2.5% 3.7%
Dividend yield 4.2% 4.2% 4.2%
EPS (adj.) 0.12 0.13 0.14
BVPS 1.60 1.64 1.69
DPS 0.09 0.09 0.09
Shareholders: Romagna Provinces 21%; Bologna
Provinces 21%; Modena Procinces 14%;

Page 45 of 50
Produced & Distributed by the Members of ESN (see last page of this report)
European Coverage of the Members of ESN
A ero space & D efense M em(*) Bcp CBI Kemira OPG Corbion NIBC
Airbus Group CIC Bnp Paribas CIC Linde EQB Danone CIC
Dassault Aviation CIC Bper BAK Tikkurila OPG Ebro Foods GVC
Latecoere CIC Bpi CBIElectro nic & Electrical
EquipmentM em(*) Enervit BAK
Leonardo BAK Caixabank GVC Alstom CIC Fleury M ichon CIC
Lisi CIC Commerzbank EQB Areva CIC Forfarmers NIBC
M tu EQB Credem BAK Euromicron Ag EQB Heineken NIBC
Ohb Se EQB Credit Agrico le Sa CIC Kontron EQB Hkscan OPG
Safran CIC Creval BAK Legrand CIC La Doria BAK
Thales CIC Deutsche Bank EQB Neways Electronics NIBC Lanson-Bcc CIC
Zodiac Aerospace CIC Deutsche Pfandbriefbank EQB Nexans CIC Laurent Perrier CIC
A irlines M em(*) Eurobank IBG Pkc Group OPG Ldc CIC
Air France Klm CIC Ing Group NIBC Rexel CIC Naturex CIC
Finnair OPG Intesa Sanpaolo BAK Schneider Electric Se CIC Olvi OPG
Lufthansa EQB M ediobanca BAK Vaisala OPG Parmalat BAK
A uto mo biles & P arts M em(*) M erkur Bank EQB Viscom EQB Pernod Ricard CIC
Bittium Corporation OPG National Bank Of Greece IBG F inancial Services M em(*) Raisio OPG
Bmw EQB Natixis CIC Anima BAK Refresco Group NIBC
Brembo BAK Nordea OPG Athex Group IBG Remy Cointreau CIC
Continental EQB Piraeus Bank IBG Azimut BAK Vidrala GVC
Daimler Ag EQB Poste Italiane BAK Banca Generali BAK Vilmorin CIC
Elringklinger EQB Societe Generale CIC Banca Ifis BAK Viscofan GVC
Faurecia CIC Ubi Banca BAK Banca Sistema BAK Vranken Pommery M onopole CIC
Ferrari BAK Unicredit BAK Bb Biotech EQB Wessanen NIBC
Fiat Chrysler Automobiles BAK B asic R eso urces M em(*) Binckbank NIBC F o o d & D rug R etailers M em(*)
Landi Renzo BAK Acerinox GVC Bolsas Y M ercados Espanoles Sa GVC Ahold NIBC
Leoni EQB Altri CBI Capman OPG Carrefour CIC
M ichelin CIC Arcelormittal GVC Christian Dior CIC Casino Guichard-Perrachon CIC
Nokian Tyres OPG Corticeira Amorim CBI Cir BAK Dia GVC
Norma Group EQB Ence GVC Comdirect EQB Jeronimo M artins CBI
Piaggio BAK Europac GVC Corp. Financiera Alba GVC Kesko OPG
Plastic Omnium CIC M etka IBG Deutsche Boerse EQB M arr BAK
Sogefi BAK M etsä Board OPG Deutsche Forfait EQB M etro CIC
Stern Groep NIBC M ytilineos IBG Eq OPG Sligro NIBC
Valeo CIC Outokumpu OPG Euronext CIC Sonae CBI
Volkswagen EQB Semapa CBI Ferratum EQB General Industria ls M em(*)
B anks M em(*) Ssab OPG Finecobank BAK 2G Energy EQB
Aareal Bank EQB Stora Enso OPG Grenke EQB Aalberts NIBC
Abn Amro Group Nv NIBC Surteco EQB Hypoport Ag EQB Accell Group NIBC
Aktia OPG The Navigator Company CBI M lp EQB Ahlstrom OPG
Alpha Bank IBG Tubacex GVC Ovb Holding Ag EQB Arcadis NIBC
Banca Carige BAK Upm-Kymmene OPG Patrizia Ag EQB Aspo OPG
Banca M ps BAK B io techno lo gy M em(*) Rallye CIC Huhtamäki OPG
Banco Popolare BAK 4Sc EQB Unipol Gruppo Finanziario BAK Kendrion NIBC
Banco Popular GVC Cytotools Ag EQB F o o d & B everage M em(*) Nedap NIBC
Banco Sabadell GVC Epigenomics Ag EQB Acomo NIBC Pöyry OPG
Banco Santander GVC Wilex EQB Atria OPG Prelios BAK
Bankia GVC C hemicals M em(*) Bonduelle CIC Rubis CIC
Bankinter GVC Air Liquide CIC Campari BAK Saf-Holland EQB
Bbva GVC Holland Colours NIBC Coca Cola Hbc Ag IBG Serge Ferrari Group CIC

Page 46 of 50
Produced & Distributed by the Members of ESN (see last page of this report)
Siegfried Holding Ag EQB H o useho ld Go o ds M em(*) Axa CIC Thermador Groupe CIC
Tkh Group NIBC Bic CIC Banca M edio lanum BAK Titan Cement IBG
Wendel CIC De Longhi BAK Catto lica Assicurazioni BAK Trevi BAK
General R etailers M em(*) Fila BAK Delta Lloyd NIBC Uponor OPG
Banzai BAK Osram Licht Ag EQB Generali BAK Vicat CIC
Beter Bed Holding NIBC Seb Sa CIC Hannover Re EQB Vinci CIC
Elumeo Se EQB Zumtobel Group Ag EQB M apfre Sa GVC Yit OPG
Fielmann EQB Industria l Engineering M em(*) M unich Re EQB M edia M em(*)
Folli Fo llie Group IBG Accsys Technologies NIBC Nn Group Nv NIBC Ad Pepper EQB
Fourlis Holdings IBG Aixtron EQB Sampo OPG Alma M edia OPG
Groupe Fnac Sa CIC Ansaldo Sts BAK Talanx Group EQB Atresmedia GVC
Inditex GVC Biesse BAK Unipolsai BAK Axel Springer EQB
Jumbo IBG Cargotec Corp OPGM aterials, C o nstruct io n &
InfrastructureM em(*) Brill NIBC
M acintosh NIBC Cnh Industrial BAK Abertis GVC Cofina CBI
Rapala OPG Danieli BAK Acs GVC Cts Eventim EQB
Stockmann OPG Datalogic BAK Aena GVC Editoriale L'Espresso BAK
Yoox Net-A-Porter BAK Deutz Ag EQB Aeroports De Paris CIC Gl Events CIC
H ealthcare M em(*) Dmg M ori Seiki Ag EQB Astaldi BAK Havas CIC
Amplifon BAK Duro Felguera GVC Atlantia BAK Impresa CBI
Bayer EQB Emak BAK Bilfinger Se EQB Ipsos CIC
Biotest EQB Exel Composites OPG Boskalis Westminster NIBC Jcdecaux CIC
Diasorin BAK Gesco EQB Buzzi Unicem BAK Lagardere CIC
Fresenius EQB Ima BAK Caverion OPG M 6-M etropole Television CIC
Fresenius M edical Care EQB Interpump BAK Cramo OPG M ediaset BAK
Gerresheimer Ag EQB Kone OPG Eiffage CIC M ediaset Espana GVC
Korian CIC Konecranes OPG Ellaktor IBG Notorious Pictures BAK
M erck EQB Kuka EQB Eltel OPG Nrj Group CIC
Orio la-Kd OPG M anz Ag EQB Ezentis GVC Publicis CIC
Orion OPG M ax Automation Ag EQB Fcc GVC Rcs M ediagroup BAK
Orpea CIC M etso OPG Ferrovial GVC Relx NIBC
Pihlajalinna OPG Outotec OPG Fraport EQB Rtl Group EQB
Recordati BAK Pfeiffer Vacuum EQB Heidelberg Cement Ag CIC Sanoma OPG
Rhoen-Klinikum EQB Ponsse OPG Heijmans NIBC Solocal Group CIC
H o tels, T ravel & T o urism M em(*) Prima Industrie BAK Hochtief EQB Spir Communication CIC
Accor CIC Prysmian BAK Imerys CIC Syzygy Ag EQB
Autogrill BAK Smt Scharf Ag EQB Italcementi BAK Telegraaf M edia Groep NIBC
Beneteau CIC Technotrans EQB Lafargeholcim CIC Teleperformance CIC
Elior CIC Valmet OPG Lehto OPG Tf1 CIC
Europcar CIC Wärtsilä OPG Lemminkäinen OPG Ubisoft CIC
I Grandi Viaggi BAK Zardoya Otis GVC M aire Tecnimont BAK Vivendi CIC
Iberso l CBI Industria l T ranspo rtat io n M em(*) M ota Engil CBI Wolters Kluwer NIBC
Intralo t IBG Bollore CIC Obrascon Huarte Lain GVC Oil & Gas P ro ducers M em(*)
Kotipizza OPG Caf GVC Ramirent OPG Eni BAK
M elia Hotels International GVC Ctt CBI Royal Bam Group NIBC Galp Energia CBI
Nh Hotel Group GVC Deutsche Post EQB Sacyr GVC Gas Plus BAK
Opap IBG Hhla EQB Saint Gobain CIC Hellenic Petro leum IBG
Snowworld NIBC Logwin EQB Salini Impregilo BAK M aurel Et Prom CIC
Sodexo CIC Insurance M em(*) Sias BAK M otor Oil IBG
Sonae Capital CBI Aegon NIBC Sonae Industria CBI Neste Corporation OPG
Trigano CIC Allianz EQB Srv OPG Petrobras CBI

Page 47 of 50
Produced & Distributed by the Members of ESN (see last page of this report)
Qgep CBI Wcm Ag EQB Enav BAK Falck Renewables BAK
Repsol GVC R enewable Energy M em(*) Fiera M ilano BAK Fortum OPG
Total CIC Daldrup & Soehne EQB Lassila & Tikanoja OPG Gas Natural Fenosa GVC
Oil Services M em(*) Gamesa GVC Openjobmetis BAK Hera BAK
Bourbon CIC So ftware & C o mputer Services M em(*)T echno lo gy H ardware &
EquipmentM em(*)Iberdro la GVC
Cgg CIC Affecto OPG Asm International NIBC Iren BAK
Fugro NIBC Akka Technologies CIC Asml NIBC Public Power Corp IBG
Saipem BAK Alten CIC Besi NIBC Red Electrica De Espana GVC
Sbm Offshore NIBC Altran CIC Elmos Semiconductor EQB Ren CBI
Technip CIC Amadeus GVC Ericsson OPG Snam BAK
Tecnicas Reunidas GVC Assystem CIC Gemalto CIC Terna BAK
Tenaris BAK Atos CIC Gigaset EQB
Vallourec CIC Basware OPG Ingenico CIC
Vopak NIBC Cenit EQB Nokia OPG
P erso nal Go o ds M em(*) Comptel OPG Roodmicrotec NIBC
Adidas EQB Ctac NIBC Slm Solutions EQB
Adler M odemaerkte EQB Digia OPG Stmicroelectronics BAK
Amer Sports OPG Docdata NIBC Suess M icrotec EQB
Basic Net BAK Econocom CIC Teleste OPG
Cie Fin. Richemont CIC Ekinops CIC T eleco mmunicat io ns M em(*)
Geox BAK Esi Group CIC Acotel BAK
Gerry Weber EQB Exprivia BAK Deutsche Telekom EQB
Hermes Intl. CIC F-Secure OPG Drillisch EQB
Hugo Boss EQB Gft Technologies EQB Elisa OPG
Interparfums CIC Ict Group NIBC Euskaltel GVC
Kering CIC Indra Sistemas GVC Freenet EQB
L'Oreal CIC Nemetschek Se EQB Kpn Telecom NIBC
Luxottica BAK Neurones CIC M asmovil GVC
Lvmh CIC Nexus Ag EQB Nos CBI
M arimekko OPG Novabase CBI Oi CBI
M oncler BAK Ordina NIBC Ote IBG
Puma EQB Psi EQB Tele Columbus EQB
Safilo BAK Reply BAK Telecom Italia BAK
Salvatore Ferragamo BAK Rib Software EQB Telefonica GVC
Sarantis IBG Seven Principles Ag EQB Telia OPG
Technogym BAK Software Ag EQB Tiscali BAK
Tod'S BAK Sopra Steria Group CIC United Internet EQB
R eal Estate M em(*) Tie Kinetix NIBC Vodafone BAK
Adler Real Estate EQB Tieto OPG Utilit ies M em(*)
Beni Stabili BAK Tomtom NIBC A2A BAK
Citycon OPG Visiativ CIC Acciona GVC
Deutsche Euroshop EQB Wincor Nixdorf EQB Acea BAK
Grand City Properties EQB Suppo rt Services M em(*) Albioma CIC
Hispania Activos Inmobiliarios GVC Asiakastieto Group OPG Direct Energie CIC
Igd BAK Batenburg NIBC Edp CBI
Lar España GVC Bureau Veritas S.A. CIC Edp Renováveis CBI
Realia GVC Cellnex Telecom GVC Enagas GVC
Sponda OPG Dpa NIBC Endesa GVC
Technopolis OPG Edenred CIC Enel BAK
Vib Vermoegen EQB Ei Towers BAK Eydap IBG
LEGEND: BAK: Banca Akros; CIC: CM CIC Market Solutions; CBI: Caixa-Banca de Investimento; GVC: GVC Gaesco Beksa, SV, SA; EQB: Equinet bank; IBG: Investment Bank of
Greece, NIBC: NIBC Markets N.V: OPG: OP Corporate Bank:; as of 1st September 2016

Page 48 of 50
Produced & Distributed by the Members of ESN (see last page of this report)
List of ESN Analysts (**)
Ari Agopyan CIC +33 1 53 48 80 63 [email protected] Victoria Kruchevska (CFA,FRM) EQB +49 69 5 89 97 416 [email protected]
Artur Amaro CBI +351 213 89 6822 [email protected] Jean-Christophe Lefèvre-Moulenq CIC +33 1 53 48 80 65 [email protected]
Helena Barbosa CBI +351 21 389 6831 [email protected] Konstantinos Manolopoulos IBG +30 210 817 3388 [email protected]
Javier Bernat GVC +34 91 436 7816 jav [email protected] Dario Michi BAK +39 02 4344 4237 [email protected]
Dimitris Birbos IBG +30 210 81 73 392 [email protected] Marietta Miemietz CFA EQB +49-69-58997-439 [email protected]
Agnès Blazy CIC +33 1 53 48 80 67 [email protected] José Mota Freitas, CFA CBI +351 22 607 09 31 [email protected]
Charles Edouard Boissy CIC +33 01 53 48 80 81 [email protected] Henri Parkkinen OPG +358 10 252 4409 [email protected]
Rafael Bonardell GVC +34 91 436 78 171 [email protected] Victor Peiro Pérez GVC +34 91 436 7812 [email protected]
Louise Boyer CIC +33 1 53 48 80 68 [email protected] Francis Prêtre CIC +33 4 78 92 02 30 [email protected]
Giada Cabrino, CIIA BAK +39 02 4344 4092 [email protected] Francesco Previtera BAK +39 02 4344 4033 francesco.prev [email protected]
Arnaud Cadart CIC +33 1 53 48 80 86 [email protected] Jari Raisanen OPG +358 10 252 4504 [email protected]
Niclas Catani OPG +358 10 252 8780 [email protected] Hannu Rauhala OPG +358 10 252 4392 [email protected]
Pierre Chedeville CIC +33 1 53 48 80 97 [email protected] Matias Rautionmaa OPG +358 10 252 4408 [email protected]
Emmanuel Chevalier CIC +33 1 53 48 80 72 [email protected] Eric Ravary CIC +33 1 53 48 80 71 [email protected]
David Consalvo CIC +33 1 53 48 80 64 [email protected] Iñigo Recio Pascual GVC +34 91 436 7814 [email protected]
Edwin de Jong NIBC +312 0 5508569 [email protected] Gerard Rijk NIBC + 31 (0)20 550 8572 [email protected]
Martijn den Drijver NIBC +312 0 5508636 [email protected] André Rodrigues CBI +351 21 389 68 39 [email protected]
Christian Devismes CIC +33 1 53 48 80 85 [email protected] Jean-Luc Romain CIC +33 1 53 48 80 66 [email protected]
Andrea Devita, CFA BAK +39 02 4344 4031 [email protected] Jochen Rothenbacher, CEFA EQB +49 69 58997 415 [email protected]
Sebastian Droste EQB +49 69 58 99 74 34 [email protected] Vassilis Roumantzis IBG +30 2108173394 [email protected]
Enrico Esposti, CIIA BAK +39 02 4344 4022 [email protected] Sonia Ruiz De Garibay GVC +34 91 436 7841 [email protected]
Rafael Fernández de Heredia GVC +34 91 436 78 08 [email protected] Antti Saari OPG +358 10 252 4359 [email protected]
Enrico Filippi, CEFA BAK +39 02 4344 4071 [email protected] Paola Saglietti BAK +39 02 4344 4287 [email protected]
Gabriele Gambarova BAK +39 02 43 444 289 [email protected] Francesco Sala BAK +39 02 4344 4240 [email protected]
Eduardo Garcia Arguelles GVC +34 914 367 810 [email protected] Holger Schmidt, CEFA EQB +49 69 58 99 74 32 [email protected]
Alexandre Gérard CIC +33 1 53 48 80 93 [email protected] Cengiz Sen EQB +4969 58997 435 [email protected]
Philipp Häßler, CFA EQB +49 69 58997 414 [email protected] Pekka Spolander OPG +358 10 252 4351 [email protected]
Simon Heilmann EQB +49 69 58 997 413 [email protected] Kimmo Stenvall OPG +358 10 252 4561 [email protected]
Dr. Knud Hinkel EQB + 49 69 58997 419 [email protected] Natalia Svyrou-Svyriadi IBG +30 210 81 73 384 [email protected]
Marcell Houben NIBC +31 20 550 8649 [email protected] Luigi Tramontana BAK +39 02 4344 4239 [email protected]
Carlos Jesus CBI +351 21 389 6812 [email protected] Johan van den Hooven NIBC +312 0 5508518 [email protected]
Mark Josefson EQB +4969-58997-437 [email protected] Kévin Woringer CIC +33 1 53 48 80 69 [email protected]
(**) excluding: strategists, macroeconomists, heads of research not covering specific stocks, credit analysts, technical analysts

Page 49 of 50
Produced & Distributed by the Members of ESN (see last page of this report)
ESN Recommendation System The ESN Recommendation System is Absolute. It means that each stock is rated on the basis of
a total return, measured by the upside potential (including dividends and capital reimbursement)
over a 12 month time horizon.
The ESN spectrum of recommendations (or ratings) for each stock comprises 5 categories: Buy
(B), Accumulate (A), Neutral (N), Reduce (R) and Sell (S).
Furthermore, in specific cases and for a limited period of time, the analysts are allowed to rate the
stocks as Rating Suspended (RS) or Not Rated (NR), as explained below.
Meaning of each recommendation or rating:
Buy: the stock is expected to generate total return of over 15% during the next 12 months time horizon
Accumulate: the stock is expected to generate total return of 5% to 15% during the next 12 months time horizon
Neutral: the stock is expected to generate total return of -5% to +5% during the next 12 months time horizon
Reduce: the stock is expected to generate total return of -5% to -15% during the next 12 months time horizon
Sell: the stock is expected to generate total return under -15% during the next 12 months time horizon
Rating Suspended: the rating is suspended due to a change of analyst covering the stock or a capital operation (take-over bid, SPO, …) where the issuer of the document (a partner of ESN) or a related party of the issuer is or could be involved
Not Rated: there is no rating for a company being floated (IPO) by the issuer of the document (a partner of ESN) or a related party of the issuer
Certain flexibility on the limits of total return bands is permitted especially during higher phases of volatility on the markets
ESN Ratings Breakdown
Date and time of production: 9th November 2016 9 :09am CET First date and time of dissemination: 9th November 2016 9 :11am CET
Disclaimer: These reports have been prepared and issued by the Members of
European Securities Network LLP (‘ESN’). ESN, its Members and their
affiliates (and any director, officer or employee thereof), are neither liable
for the proper and complete transmission of these reports nor for any
delay in their receipt. Any unauthorised use, disclosure, copying,
distribution, or taking of any action in reliance on these reports is strictly
prohibited. The views and expressions in the reports are expressions of
opinion and are given in good faith, but are subject to change without
notice. These reports may not be reproduced in whole or in part or passed
to third parties without permission. The information herein was obtained
from various sources. ESN, its Members and their affiliates (and any
director, officer or employee thereof) do not guarantee their accuracy or
completeness, and neither ESN, nor its Members, nor its Members’
affiliates (nor any director, officer or employee thereof) shall be liable in
respect of any errors or omissions or for any losses or consequential
losses arising from such errors or omissions. Neither the information
contained in these reports nor any opinion expressed constitutes an offer,
or an invitation to make an offer, to buy or sell any securities or any
options, futures or other derivatives related to such securities (‘related
investments’). These reports are prepared for the clients of the Members
of ESN only. They do not have regard to the specific investment
objectives, financial situation and the particular needs of any specific
person who may receive any of these reports. Investors should seek
financial advice regarding the appropriateness of investing in any
securities or investment strategies discussed or recommended in these
reports and should understand that statements regarding future prospects
may not be realised. Investors should note that income from such
securities, if any, may fluctuate and that each security’s price or value may
rise or fall. Accordingly, investors may receive back less than originally
invested. Past performance is not necessarily a guide to future
performance. Foreign currency rates of exchange may adversely affect the
value, price or income of any security or related investment mentioned in
these reports. In addition, investors in securities such as ADRs, whose
value are influenced by the currency of the underlying security, effectively
assume currency risk. ESN, its Members and their affiliates may submit a
pre-publication draft (without mentioning neither the recommendation nor
the target price/fair value) of its reports for review to the Investor Relations
Department of the issuer forming the subject of the report, solely for the
purpose of correcting any inadvertent material inaccuracies. Like all
members employees, analysts receive compensation that is impacted by
overall firm profitability For further details about the analyst certification,
the specific risks of the company and about the valuation methods used to
determine the price targets included in this report/note, please refer to the
specific disclaimer pages prepared by the ESN Members. In the case of a
short note please refer to the latest relevant published research on single
stock or contact the analyst named on the front of the report/note for
detailed information on the valuation methods, earning estimates and
risks. A full description of all the organisational and administrative
measures taken by the Members of ESN to manage interest and conflicts
of interest are available on the website of the Members. Research is
available through the ESN Members sales representative. ESN will
provide periodic updates on companies or sectors based on company-
specific developments or announcements, market conditions or any other
publicly available information. Unless agreed in writing with an ESN
Member, this research is intended solely for internal use by the recipient.
Neither this document nor any copy of it may be taken or transmitted into
Australia, Canada or Japan or distributed, directly or indirectly, in
Australia, Canada or Japan or to any resident thereof. This document is
for distribution in the U.K. Only to persons who have professional
experience in matters relating to investments and fall within article 19(5) of
the financial services and markets act 2000 (financial promotion) order
2005 (the “order”) or (ii) are persons falling within article 49(2)(a) to (d) of
the order, namely high net worth companies, unincorporated associations
etc (all such persons together being referred to as “relevant persons”).
This document must not be acted on or relied upon by persons who are
not relevant persons. Any investment or investment activity to which this
document relates is available only to relevant persons and will be engaged
in only with relevant persons. The distribution of this document in other
jurisdictions or to residents of other jurisdictions may also be restricted by
law, and persons into whose possession this document comes should
inform themselves about, and observe, any such restrictions. By accepting
this report you agree to be bound by the foregoing instructions. You shall
indemnify ESN, its Members and their affiliates (and any director, officer or
employee thereof) against any damages, claims, losses, and detriments
resulting from or in connection with the unauthorized use of this document.
For disclosure upon “conflicts of interest” on the companies under
coverage by all the ESN Members and on each “company
recommendation history”, please visit the ESN website
(www.esnpartnership.eu) or refer to the ESN Members website. Additional
information is always available upon request. For additional information
and individual disclaimers please refer to www.esnpartnership.eu and
to each ESN Member websites:
www.bancaakros.it regulated by the CONSOB - Commissione Nazionale per le Società e la Borsa
www.caixabi.pt regulated by the CMVM - Comissão do Mercado de Valores Mobiliários
www.cmcicms.com regulated by the AMF - Autorité des marchés financiers
www.equinet-ag.de regulated by the BaFin - Bundesanstalt für Finanzdienstleistungsaufsicht
www.ibg.gr regulated by the HCMC - Hellenic Capital Market Commission
www.nibcmarkets.com regulated by the AFM - Autoriteit Financiële Markten
www.op.fi regulated by the Financial Supervision Authority
www.valores.gvcgaesco.es regulated by CNMV - Comisión Nacional del Mercado de Valores
Members of ESN (European Securities Network LLP)
Caixa-Banco de Investimento
Rua Barata Salgueiro, nº 33
1269-057 Lisboa
Portugal
Phone: +351 21 313 73 00
Fax: +351 21 389 68 98
GVC Gaesco Beka, SV, SA
C/ Marques de Villamagna 3
28001 Madrid
Spain
Phone: +34 91 436 7813
Investment Bank of Greece
32 Aigialeias Str & Paradissou,
151 25 Maroussi,
Greece
Tel: +30 210 81 73 383
Banca Akros S.p.A.
Viale Eginardo, 29
20149 MILANO
Italy
Phone: +39 02 43 444 389
Fax: +39 02 43 444 302
NIBC Markets N.V.
Nieuwezijds Voorburgwal 162
P.O.Box 235
1000 AE Amsterdam
The Netherlands
Phone: +31 20 550 8500
Fax: +31 20 626 8064
CM - CIC Market Solutions
6, avenue de Provence
75441 Paris
Cedex 09
France
Phone: +33 1 53 48 80 78
Fax: +33 1 53 48 82 25
equinet Bank AG
Gräfstraße 97
60487 Frankfurt am Main
Germany
Phone:+49 69 – 58997 – 212
Fax:+49 69 – 58997 – 299
OP Corporate Bank plc
P.O.Box 308
Teollisuuskatu 1, 00013 Helsinki
Finland
Phone: +358 10 252 011
Fax: +358 10 252 2703