Dealing Software User Guide Version 5
29
1 Dealing Software User Guide Version 5.2 Main Client Screen Main Screen - Quick Key 1. Dealing Boxes: one per currency pair; view real time bid/ask rates; click on the BUY or SELL to instantaneously execute a trade. 2. Rate Summary: quick snapshot of current bid/ask, today’s high/low, etc. – by currency pair. 3. Position Management: real time, summary view of all open positions. Place, monitor, and cancel orders. 4. Economic Calendar: Weekly listing of upcoming economic reports, including date & time, country, forecast, previous and actual. 5. Charting: access the charting tool by clicking “Charting” tab. 6. Margin Analysis: real time information about margin, P&L and account balances. Click the Deal Analysis tab to access this information. 7. Activity Log: lists each action completed or attempted in your account. 8. Deal Blotter - provides pertinent details on all open trades, as well as trades that have been closed out during the current trading day. 9. News - 24-hour streaming news service from RTT News provides actionable market news and analysis. 10. System Login/Logoff – enter user ID and password & access user configurable settings. 11. Reports – access to several ad hoc reports for data export or printing. 12. User Tools - FX trading tools, including Technical Analysis. 13. Commentary – expert market analysis provided by senior traders. 14. Minimize Button: Collapses the platform to create a dashboard view; allows you to monitor the market while working in other applications. 2 1 6 7 8 9 10 11 12 13 4 3 5 14
Transcript of Dealing Software User Guide Version 5
1
Dealing Software User Guide
Version 5.2 Main Client Screen
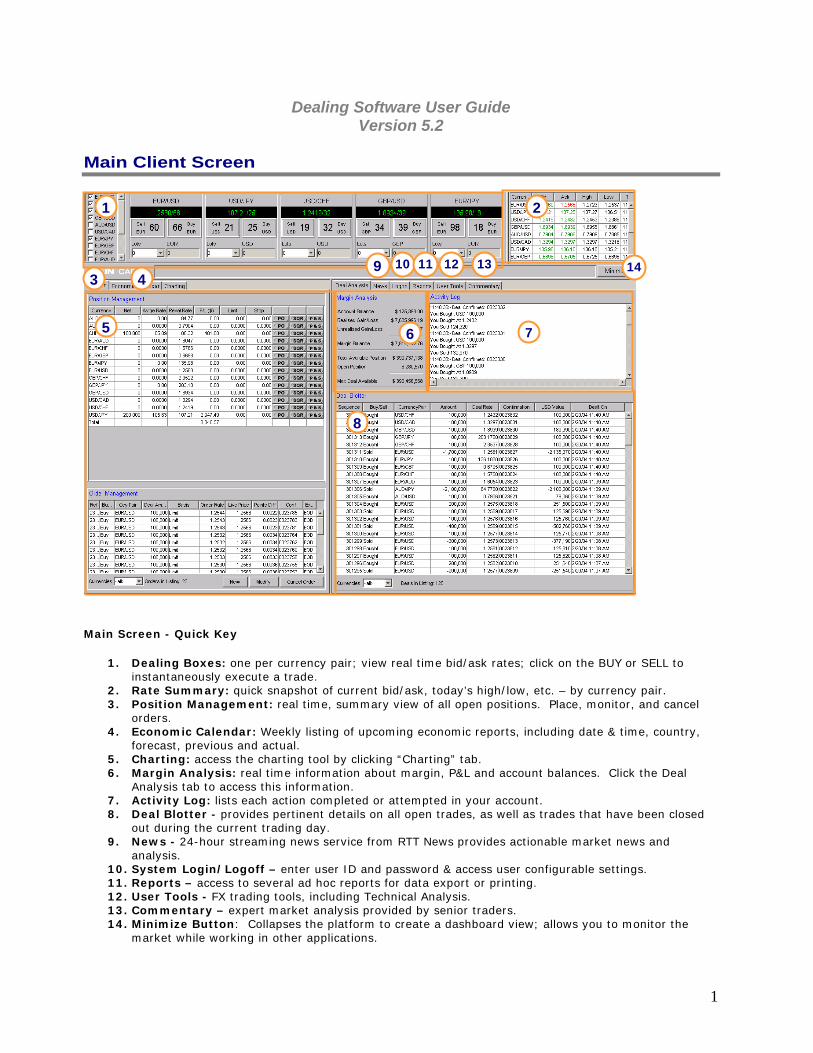
Main Screen - Quick Key
1. Dealing Boxes: one per currency pair; view real time bid/ask rates; click on the BUY or SELL to instantaneously execute a trade.
2. Rate Summary: quick snapshot of current bid/ask, today’s high/low, etc. – by currency pair. 3. Position Management: real time, summary view of all open positions. Place, monitor, and cancel
orders. 4. Economic Calendar: Weekly listing of upcoming economic reports, including date & time, country,
forecast, previous and actual. 5. Charting: access the charting tool by clicking “Charting” tab. 6. Margin Analysis: real time information about margin, P&L and account balances. Click the Deal
Analysis tab to access this information. 7. Activity Log: lists each action completed or attempted in your account. 8. Deal Blotter - provides pertinent details on all open trades, as well as trades that have been closed
out during the current trading day. 9. News - 24-hour streaming news service from RTT News provides actionable market news and
analysis. 10. System Login/Logoff – enter user ID and password & access user configurable settings. 11. Reports – access to several ad hoc reports for data export or printing. 12. User Tools - FX trading tools, including Technical Analysis. 13. Commentary – expert market analysis provided by senior traders. 14. Minimize Button: Collapses the platform to create a dashboard view; allows you to monitor the
market while working in other applications.
2 1
6 7
8
9 10 11 12 134 3
5
14

2
Executing a Trade The ability to trade directly from real time, streaming quotes is the centerpiece of our service. The current bid/ask prices appear in the dealing boxes seen below, and clients can at any time click on the current bid or offer and instantaneously execute a trade. More importantly, the dealing desk publishes ONE price to the entire client base and allows any client to deal on that available price. By offering instantaneous execution from live, two-way prices, clients are always certain that the available prices are "at the market". Dealing from live quotes offers traders the advantage of anonymity and faster execution. Normal execution times are sub-one second, currently the fastest execution available from ANY online Forex platform.
Step 3: Confirmation
Step 4: Enter Auto Stop Loss
Step 1: Enter number of lots to trade.
Use the pull down list or type in the number of lots (1 lot = 100,000 of the first currency) you wish to trade.
Step 2: Deal.
Click Sell or Buy button to execute the trade.
A green box confirms the deal was executed, with a “you bought, you sold” statement confirming the precise details of the trade and a confirmation number. A red box will say “deal not accepted” followed by the reason.
Click to BUY at
the current Offer
# of Lots to be traded
Notional amount of trade
Click to SELL at
the current
Bid
Upon successful execution of a new position, (meaning there was no existing position in the currency pair just traded) you will be prompted to enter a stop loss order. Auto Order Prompt can be enabled on the Logon/Profile tab. A Stop Loss, Single or OCO order can be entered for the full amount of the new position. **IMPORTANT – Position Orders, which appear in Position Management, are automatically cancelled when the corresponding position is squared or closed. All other orders remain open until they are triggered or manually cancelled.

3
Upon completion of the order details, click on [Confirm] to submit the order.
Upon acceptance of the order, the details become visible in Position Management. With an associated order in place, as the position changes, the face amount of the order automatically adjusts to match. IMPORTANT NOTE: Position Orders appear in Position Management all other orders appear in Order Management.

4
Squaring Your Position
Auto Square: Gives clients the ability to exit a position with greater ease. To close out the entire open position in a specific currency pair, click on 'SQR' to automatically executes an offsetting trade. You can also review the trade details in the Activity Log or the Deal Blotter. The Auto Square button is intentionally limited to only allow for the maximum deal size (number of lots) associated with your account. Therefore, if you have an open position that is larger than your maximum deal size, you will need to use the dealing boxes to close out your position incrementally. For example, if your max deal size is 25 lots but the total value of your position is 30 lots you will need to a) incrementally reduce your position via the dealing boxes to 25 lots in order to utilize the Auto Square function or b) simply close out the entire position incrementally utilizing the dealing boxes. **IMPORTANT – Position Orders, which appear in Position Management, are automatically cancelled when the corresponding position is squared or closed. All other orders remain open until they are triggered or manually cancelled. Point and Shoot The Point and Shoot tool enables you to drill down into a position, view the individual trades that comprise that position, and close any individual trade that is part of your overall position in any currency pair. In the example below, the trader is long 400,000 (4 lots) Euros. This position is the result of buying 200,000 (2 lots) at 1.1981 and another 100,000 (1 lot) at 1.1980 and 100,000 (1 lot) at 1975. To use the Point and Shoot feature to drill down into the position, click on the ‘P & S’ button in the management window (Figure 1).

5
Figure 1
Figure 2 is the detail view of the GBP/USD position, showing each individual trade detail, including size, deal rate and date. Here, you can select and close any trade with a single click of the mouse. Simply click on the 'close' button and you will automatically be closed out of that trade.

6
In this example, 100,000 EUR are sold by clicking the Close button at far right. The deal is confirmed and removed from the screen. (Figure 3)
Figure 3
Click Abort to return to the main Position Management window. Position Orders Position Orders (PO) are directly related to individual positions. These orders are only active for as long as the position remains open. The ability to associate an order with a position offers clients the ability to place an order that will cover a position even as it changes. If the 'Auto Order Prompt' check box upon the 'Logon/Profile' tab is checked then upon entering into a new position or reversing a position, the client is automatically prompted to enter a Position Order to cover the new position. As the position increases or decreases, the face of the Position Order automatically adjusts to match the value of the position. If a position is cancelled then the Position Order is automatically removed on behalf of the client. If a position is reversed then the Position Order is cancelled and the client is prompted to place another order. To modify or cancel a Position Order click on the ‘PO’ button next to the limit or stop rate you wish to adjust. This will open the Auto Limit/Stop Order dialog.

7
Click on the [Cancel Order] button to cancel the Position Order or Click [Modify] to make any changes as required. Click on the [Modify] button to confirm any changes made to the Position Order.
Any modifications made can be seen in Position Management. IMPORTANT NOTE: If an order is not already associated to a position, click on the PO to open the Auto Limit/Stop Order dialog. Set up the order as required and click [Modify] to submit the new order.

8
Position Management The position management window provides a summary view of all current positions and Position Orders. The information in this window is updated in real time, changing tick by tick as the market moves.
Currency: The column lists all available currency pairs, even if you don't have an open position in that pair. Net: Lists the net total of all your current positions in that currency pair. It represents the amount of the currency in which lots are traded. For example, if you were long 300,000 AUD at one rate and sold 500,000 AUD at a different rate, your Net total would be –200,000 AUD. Average Rate: The average rate of your open positions. Represents the rate at which you would have to close your position to end up flat. Reval Rate: The current rate at which you could close out your position. If you are long, the system uses the current bid rate (and vice versa) to determine your unrealized gain/loss and P&L. P/L ($): The profit or loss in USD that you would realize if you closed your position now, at the rate currently available. Limit: If you have a limit order placed, the rate at which your order will be filled is indicated in this column. Stop: If you have a stop loss order placed, the rate at which your order will be filled is indicated in this column. PO: The PO button allows customers to enter, modify, or cancel Position Orders. Position Orders are orders that are “linked” to a position. SQR Button: Gives clients the ability to exit a position with greater ease. Pressing the SQR button automatically executes an offsetting trade to close out the entire open position in a specific currency pair. If the trade is successful, the Net column will show 0, and the deal will appear in the Deal Blotter. To confirm all trade details, check the Activity Log. Squaring or closing out a position will automatically cancel a corresponding Position Order. P&S: Point and Shoot, this tool enables you to drill down into a position, view the individual trades that comprise that position, and close any individual trade that is part of your overall position in any currency pair.

9
**IMPORTANT – Squaring or closing a position will automatically cancel a corresponding Position Order. All other orders remain open until they are triggered or manually cancelled. The position management window is user configurable. To rearrange the column order, click and drag the header right or left until it shifts. To adjust the column width, hold the cursor over the cell dividing line to get a double arrow. Click and drag right or left to adjust width. Click on a column heading to sort the rows by that category. Order Management The order management window is a summary view of all open orders. Orders within 10 pips of being executed are highlighted, allowing traders to easily track order status.
Ref: Each order is assigned a reference number. Both sides of a ‘One Cancels Other’ (OCO) order will have the same number.
Buy/Sell: Order type based on the first currency in the pair.
Ccy Pair: The currency pair of the trade.
Deal Amount: The first currency value of your order.
Basis: Order type, i.e. Stop Loss (or Stop Entry) or Limit.
Order Rate: The trigger rate at which you want the trade executed.
Live Price: The current rate at which the trade could be executed.
Points Dif: The difference between the order rate and the live price.
Conf: The order confirmation number generated by the system upon placement of your order.
Trade Ref #
Deal Amount Order Rate Confirm Number
Expiry Two
trades with the same
number indicates an OCO
or If Then / OCO
Difference b/w live price and
order
Sort Orders by Currency
Pair
Total # of Open
Orders
To place a new order
To cancel an Open Order
Buy/Sell
Currency Pair Order Type Current
Price
Modify an existing order

10
Expiry: The point at which the order becomes invalid, even if the market reaches your rate.
Currencies: Sort open orders by currency pair or show all orders.
Orders in listing: The number of orders posted in the category you have selected in the currency field.
New: Clicking “New” will take you to the order form to place a new order.
Modify: Clicking “Modify” will allow you to change the rate and/or lot size of the order without having to cancel the order. Cancel Order: In the order status window, highlight the order you wish to cancel by clicking on it with your mouse, and then click ‘Cancel’.
Color indicators: Yellow (whole row): Indicates the second leg of an OCO Yellow (live price and Points Diff column) indicates within ‘n’ number of points (default is 1) Green (live price and Points Diff column): Indicates when an order rate has been passed through Blue: Indicates that an order is filled Leaving an Order To place an order, complete the appropriate sections:
1. Select a Currency Pair: choose a currency pair from the drop down list.
2. Choose an Order Type:
• Single: single Stop Loss or Limit order, with your choice of end of day or good’ til cancelled (GTC) expiry.
• One Cancels the Other (OCO): Two-legged order whereby the second leg is cancelled if the first leg is executed.
• If Then: Two-legged order whereby the second single order is placed only upon execution of the first single order.
• If Then / OCO – two legged order whereby the OCO order is placed only upon execution of the first single order.
3. Choose the Expiry: Choose one of the following:
• End of day (EOD): Order will expire at 17:00 ET at the end of the trading day you placed it. • Good Til’ Canceled (GTC): Order will remain active until you highlight it and click the cancel
button.
4. Select ‘Buy’ or ‘Sell’ from the drop down list.

11
5. Select the number of lots from the drop down list.
6. Choose the Order Basis: either ‘Limit’ or ‘Stop Loss’.
7. Enter the Order Rate: The rate at which the order will be executed. You may enter in ANY rate other than the current spot rate. Fill this in manually. Note: If you have specified a default number of pips away for stop loss orders, this field will automatically populate with your default. This user-configurable default can be set or edited in the Logon window.
8. Confirm the order: When all the fields are completed and you have checked your order, click
“Confirm” and your order will appear in the Order Management screen. To Abort the order: Choose “Abort” to cancel the pending order and return to the order management window. **If you click “Abort” before clicking “Confirm”, you will return to the order management window and no order will be placed.
**IMPORTANT -- Orders remain open until they are triggered or cancelled. If you close out a position manually, you must cancel any order(s) relating to that position.
For an OCO order, fill out both sections
‘One Cancels Other’ (OCO) orders: the lower half of the form will be highlighted. Enter both sides of the OCO order as directed. Remember, if one side of your OCO is filled, the other is automatically canceled. ‘If Then’ order: the lower half of the form will expand for the second leg of the If Then order. Place either your single Then order in this section. Remember, canceling any part of an If Then order will result in the entire order being canceled
For an If Then order, fill out both sections

12
Select Trailing Stop from the ‘Type’ drop down menu, as shown. In addition to the regular order parameters, you will be prompted to specify Trailing Points, which is the number of pips from the current rate at which you want the stop loss order to be executed. The system accepts Trailing Points between 10 and 1,000. The advantage of a trailing stop is that the order automatically “trails” the rate if the position moves in your favor, offering the potential for greater gains while still guarding against price declines.
Edit an Existing Order
For an If Then / OCO, fill out all sections
‘If Then / OCO’ order: the lower half of the form will expand for the OCO leg of the If Then order. Place either your OCO order in this section. Remember, canceling any part of an If Then order will result in the entire order being canceled
For a Trailing Stop Order, specify trailing points
In this example, the live rate is 1.2701 and the Trailing Points are set to 30. The sell stop order will be filled if EUR/USD bid reaches 1.2671 (live rate – 30 pips). If EUR/USD moves in your favor, e.g. to 1.2735, the stop order will automatically adjust to 1.2705 - always 30 pips from the live rate.
Trailing stops are bolded for easy identification. *Trailing stops can not be edited; instead, cancel and enter a new order.

13
Edit an Order. There are two ways to edit an existing order. Double click the order you wish to edit, or select the order with a single mouse click and press the modify button. This invokes the edit screen, allowing you to edit any parameter of the order, except for order type. If you wish to change the order type, you must cancel the existing order and place a new order.
Cancel an Existing Order Cancel an Order. Select the order with a single mouse click and press the ‘Cancel Order’ button. The edit order screen will appear, showing all details of the order to be cancelled. Confirm by clicking the ‘Cancel Order’ button again in the bottom left of the screen. An Order Cancellation Successful message will appear in the bottom right of the order screen. If you do not wish to cancel the order, simply click ‘Abort’ and you will be returned to the order management screen.
Press ‘Modify’ to accept your changes, or ‘Abort’ to cancel and return to the Order Management screen.
Change the Expiry, Trade Direction (Buy or Sell), Lot size, Order Basis, or Order Rate

14
Economic Calendar
The Economic Calendar provides a weekly listing of all upcoming economic reports, along with the following information: Local Date: Date and local time of release Country: Country issuing report Name: Report name Period: Reporting period Forecast: Represents market consensus estimate for each indicator Actual: Refers to the figures as they are released Previous: Represents the last actual for each indicator
15
Charting Tool
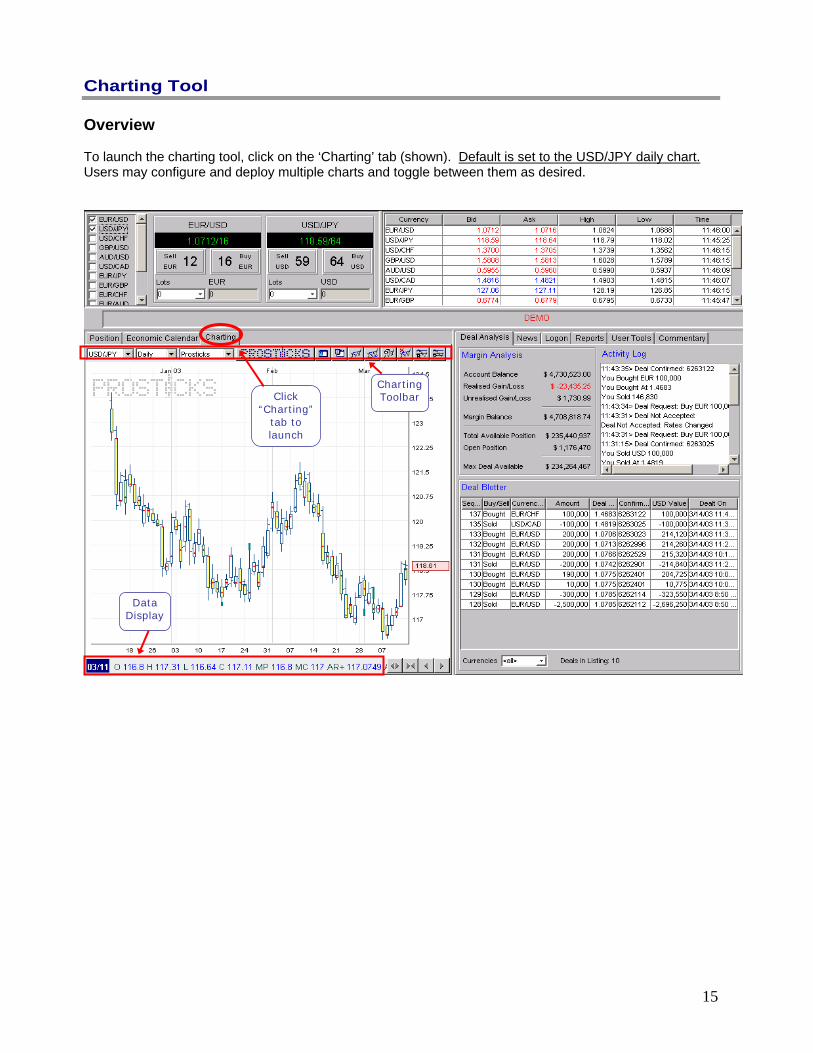
Overview To launch the charting tool, click on the ‘Charting’ tab (shown). Default is set to the USD/JPY daily chart. Users may configure and deploy multiple charts and toggle between them as desired.
Click “Charting”
tab to launch
Charting Toolbar
Data Display

16
Tool Bar
The first three buttons on the right of the toolbar allow you to choose currency pair, interval, and chart type. Currency Pair A total of 22 currency pairs can be selected for viewing on the chart. Simply select the desired currency pair in the drop-down box:
Time interval Intervals Available intervals include daily, weekly, and monthly charts, as well 6 intra-day charts (1 minute, 5 min, 10 min, 15 min, 30 min, hourly). To choose a specific time interval, simply select the time in the drop-down box as like the following:
Chart Types There are a total of 6 different chart types to choose from: ProSticks, Candle, Bar, Line, Bar and Modal, and Modal Line. Simply select the chart type in the drop-down box:
*Please note that intra-day charts are only available for Candle, Bar, and Line charts. All other chart types are available for daily, weekly, and monthly charts only.

17
Technical Analysis Functions The remaining buttons on the toolbar are technical analysis functions.
Data Display
Value Cursor The value cursor function allows the user to view the data associated with any point in time on the chart on the data display bar on the bottom. As the value cursor moves, the data on the data display bar will refresh automatically to reflect the current date’s data, similar to the example below. The current price of the value cursor’s center point is also displayed on the price scale on the right and will refresh automatically to reflect the current position’s price as the cursor moves.
Draw trend line
Draw parallel trend line
Delete last
trend line
Delete ALL
trend lines
Fibonacci Retracement
Fibonacci Projection
Delete Fibonacci
Input Text
Erase ALL text
Erase last text
Value Cursor
Zoom
Studies/ Indicators
Set study preferences New
Window
Date (mm/dd)
Open Price
High Price
Low Price
Close Price
( /d
Scroll left
Scroll right
Expand chart data
Contract chart data

18
Studies / Indicators
Indicator preferences
The second button on the action toolbar allows users to set preferences for each technical indicator. A pop-up box will appear. Each indicator has its own parameters and can be set by using the input boxes, as shown below. The drop-down box in this menu will contain only the technical indicators that have already been set. Simply click on the Apply button to update the parameters’ settings.
To select an indicator, simply click on the indicator in thepop-up menu and a check mark will appear on the leftsignaling the indicator has been plotted, as shown below.To clear any indicator from the chart, simply click on theindicator once again and the check mark beside thetechnical will disappear, signaling that the indicator has beencleared. A maximum of 2 upper technical indicators can be plotted atthe same time while up to 3 lower indicators can be plottedtogether. Parameters for each technical will be explained inthe next section. The last part of the menu indicates the formula used tocalculate the technical indicators. The traditional, last price,can be used or one can choose to try calculating thetechnical indicators with the ProSticks’ Modal Point.

19
Definitions of Available Indicators • Simple Moving Average (SMA) -The average price of a given time period, (5, 10 min., daily, etc.)
where each of the chosen periods carries the same weight for the average. Example: Day 1 close, USD/JPY 124.00 Day 2 close, 126.00 Day 3 close 125.00. The 4 day SMA is 125.00
• Exponential Moving Average (EMA) - Here, the averages are calculated with the recent data carrying
more weight applying to the overall average. For example: In a 10 day moving average, the last 5-10 days will have more value than the first 5 with the idea this will provide stronger and earlier trend direction.
• Bollinger Bands – The basic interpretation of Bollinger Bands is that prices tend to stay within the
upper- and lower-band. The distinctive characteristic of Bollinger Bands is that the spacing between the bands varies based on the volatility of the prices. During periods of extreme price changes (i.e., high volatility), the bands widen to become more forgiving. During periods of stagnant pricing (i.e., low volatility), the bands narrow to contain prices. The bands are plotted two standard deviations above and below a simple moving average. They indicate a “sell” when above the moving average and a “buy” when below it. The bands are used in conjunction with other analyses, including RSI, MACD, CCI, and Rate of Change.
• Parabolic SAR - The Parabolic SAR (stop-and-reversal) is a time/price trend following system used to
set trailing price stops. The Parabolic SAR provides excellent exit points. You should close long positions when the price falls below the SAR and close short positions when the price rises above the SAR. If you are long (i.e., the price is above the SAR), the SAR will move up every day, regardless of the direction the price is moving. The amount the SAR moves up depends on the amount that prices move.
• Rate of Change - The oldest closing price divided into the most recent one. • RSI (Relative Strength Index) - The RSI is a price-following oscillator that ranges between 0 and 100.
A popular method of analyzing the RSI is to look for a divergence in which the currency price is making a new high, but the RSI is failing to surpass its previous high. This divergence is an indication of an impending reversal. When the RSI then turns down and falls below its most recent trough, it is said to have completed a "failure swing." The failure swing is considered a confirmation of the impending reversal.
• Stochastic - Stochastic studies are based on the premise that as prices rise, closing prices tend to be
near the high value. Conversely, as prices fall, closing prices are near the low for the period. Stochastic studies are made of two lines, %D and %K, that move between a scale of 0 and 100. The %D line is the moving average over a specified period of time of the %K line. The %K line measures where the closing price is compared to the price range for a given number of periods.
• Momentum - Designed to measure the rate of price change, not the actual price level. Consists of the
net difference between the current closing price and the oldest closing price from a predetermined period. The Momentum indicator can be used as either a trend-following oscillator similar to the MACD or as a leading indicator.
• MACD - Moving Average Convergence/Divergence - Consists of two exponential moving averages
that are plotted against the zero line. The zero line represents the times the values of the two moving averages are identical. The MACD is calculated by subtracting a 26-day moving average of a currency's price from a 12-day moving average of its price. The result is an indicator that oscillates above and below zero. When the MACD is above zero, it means the 12-day moving average is higher than the 26-day moving average. This is bullish as it shows that current expectations (i.e., the 12-day moving average) are more bullish than previous expectations (i.e., the 26-day average). This implies a bullish, or upward, shift. When the MACD falls below zero, it means that the 12-day moving average is less than the 26-day moving average, implying a bearish shift.
20
• ADX - Measures the strength of a prevailing trend and whether or not there is direction in a market. Plotted from zero on up, usually a reading above 25 can be considered directional.
• Williams %R - A momentum indicator that measures overbought/oversold levels. The interpretation of
Williams' %R is very similar to that of the Stochastic Oscillator, except that %R is plotted upside-down and the Stochastic Oscillator has internal smoothing. Readings in the range of 80 to 100% indicate oversold, while readings in the 0 to 20% range suggest overbought.
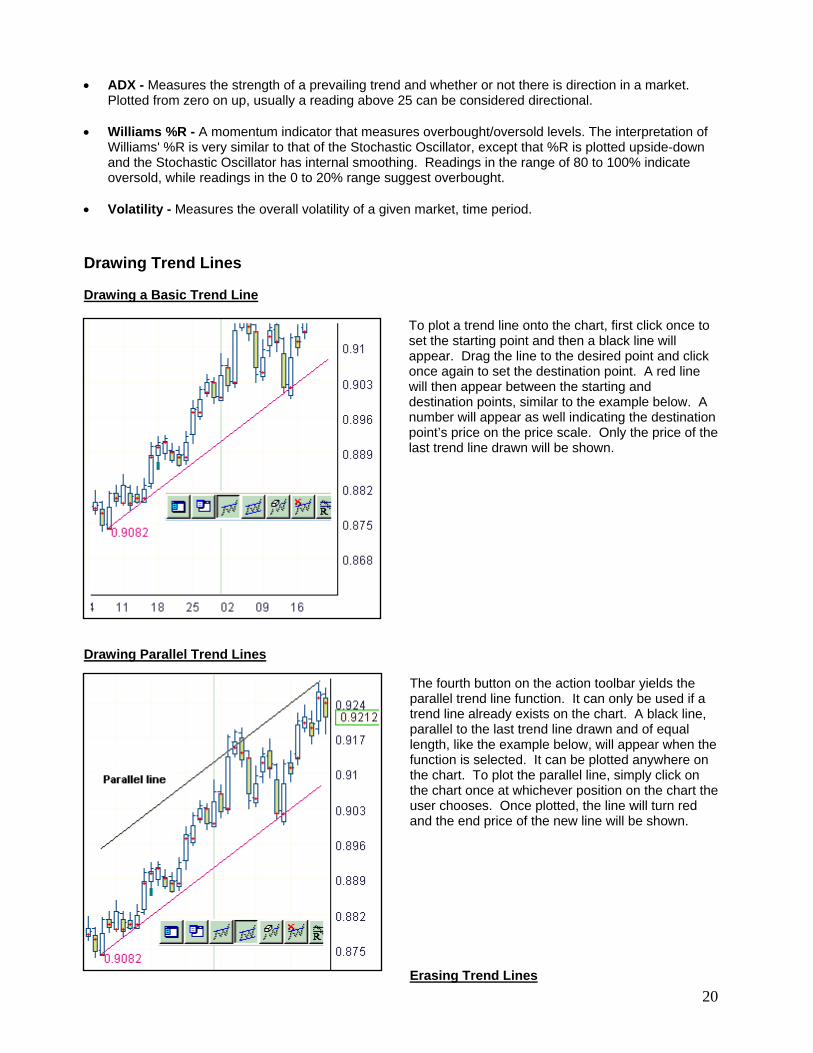
• Volatility - Measures the overall volatility of a given market, time period. Drawing Trend Lines Drawing a Basic Trend Line
To plot a trend line onto the chart, first click once to set the starting point and then a black line will appear. Drag the line to the desired point and click once again to set the destination point. A red line will then appear between the starting and destination points, similar to the example below. A number will appear as well indicating the destination point’s price on the price scale. Only the price of the last trend line drawn will be shown.
Drawing Parallel Trend Lines
The fourth button on the action toolbar yields the parallel trend line function. It can only be used if a trend line already exists on the chart. A black line, parallel to the last trend line drawn and of equal length, like the example below, will appear when the function is selected. It can be plotted anywhere on the chart. To plot the parallel line, simply click on the chart once at whichever position on the chart the user chooses. Once plotted, the line will turn red and the end price of the new line will be shown.
Erasing Trend Lines

21
Use the toolbar buttons to erase trend lines. The first button (left) will erase the last trend line drawn, and the second button (right) will erase all trend lines drawn. Fibonacci Studies Fibonacci Retracement Fibonacci Retracements are displayed by selecting two extreme points, for example, a trough and opposing peak. A series of three horizontal lines are drawn intersecting the trend line at the Fibonacci levels of 38.2%, 50%, 61.8%, After a significant price move (either up or down), prices will often retrace a portion (if not all) of the original move. As prices retrace, support and resistance levels often occur at or near the Fibonacci Retracement levels. To use this function, select a position for the first point and click on the chart once and then select another position for the second point and click on the chart again. Fibonacci Retracement figures will be shown on the chart underlined in green and as well as on the top left portion of the chart.

22
Fibonacci Projection Fibonacci Projection calculation needs a total of 3 points. The first two points are used to calculate the distance of the first move (shown in example below), while the third point is the starting position of the projection. The purpose of Fibonacci Projections is to estimate where the current move may end. The following is an example of the result of selecting 3 points on the chart, clicking one after the other, with the last being the start of the projection. Fibonacci projection figures of 61.8 %, 100% and 161.8% (as a percent of the first move) will be shown on the chart underlined in blue, as well as on the top left portion of the chart. (Some of the lines may not be visible because they will be off the scale.)
Erasing Fibonacci functions The next button (ninth) is used to erase one or both of the Fibonacci functions from the chart.
1
2
3

23
Text functions
The leftmost button of this set is used to input text. After selecting the button, click anywhere on the chart and a text box will appear for text input, similar to below. The middle button of this set erases the last text box created, while the button on the right will erase all text boxes. Zoom function
To use the zoom function, select it on the toolbar and then click once on the chart then drag to select the area to be enlarged. Once the area has been selected, click once more to zoom. The following is an example:
Creating Multiple Charts
The last button on the right of the toolbar is the new window function. This function creates a new chart in a new window to maximize the chart size.

24
Margin Analysis
Unrealized Gain/Loss: The net P&L of all open positions, calculated at the current rate. This amount changes as the rates fluctuate. Margin Balance: Represents Account Balance plus the sum total of current realized and unrealized gains/losses. Total Available Position: The total position, in US dollars, that your margin balance will allow you to put on. At 2% margin, this represents 50x your current margin balance. Open Position: The total USD value of all open positions. Max Deal Available: Total available position less the current gross position. This is the amount available for new trades. Activity Log
n The Margin analysis window provides traders with real time information r trading account, including:
Account Balance: The sum of all deposits, interest income, and realized gains less all withdrawals, realized losses, and incidental fees. Account Balance equals posted margin + excess margin deposit. Realized Gain/Loss: The net (sum of all gains and losses) P&L on positions that have been closed out today. At the end of the business day, all realized Gains/Losses are posted to the client’s account balance.
The activity log lists each action completed or attempted in your account. Each time a trade is executed a deal request message will appear, followed by an “order executed” confirmation with details of the trade or a “deal failed” message followed by the reason. When pending orders are either filled or fail they will also appear in your activity log. This log will list actions continually from the time the trader logs onto the dealing system until he logs off. Transactions made in a previous session can be viewed in an activity report in the “report” section

25
Deal Blotter
The Deal blotter provides pertinent details on all open trades, as well as trades that have been closed out during the current trading day. All information may be sorted by clicking on a specific column header, or by using the drop down list on the lower loft of the window.
Rate Summary The rate history window is a summary view of today's prices, listed by currency pair. High / Low columns display High Bid and Low Offer – which is reset daily at 1700 ET (New York close). This information can be customized according to user preference. The columns may be sorted and rearranged in the same manner as the Position Management window.
Deal Time
Stamp
Select view – All deals or specific currency pair
Deal Amount The rate at
which the deal was
filled
Action taken
Number of deals in selected view
Sequence #
The time at which the last
price was posted
Current Bid/Ask
Currency Pair
Today’s highest bid &lowest offer
Currency Pair
System- generated confirm number
USD value of
deal

26
System Login/Logoff You must login to the dealing applet before each session. The applet automatically prompts you for a User ID and Password.
User ID/Password: Enter your user ID and Password in the appropriate fields to log in to the dealing software. Please note that both are case sensitive. User Configurable Auto Logoff - The applet also features a user-configurable timeout feature. Click on the Auto Logoff drop down box and select your preference – from 15 minutes to 3 hours. Auto Stop Loss Enabled - If Auto Stop Loss is enabled (checked), upon successful execution of a NEW position (meaning there was no existing position in the currency pair just traded), you will be automatically prompted to enter a stop loss order to cover a new position. Simply deselect this box to disable the auto prompt. Auto Stop Loss Pips Away - For both auto stop loss and manually entered stop loss orders, the system automatically defaults the order rate to 30 pips away from current market rate. This default is user-configurable. Once you have set your preference in the logon window, every time a stop loss order is initiated the Pips Away and Order Rate fields will automatically reflect the desired default. Note: You always have the option of changing the order rate before submitting or accepting any new stop loss order. Important note: Do not attempt multiple logons to the dealing software. The software security will immediately lock out any user who has logged on more than once using the same login ID and password. If you are experiencing difficulty logging on to the software, please contact a client services associate immediately. When you wish to exit the system, you must logoff by clicking the ‘disconnect’ button; otherwise you will remain logged into the server

27
Minimize Button The Minimize button is ideal for users who wish to keep an eye on the market while performing other computer tasks. This button collapses the screen so that only the dealing boxes and rate comparison window is in view. You can drag the window to any part of your screen, as needed. To enable this feature, click the Minimize button, which is located under the rate comparison window. The lower half of the platform will be hidden, as shown. To bring the full trading platform back into view, just click the Maximize button. Dashboard view
Reports The dealing software tracks all trading activity in real time, allowing clients to view current open positions, real-time profit and loss, margin availability, account balances, and all historical transaction details directly on-screen. In addition, by clicking on the 'reports' tab on the menu bar, clients may access five ad hoc reports: Account Value Summary - an online monthly account statement. View current account balance (realized P&L) for a selected month, as well as all deposits, withdrawals, interest earned, and fees charged (if any). Detailed Transaction Listing - lists complete trade detail for any selected date range, including deal date, currency pair dealt, trade direction (buy or sell), contract size for both currencies in the pair dealt, and executed deal rate. Open FX Positions - a summary view of all open positions, including contract size, USD value, average rate of open positions, reval rate (current market rate), and unrealized P&L. This report supplements real-time position information available in the position management screen of the trading platform. Order History – provides detail on all order activity for a selected data range, including order entry date and time stamp, listing of all cancelled and/or executed orders, along with its reference number. The Log Entry column provides a confirmation number and action detail for any order. Rollover History – provides rollover details for any transaction held open past 1700 EST, including rollover rate and USD value. May be generated for any given date range. Note: All reports can be printed and/or exported into Microsoft Excel via a simple cut and paste. Market Commentary Forex Insider provides you with actionable analysis of news, events and technical levels that impact currency prices - as it happens. Updates are published directly by the senior traders and members of our experienced research team, up to 20 times an hour. Forex Insider is located under the "Commentary" tab.

28
User Tools In the Trading Tools tab you will find several useful research reports, as well as access to other important trading tools. Available information includes: Daily Technical Analysis Report Offers technical insight for seven currency pairs including short, medium, and long term momentums as well as key support/resistance levels. The Daily Technical Analysis Report is published every morning at 0800 ET. Daily Technical Analysis Report For avid chartists. Published every morning at 0800 ET, this report x-rays seven key currency pairs for short, medium, and long term momentums as well as key support/resistance levels. Keep your eye on these "tripwires" for market action - so you can trade with the trend, as soon as it starts. Strategy of the Day Published twice a day before the Asian and New York markets open, Strategy of the Day gives you a fresh, ready-to-use trading idea for the upcoming trading session. Currency Strategist Todd Gordon explains blow-by-blow how to set up the trade and why he thinks it's a smart move, reporting back on the results and lessons learned. The Week Ahead Published every Friday at 1500 ET, this report summarizes key market developments – both fundamental and technical - and analyzes the likely impact on the upcoming trading week. It's a quick, compact way to keep a handle on the overall currency market. The Weekly Strategy If you're a swing trader, check out the Weekly Strategy every Friday at 1500 ET for trading opportunities to consider in the upcoming week. We set up the trade, explain the logic behind it, and then report back on how it worked in the actual market. Get your trading tips from a team with real skin-in-the-game - and benefit from our experience. Economic Calendar Your shorthand guide to key economic releases for the week ahead. Review how currency markets reacted previously to these events and what they're forecasted to act next. System Requirements Recommended System Requirements
• Processing speed of 400Mhz or higher • Monitor resolution set at 1024x768 • Windows 98SE/ME/2000/XP • 128MB of RAM for Windows 95/98; 256MB of RAM for Windows 2000/XP • Internet Explorer v6.0 • An Internet connection of 56Kbps or higher ** For best results, we strongly recommend the use of Internet Explorer 5.0 of higher. For best viewing, expand the window to full screen by depressing the F11 function key on your keyboard or selecting View >Full Screen in the IE menu.

29
Minimum System requirements
• Processing speed of 200Mhz or higher • Monitor resolution set at 800 x 600 • Windows 95 OSR2/98/ME/2000/NT/XP • 96MB of RAM
• Internet Explorer 5.x or higher or Netscape v6.x
• An Internet connection of 33.6Kbps