Dealership Expense Evaluation and Control - Sandi Jerome … · Dealership Expense Evaluation and...
25
Dealership Expense Evaluation and Control - Sandi Jerome Style Great A Method of Getting to the Bottom of Complex Expense Categories With Sandi Jerome, Sandi Jerome Computer Consulting Moderated By Mike Bowers, DealersEdge
-
Upload
nguyennguyet -
Category
Documents
-
view
221 -
download
0
Transcript of Dealership Expense Evaluation and Control - Sandi Jerome … · Dealership Expense Evaluation and...

Dealership Expense Evaluation and Control - Sandi Jerome Style
Great A Method of Getting to the Bottom of Complex Expense Categories
With Sandi Jerome, Sandi Jerome Computer Consulting
Moderated ByMike Bowers, DealersEdge

Sandi Jerome, Sandi Jerome Computer Consulting
Sandi Jerome consults and lectures on automotive business management,expense control, profit retention, and computer utilization for CPA firms, state associations, AICPA, 20 groups, manufacturers, and DMS providersand has been a top 10% rated workshop speaker at NADA. She has helped hundreds of dealerships select DMS systems and then survive during and after the conversion process. She is a CPA with a degree in accounting, but also has the unusual combination of 3 years in F&I and another 2 years as an assistant general manager. She has developed numerous technologies and publications for the industry including a new DMS system, DealerStar, that is being used by seven dealerships and will be released nationally in 2012-2013.
Sandi Jeromewww.DealerStar.comwww.superconsultinggroup.comwww.sandijerome.comsandi@sandijerome.comDirect line: 360-504-5601Voicemail - cell phone notification 360-406-5062 Ext. 706Fax 503-715-5600

www.sandijerome.com – [email protected]
Dealership ExpenseEvaluation and Control
Sandi Jerome Computer Consulting

The big “E” - Expenses
Who can reduce expenses the most?1. Controller/Office Manager/CFO2. Dealer/GM3. Departmental Managers
Can you reduce expenses?
How can you help?

How can we help?
�Our managers need information – not data�Each company needs different information�How do we determine what they need?
�Are they using it?�Do they understand it?

Expenses – the old Method
Old reporting – why trending doesn’t work….we sold more cars so commissions are higher…
DESC JAN FEB MAR APR(blank)
COMPENSATION VEH - USD $9,216.50 $20,198.79 27,872.34$ $19,149.21COMPENSATION VEH-PONTIAC$3,384.23 $8,453.41 11,044.27$ $12,387.36COMPENSATION VEH-CADILLAC$5,438.23 $24,098.15 12,858.01$ $9,961.17
$18,038.96 $52,750.35 51,774.62$ $41,497.74

But we detail every account…
�That’s nice�Who cares?�Who has the time?�Why?

Case Study -Item Expense Analysis Expense Account Name: Other Supplies
Account number (s) 61
Item description Car Wash Soap
Vendor(s) ABC Supply
Average monthly price$ $1297
Metric $.50 per wash
Physical observation: Two 5 gallon drums stored outside by the car wash (extra, free to take home)
Eliminate – do we really need this? Yes
Reduce – is there a way to use less?1. Yes, it should be diluted (according the car wash manual and supply
instructions)2. Buy from a better source3. It is being spilled when poured into the car wash. Get a funnel
Protect – is it being stolen? Yes, it should be stored in the parts department
Who is making surewe’re not spilling orusing full strength?Shirley?

Expenses - Exercise
Delivery Expense__________________________________

Case Study – Gas Expense
�Gas for demonstration rides�What is the route? �Could it be shorter?�Parts/valet routing software
�Gas for delivery�Gas in company cars - demos
�Can we buy it for less?�Can we control it better?

Categories of Expenses
�Objective - What Category?�Variable�Fixed�Budget

Category – Are these Variable?
Variable Expenses� Sales Commissions ___%� Advertising $_________� Floor plan $_______� Delivery Expense $______
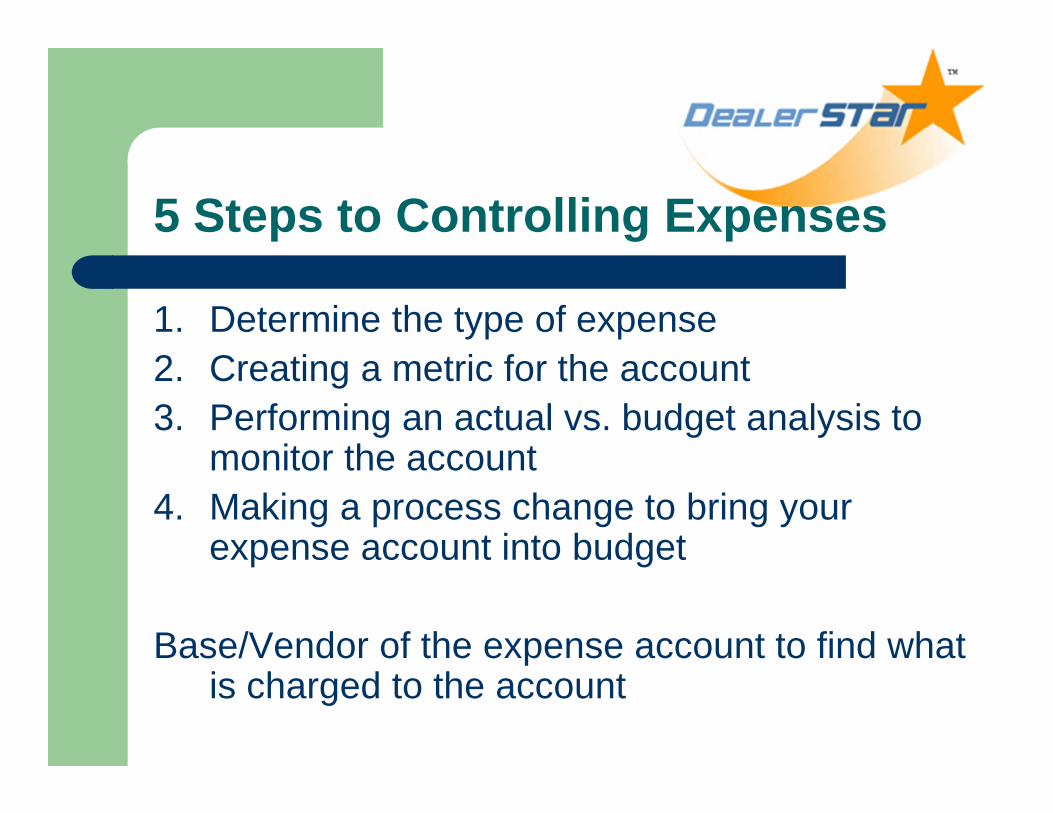
5 Steps to Controlling Expenses
1. Determine the type of expense2. Creating a metric for the account3. Performing an actual vs. budget analysis to
monitor the account4. Making a process change to bring your
expense account into budget
Base/Vendor of the expense account to find what is charged to the account

Base/Vendor AnalysisStep 1Base Account

Vendor – Item Analysis
Double clickto get item
Only work on one item today; toner

Vendor Analysis
Case Study -How do we give them the answer?

Sales Commission - Step 1 Benchmark 23% Pay Plan Analysis - Step 2Step 3 - Car Deals New UsedGross Profit 232,417.00$ 297,342.00$ Gross Profit 1,942.00$ From car deals 63,433.00$ 87,343.00$ Pack 450.00$ Percentage 27% 29% Payable Gross 1,492.00$ Deals paid per pay plan Percentage 25%Calc commissions gross 192,323.00$ 201,343.00$ Commission 373.00$ Commissions 39,332.00$ 37,343.00$ Percentage 19%Percentage 20% 19% OkayMini Deals 40,343.00$ 95,999.00$ Step 4Commission 27,333.00$ 43,232.00$ Other Expenses from payrollStep 5 - Apply Benchmark 68% 45% Spiffs 1,850.00$ 2,950.00$ Total Commissions 79,191.00$ 95,980.00$ Bonuses 3,433.00$ 11,223.00$ Percentage 34% 32% Minimum wages 7,243.00$ 1,232.00$ Benchmark 23% 23% Total Other 12,526.00$ 15,405.00$ Profit Aim 25,735.09$ 27,591.34$ Percentage 5% 5%
Total Profit Available 53,326.43$ 12
639,917.16$
Internal Control
ExpensesGross Profit DESC JAN FEB MAR APR
(blank)
COMPENSATION VEH - USD $9,216.50 $20,198.79 27,872.34$ $19,149.21COMPENSATION VEH-PONTIAC$3,384.23 $8,453.41 11,044.27$ $12,387.36COMPENSATION VEH-CADILLAC$5,438.23 $24,098.15 12,858.01$ $9,961.17
$18,038.96 $52,750.35 51,774.62$ $41,497.74
Best way to learn?

Time and Training
�Training – how to get it and use it�Super Excel training�Super Controller Guide – whole dealership�Super Controller II – Expenses�DMS system ADP, R+R – coached, Internet training
Doing your training doesn’t mean that you don’t know your job – it means that you know your job could be more!
I don’t have the time!

Expense Projects
� Walk around � Trash can full of forms (toner, copies?)� Fans left on – shop, AC at night� Cleaning crew cleaning laundry mats
� 52 weeks – jackets only in winter (vacation?)� First aid kit, fire department inspection (aspirin?)
� Lower cost DMS system – Final 4 DMS Decision Report by Sandi Jeromehttp://store.dealersedge.com/partner-stores/sandi-
jerome.html

Reduced Costs, Supplier Optimization and Guaranteed Results!
©2007 Performance Management Group – All Rights Reserved. 10
Expense Categories
Finance Services Office Services Facilities Services Automotive Prod/Serv Telecom Services
High Return Categories
Check Processing Advertising- Janitorial Services Shop Supplies Cell Phones
Credit Bureaus Food Services Janitorial Supplies Detailing Supplies Local, LD, Data
Credit Card Processing Music & Messaging System Hazardous Waste Fluids - Lubricants Telecom Maint.
Ins, Prop & Casualty Office Supplies/Toners Waste & Recycling Aftermarket Accessories Tele Systems
Ins, Workers Comp Printed Materials Maintenance-Doors Auto Glass & Installation VOIP
Key Track Systems Uniforms Maintenance-Lighting Wheel Wts & Tire Repair
Longer Turn Times- Good Return
Courier Services Auto Rentals Fire Safety, Monitoring Aftermarket Services
Employee Benefits Business Services Landscape Services Body Shop Repair Services
Information Services Computer Hardware Maintenance-Car Wash Body Shop Supplies, Mat
Insurance, Health Marketing Products Maintenance-Electrical Car Wash Chemicals
Marketing Services Office Equipment Maintenance-HVAC Fuel
Payroll Services Office Furnishings Maintenance-Prking Lot Hardware
Transp, Small Pkg. Records Management Maint-Plumbing/Drains Non-OE Parts
Software Security Patrols Tooling
Temporary Help Sec Systems (Electron)
Travel Signage
Utilities

Reduced Costs, Supplier Optimization and Guaranteed Results!
©2007 Performance Management Group – All Rights Reserved. Purchasing & Change Mgmt 101 in Auto Dealerships 11
Sample Dealer Expense Reduction Opportunity ResultsExpense Category % Savings Expense Category % Savings
Office Supplies 25.29% Waste & Recycling 22.82%
Check Processing 40.27% Marketing-Direct Mail 42.85%
Credit Card Processing 9.81% Maintenance-Lighting 20.41%
Printed Products 28.45% Telecom (Local, LD, Data) 37.61%Auto Rentals 8.57% Insurance-Work Comp. 11.19%Maintenance-HVAC 30.56% Auto Parts - Glass 21.07%
Credit Bureaus 27.88% Uniform & Linen Services 23.08%Auto Aftermarket Access. 10.31% Advertising-Internet 16.05%
Vehicle History Reporting 64.79% Insurance, Property/Cas. 25.47%Janitorial Services 27.43% Telecom-Cell 27.12%Telecom-Systems 14.14% Transportation-LTL 17.50%Lubricants and Fluids 9.39% Auto Parts - Tires 2.66%Maintenance-Car Wash 44.13% Utility Services and Audit 10.48%Janitorial Supplies 27.93% Waste, Hazardous 50.06%
Office Supplies-Toners 83.77% Shop Supplies 17.21%Auto Parts 13.22% Auto Parts - Non Orig. Eq. 7.95%Security-Video Surveillance 28.83% Food Services 12.60%Records Management 62.62% Maintenance-Doors 14.42%Body Shop Paint/Supplies 13.45% Drug Screens 18.52%Office Equipment/Postage 15.65% Drain Pump Services 8.79%
Detail Supplies 9.53% Spot Buys 15.03%
Total Avg.
Annual Cost
Savings % =
22.61%

Reduced Costs, Supplier Optimization and Guaranteed Results!
©2007 Performance Management Group – All Rights Reserved. Purchasing & Change Mgmt 101 in Auto Dealerships 16
Category Approach - Considerations
• Quick Turn Categories – Do first to gain momentum (vehicle history, check processing)
• Contract Driven Categories – 90-120 days out from expiration Dates (uniforms, office equipment)
• Longer Turn Categories – High item content, much more involved analysis and quote time (shop supplies, print, office supplies)

Reduced Costs, Supplier Optimization and Guaranteed Results!
©2007 Performance Management Group – All Rights Reserved. Purchasing & Change Mgmt 101 in Auto Dealerships 17
Develop Your Strategic Plan
Actual Cost Reduction Results
Annual Cost Reduction Plan
Yr 1- Prioritized Expense Categories to Reduce Expenses On

Reduced Costs, Supplier Optimization and Guaranteed Results!
Gather Information at Category Level
• 12 Month Spend – Pull A/P information to see how much was spent in 12 mos. and the suppliers utilized in each category
• Develop List of Supplies/Services – Select top 10, top 50 or top 100 items used and the last price paid from your most recent invoices (in Excel)