Turn Accelerator | CRM | DMS| the end of Dealership Management Systems
Dealership Evaluation Systems
1
Originally Submitted to the Journal of Retailing
Dealership Evaluation Systems
Carlos Mora, PhD1
Trevor Leutscher, PhD2
Abstract
Car dealers perform a series of activities whose ultimate purpose is to sell
vehicles and services to customers. The activities take place within a framework
of business agreements and legal requirements. A dealership evaluation system
(DES) ascertains whether the activities achieve the business goals and meet the
requirements during the time period observed by the evaluation. Activities,
business goals, and requirements are the three basic elements of any DES. How
good is the evaluation at measuring dealer behavior, discovering and
communicating problems, and coordinating solutions? How effectively do the
manufacturers and dealers use dealer evaluations?
In this paper we review methodological aspects of DESs, examine how
manufacturers and dealers use the results of the evaluation, discuss serious
problems with both methodology and uses, and report on two scientific studies of
actual DESs. Finally, we present an alternative evaluation methodology, one that
views dealers as the main users and beneficiaries of the DES without neglecting
the legitimate goals that manufacturers have concerning business results and
compliance with agreements.
1 Dr. Mora is a research faculty, Eastern Michigan University College of Business,
[email protected] 2 Dr. Leutscher is a postdoctoral fellow, University of Michigan, [email protected]

Dealership Evaluation Systems
2
What is a Dealer Evaluation System?
Car dealers perform a series of activities whose ultimate purpose is to sell
vehicles and services to customers. The activities take place within a framework
of business agreements and legal requirements. Business agreements are
negotiated between dealers and manufactures on a regular—usually annually—
basis and generally include sale volumes, marketing, quality goals, and branding
issues such as signage. Legal requirements are more permanent and involve
compliance with local, state, and national laws and ordinances.
A dealership evaluation system (DES) ascertains whether the activities achieve
the business goals and satisfy agreements and requirements during the time period
observed by the evaluation. Activities, business goals, and agreements are the
three basic elements of any DES. How good is the evaluation at measuring dealer
behavior, discovering and communicating problems, and coordinating solutions?
How effectively do the manufacturers and dealers use dealer evaluations?
Dealership
Activities
Legal
Requirements
Business Goals
Dealership
Evaluation
System
Met?
Achieved?
Improve
Figure 1 Purposes of dealership evaluation systems
Dealership Evaluation Systems
3
A DES may cover a broad or narrow spectrum of activities. Acura’s Excel,
Cadillac’s Standards for Excellence, DaimlerChrysler’s Five Star, and Ford’s
Blue Oval are examples of DESs with a broad scope. On the other hand, surveys
measuring customer satisfaction with repair services or financial systems tracking
warranty expenditures are examples of DESs with a narrow focus3.
It is difficult to evaluate activities. To do so one needs a means of recording the
activities and a set of standards to judge the merits of the activity. Referees
overseeing professional sports or judges assessing Olympic competitions are
experts at evaluating activities. When it comes to dealerships there are neither
referees nor judges. To fulfill its mission, a DES evaluates traces left by the
activities on the business goals and on the degree of compliance with the
requirements. A trace left on the business goals would be the level of customer
satisfaction. A trace left on the requirements would be the level of compliance
with signage specifications.
Cause-and-Effect Relationships
A DES does not evaluate the activities themselves, only their effects. If there is a
clear cause-and-effect relationship between activities and results, then knowing
the effects we can make valid inferences about the effectiveness of the activities:
where to improve and where to keep the effort.
Evaluations that focus on results have notorious weaknesses.4 For example, good
or bad sales may be the result of general economic conditions or some other
external factor. So, a dealership that shows good sales numbers will get good
grades in the evaluation even if its activities are deficient.
Origins
In some cases the evaluation system is an adaptation of a more general system
like ISO 9000 (or one of the many derivatives of this international quality
standard), but most likely it is created by retail experts working for the original
equipment manufacturer (OEM) or a commercial firm that specializes in dealer
evaluation. In many cases the experts seek input from dealer associations and
regional dealer supervisors. For practical, political and financial reasons,
consulting organizations frequently collect data, report findings, and facilitate
remedial action on behalf of the OEM.
3 Recently, Jaguar/Land Rover launched an improvement program targeting service quality; a DES
focused on service. 4 In automotive manufacturing, final inspection was the dominant model for quality control until
the Japanese demonstrated that it made more sense to focus on the processes. It is easier to locate
the true cause of a failure, or potential failure, in the process than in the final product.
“… if there is a clear cause-and-effect relationship we can make valid inferences on where to improve and where to keep effort.”
Dealership Evaluation Systems
4
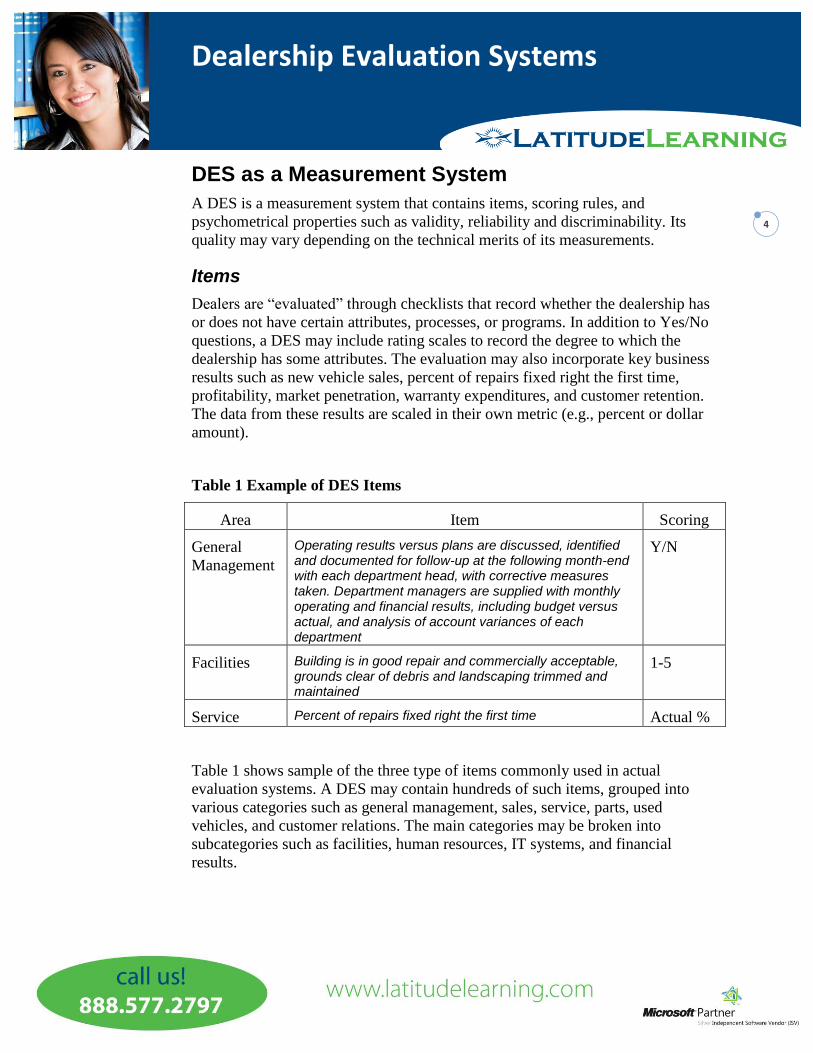
DES as a Measurement System
A DES is a measurement system that contains items, scoring rules, and
psychometrical properties such as validity, reliability and discriminability. Its
quality may vary depending on the technical merits of its measurements.
Items
Dealers are “evaluated” through checklists that record whether the dealership has
or does not have certain attributes, processes, or programs. In addition to Yes/No
questions, a DES may include rating scales to record the degree to which the
dealership has some attributes. The evaluation may also incorporate key business
results such as new vehicle sales, percent of repairs fixed right the first time,
profitability, market penetration, warranty expenditures, and customer retention.
The data from these results are scaled in their own metric (e.g., percent or dollar
amount).
Table 1 Example of DES Items
Area Item Scoring
General
Management
Operating results versus plans are discussed, identified and documented for follow-up at the following month-end with each department head, with corrective measures taken. Department managers are supplied with monthly operating and financial results, including budget versus actual, and analysis of account variances of each department
Y/N
Facilities Building is in good repair and commercially acceptable, grounds clear of debris and landscaping trimmed and maintained
1-5
Service Percent of repairs fixed right the first time Actual %
Table 1 shows sample of the three type of items commonly used in actual
evaluation systems. A DES may contain hundreds of such items, grouped into
various categories such as general management, sales, service, parts, used
vehicles, and customer relations. The main categories may be broken into
subcategories such as facilities, human resources, IT systems, and financial
results.
Dealership Evaluation Systems
5
Scoring Rules
The individual items—Yes/No, rating scale, and actual values—are combined
using ad hoc rules to obtain a total score. Sometimes, partial scores are calculated
for specific categories and subcategories of the dealership. Items may be weighted
to compute the total score and sub-scores. Typically, item weights are set
according to criteria specified by the OEM, that is, the weights reflect OEM, not
dealer, preferences.
Although questionnaire scoring is a highly technical matter involving advanced
statistical and psychometrical concepts, often times the ad hoc rules used to score
a DES ignore technical requirements. The default method is to assign 1 to Yes
and 0 to No and add the ones to obtain the sub-score of the Yes/No questions.
Rating scales are scored by assigning 1 to the lowest rating (such as “not at all” or
“completely disagree”) and successive digits to successive ratings. For example, if
the scale contains five ratings ranging from “completely disagree” to “completely
agree” the highest rating gets a 5. Individual items are added together to obtain
the rating scale sub-score. Scoring business performance results presents
formidable challenges. The default option is to group results into discrete
categories, such as three or five levels of warranty expenditures, and treat those
categories as rating scales.
A more difficult aspect is how the individual scores ought to be combined to
produce total or partial scores. Sometimes a simple sum or average is used; other
times a more complicated aggregation schema is employed. For example,
different categories and subcategories may be allocated different percentages
representing the relative importance of the area. These are rather naïve scoring
manipulations that most likely violate principles of measurement theory.
Psychometrical Properties
Many of the DES items refer to activities undertaken by humans—managers,
advisors, technicians, staff—working at the dealership. In the introduction we
noted that a DES does not measure the activities, but their effects on business
results. Therefore, many items deal with human activities such as meetings,
preparation of reports, and cleaning of facilities. For example, the first item in
Table 1 does not measure how productive, effective, or good the discussion was
(that would be an evaluation of the activity); but whether it took place or not
(which is an evaluation of results). Since measurement of human behavior
occupies such a central role in DES, then the psychometrical properties of the
instrument should be statistically estimated and reported.5
5 See Nunnally, J. C. and I. H. Bernstein (1994). Psychometric theory. New York, McGraw-Hill.
Dealership Evaluation Systems
6
Validity
The instrument should be valid, that is, it should actually measure what it claims
to measure. For example, if a section deals with workers’ motivations then it
should measure motivation and not satisfaction or some other construct.
Reliability
The results should be consistent, not random. Reliability is a property of the items
and, by aggregation, of the instrument altogether. If the items are not reliable, the
instrument cannot be reliable. The item should be constructed in a way that it
triggers—under the same or similar conditions—the same response at different
times. To the extent possible, items should address a single topic and should not
be ambiguous. The first item in Table 1 does not show these properties. It is, in all
likelihood, a very unreliable item. Some people would answer “Yes,” others “No”
depending upon how they interpret the wording of the item because its wording
offers many interpretations.
Discriminability
The instrument should produce different results when applied to dealers that are
different in terms of the relevant attributes. In other words, the instrument should
be able to tell apart dealers that are actually different.
Customer satisfaction indices have notoriously low discriminability. On a scale of
1 to 100, most dealers score above 80 or even 90 because the items are
constructed in such a way that they tend to trigger the same answer from all the
respondents. Although in theory the scale ranges from 1 to 100, the actual range
of variation is, at the most, 20 points. In a narrow range, the difference between
dealers may be only a few tenths of a point, well within the proverbial “plus or
minus” error of measurement.
Psychometrical properties of DESs are seldom reported.
DES and Measurement Theory
Strictly speaking a DES—including items and the scoring schema—represents a
mathematical measurement model of the dealership. The scientific study of
measurement models, its properties, quality, and justification, is the province of
measurement theory.6 No DES, at least not the ones that we have studied, meets
the requirements of measurement theory such as representativeness, uniqueness,
6 A comprehensive, albeit highly technical, presentation of measurement theory can be found in
the three-volume of foundations of measurement by Krantz, D. H., P. Suppes, D. Luce, and A.
Tversky (1971, 1989, 1990). Foundations of measurement. New York, Academic Press.
“Customer satisfaction indices have notoriously low discriminability.”
Dealership Evaluation Systems
7
and meaningfulness. In measurement theory, these requirements take the form of
theorems that need to be proved in order to demonstrate the measurement model.
To measure an attribute of an object is to assign a number to that object. The
attribute is “represented” by the number. For example, to represent the
individuality of a professional basketball player, the team assigns a unique
number to that player. The only requirement is that no two different players have
the same number. No other property of the player, such as height or effectiveness,
is represented by the number. Clearly, the numbers cannot be added or multiplied.
The only mathematical operation that can be performed is the comparison for
equality. Player X scored 20 points in the game today and player Y scored 20
points in the game on Monday. Are the player numbers equal (X = Y)? If so, then
it is the same player, if not, then they are different players.
To represent the quality of the service department, we assign a number to that
department. In this case the number represents an order relationship such that if
dealership X gets a higher number than dealership Y, it means that the quality of
the service department of X is better than that of Y. The numbers assigned to
basketball players cannot be used to rank order the players, but the numbers
assigned to service departments can be used to rank order service departments. In
each occasion, the numbers obey different mathematical properties.
Can the quality of the service department be added to the quality of the sales
department? This is not a simple question. Let’s consider the case of temperature
addition. If we have two jars of water at different temperatures and pour them into
a larger container, the temperatures do not add up. Why should we assume that
quality is additive?
Representativeness deals with the conditions under which it makes sense to add7
numbers obtained from measurement operations. For example, consider two
dealerships, A and B and their measurements of service quality, X, and sales
quality, Y, being as follows:
85,60
80,70
BB
AA
YX
YX
If B is considered, overall, a better dealership than A, then addition of quality
cannot be justified. In most cases DES developers overlook the representativeness
of their measurement models. This oversight is not exclusive of DESs; it is rather
a common omission of many measurement systems.
Uniqueness refers to the scale of measurement and the admissible transformations
of the scale. In temperature, for example, the scale of measurement can be
7 Or multiply, or, in general, to combine them using mathematical operators.

Dealership Evaluation Systems
8
established with an arbitrary zero point and an arbitrary unit of measurement. The
Celsius scale has an arbitrary zero temperature and an arbitrary unit equal to one
Celsius degree. The Fahrenheit scale has a different zero point and a different unit
of measurement. The scales are related through a linear transformation, that is, we
can obtain Celsius from Fahrenheit, and vice versa, through a mathematical
equation. In this case we would say that measurement of temperature is unique up
to a linear transformation.
Meaningfulness refers to the utility of the measurement model, or how well the
mathematics of the measurement model corresponds to the attributes and
relationships of the object being measured.
Most DESs do not satisfy the requirements of measurement theory. Although very
important functions and processes of the dealership are addressed in the typical
DES instrument, the scoring rules they use and the assumptions about
measurement requirements are questionable and may compromise the whole
evaluation. It is possible that these types of instruments have practical value for
both OEM and dealers, but before we put too much faith in their numbers, it is
incumbent on the developers of such instruments to tell us how good those
numbers are.
Uses of DES
It is almost always the case that the DES is sponsored by the OEM and used for
one or more of the following three purposes:
1. Award, suspend, or withdraw certification in a dealership recognition
program,
2. Distribute financial incentives,
3. Guide improvement programs.
The criteria for certification reflect OEM priorities such as protecting the brand
image, enforcing business agreements between OEM and dealers, and setting
sales targets.
Signage, facilities appearance and maintenance, marketing, and
customer relations programs are examples of criteria aimed at
protecting the brand image.
Warranty expenditures, training of sales personnel and technicians,
parts inventory, and percent of repairs performed right the first time
are examples of criteria aimed at enforcing agreements.
Market share, new vehicle sales, and incentive expenses are examples
of criteria aimed at setting sales targets.
Dealership Evaluation Systems
9
Distribution of financial incentives is usually tied to the certification program,
although they do not necessarily go together. The OEM may decide to distribute
incentives on an ad hoc basis such as participation in a tire campaign or
implementation of a customer relationship program. In those cases, the incentives
are not tied to certification. The incentives are partially or completely funded by
fees collected from dealers that participate in the DES.
The third use, a guide for improvement programs, is not so easily understood or
explained. In fact—we argue in this paper—most often the third objective is
poorly understood and seldom achieved. The mere act of declaring that the
purpose of an evaluation system is to help dealers improve does not mean that the
system actually helps dealers improve. To buttress our point, one needs only look
at dealers that have attained high DES scores and certification but show worse
business results than similar dealers that have attained low DES scores or may
even have failed certification altogether. There seems to be a distressing
independency between the variables and processes addressed by DES and the
variables and processes that actually help dealers improve their business results.
Lack of relationship between evaluation scores and business outcomes is common
to retail surveys. Referring to the American Consumer Satisfaction Index, the
loyalty expert Frederick Reichheld8 noted that “In general, it is difficult to discern
a strong correlation between high customer satisfaction scores and outstanding
sales growth. Indeed, in some cases, there is an inverse relationship; at Kmart, for
example, a significant increase in the company’s ACSI rating was accompanied
by a sharp decrease in sales as it slid into bankruptcy.”
Problems with DES
Current DESs have serious methodological problems. These problems are
technical and can be corrected using proper measurement techniques. They are the
lesser problems. More worrisome are the “political” problems, that is, the
problems created by the preferences and priorities of the power structure behind
the DES.
A DES does not come into existence by accident; instead it is the result of
decisions made by people with the power to make those decisions and impose
them on the dealer network either by force or by persuasion. In essence, a DES
reflects what is deemed important to the OEM.
There are five main problems with DES. Three of them are methodological and
two are political.
Weak measurement properties
8 Harvard Business Review, December 2003, Reprint R0312C
Dealership Evaluation Systems
10
Ignorance of local conditions
Absence of cause-and-effect relationships: the theory of the dealership
Wholesale versus retail priorities
Lack of significance to the dealer
Weak Measurement Properties
As discussed above, DESs fail to meet psychometric requirements of evaluation
instruments or general properties of measurement theory. The items, scoring
rules, and measurement models can be significantly improved.
Ignorance of Local Conditions
The absence of a well-established relationship between DES scores and business
results begs the question of what is wrong with the evaluation system. One
possibility is that the DES needs some fine tuning. Either the scoring method is
not good or some critical variables have been left out.
Another possibility is that no DES could ever capture all the complexity of the
retail environment. Local factors or evolving market forces like the Internet may
dictate that what is good in one region or market is not so good in another. Hence,
no matter how hard one tries to fine tune the DES or to improve the scoring
method, it will always fail to account for local conditions or evolving market
forces. If that were the case, then it would make more sense to view DES results
as partial input to be used by dealership managers to conduct self-evaluations and
guide their improvement plans, not as an external evaluation tool that produces
definitive results.
Absence of Cause-and-Effect Relationships
DESs have weak power to guide improvement efforts because the link between
critical behaviors and questionnaire results cannot be established. This point
needs careful consideration. An inventory of the skill set needed to run a
dealership would include advertisement, customer relationships, facilities
planning, finance, forecasting, human resources, inventory management, taxes,
technical know-how, and many others. These skills and competencies are
addressed in one way or another by most DESs. What is missing is how they
interact with one another and how they impact business goals.
Medical diagnosis offers a compelling example of the link between test results
and critical behaviors. Physicians study the signs and symptoms revealed by
medical tests and prescribe medicines, diets, surgical procedures, or exercise
programs to their patients. Taking the medicines in the prescribed dosages,
“DESs have weak power to guide improvement efforts because the link between critical behaviors and questionnaire results cannot be established”
Dealership Evaluation Systems
11
following the recommended diet, and practicing the exercises are the critical
behaviors that help patients to improve their health. If the medical tests were
faulty then the signs and symptoms would be wrong and the doctors would be
unable to make proper recommendations.
In medicine, the skill to properly read the signs and symptoms uncovered by tests
and other diagnostic tools is called semiotics. The tests work because they
embody scientific theories of human anatomy and physiology that explain
biological interdependencies. We do not have the semiotics of dealerships
because the interdependencies of all the relevant variables in the life of the
dealership have not been studied. What is lacking is a good theory of the
dealership. A theory of the dealership would identify the critical variables in all
areas of interest and how those variables impact business goals.
Wholesale versus Retail Priorities
Dealers and OEMs have compatible albeit not identical interests. Both are
interested in selling cars and parts, the former at the retail level and the later
wholesale. Both are interested in satisfied and loyal customers. It makes sense
then to expect that dealers and manufactures would cooperate in efforts to
improve and sustain the end customer experience in order to increase satisfaction,
loyalty, and profits.
It is unfortunate that in many instances the relationships between dealers and
manufactures have been tense, even antagonistic. The antagonism is manifested in
lawsuits, reward/punishment programs, and conflicting priorities. For the
wholesaler, given the magnitude of its operation, the key driver is volume. For the
retailer, given the relatively high cost of doing business the key driver is profit.
Higher profit at the retail level threatens volume, more so if strong competition
from other manufacturers colors the business landscape.
The antagonism has been documented in books that devote whole chapters to the
dealer versus manufacturer confrontations. In 1970, Edward Ayres published a
study on the impact of the automobile on American life and priorities.9 Chapter 3
deals with relationships between dealers and manufacturers; it does not paint a
rosy picture.
We find evidence of antagonism in warranty systems. A recent study published by
the Center for Automotive Research10
notes the fact that many warranty systems
are designed to monitor dealer claims and deter fraud despite the fact that it is
only a miniscule percent of dealers who would try to commit fraud. The real
culprits of warranty problems are product quality and the inadequacy of systems
9 Ayres, E. (1970). What’s good for GM…. Nashville, TN, Aurora Publishers Incorporated
10 http://www.cargroup.org/documents/WarrantyReportFinal-09-22-05.pdf

Dealership Evaluation Systems
12
to report root causes of warranty claims. The appropriate remedial action would
be a smooth and timely flow of good data to design and manufacturing sites to
improve product quality, better coding of failure incidents, and better training of
repair and diagnostic technicians at the dealership. As it is, the data that flows to
design and manufacturing is highly likely to contain errors.
Additional evidence of opposing priorities is offered by the emphasis that OEMs
place on the development of parts ordering systems versus the training of parts
managers. The OEM would place more emphasis on the parts ordering systems
because it helps expedite fulfillment of part orders, while the dealers would place
more emphasis on training because it would help the dealer run a better parts
department.
According to J.D. Power, “Parts managers are generally satisfied with parts
quality and ordering systems but are more critical of training programs and
pricing policies. For example, two-thirds of the parts managers surveyed rated the
parts ordering system as truly outstanding/excellent, compared with only one-
third rating their manufacturer's parts department training programs as
outstanding or excellent.”11
If the relative priorities of the OEM and dealers are different, even antagonistic,
the evaluation system will be conceived as an enforcing tool by the OEM and as a
threat by the dealers. In that case dealers will devise ways of “beating the system”
and the DES will do more harm than good to all the parties.
Conversely, if both OEM and dealerships agree that customer satisfaction and
loyalty are their most important priorities they will likely decide to co-create
value for the customer at the dealership. In that case, the DES may become the
tool that helps dealers manage the processes that contribute the most to the
creation of the “delight” experience among their buying customers.
Lack of DES Significance to the Dealer
The Federal Government collects income information using questionnaires such
as the 1040 Form. It is designed to meet government’s revenue collection needs.
No taxpayer derives any personal benefit (other than fulfilling an obligation) from
the 1040 Form. It doesn’t need to be so. Personal finance programs such as
Quicken™ or Microsoft Money™ also help users fulfill their reporting
obligations to the government. More importantly, those programs help users
manage their finances. Those types of programs have great significance for the
users.
11 J.D. Power and Associates (1998) Parts Managers' Study: Best Practices in a Competitive
Market.
Dealership Evaluation Systems
13
The typical DES today resembles more a 1040 Form than a program like Quicken
or Money. It does not have much local significance for dealers. For example, it is
quite possible that the inventory of special tools in the service department directly
impacts technician satisfaction and, indirectly, customer satisfaction. However the
typical DES does not help the service manager control the inventory of special
tools even though the inventory of special tools is, in all likelihood, a critical
variable for dealership operations.
How do the problems, both methodological and political, affect DES effectiveness
in real life? To investigate this issue, we conducted two studies. Study 1 contains
a detailed analysis of items and scoring rules used by a DES. We also studied the
relationship between DES scores and dealer business results. Out of more than
107 items used in the DES, only 17 show consistent relationships with business
results.
Study 2 deals with the development of DESs. In that study seven related DESs are
compared in terms of the service and parts variables used in each of them. The
DESs are related because they were developed by regional offices of the same car
manufacturer. We found little similarity among those systems, despite the fact
that they address the same vehicles, the same policies, and the same systems.
Study 1: Evaluation of a DES
This study examines in detail a standards-based DES. The main instrument is a
compliance questionnaire addressing each standard with a set for questions/items.
In total the questionnaire contains 282 Yes/No items associated with 184
standards grouped by dealership departments. We limited our analysis to
standards associated with only one Yes/No item. This restriction reduced the
number of standards/items to 107 grouped by departments as follows:
General management, 32 items
Vehicle Sales, 28 items
Parts, 23 items
Service, 24 items
Table 2 presents a sample of the items from the assessment. The instrument was
developed by the dealer council with input from the OEM field operations
division. A consulting organization was contracted to audit dealers and provide
on-site technical support based on the results of the evaluation.
Dealership Evaluation Systems
14
Table 2. Sample standards from the dealer assessment instrument
General Management
Dealership operating hours are equivalent to other major OEM dealers in the local
trade area.
The reception area is attractive, clean and has a suitable waiting area with access
to a telephone.
Vehicle Sales
Dealer maintains new vehicle inventories to adequately serve the market potential
and satisfy the business plan.
Dealership has a regularly scheduled in-house product sales training meeting at
least quarterly.
Parts
Service parts counter is separate from retail parts counter.
A minimum of one non-customer (potential customer) survey is conducted each
year. This is to be a coordinated effort with the Parts Sales Manager for strategy
planning.
Service
Dealership maintains a system to provide after hours emergency service with a
phone number clearly posted at the entrance of the facility.
Service Manager or Supervisor inspects all repairs requiring four hours or more
labor or involving major components and systems.
The dealers complete a self-assessment using the instrument at the beginning of
the year. During the year a consultant visits the dealership and validates the self-
assessment. In this study we use the validated assessment responses in all
analyses. We refer to the validated assessment as the standard compliance score,
or simply as the compliance score.
Independently of the compliance scores, we also obtained eight performance
measures: vehicle sales, part sales, market share for three vehicle lines, and
customer satisfaction for three departments (sales, service, and parts).
Methods
Complete dealer compliance and performance measures from 192 dealers were
obtained. The scoring scheme for the compliance is a weighted sum of Yes
responses, where the weight is based on the OEM’s appraisal of the importance of
the standard. We refer to these measures of dealership compliance as the OEM-
score. Additionally, we also derived another dealership compliance score using a
stochastic cumulative scaling (SCS) technique12
on the assessment items.
12
Coombs, C. H. & Lingoes, J. C. (1978). 'Stochastic Cumulative Scales.' In Theory Construction
and Data Analysis in the Behavioral Sciences, ed. S. Shye. San Francisco: Jossey-Bass, pp. 280-
298.
Dealership Evaluation Systems
15
Compliance Measures
The SCS score is computed by converting the Yes/No items for all dealers into a
response matrix with dealers as the rows and items as the columns and reordering
rows and columns so that the rows with the greatest numbers of Yes responses are
at the top and subsequent rows show decreasing number of Yes responses.
Similarly, the left-most column is the one with the greatest number of Yes
responses, and subsequent columns show a decreasing number of Yes responses.
If we let a Y stand for Yes and a blank for No, then a triangular pattern will be
revealed provided that the data matrix is stochastically cumulative. Figure 1
illustrates this property.
Dealers Items
1 2 3 4 5 6 7 8 9 10
Dealer A Y Y Y Y Y Y Y Y Y Y
Dealer B Y Y Y Y Y Y Y Y Y
Dealer C Y Y Y Y Y Y Y Y
Dealer D Y Y Y Y Y Y Y
Dealer E Y Y Y Y Y Y
Dealer F Y Y Y Y Y
Dealer G Y Y Y Y Y
Dealer H Y Y Y
Dealer I Y Y
Figure 2 Stochastic cumulative matrix
There is no guarantee that the data matrix will be stochastically cumulative. In
Figure 2 above, Dealer G has item 9, although it did not have items 5, 6, 7, and 8
which are stochastically more likely than item 9. That is a violation of the
stochastically cumulative property.
In real life, most matrices would have some degree of violation that must be
measured in order to decide whether the matrix is stochastically cumulative or
not. The SCS technique allows the user to compute an index called reproducibility
which is used to decide whether to accept the matrix as stochastically cumulative
or not.
SCS Item Scoring Procedure
For each item the frequency of No responses was converted to a probability (i.e.,
count of No responses divided by the number of dealers). These probabilities
Dealership Evaluation Systems
16
were converted to z-scores using the normal distribution (i.e., applying the
function for the inverse of the standard normal cumulative distribution). The items
are re-scaled by adding the absolute value of the lowest item to all the items. Note
that this procedure assigns a higher score to items that are rare, that is, items that
have a high number of No responses. The logic for this numerical assignment is
as follows. Items with a relatively higher number of No responses are more
difficult to attain. That’s precisely the reason why so few dealers have attained
that item. Furthermore, if the items are stochastically ordered, then the more
difficult items indicate a higher degree of internal organization and ability.
Standardized tests such as the SAT or ACT use the same principle to make
inferences about the scholastic ability of students.
The main difference between SCS scores and the OEM-score is the relative
weight of each item. According to the OEM-score, each Yes item gets a value
proportional to the importance the OEM places on the associated standard.13
According to the SCS-score, a Yes item gets a score that depends on the entire
data matrix. In other words, the OEM-score imposes a priori a numerical value on
the responses, while the SCS-score derives the numerical values a posteriori.
Each dealer obtains a SCS-score which is the sum of the items z-score for all of
its Yes items. To illustrate, suppose that the z-scores for items 1, 2 and 3 are -1.5,
-0.2 and 2.0. To re-scale we add 1.5 to all the items thus obtaining 0, 1.3, and 3.5,
respectively. Further, suppose that Dealer A attained Yes in all three items, Dealer
B attained Yes in items 1 and 2 and Dealer C attained Yes only in item 1. Their
scores would be 4.8, 1.3 and 0, respectively.
Performance Measures
Eight dealer business performance measures were obtained from the market
research and the field operations divisions of the OEM.
Unit sales (Units). This measure consists of the count of new unit sales.
Part sales (Part $). This measure consists of the dollar amount of part
sales.
Market share, vehicle type 1 (MS1).This measure consists of the percent
of sales of vehicles in this category in the designated market area. The
designated market area is established by zip code according to the location
of the dealership. The most important vehicle for the OEM sales target is
the type 1.
13
If the standard is give an importance weight of 4 and 2 questions are associated with the
standard, then each question gets a weight of 2.0. If the standard has a weight of 4 and 5 questions
are associated with it, each questions is weighted by 0.8.
Dealership Evaluation Systems
17
Market share, vehicle type 2 (MS2). A similar measure for a different type
of vehicle.
Market share, vehicle type 3 (MS3). A similar measure for a different type
of vehicle.
Customer satisfaction with the sales department (Sat Sales)
Customer satisfaction with the service department (Sat Srvc)
Customer satisfaction with the parts department (Sat Parts)
The OEM assigns a target figure for each of the performance measures. The
target takes into account dealer size. To control for dealer size we divided
actual performance by the corresponding target. The ratio of actual to target
gave us a normalized measure of business results in each one of the
performance variables.
The performance measures showed moderate to low correlation among them.
Table 3 shows the correlation matrix among those variables.
Table 3. Correlation among eight performance measures
MS1 MS2 MS3 Parts $ Sat Parts Sat Sales Sat Srvc
MS2 0.130 1.000
MS3 0.109 0.144* 1.000
Part $ 0.077 0.063 0.001 1.000
Sat Parts -0.005 -0.154* -0.033 0.141 1.000
Sat Sales 0.007 -0.096 -0.123 0.011 0.117 1.000
Sat Srvc 0.020 0.017 0.101 0.056 0.361** 0.022 1.000
Units 0.247** 0.160* 0.080 0.282** -0.021 0.110 -0.102
N = 192, p<0.05*, p<0.01**
The normalized performance measures seem to be largely independent from one
another. Although a few correlations are statistically significant, their values are
rather low. We were unable to discern any meaningful pattern from the
correlation matrix.
Using factor analysis with principal components and varimax rotation we
obtained a three-factor solution (criteria for factor extraction was eigenvalue > 1)
shown in Table 4.
Dealership Evaluation Systems
18
The first factor is a general sales factor. The variables that load on this factor are
market share of vehicle 1, unit sales, and the part sales. The second one is clearly
an after sales factor. The variables that load on this factor are satisfaction with
service and parts. The third factor is somewhat related to market share. Variables
that load on this factor are market share of vehicles type 2 and type 3 and
satisfaction with the sales process.
Table 4. Factor analysis of normalized performance measures
F1 F2 F3
Units 0.804 -0.149 -0.024
MS1 0.542 -0.003 0.244
MS2 0.312 -0.156 0.557
MS3 0.103 0.155 0.684
Parts $ 0.614 0.205 -0.103
Sat Parts 0.078 0.796 -0.229
Sat Sales 0.259 0.090 -0.606
Sat Srvc. -0.048 0.817 0.188
Factor analysis allows us to group performance measures into meaningful factors.
Thus, instead of grouping the three market share variables into one factor, one of
those variables is grouped with two other sales variables into a general sales
factor. Upon close examination, we realized that market share for vehicle type 1 is
actually different from the other market share variables because of the importance
of that type of vehicle for general sales targets set by the OEM.
Using the factor loadings we computed dealer scores for each of the factors. In the
results section we will report on the relationship that we found between
compliance scores and performance. We use both OEM-scores and SCS-scores as
measures of compliance with the standards. We also use the general sales factor
as the primary measure of performance.
Non-Parametric Analysis
To further examine the assessment instrument, we conducted a non-parametric
analysis14
of the items. The list of dealers was rank ordered according to each one
of the factor scores. This yielded three different order sequences since. For each
14
Non-parametric statistics, also known as rank order statistics, does not use parameters such as
means or correlation indices. Instead, it looks at the rank order of responses and their frequency
counts.
Dealership Evaluation Systems
19
order, we compared the top third (n=64) versus the bottom third (n=64) of
respondents in terms of the pattern of Yes/No answers. If an item was consistently
associated with good performance, we expected to see more Yes responses in the
top third than in the bottom third. Conversely, if an item were independent of
good performance, we expected to see about the same number of Yes responses in
the top third and the bottom third. The property of separating one group from
another is known as discriminability of the item (see the section on
Psychometrical Properties above).
Results
In this section we report on three major findings of the study.
Parametric results: Compliance scores are, for the most part, unrelated to
business results.
Relationships among items: The data matrix proved to be not scalable
according to SCS indicating that there isn’t any noteworthy relationship
among the items.
Non-parametric results: In the most favorable condition, only 17 out of
107 items were able to discriminate between top and bottom dealers. Most
items do not discriminate between top and bottom dealers.
Parametric Results
We added the three factor scores (sales, service & parts, and market share) of
business results to create an overall performance score. We also obtained the total
score of dealer compliance with standards as measured by the OEM-score. We
performed a simple linear regression using overall performance as the dependent
variable.
“… only 17 out of 107 items were able to discriminate between top and bottom dealers”
Dealership Evaluation Systems
20
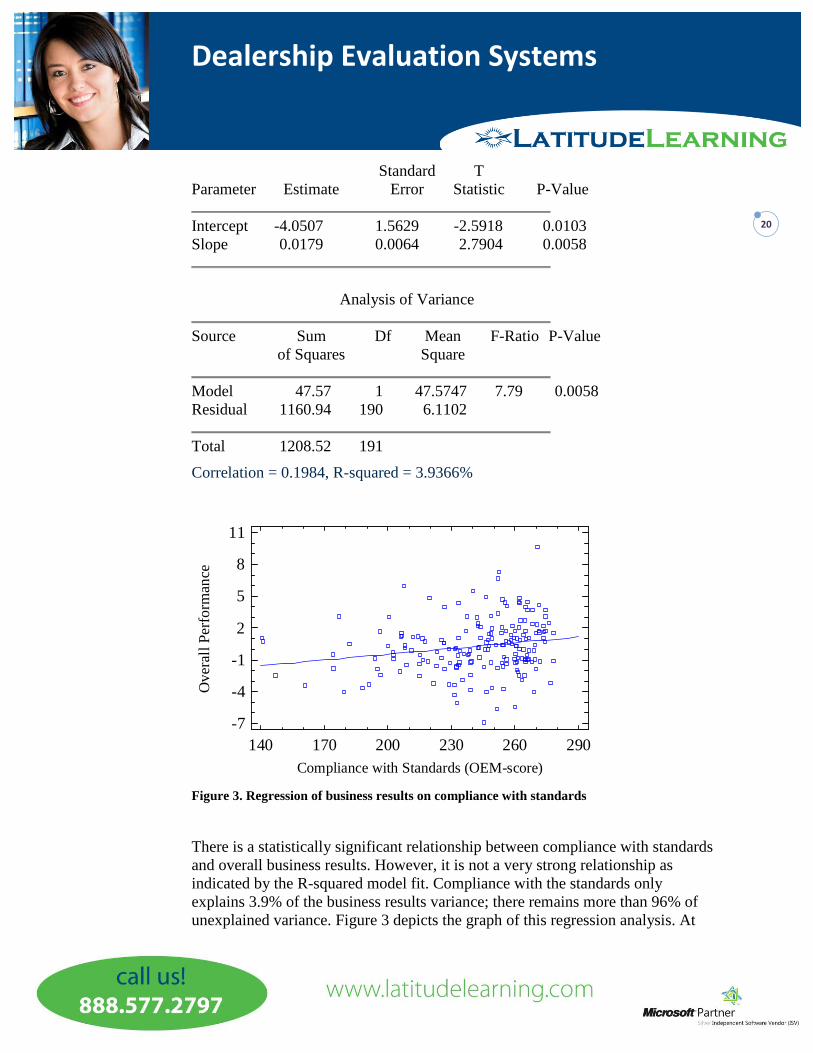
Standard T
Parameter Estimate Error Statistic P-Value
Intercept -4.0507 1.5629 -2.5918 0.0103
Slope 0.0179 0.0064 2.7904 0.0058
Analysis of Variance
Source Sum Df Mean F-Ratio P-Value
of Squares Square
Model 47.57 1 47.5747 7.79 0.0058
Residual 1160.94 190 6.1102
Total 1208.52 191
Correlation = 0.1984, R-squared = 3.9366%
Figure 3. Regression of business results on compliance with standards
There is a statistically significant relationship between compliance with standards
and overall business results. However, it is not a very strong relationship as
indicated by the R-squared model fit. Compliance with the standards only
explains 3.9% of the business results variance; there remains more than 96% of
unexplained variance. Figure 3 depicts the graph of this regression analysis. At
Compliance with Standards (OEM-score)
Ov
eral
l P
erfo
rman
ce
140 170 200 230 260 290
-7
-4
-1
2
5
8
11
Dealership Evaluation Systems
21
almost any level of compliance we find dealers with high and low overall
performance.
The distribution of compliance scores is highly skewed with the majority of the
scores towards the high end of the distribution. The regression results may be an
artifact created by the strong violations of regression assumptions, particularly the
normality of the marginal distributions. The standardized skewness of OEM
compliance scores is -6.91, well beyond the acceptable range for normal
distributions (-2.0, 2.0).
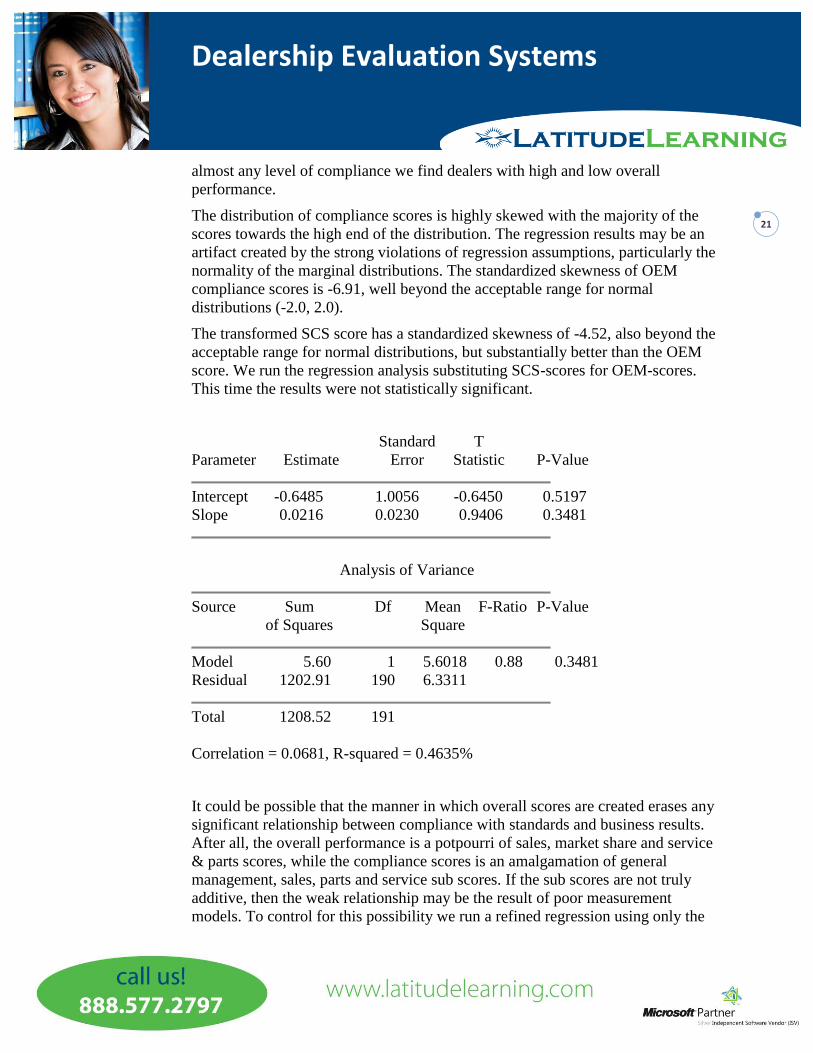
The transformed SCS score has a standardized skewness of -4.52, also beyond the
acceptable range for normal distributions, but substantially better than the OEM
score. We run the regression analysis substituting SCS-scores for OEM-scores.
This time the results were not statistically significant.
Standard T
Parameter Estimate Error Statistic P-Value
Intercept -0.6485 1.0056 -0.6450 0.5197
Slope 0.0216 0.0230 0.9406 0.3481
Analysis of Variance
Source Sum Df Mean F-Ratio P-Value
of Squares Square
Model 5.60 1 5.6018 0.88 0.3481
Residual 1202.91 190 6.3311
Total 1208.52 191
Correlation = 0.0681, R-squared = 0.4635%
It could be possible that the manner in which overall scores are created erases any
significant relationship between compliance with standards and business results.
After all, the overall performance is a potpourri of sales, market share and service
& parts scores, while the compliance scores is an amalgamation of general
management, sales, parts and service sub scores. If the sub scores are not truly
additive, then the weak relationship may be the result of poor measurement
models. To control for this possibility we run a refined regression using only the

Dealership Evaluation Systems
22
sales factor score15
as the dependent variable and compliance with sales standards
as the independent variable. In this case the relationship between compliance and
results was almost identical to the overall analysis. The relationship is illustrated
in Figure 4.
Standard T
Parameter Estimate Error Statistic P-Value
Intercept -1.5716 0.7364 -2.1343 0.0341
Slope 0.0172 0.0078 2.2140 0.0280
Analysis of Variance
Source Sum Df Mean F-Ratio P-Value
of Squares Square
Model 9.0056 1 9.0056 4.90 0.0280
Residual 349.06 190 1.8372
Total 358.07 191
Correlation = 0.1586, R-squared = 2.5150%
15
Remember that this factor includes new units, part sales, and market share for vehicle type 1.

Dealership Evaluation Systems
23
Figure 4. OEM-score and business results (vehicle sales)
The R-squared was 0.02515 indicating that only 2.5% of the variance in sales
results can be explained by compliance with sales standards. Running the
regression with SCS scores yields no statistically significant results and the R-
squared drops to 0.71%.
Relationships among Items
The logic underlying stochastic cumulative scales is that not all the items have the
same level of difficulty. If they were all the same, then the assessment instrument
would have no diagnostic value. If a medical test were to show that all patients are
healthy or a scholastic test were to show that all students are highly competent,
those tests would have no diagnostic value. Minimum competency tests such as
the one we take when we apply for a driver’s license are made in such a way that
most people, including good and bad drivers, pass the test so they can get the
driver’s license. But those tests do not tell apart the good from the bad or even the
mediocre.
Non-Parametric Results
In the non-metric analysis for each standard we count the number of Yes in the
top third, Yt, and in the bottom third, Yb, and then compute the difference Yt – Yb
in order to obtain a measure of discriminability. We set a minimum difference of
10 as the criteria for whether an item discriminates between the top performing
and bottom performing dealers. When the dealers are rank ordered according to
the sales factors, there are 15 items that discriminate; when the order is induced
OEM-score Sales Standards
Sal
es
34 54 74 94 114
-5
-3
-1
1
3
5
7

Dealership Evaluation Systems
24
by the market share factor, there are 9 items that discriminate; and when the order
is obtained from the service & parts factors only 4 items discriminate between top
and bottom performers. In general, the best discriminators are standards that deal
with training, data analysis, and availability of technical and customer
information.
Section
No of
Items
Number of Items that Discriminate
(Factor Used for Rank Order)
Sales Market
Share
Service &
Parts (Sat)
Sales 28 2 1 0
Service 24 6 2 1
Parts 23 7 1 1
General Mgmt 32 2 5 2
Conclusions
This analysis clearly shows a disconnect between DES assessment instruments
and the dealer performance measures the DES is purported to improve. The
analysis indicates that a DES based only on establishing and evaluating dealer
standards has no impact on dealer performance. Furthermore, only 20% of the
standards discriminate between top performing and bottom performing dealers.
The case study clearly provides evidence that a DES aimed at advancing dealer
performance should not be based solely on dealer standards.
This conclusion should not be viewed as an indictment of dealer standards. Dealer
standards are important for achieving consistency across dealers. However, the
purpose of dealer standards may not be consistent with the overall purpose of an
effective DES.
Study 2: Differences among Related DES
DESs seem to be created randomly in brainstorming sessions, with little regard
for item properties or measurement theory. In this study we present evidence
supporting this claim. The evidence comes in the form of a comparison chart
“… the best discriminators are standards that deal with training, data analysis and availability of technical and customer information.”
Dealership Evaluation Systems
25
listing what type of activities or processes are evaluated by seven related
programs. The programs were developed for the same OEM by six of its regional
branches operating in different international markets plus the dealer certification
program developed by headquarters.
The programs should list similar topics since they are developed for the same
OEM, the same vehicles, the same training infrastructure, the same global
information systems, and the same warranty administration. If despite the
common elements these evaluation systems are significantly different, one is
forced to conclude that there is no shared evaluation criteria and the final
programs have more to do with the personal preferences of the people who
developed them than with a common understanding of what attributes should be
evaluated.
For comparison purposes, one may examine public school accreditation. Schools,
like dealerships, periodically go through some form of evaluation. In the case of
schools the evaluation system is known as accreditation. In the United States there
are six regional accreditation agencies, the largest being the North Central
Association of Colleges and Schools (NCA). Accreditation agencies publish
accreditation criteria and quality indicators of accreditation.16
The criteria embody
a shared vision concerning what aspects of teaching and learning are essential and
what ought to be the expected outputs of schools.
Method
We contacted managers in charge of dealer network development in each of the
regions included in the study and the headquarter organization. Each manager sent
us a copy of the main dealer evaluation system used in the corresponding region.
The study focused on the service and parts processes included in each DES. There
were seven service processes and five part processes. Each major process contains
a number of sub processes, all listed in Appendix A.
Using the categories of the headquarters certification program, we created an
initial list of processes and sub processes. The list was sent to each regional
officer who was asked to indicate whether the processes in the initial list were
included in their respective program or not. If the program was included, we
requested to provide a reference (e.g., page number, local number, etc.) for
validation purposes. If their program included other processes not included in the
initial list, we asked them to identify those additional processes.
16
See for example http://www.sde.state.id.us/accreditation/docs/School.pdf

Dealership Evaluation Systems
26
Results
The unit of analysis is the sub process. There are 41 service and 19 parts sub
processes altogether. For each sub process we calculated an index of consistency
across regions17
. This index was the probability that a region used the given sub
process. To compute it, we counted the number of Yes across all seven regions
and divided the count by 7. For example, six regions had a sub process for
answering the telephone in the Inquiry process, hence its index of consistency was
8571.07
6
The average consistency index across all 41 service sub processes was 0.6341
indicating that if we select a region and a service process at random there will be
less than 2/3 chance that such a region has such a process. The average
consistency index for parts was much lower, 0.3534. The overall index of
consistency for service and parts is 0.5452 indicating that if we pick a region and
a service or part process at random there is about 1/2 probability of getting a
match. It is almost like flipping a coin.
Study 2 Conclusion
There is a high degree of variability among the service and parts processes
established by six regions and the headquarter units in charge of network
development of the same car manufacturer. Lack of a set of evaluative criteria
shared among all regions may contribute to the high variability discovered in our
study.
Although we did not investigate the consequences of the high variability, one may
suspect that if one of the main uses of a DES is to defend the brand image of the
product, dealer processes and standards with high variability may not help achieve
that goal.
Another possibility is that the high variability is unavoidable because the
processes reflect adaptation to local conditions. Although possible, the argument
is not likely given the nature of the processes listed in Appendix A. After all, we
are not talking about how the processes are actually implemented, but only about
whether a process with a similar name or purpose (regardless of how it is adapted
to a local condition) exists in a region.
17
Including the OEM there were seven regions.

Dealership Evaluation Systems
27
Transformational Evaluation Systems
Progress in statistics and program evaluation methodologies make it possible to
conceive alternative evaluation systems more in tune with real dealership needs
and strategic interests of the OEM. A transformational evaluation system is one
that allows dealership leaders to:
Identify key process variables that affect performance
Obtain a valid picture of where the dealership stands vis-à-vis other
dealerships regarding the key process variables
Evaluate progress towards self-imposed goals or targets
Offer to the OEM valid information regarding dealer compliance with
standards
Identify cause-and-effect relationships among process variables and
between process variables and business results
Transform the manner in which the dealership deals with its own
information from a reactive mode to a planning-and-execution mode
Transformational evaluation systems already exist in other settings. The National
Association of Secondary School Principals makes available to high school
principals the Comprehensive Assessment of School Environments (CASE) to
evaluate the schools. The CASE system gathers information about a multitude of
school process variables and six student outcome variables. For each outcome
variable, for example student achievement or student perception of self efficacy,
several process variables have been identified as having a significant relationship.
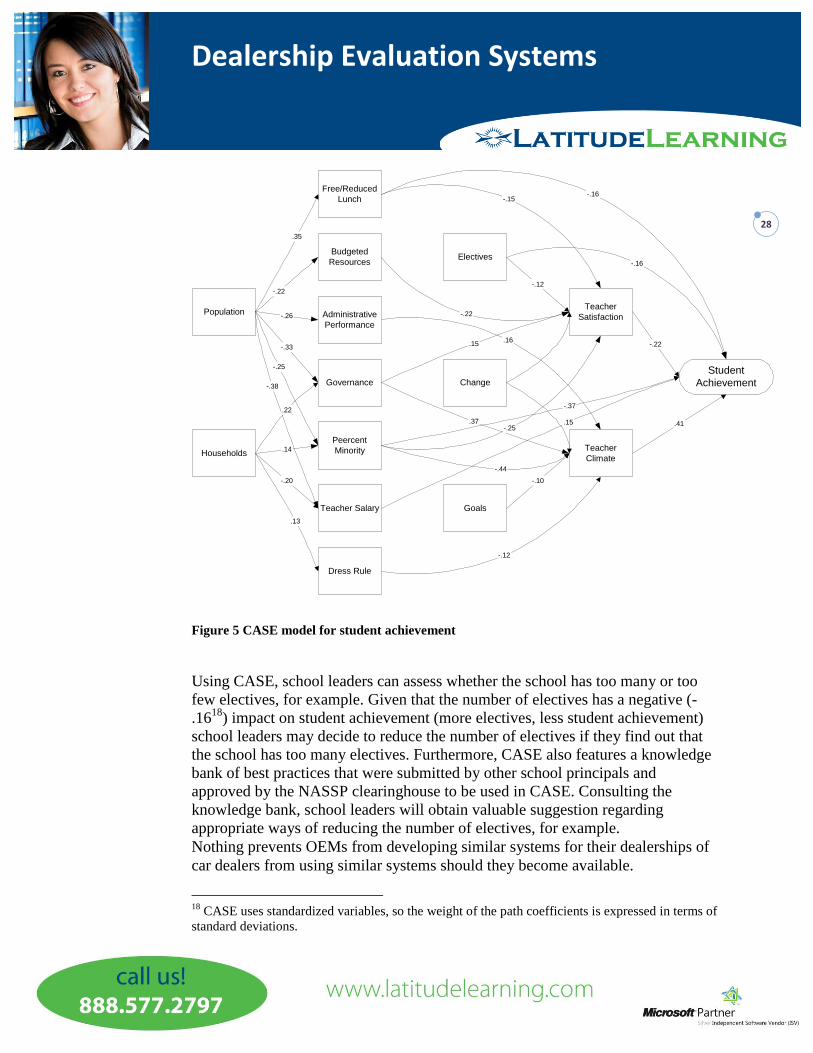
Using an advanced statistical technique called structural equations model, CASE
has quantified the impact of the process variables among themselves and their
impact on the outcome variable. The figure below illustrates the structural
equation model corresponding to student achievement.
Dealership Evaluation Systems
28
Population
Households
Free/Reduced
Lunch
Budgeted
Resources
Administrative
Performance
Governance
Peercent
Minority
Teacher Salary
Dress Rule
Electives
Goals
Change
Teacher
Satisfaction
Teacher
Climate
Student
Achievement
-.16
-.22
-.16-.15
.15
.37
.16
-.25
-.12
.35
-.22
-.26
-.33
.14
-.25
-.38
.22
-.20
.13
-.37
-.44
.15
-.10
-.22
.41
-.12
Figure 5 CASE model for student achievement
Using CASE, school leaders can assess whether the school has too many or too
few electives, for example. Given that the number of electives has a negative (-
.1618
) impact on student achievement (more electives, less student achievement)
school leaders may decide to reduce the number of electives if they find out that
the school has too many electives. Furthermore, CASE also features a knowledge
bank of best practices that were submitted by other school principals and
approved by the NASSP clearinghouse to be used in CASE. Consulting the
knowledge bank, school leaders will obtain valuable suggestion regarding
appropriate ways of reducing the number of electives, for example.
Nothing prevents OEMs from developing similar systems for their dealerships of
car dealers from using similar systems should they become available.
18
CASE uses standardized variables, so the weight of the path coefficients is expressed in terms of
standard deviations.

Dealership Evaluation Systems
29 Appendix
Comparative Chart of Process Implementation in a Sample of Markets
Process Sub process OEM Region 1 Region 2 Region 3 Region 4 Region 5 Region 6
Service
Inquiries Answering telephone Y Y Y Y Y Y
Identifying customer needs Y Y Y Y Y Y
Validate/update/create repair history record Y Y
Offer to make an appointment Y Y Y Y Y Y
Obtain customer information Y Y Y Y Y Y Y
Offer customer special prices Y
Resolve issues (e.g., no chassis number) Y Y
Confirm payment method Y
2-day in advance: review work and prepare records Y
1-day advance: prepare service sheets by team Y
Service Order
Greeting Y Y Y Y Y Y Y
Write-Up Y Y Y Y Y Y Y
Express check in Y Y
Check vehicle, notice additional work Y Y
Provide Estimates Y Y Y Y Y
Vehicle pick up and delivery Y Y Y Y Y
Loaner car/shuttle service Y Y Y Y Y Y
Dispatch
Assigning work to appropriate technician Y Y Y Y Y Y Y

Dealership Evaluation Systems
30 Process Sub process OEM Region 1 Region 2 Region 3 Region 4 Region 5 Region 6
Ensuring parts availability Y Y Y Y Y Y
Quality inspection / follow progress Y Y Y Y Y Y
Tool room maintenance Y Y Y
Repair
Bulletins and campaigns Y Y Y
Diagnosis Y Y Y Y Y Y Y
Validating warranty (if applicable) Y Y Y Y Y Y
Comebacks Y
Perform repair Y Y Y Y Y
Confirm repair Y Y Y Y
Ensure all customer concerns are addressed Y Y Y Y Y
Document and advise on additional findings Y Y Y Y Y Y
Quality check and final test Y Y Y Y Y Y
Maintenance
Perform maintenance Y Y Y
Confirm maintenance Y Y
Ensure all customer concerns are addressed Y Y Y Y Y
Invoicing & Delivery
Service work order review Y Y Y Y Y Y Y
Warranty and RA numbers (radios, etc.) Y Y Y
Service work order delivery Y Y Y Y Y
Notify customer vehicle is ready Y Y Y Y Y
Cashier Y Y Y Y Y Y
Follow-Up
Customer contacted within 2 days Y Y Y
Customer concerns addressed Y Y Y Y Y Y
Trend analysis of customer concerns Y Y Y Y Y

Dealership Evaluation Systems
31 Process Sub process OEM Region 1 Region 2 Region 3 Region 4 Region 5 Region 6
Parts
Receiving Advance shipping notification Y Y Y
Receiving inspection Y Y
Shelving parts Y Y
Inquiries
Greeting Y Y Y
Identify customer needs/wants Y Y Y Y
2-day in advance: Prepare job basket Y
2-day in advance: Flag incomplete baskets Y
1-day advance: If parts incomplete contact cust. Y
Specifying
Confirm customer wants Y Y Y Y
Retrieval and delivery to mechanics Y Y Y
Post transactions to inventory control system Y Y
Expediting
Determining ordering priority Y Y Y
Placing orders Y Y Y
Maintaining and organizing inventory Y Y Y
Special parts Y Y Y
Back orders Y Y Y
Inventory Audits
Establishing part demand baseline Y Y
Determining actual parts demand Y Y
Deviations Y Y