
Deal or No Deal - Documents & Reports - All Documents...
72
Policy Research Working Paper 7614 Deal or No Deal Strictly Business for China in Kenya? Apurva Sanghi Dylan Johnson Macroeconomics and Fiscal Management Global Practice Group March 2016 WPS7614 Public Disclosure Authorized Public Disclosure Authorized Public Disclosure Authorized Public Disclosure Authorized
Transcript of Deal or No Deal - Documents & Reports - All Documents...
Policy Research Working Paper 7614
Deal or No Deal
Strictly Business for China in Kenya?
Apurva SanghiDylan Johnson
Macroeconomics and Fiscal Management Global Practice GroupMarch 2016
WPS7614P
ublic
Dis
clos
ure
Aut
horiz
edP
ublic
Dis
clos
ure
Aut
horiz
edP
ublic
Dis
clos
ure
Aut
horiz
edP
ublic
Dis
clos
ure
Aut
horiz
ed
Produced by the Research Support Team
Abstract
The Policy Research Working Paper Series disseminates the findings of work in progress to encourage the exchange of ideas about development issues. An objective of the series is to get the findings out quickly, even if the presentations are less than fully polished. The papers carry the names of the authors and should be cited accordingly. The findings, interpretations, and conclusions expressed in this paper are entirely those of the authors. They do not necessarily represent the views of the International Bank for Reconstruction and Development/World Bank and its affiliated organizations, or those of the Executive Directors of the World Bank or the governments they represent.
Policy Research Working Paper 7614
This paper is a product of the Macroeconomics and Fiscal Management Global Practice Group. It is part of a larger effort by the World Bank to provide open access to its research and make a contribution to development policy discussions around the world. Policy Research Working Papers are also posted on the Web at http://econ.worldbank.org. The authors may be contacted at [email protected].
Existing work on China’s economic influence in Africa refers to Africa in broad terms, thereby generalizing the results to an extent that is unhelpful for policy-makers in a specific country. Moreover, the emphasis is on oil exporters. This paper remedies this by focusing on a single, oil-importing country: Kenya. The paper examines China’s economic presence in Kenya and some of the popular myths surrounding Chinese economic activity. The first myth is that Chinese companies do not employ local workers. In fact, 78 percent of full-time and 95 percent of part-time employees in Chinese companies are locals. Second, although China represents a large potential market for local exporters, the study finds that China has a better chance of expanding its exports to Kenya than Kenya does to China based on existing specializations. This may change with recent oil discoveries in Kenya, increasing the space for Kenyan exports to China, as well as from China’s shift to a
consumption-driven economy which will increase demand for services, a growing strength of Kenya’s economy (World Bank Country Economic Memorandum 2016). The paper emphasizes that Kenyan policy makers should be less concerned about bilateral trade imbalances and worry about Kenya’s overall trade balance. However, the Stan-dard Gauge Railway and Thika superhighway experiences suggest that Chinese firms offer relatively few technology transfer or supplier opportunities for local firms and aca-demia. Third, the popular focus of Chinese competition is on the impact on well-organized Kenyan producers and not on consumers, thereby underestimating the benefits Kenyan consumer derive from the availability of more affordable Chinese goods. The paper concludes with policy directions for improving export competitiveness and transparency in infrastructure projects, and local content.
Deal or No Deal: Strictly Business for China in Kenya?
Apurva Sanghi∗ Dylan Johnson†‡
JEL-Classification: F14, F21, F35Keywords: Trade Imbalance, Foreign Direct Investment, Foreign Aid
∗Lead Economist for Kenya, Uganda, Rwanda and Eritrea, World Bank Group.†Consultant, World Bank Group‡We are grateful to Michel Botzung, Deborah Brautigam, Paul Brenton, Kevin Carey, Guang Zhe Chen, Shanta
Devarajan, Nora Carina Dihel, Marcelo Giugale, Justin Lin, Manuel Moses, Thomas O’Brien, Anand Rajaram andDavid Tarr for excellent comments and feedback. All remaining errors are our own.
A. Sanghi and D. Johnson
Contents
1 Introduction 1
2 Kenya and China’s Trade Relationship 32.1 The common belief: Exports from poorer countries are commodity-dependent . . . . 3
2.1.1 Kenya should pay more attention to the overall trade balance . . . . . . . . . 32.2 China is a large source of imports for Kenya . . . . . . . . . . . . . . . . . . . . . . . . 4
2.2.1 Kenya imports rubber manufactures from China . . . . . . . . . . . . . . . . . 62.3 China is still a small export market for Kenya . . . . . . . . . . . . . . . . . . . . . . . 7
2.3.1 Kenya exports raw goods and metals to China . . . . . . . . . . . . . . . . . . 82.4 Winners and Losers from Kenya’s current trade patterns . . . . . . . . . . . . . . . . 10
2.4.1 The net benefit to the economy is positive . . . . . . . . . . . . . . . . . . . . . 102.4.2 Consumers and retailers gain . . . . . . . . . . . . . . . . . . . . . . . . . . . . 102.4.3 Producers are worse off; some benefit from Chinese intermediate goods . . . 10
2.5 What drives Kenya’s exports? . . . . . . . . . . . . . . . . . . . . . . . . . . . . . . . . 142.5.1 Estimation . . . . . . . . . . . . . . . . . . . . . . . . . . . . . . . . . . . . . . . 14
2.6 Brighter prospects for services exports as China rebalances . . . . . . . . . . . . . . . 162.6.1 China’s rebalancing will help reduce poverty by 2030 . . . . . . . . . . . . . . 17
3 Foreign Direct Investment in Kenya 183.1 Chinese FDI in Sub-Saharan Africa . . . . . . . . . . . . . . . . . . . . . . . . . . . . . 20
3.1.1 Chinese FDI in Sub-Sharan Africa is relatively small . . . . . . . . . . . . . . . 203.2 Chinese companies in Kenya: From large state companies to small private ones . . . 24
3.2.1 Chinese invest the most in metals, communications, and automotive originalequipment manufacturing (OEM) . . . . . . . . . . . . . . . . . . . . . . . . . 24
3.2.2 Corruption is the biggest obstacle for Chinese firms . . . . . . . . . . . . . . . 263.2.3 Chinese firms source most materials from China . . . . . . . . . . . . . . . . . 263.2.4 Chinese firms employ a large share of local workers . . . . . . . . . . . . . . . 273.2.5 Chinese firms face some competition from the informal sector . . . . . . . . . 303.2.6 Chinese companies less likely to take credit line . . . . . . . . . . . . . . . . . 30
4 Official Development Assistance from China 304.1 Chinese aid is small compared to commercial activities . . . . . . . . . . . . . . . . . 30
4.1.1 Kenya may rely more on Chinese aid because of volatile aid flows . . . . . . 314.2 Most Chinese financing does not qualify as ODA . . . . . . . . . . . . . . . . . . . . . 32
4.2.1 China loans the most to ministries of energy and petroleum and transportandinfrastructure . . . . . . . . . . . . . . . . . . . . . . . . . . . . . . . . . . . . . 32
4.2.2 Chinese stands out in education aid . . . . . . . . . . . . . . . . . . . . . . . . 334.3 Lack of quality Chinese aid data . . . . . . . . . . . . . . . . . . . . . . . . . . . . . . 34
4.3.1 Drawbacks of existing Chinese aid data: Media based data collection is prob-lematic . . . . . . . . . . . . . . . . . . . . . . . . . . . . . . . . . . . . . . . . . 34
2
5 Review and future directions 345.1 Consider the long term growth of local industry . . . . . . . . . . . . . . . . . . . . . 35
5.1.1 SGR spotlight: Non-existent capacity building . . . . . . . . . . . . . . . . . . 355.2 Diversify FDI sources to avoid overreliance on China . . . . . . . . . . . . . . . . . . 365.3 Monitor debt levels from China . . . . . . . . . . . . . . . . . . . . . . . . . . . . . . . 37
5.3.1 Debt to China is growing quickly . . . . . . . . . . . . . . . . . . . . . . . . . . 375.4 Supply-side Shortages: Reducing labor costs . . . . . . . . . . . . . . . . . . . . . . . 38
5.4.1 Encourage technology transfer and capacity building with infrastructureprojects . . . . . . . . . . . . . . . . . . . . . . . . . . . . . . . . . . . . . . . . . 39
5.4.2 Bring more transparency to loans and infrastructure projects . . . . . . . . . . 395.4.3 Special Economic Zones . . . . . . . . . . . . . . . . . . . . . . . . . . . . . . . 405.4.4 Conclusion . . . . . . . . . . . . . . . . . . . . . . . . . . . . . . . . . . . . . . 41
Appendices 47
Appendix A Gravity model of trade 47A.1 Model . . . . . . . . . . . . . . . . . . . . . . . . . . . . . . . . . . . . . . . . . . . . . . 48
Appendix B Gravity Data 49
Appendix C Results 50
List of Figures
1 Kenya’s overall trade balance is a bigger concern Source:Central Bank of Kenya 2015 4
2 China takes a sizeable share of total Kenyan imports (2012-2014) Source:IMF World Economic Outlook Database 2014 5
3 China and India are major sources of imports (2004-2013) . . . . . . . . . . . . . . . . 54 Kenya imports rubber manufactures from China (2010-2014) Source:
UN Comtrade database 2015 . . . . . . . . . . . . . . . . . . . . . . . . . . . . . . . . . . 65 Kenya imports rubber footwear, tires, and fabrics from China (2012-2014) Source:
UN Comtrade database 2015 . . . . . . . . . . . . . . . . . . . . . . . . . . . . . . . . . . 76 Kenyan exports to China small relative to total exports (2012-2014) Source:
IMF World Economic Outlook Database 2014 77 Kenya exports metals and hides and skins to China (2010-2014) Source:
UN Comtrade database 2015 . . . . . . . . . . . . . . . . . . . . . . . . . . . . . . . . . . 88 Kenya exports titanium ores and copper to China (2012-2014) Source:
UN Comtrade database 2015 . . . . . . . . . . . . . . . . . . . . . . . . . . . . . . . . . . 99 Metals prices have been falling since January 2010 (1990-2015) Source:
World Bank Commodity Price Data (The Pink Sheet) . . . . . . . . . . . . . . . . . . . . . 910 Kenya’s imports of intermediate goods is rising quickly Source:
UN Comtrade 2015 1111 China’s share of Kenya’s intermediate goods imports is growing Source:
UN Comtrade 2015 12
A. Sanghi and D. Johnson
12 Kenya’s apparel exports to the US (2000-2014) Source:UN Comtrade 2015 13
13 Kenya’s services exports overall are strong Source:UN Service Trade 2015 17
14 Kenya’s FDI is low. Trend in red (1980-2014) Source:World Development Indictors World Bank 2015 . . . . . . . . . . . . . . . . . . . . . . . . 19
15 Kenya underperforms in attracting FDI relative to potential. Trend in red (1980-2014) Source:World Development Indictors World Bank 2015 . . . . . . . . . . . . . . . . . . . . . . . . 19
16 Kenya’s Gross domestic savings has fallen sharply since 1993. Trend in red (1980-2014) Source:World Development Indictors World Bank 2015 . . . . . . . . . . . . . . . . . . . . . . . . 20
17 Chinese FDI in Kenya is growing quickly since 2009 (2003-2012) Source:UNCTAD FDI/TNC database 2015 . . . . . . . . . . . . . . . . . . . . . . . . . . . . . . 21
18 China’s FDI represents large share of total FDI (2003-2012) Source:Authors’ own calculation based on World Development Indictors World Bank 2015 . . . . . 21
19 Investment from China rising; investment from UK and US falling Source:KenInvest 2015 22
20 China and France top sources of FDI inflows for Kenya (2012) Source:UNCTAD FDI/TNC database 2015 . . . . . . . . . . . . . . . . . . . . . . . . . . . . . . 22
21 China and UK hold the most FDI stock in Kenya (2012) Source:UNCTAD FDI/TNC database 2015 . . . . . . . . . . . . . . . . . . . . . . . . . . . . . . 23
22 Kenya’s mobile telephone subscriptions grew quickly over last decade Source:International Telecommunications Union 2016 24
23 China invests most in metals and communications in Kenya (2003-2015) Source:fDi Intelligence from The Financial Times Ltd 2015 . . . . . . . . . . . . . . . . . . . . . . 25
24 Chinese companies invest most in manufacturing (2003-2015) Source:fDi Intelligence from The Financial Times Ltd 2015 . . . . . . . . . . . . . . . . . . . . . . 25
25 Chinese investment per project highest in headquarters creation and manufacturing(2003-2015) Source:fDi Intelligence from The Financial Times Ltd 2015 . . . . . . . . . . . . . . . . . . . . . . 26
26 Chinese companies create most jobs in the communications sector (2003-2015) Source:fDi Intelligence from The Financial Times Ltd 2015 . . . . . . . . . . . . . . . . . . . . . . 28
27 Chinese companies in manufacturing sector create the most jobs (2003-2015) Source:fDi Intelligence from The Financial Times Ltd 2015 . . . . . . . . . . . . . . . . . . . . . . 28
28 Chinese companies in manufacturing sector create the most jobs per project (2003-2015) Source:fDi Intelligence from The Financial Times Ltd 2015 . . . . . . . . . . . . . . . . . . . . . . 28
29 China is fifth largest creator of jobs. India creates the most jobs (2003-2015) Source:fDi Intelligence from The Financial Times Ltd 2015 . . . . . . . . . . . . . . . . . . . . . . 29
30 US is a top donor for Kenya. Chinese finance does not meet OECD/DAC aid criteria(2013) Source:OECD DAC aid database 2015 . . . . . . . . . . . . . . . . . . . . . . . . . . . . . . . . . 31
4
31 Kenya receives the most aid in health and populations services (China excluded)(2013) Source:OECD DAC aid database 2015 . . . . . . . . . . . . . . . . . . . . . . . . . . . . . . . . . 32
32 Ministry of Energy and Petroleum receives most loans from China (2014) Source:Estimates of Development Expenditure Government of Kenya (2014) . . . . . . . . . . . . 33
33 Kenya’s debt to China is growing quickly (2010-2014) Source:Kenya National Bureau of Statistics Economic Survey 2015 . . . . . . . . . . . . . . . . . . 37
34 Kenya owes most debt to China (2015) Source:The National Treasury of Kenya (2015) . . . . . . . . . . . . . . . . . . . . . . . . . . . . 38
35 Kenya’s debt to China outpaces the rest (2015) Source:The National Treasury of Kenya (2015) . . . . . . . . . . . . . . . . . . . . . . . . . . . . 38
C36 Trade and Distance Kenya and Rest of the World (1948-2014) Source:CEPII Gravity Database 2010 and UN Comtrade 2015 63
C37 Trade and Importer GDP per capita Kenya and Rest of the World (1948-2014) Source:CEPII Gravity Database 2010 and UN Comtrade 2015 64
C38 Trade and Importer GDP per capita Kenya and Rest of the World (2014) Source:CEPII Gravity Database 2010 and UN Comtrade 2015 64
List of Tables
1 Estimates of Kenya’s Trade Flows (1948-2014). Dependent variable: Kenya’s exports 142 Estimates of China’s Trade Flows (1948-2014). Dependent variable: China’s exports . 163 FDI Projects and related employment (2007-2011) . . . . . . . . . . . . . . . . . . . . 294 Export Processing Zones sector contribution in 2012 (%) . . . . . . . . . . . . . . . . . 41C5 Estimates of Kenya’s Trade Flows (1948-2014). Dependent variable: Kenya’s exports 50C6 Estimates of China’s Trade Flows (1948-2014). Dependent variable: China’s exports . 53C7 Estimates of China’s Trade Flows (1948-2014). Dependent variable: China’s exports . 56C8 Estimates of Kenya’s Trade Flows (1948-2014). Dependent variable: Kenya’s exports 59
1 Introduction
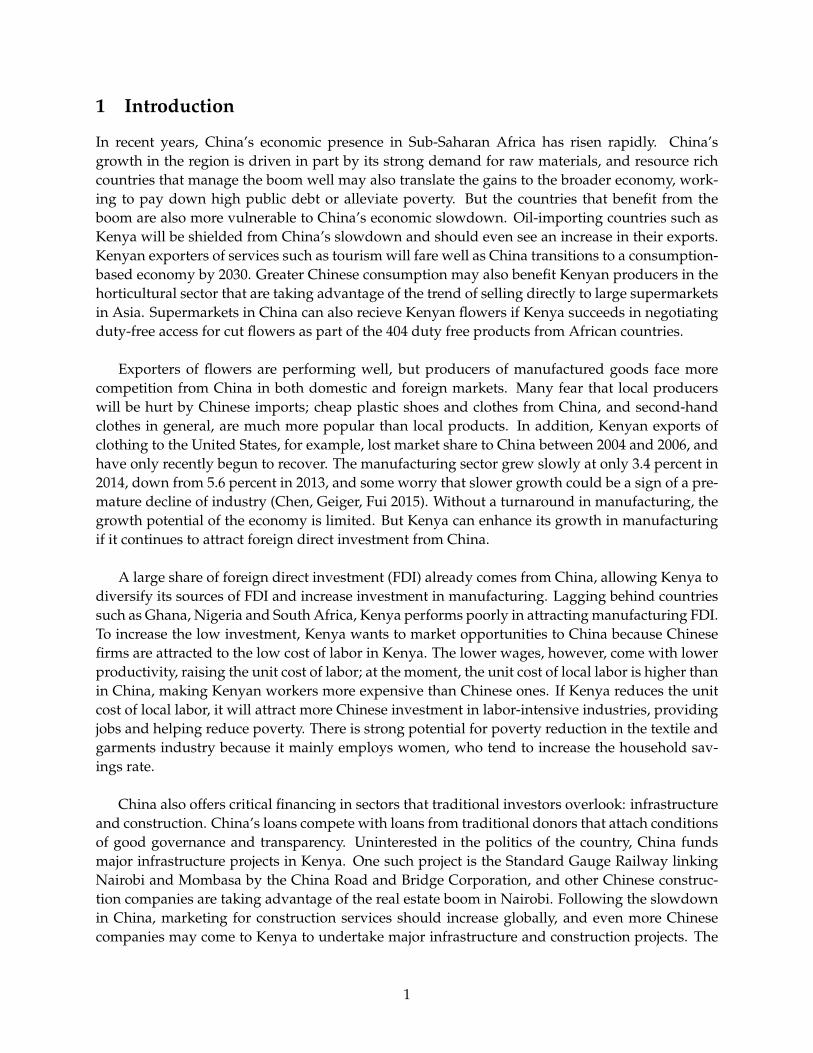
In recent years, China’s economic presence in Sub-Saharan Africa has risen rapidly. China’sgrowth in the region is driven in part by its strong demand for raw materials, and resource richcountries that manage the boom well may also translate the gains to the broader economy, work-ing to pay down high public debt or alleviate poverty. But the countries that benefit from theboom are also more vulnerable to China’s economic slowdown. Oil-importing countries such asKenya will be shielded from China’s slowdown and should even see an increase in their exports.Kenyan exporters of services such as tourism will fare well as China transitions to a consumption-based economy by 2030. Greater Chinese consumption may also benefit Kenyan producers in thehorticultural sector that are taking advantage of the trend of selling directly to large supermarketsin Asia. Supermarkets in China can also recieve Kenyan flowers if Kenya succeeds in negotiatingduty-free access for cut flowers as part of the 404 duty free products from African countries.
Exporters of flowers are performing well, but producers of manufactured goods face morecompetition from China in both domestic and foreign markets. Many fear that local producerswill be hurt by Chinese imports; cheap plastic shoes and clothes from China, and second-handclothes in general, are much more popular than local products. In addition, Kenyan exports ofclothing to the United States, for example, lost market share to China between 2004 and 2006, andhave only recently begun to recover. The manufacturing sector grew slowly at only 3.4 percent in2014, down from 5.6 percent in 2013, and some worry that slower growth could be a sign of a pre-mature decline of industry (Chen, Geiger, Fui 2015). Without a turnaround in manufacturing, thegrowth potential of the economy is limited. But Kenya can enhance its growth in manufacturingif it continues to attract foreign direct investment from China.
A large share of foreign direct investment (FDI) already comes from China, allowing Kenya todiversify its sources of FDI and increase investment in manufacturing. Lagging behind countriessuch as Ghana, Nigeria and South Africa, Kenya performs poorly in attracting manufacturing FDI.To increase the low investment, Kenya wants to market opportunities to China because Chinesefirms are attracted to the low cost of labor in Kenya. The lower wages, however, come with lowerproductivity, raising the unit cost of labor; at the moment, the unit cost of local labor is higher thanin China, making Kenyan workers more expensive than Chinese ones. If Kenya reduces the unitcost of local labor, it will attract more Chinese investment in labor-intensive industries, providingjobs and helping reduce poverty. There is strong potential for poverty reduction in the textile andgarments industry because it mainly employs women, who tend to increase the household sav-ings rate.
China also offers critical financing in sectors that traditional investors overlook: infrastructureand construction. China’s loans compete with loans from traditional donors that attach conditionsof good governance and transparency. Uninterested in the politics of the country, China fundsmajor infrastructure projects in Kenya. One such project is the Standard Gauge Railway linkingNairobi and Mombasa by the China Road and Bridge Corporation, and other Chinese construc-tion companies are taking advantage of the real estate boom in Nairobi. Following the slowdownin China, marketing for construction services should increase globally, and even more Chinesecompanies may come to Kenya to undertake major infrastructure and construction projects. The
1
A. Sanghi and D. Johnson
improvement in insfrastructure will help lower the cost of doing business, attract more invest-ment, and enhance productivity.
We contribute to the literature by investigating China’s impact on single, oil-importing coun-try, Kenya. Oil-importers receive little attention in the existing literature, and researchers andjournalists usually highlight Chinese demand for land and natural resources in Africa, ignoringthe useful role China plays as an infrastructure provider and source of cheap goods for consumersand retailers. In Kenya, Chinese firms invest in more than just natural resources. They also investlarge amounts in the communications and automotive original equipment manufacturing sectors.
Previous work on China in Africa refers to Sub-Saharan Africa in broad terms and fails to pro-vide specific examples and guidance for individual countries navigating relations with China.1 Weavoid overgeneralizing by examining the trade, aid, and foreign direct investment between Chinaand Kenya. Chinese investment is more than just state-owned companies negotiating directlywith the government. Many are private companies looking for access to the domestic market or toproduce goods for export to Europe or North America (Brautigam 2013; SACE 2014). The manu-facturing and service sectors attract a number of small and medium enterprises, and constructiondraws larger companies. Some bid for tenders from the Ministry of Commerce and receive sup-port based on performance; others raise capital from family and friends in China; state-ownedfirms can access subsidized credit from the China export-import (EXIM) bank. But the size, oper-ations, and financing of Chinese firms is quite diverse, a diversity that is often overlooked whendiscussing Chinese investment in Kenya.
We also find that businesses employ a majority of local workers in full-time and part-timeroles; the majority of surveyed firms also report having a policy to localize its workforce, chal-lenging the stereotype that Chinese firms only use Chinese labor. Workers also receive basic skills,safety and hygiene training (SACE 2014). Chinese firms can offer even more training if Kenyapromotes local capacity building and technology transfer —The WTO’s trade related investmentmeasures (TRIM) forbids local content requirements. Mega-infrastructure projects undertaken byChinese companies are valuable learning opportunities for local industry and training institutes;they allow well-organized firms to upgrade equipment and supply materials for both current andfuture projects. Experience from the Standard Gauge Railway (SGR) linking Mombasa to Nairobihas shown that without a strategy for knowledge sharing, local firms will miss out on the spillovereffects from investment, a crucial part of increasing competitiveness of the domestic economy.
1Similiar works include Onjala (2008), Chege (2008), Subramanian (2008) and Fiott (2006) that address Kenya specif-ically and provide a detailed account of China’s involvement in Kenya from 1960 to 2006. Kaplinsky (2006, 2007)explains China’s impact on clothing and textile exports from Lesotho, South Africa, and Kenya after the expiry of theMultiFibre Arrangement (MFA). Zafar (2006) sheds light on the effects of China’s global macroeconomic presence onSub-Saharan Africa, where he identifies winners (mainly oil exporting economies) and losers (mainly oil importerssuch as Kenya).
2
2 KENYA AND CHINA’S TRADE RELATIONSHIP
2 Kenya and China’s Trade Relationship
2.1 The common belief: Exports from poorer countries are commodity-dependent
Many African economies have benefitted from China’s strong demand for energy and metals. Oneexpects Kenya to mostly export commodities to China, and China to export a greater variety ofmanufactured goods to Kenya. China is a richer middle income country and has greater oppor-tunities to expand its exports in different sectors; as a lower middle income country, Kenya reliesmore on agricultural and commodity exports. But Kenya’s exports are relatively more diverse: itexports metals and plastics, but also vegetable textile fibers and leather rawhide skins, presentingan opportunity to meet the demand for finished and crust leather in the EU and China (Hansen,Moon, Mogollon 2015). China mostly exports rubbers and plastic products to Kenya, suggestingan overspecialization in manufacturing. Its focus on manufacturing has come at the expense ofdomestic consumption and services. As China’s economy changes to emphasize consumption,Kenya may take advantage of the opportunity to export financial, tourism, and business servicesto China. For instance, Kenya has the opportunity to export the MPESA system to China and othercountries, especially those with poorly developed financial services. Exporting more services toChina and to other countries will help upgrade the services industry and strengthen the overallbalance of trade.
2.1.1 Kenya should pay more attention to the overall trade balance
When talking about trade, many officials in both China and Kenya are primarily concerned withthe bilateral trade deficit, but it is a meaningless statistic; a country can have simultaneous sur-pluses and deficits with many different trading partners and still have a positive balance overall.For policy makers, the overall trade deficit in Kenya is more relevant and a bigger reason forconcern.
A brief overview of Kenya’s weak exports The current account deficit, or imports minus ex-ports, reached 10.4 percent of GDP in 2014. The deficit was badly hit in 2011 when high oil andfood prices and a weak shilling increased Kenya’s import bill so much that Kenya’s top four ex-ports were insufficient to cover the cost. To finance the gap, Kenya had to rely on both shortand long-term debt. Even with lower oil prices, the deficit remains high at 9.8 percent of GDPbecause imports of capital and equipment increased more than 25 percent. But as imports soar,exports continue to dip. In 2015, Kenya’s manufactured exports fell 20.3 percent, its horticultureexports declined 5.5 percent, and its chemical exports fell 7.9 percent (Kenya Economic Update2015). Even one of the major earners, tea, fell 1.1 percent. Tea and coffee still account for most ofthe growth, and Kenya must improve the competitiveness of manufacturing to diversify exports.It must also diversify export markets because the majority of growth is in traditional destinations,neglecting new opportunities for expansion.
Why are Kenya’s exports performing so terribly? One can trace Kenya’s weak exports to anunderperforming manufacturing sector. For over a decade, manufacturing has remained at only10 percent of GDP. Manufacturing receives little investment because investors want to avoid theunderdeveloped infrastructure and high cost of doing business, and have diverted funds to non-tradable sectors such as real estate and construction. The budding tradable sector has watched its
3
A. Sanghi and D. Johnson
competitiveness erode through poor government policies and inefficiency. Price controls and mis-managed marketing boards, for example, have discouraged coffee farmers from exporting, andthe sector is barely recovering from the damage (Kenya Economic Update 2010). The govermentmust shift resources to production of tradable goods or risk getting into more debt, debt that willlead to slower future growth.
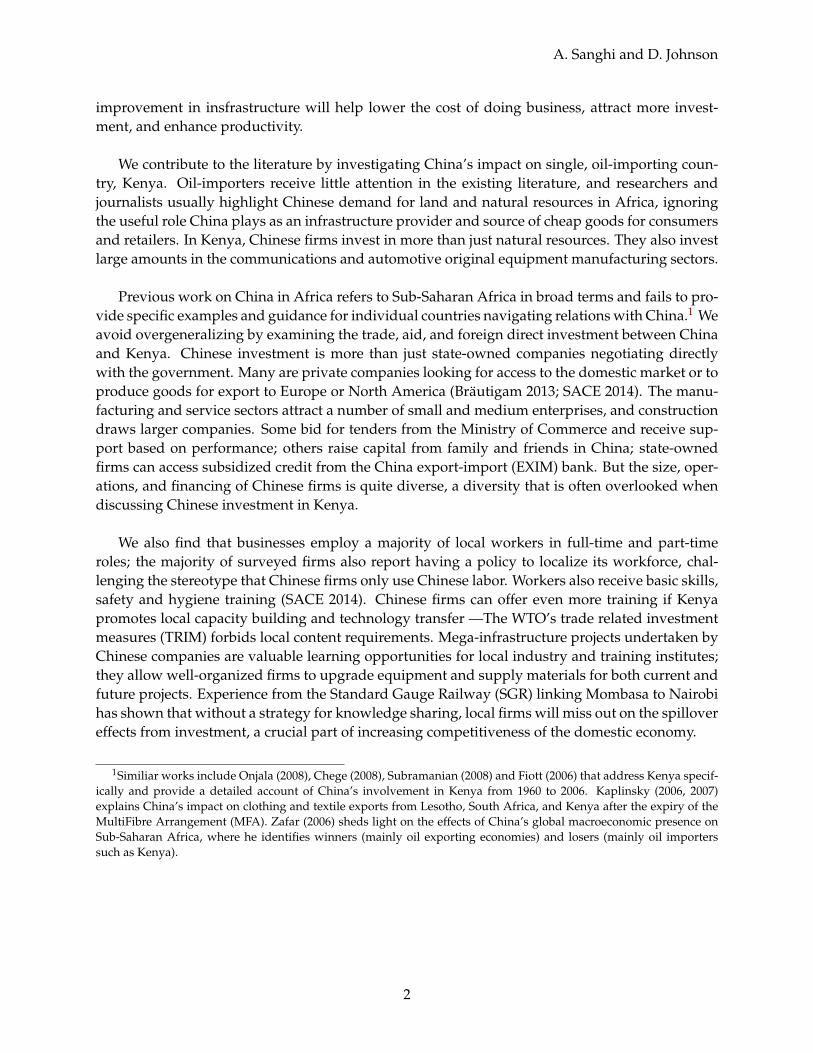
Figure 1 shows Kenya’s overall trade balance between 2000 and 2014. Kenya’s net exportshave fallen 14.74 percent per year over the period, reaching a low of negative US $12.2 billion in2014. The trade balance reflects a larger need of preparing exports for competitive markets. Ratherthan focusing on exports to the Chinese market, Kenya should seek global markets and improveexport competitiveness: curbing inflation and real exchange rate appreciation, reducing high tar-iffs on manufacturing inputs, and attracting more FDI into manufacturing. A key component toacheiving export competitiveness is the port of Mombasa. Greater efficiency at the port will cutthe time for goods to reach Nairobi and help Kenya’s regional exports. To improve the export cli-mate, Farole and Mukim (2013) recommend enforcing competition law especially in the transportsector, creating an automated risk management system to speed up risk-free cargo through cus-toms, and creating a trade information portal on general tariff rates, preferential rates, and qualitystandards.
−12500
−10000
−7500
−5000
−2500
0
Dec.00 Dec.01 Dec.02 Dec.03 Dec.04 Dec.05 Dec.06 Dec.07 Dec.08 Dec.09 Dec.10 Dec.11 Dec.12 Dec.13 Nov.14
Year
Trad
e B
alan
ce (
US
D M
illio
ns)
Figure 1: Kenya’s overall trade balance is a bigger concern
Source: Central Bank of Kenya 2015
2.2 China is a large source of imports for Kenya
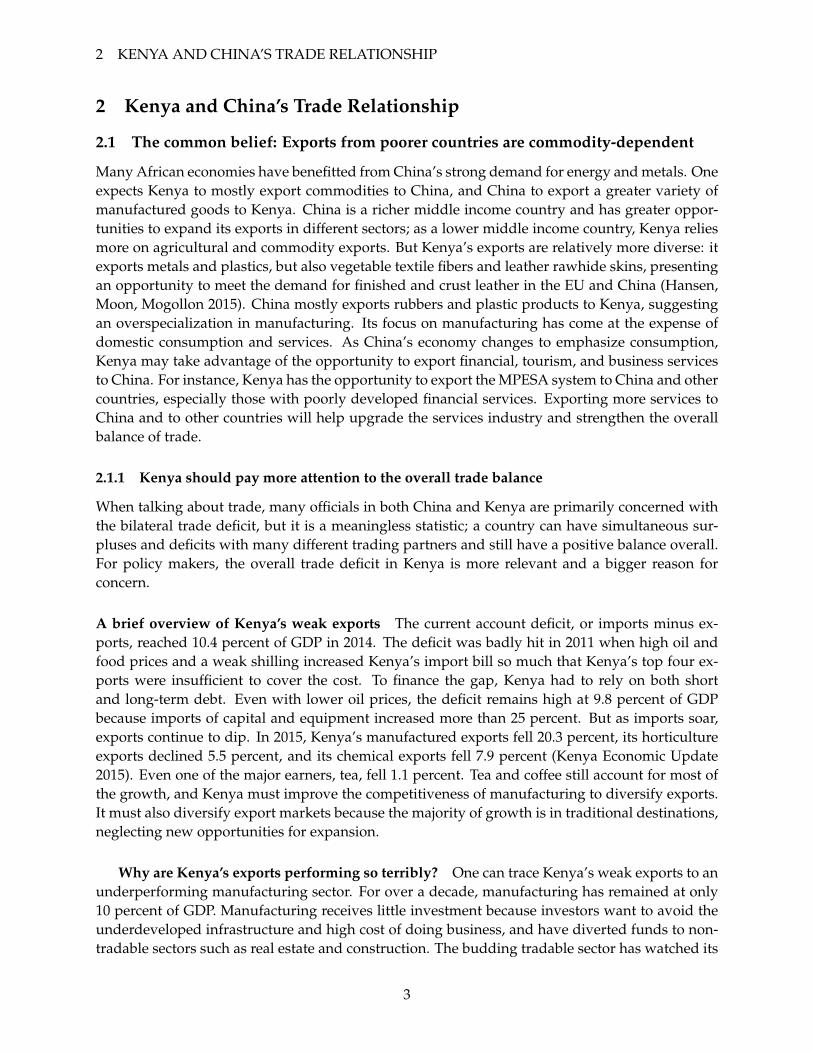
Figure 2 shows Kenya’s imports from China between 2012 and 2014. China’s share of Kenya’stotal imports has increased significantly. In 2012, Kenya’s imports from China were 12 percent oftotal imports, but by 2014, they rose to 23 percent.
Kenyan consumers benefit thanks to a larger quantity of cheap Chinese products in the market.From 2012 to 2014, consumers enjoyed a ten percent lower unit price on manufactured goods anda seven percent lower unit price on chemicals. Consumers are gaining, but policy makers fear
4
2 KENYA AND CHINA’S TRADE RELATIONSHIP
that local producers are suffering from cheap Chinese goods. Some even argue that imports arehurting Kenya’s prospects of industrialization.
0
10000
20000
2012 2013 2014Year
Impo
rts
(US
D m
illio
ns)
China, P.R.: MainlandWorld
Figure 2: China takes a sizeable share of total Kenyan imports (2012-2014)
Source: IMF World Economic Outlook Database 2014
1000
2000
3000
2004 2006 2008 2010 2012Year
Impo
rts
(US
D M
illio
ns)
China, P.R.: Mainland
India
Japan
South Africa
United Arab Emirates
(a) China and India are a major source of imports(2004-2013)
0
1000
2000
3000
Country
Impo
rts
(US
D M
illio
ns)
China, P.R.: Mainland
India
Japan
South Africa
United Arab Emirates
(b) China and India were top two sources of imports (2013)
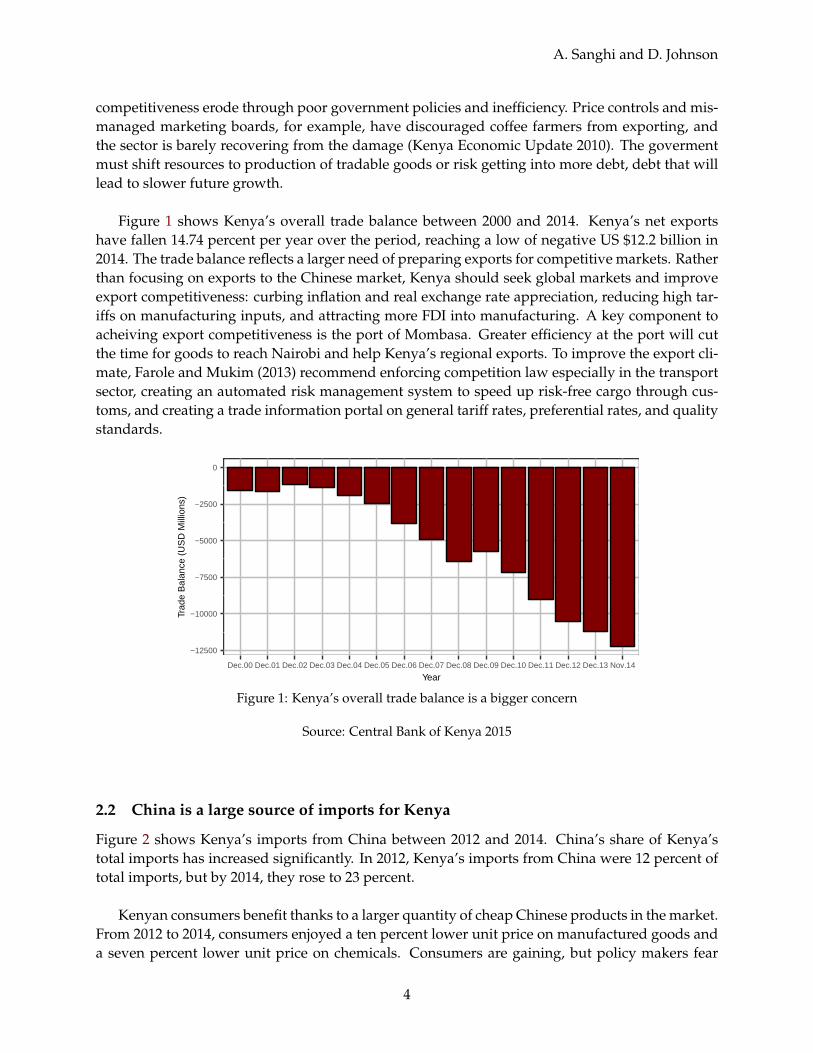
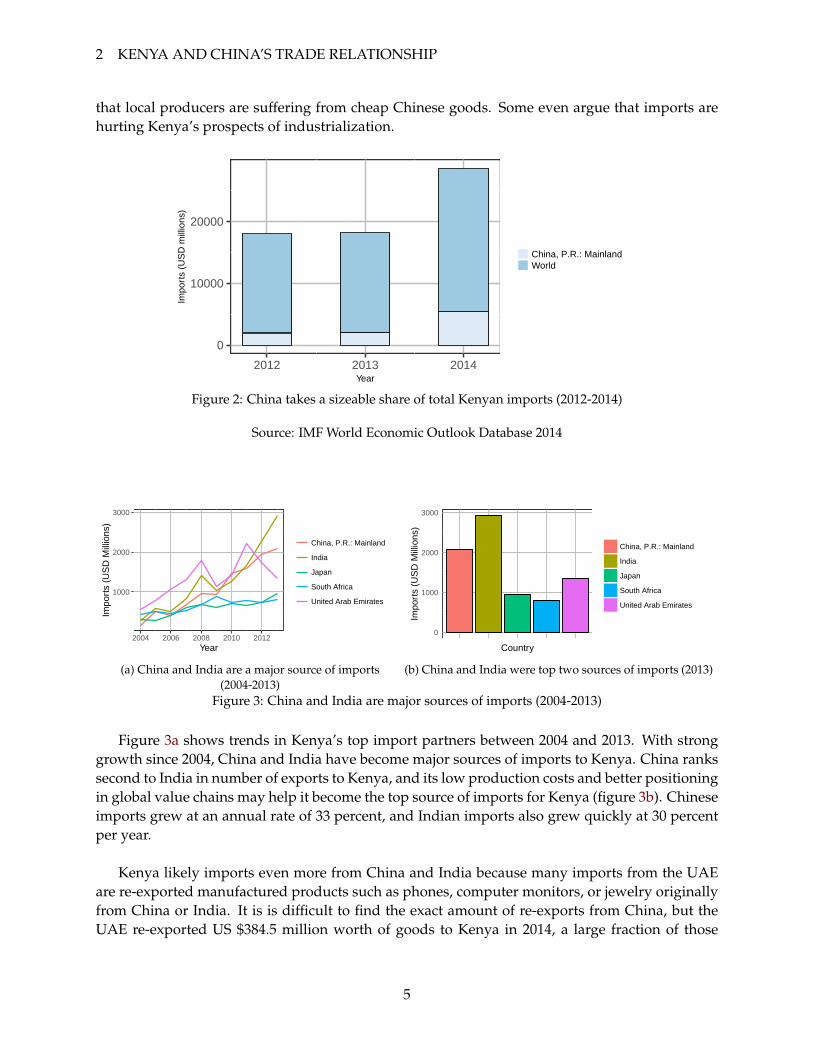
Figure 3: China and India are major sources of imports (2004-2013)
Figure 3a shows trends in Kenya’s top import partners between 2004 and 2013. With stronggrowth since 2004, China and India have become major sources of imports to Kenya. China rankssecond to India in number of exports to Kenya, and its low production costs and better positioningin global value chains may help it become the top source of imports for Kenya (figure 3b). Chineseimports grew at an annual rate of 33 percent, and Indian imports also grew quickly at 30 percentper year.
Kenya likely imports even more from China and India because many imports from the UAEare re-exported manufactured products such as phones, computer monitors, or jewelry originallyfrom China or India. It is is difficult to find the exact amount of re-exports from China, but theUAE re-exported US $384.5 million worth of goods to Kenya in 2014, a large fraction of those
5
A. Sanghi and D. Johnson
goods originating from China (UN Comtrade 2015).2
2.2.1 Kenya imports rubber manufactures from China
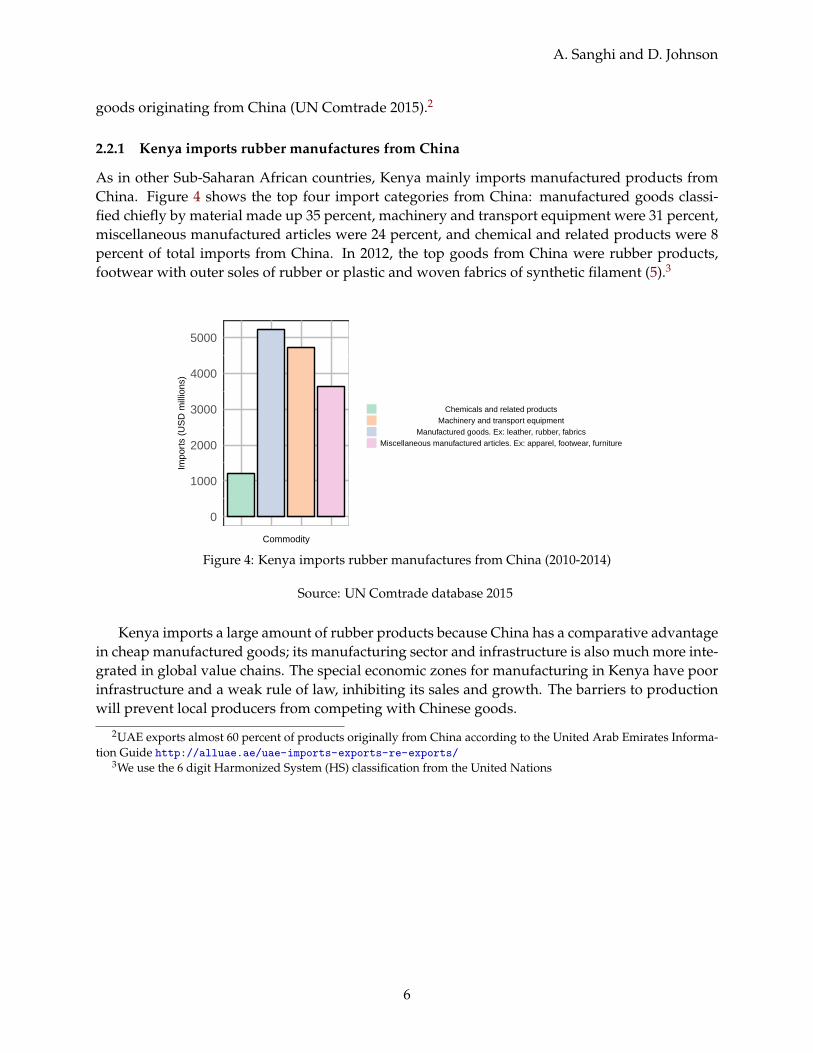
As in other Sub-Saharan African countries, Kenya mainly imports manufactured products fromChina. Figure 4 shows the top four import categories from China: manufactured goods classi-fied chiefly by material made up 35 percent, machinery and transport equipment were 31 percent,miscellaneous manufactured articles were 24 percent, and chemical and related products were 8percent of total imports from China. In 2012, the top goods from China were rubber products,footwear with outer soles of rubber or plastic and woven fabrics of synthetic filament (5).3
0
1000
2000
3000
4000
5000
Commodity
Impo
rts
(US
D m
illio
ns)
Chemicals and related productsMachinery and transport equipment
Manufactured goods. Ex: leather, rubber, fabricsMiscellaneous manufactured articles. Ex: apparel, footwear, furniture
Figure 4: Kenya imports rubber manufactures from China (2010-2014)
Source: UN Comtrade database 2015
Kenya imports a large amount of rubber products because China has a comparative advantagein cheap manufactured goods; its manufacturing sector and infrastructure is also much more inte-grated in global value chains. The special economic zones for manufacturing in Kenya have poorinfrastructure and a weak rule of law, inhibiting its sales and growth. The barriers to productionwill prevent local producers from competing with Chinese goods.
2UAE exports almost 60 percent of products originally from China according to the United Arab Emirates Informa-tion Guide http://alluae.ae/uae-imports-exports-re-exports/
3We use the 6 digit Harmonized System (HS) classification from the United Nations
6
2 KENYA AND CHINA’S TRADE RELATIONSHIP
0
50
100
150
200
Commodity
Impo
rt V
alue
(U
SD
Mill
ions
)
Mineral, petroleum oilsPlastics and polyethersRubber products, pneumatic tyres for buses and lorriesLeather, saddlery, handbags and suitcasesCotton and woven fabrics of cottonWoven fabrics of synthetic filamentRubber of plastic footwearCeramic productsTelevision, image and sound recorders, telephone setsMotorcycles and mopeds
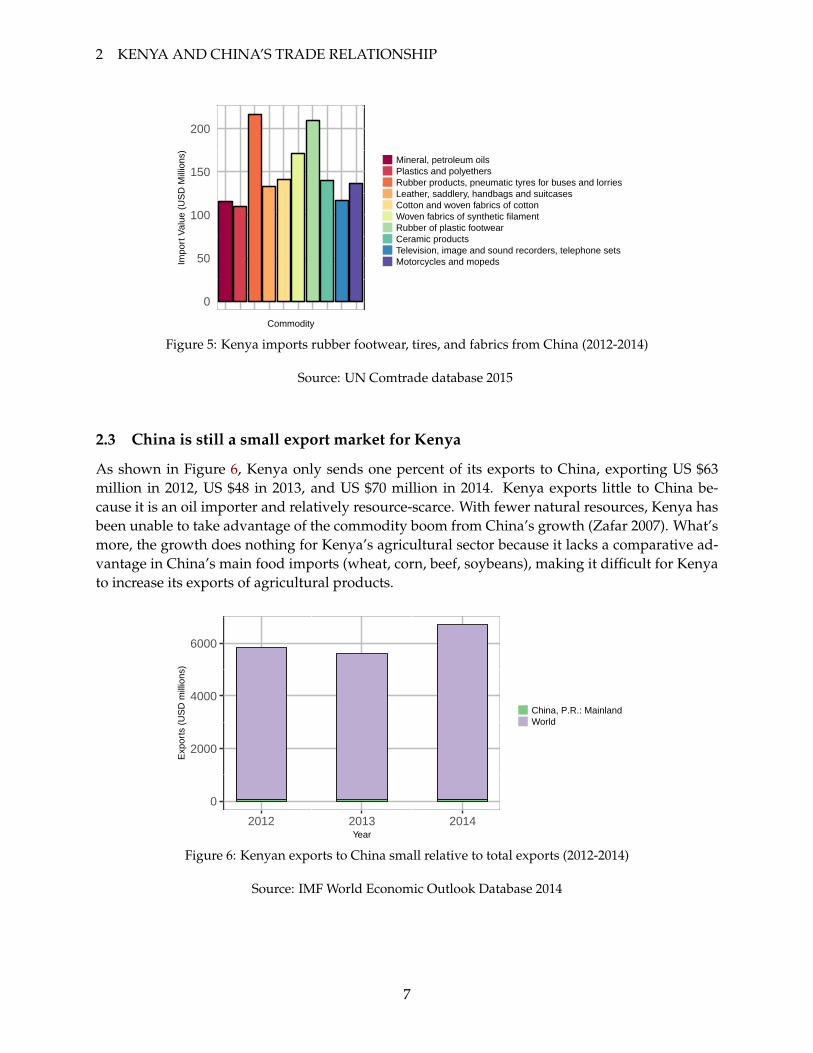
Figure 5: Kenya imports rubber footwear, tires, and fabrics from China (2012-2014)
Source: UN Comtrade database 2015
2.3 China is still a small export market for Kenya
As shown in Figure 6, Kenya only sends one percent of its exports to China, exporting US $63million in 2012, US $48 in 2013, and US $70 million in 2014. Kenya exports little to China be-cause it is an oil importer and relatively resource-scarce. With fewer natural resources, Kenya hasbeen unable to take advantage of the commodity boom from China’s growth (Zafar 2007). What’smore, the growth does nothing for Kenya’s agricultural sector because it lacks a comparative ad-vantage in China’s main food imports (wheat, corn, beef, soybeans), making it difficult for Kenyato increase its exports of agricultural products.
0
2000
4000
6000
2012 2013 2014Year
Exp
orts
(U
SD
mill
ions
)
China, P.R.: MainlandWorld
Figure 6: Kenyan exports to China small relative to total exports (2012-2014)
Source: IMF World Economic Outlook Database 2014
7
A. Sanghi and D. Johnson
2.3.1 Kenya exports raw goods and metals to China
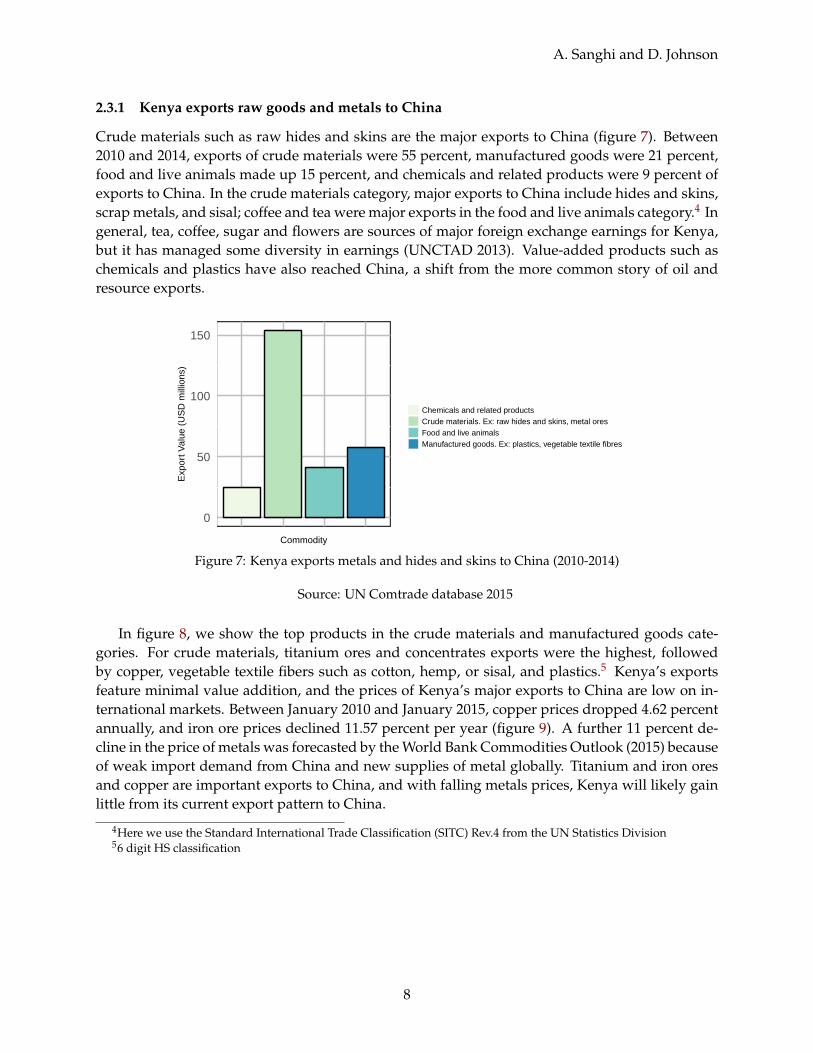
Crude materials such as raw hides and skins are the major exports to China (figure 7). Between2010 and 2014, exports of crude materials were 55 percent, manufactured goods were 21 percent,food and live animals made up 15 percent, and chemicals and related products were 9 percent ofexports to China. In the crude materials category, major exports to China include hides and skins,scrap metals, and sisal; coffee and tea were major exports in the food and live animals category.4 Ingeneral, tea, coffee, sugar and flowers are sources of major foreign exchange earnings for Kenya,but it has managed some diversity in earnings (UNCTAD 2013). Value-added products such aschemicals and plastics have also reached China, a shift from the more common story of oil andresource exports.
0
50
100
150
Commodity
Exp
ort V
alue
(U
SD
mill
ions
)
Chemicals and related productsCrude materials. Ex: raw hides and skins, metal oresFood and live animalsManufactured goods. Ex: plastics, vegetable textile fibres
Figure 7: Kenya exports metals and hides and skins to China (2010-2014)
Source: UN Comtrade database 2015
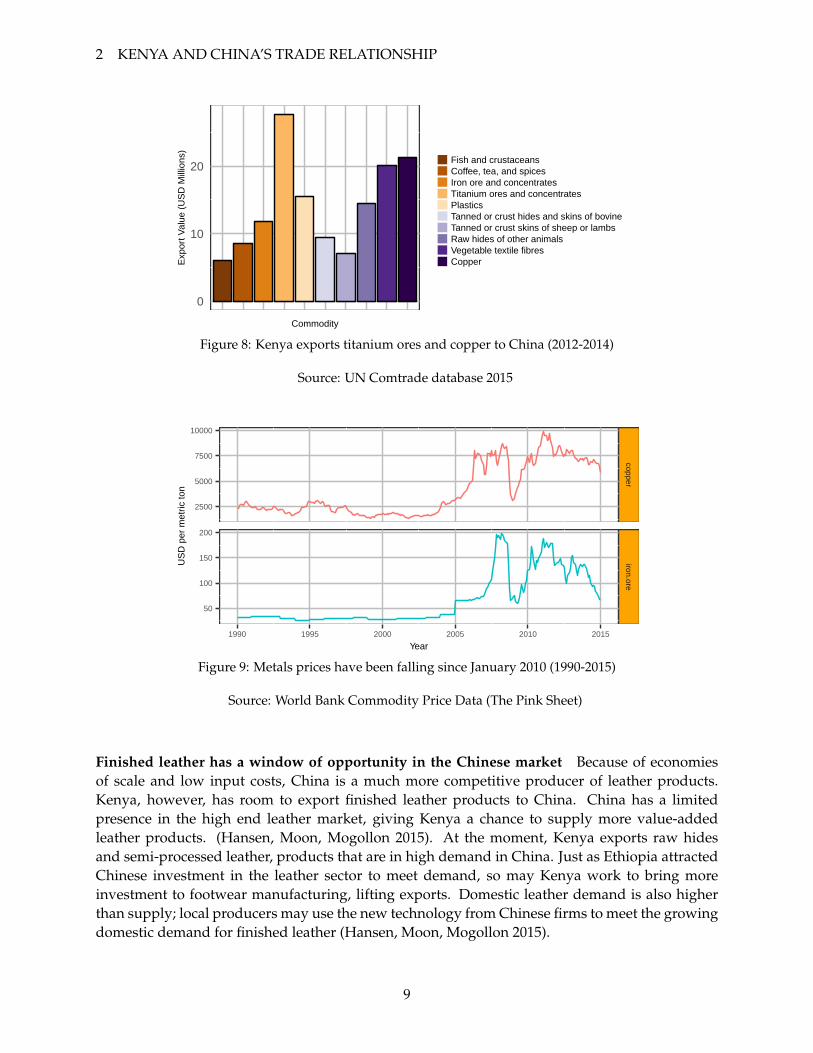
In figure 8, we show the top products in the crude materials and manufactured goods cate-gories. For crude materials, titanium ores and concentrates exports were the highest, followedby copper, vegetable textile fibers such as cotton, hemp, or sisal, and plastics.5 Kenya’s exportsfeature minimal value addition, and the prices of Kenya’s major exports to China are low on in-ternational markets. Between January 2010 and January 2015, copper prices dropped 4.62 percentannually, and iron ore prices declined 11.57 percent per year (figure 9). A further 11 percent de-cline in the price of metals was forecasted by the World Bank Commodities Outlook (2015) becauseof weak import demand from China and new supplies of metal globally. Titanium and iron oresand copper are important exports to China, and with falling metals prices, Kenya will likely gainlittle from its current export pattern to China.
4Here we use the Standard International Trade Classification (SITC) Rev.4 from the UN Statistics Division56 digit HS classification
8
2 KENYA AND CHINA’S TRADE RELATIONSHIP
0
10
20
Commodity
Exp
ort V
alue
(U
SD
Mill
ions
)
Fish and crustaceansCoffee, tea, and spicesIron ore and concentratesTitanium ores and concentratesPlasticsTanned or crust hides and skins of bovineTanned or crust skins of sheep or lambsRaw hides of other animalsVegetable textile fibresCopper
Figure 8: Kenya exports titanium ores and copper to China (2012-2014)
Source: UN Comtrade database 2015
2500
5000
7500
10000
50
100
150
200
copperiron.ore
1990 1995 2000 2005 2010 2015
Year
US
D p
er m
etric
ton
Figure 9: Metals prices have been falling since January 2010 (1990-2015)
Source: World Bank Commodity Price Data (The Pink Sheet)
Finished leather has a window of opportunity in the Chinese market Because of economiesof scale and low input costs, China is a much more competitive producer of leather products.Kenya, however, has room to export finished leather products to China. China has a limitedpresence in the high end leather market, giving Kenya a chance to supply more value-addedleather products. (Hansen, Moon, Mogollon 2015). At the moment, Kenya exports raw hidesand semi-processed leather, products that are in high demand in China. Just as Ethiopia attractedChinese investment in the leather sector to meet demand, so may Kenya work to bring moreinvestment to footwear manufacturing, lifting exports. Domestic leather demand is also higherthan supply; local producers may use the new technology from Chinese firms to meet the growingdomestic demand for finished leather (Hansen, Moon, Mogollon 2015).
9
A. Sanghi and D. Johnson
2.4 Winners and Losers from Kenya’s current trade patterns
2.4.1 The net benefit to the economy is positive
Cheaper Chinese finished and intermediate goods provide an overall benefit to the economy. Chi-nese competition forces uncompetitive firms out of the market and eliminates the deadweight lossin the domestic economy. Firms that remain are able to improve efficiency and upgrade standardsto supply inputs to Chinese companies. During the Standard Gauge Railway construction, localcement producers upgraded their production to meet international standards and supply part ofthe railway. Firms that use Chinese goods as intermediate inputs improve their efficiency, andinformal sector firms that use intermediates increase their retail margins and create more employ-ment. Some well-organized producers may lose out, but economic theory tells us that the overallgain is positive.
2.4.2 Consumers and retailers gain
Consumers benefit from a greater variety of cheap consumer electronics and plastic and rubberproducts. Medicine, footwear, clothing, textiles and office supplies are now available to consumersat much lower prices, prompting side businesses reselling consumer products to enter the market.Between 2013 and 2014, the wholesale and retail trade sector grew at 6.9 percent, and shopkeepersin western Kenya had an average annualized return of 33 percent, although the median firm inthe study’s sample had an annualized return close to zero (Kremer et al 2011). Chinese goodsonly seem to help small retailers. Feinberg (2010) finds that small retailers in the United Statesare generally unaffected by currency appreciation, an indicator of higher imports; small retailerscan cope with greater imports and other economic shocks. Although the context is different, thestudy agrees with anecdotal evidence of more Kenyan retailers selling goods from China. Chinesegoods help small kiosks and shops earn greater profits, and since small shops make up 70 percentof shopping, Chinese goods appear to have benefitted retailers on a large scale.
China dominates the second-hand clothing and shoe market in Kenya Most consumers buyleather shoes and clothes from the mitumba, or second-hand markets. Mitumbas offer consumersquality brands from North America, Europe, and Asia at lower prices than local clothes. ButChina is still a major player in the mitumbas: 60 percent of second hand shoes come from Chinaand Hong Kong, and 60 percent of global leather footwear production and 40 percent of worldexports of leather footwear are also from China and Hong Kong (Hansen, Moon, Mogollon 2015).The prices of Chinese products are often significantly cheaper. A bale from China is half the priceof a bale from Germany, but the shoes are of different qualities. 80 percent of shoes in a bale fromEurope are leather, but only ten percent of shoes in a Chinese bale are leather, the rest being rubberor plastic. The rubber and plastic shoes sell better in urban mitumbas; leather shoes sell better inrural areas because people often walk long distances and need something durable (Hansen, Moon,Mogollon 2015).
2.4.3 Producers are worse off; some benefit from Chinese intermediate goods
The literature generally concludes that existing and potential local producers in Sub-SaharanAfrica are displaced by Chinese imports. Chinese imports have hurt textile and clothing pro-
10

2 KENYA AND CHINA’S TRADE RELATIONSHIP
duction, a sector that is 20 percent of all formal manufacturing employment in Kenya. Clothingenterprises employ mainly women, so a weaker industry worsens gender equality.
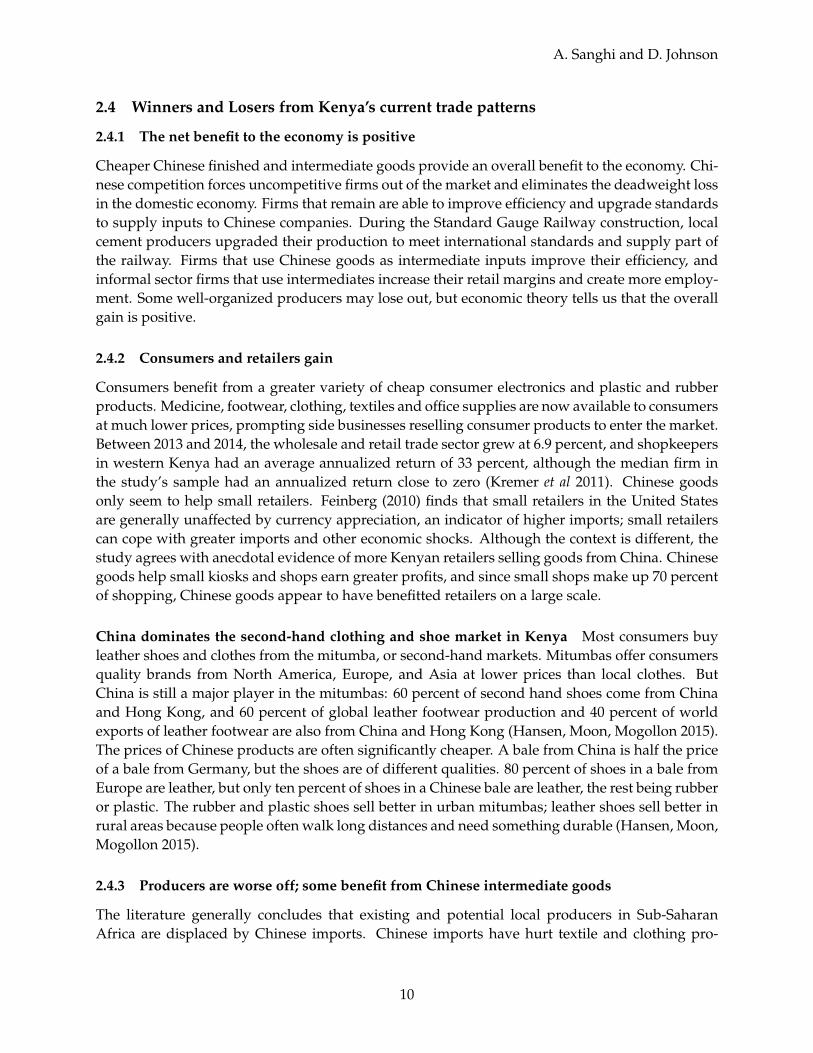
Some producers benefit from using Chinese intermediate goods in production When localproducers use intermediate goods, they can access goods unavailable locally to increase their pro-ductivity. Between 1990 and 2014, imports of intermediate and capital goods have grown 12.6percent annually (figure 10). Over time, many domestic businesses have switched to cheaper Chi-nese goods. Figure 11 shows imports from top trading partners: since 1990, Kenya’s imports fromChina have increased 26.7 percent per year, and are now 21.9 percent of imports, replacing goodsfrom other major sources. In 2014, only 6.9 percent of imports came from India and 4.5 percentcame from South Africa, two former major sources of intermediate inputs.6
0
2000
4000
6000
8000
10000
1990 1995 2000 2005 2010 2014
Year
Inte
rmed
iate
Goo
ds im
port
s (U
SD
Mill
ions
)
Figure 10: Kenya’s imports of intermediate goods is rising quickly
Source: UN Comtrade 2015
The top categories from China were processed industrial supplies, parts and accessories fortransport equipment, capital goods, primary industrial supplies, and food and beverages for in-dustry. Industry supplies were 77 percent, and transport equipment and capital goods were eachten percent of imports of intermediate goods. Imports of industrial supplies and transport equip-ment are high because of strong demand from the Standard Gauge Railway construction. In gen-eral, transport equipment contributes a large share to import growth, and the switch to Chineseimports cuts the cost of production.
6We use the Broad Economic Categories (BEC) classification for intermediate goods
11
A. Sanghi and D. Johnson
China India Japan
South Africa All countries All −−− All United States
0
20
40
60
80
0
20
40
60
80
1990 1995 2000 2005 2010 2014 1990 1995 2000 2005 2010 2014 1990 1995 2000 2005 2010 2014
Year
Per
cent
age
of to
tal i
nter
med
iate
goo
ds im
port
s
Figure 11: China’s share of Kenya’s intermediate goods imports is growing
Source: UN Comtrade 2015
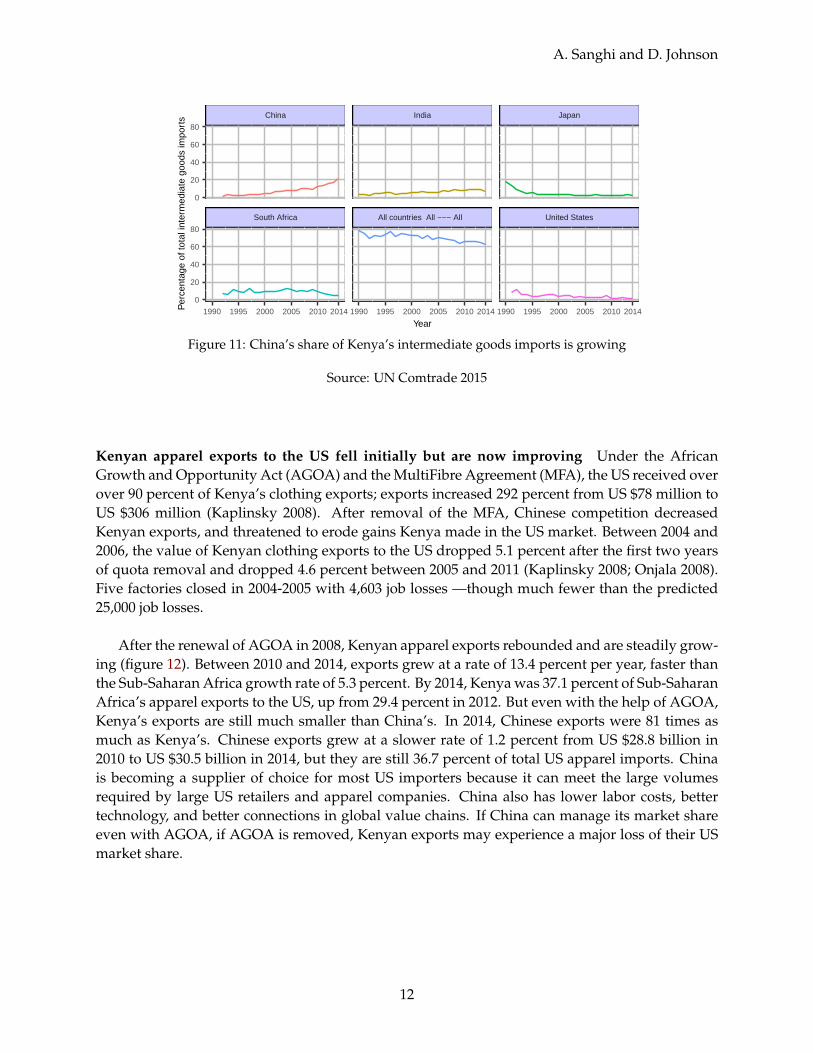
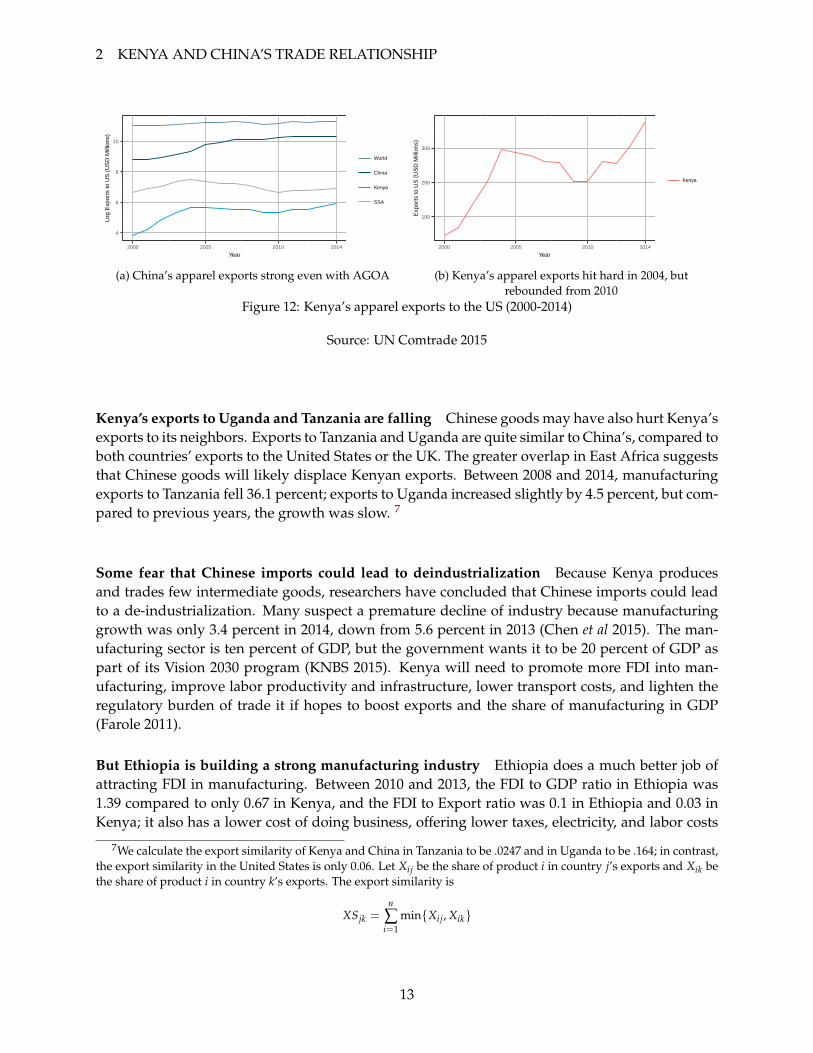
Kenyan apparel exports to the US fell initially but are now improving Under the AfricanGrowth and Opportunity Act (AGOA) and the MultiFibre Agreement (MFA), the US received overover 90 percent of Kenya’s clothing exports; exports increased 292 percent from US $78 million toUS $306 million (Kaplinsky 2008). After removal of the MFA, Chinese competition decreasedKenyan exports, and threatened to erode gains Kenya made in the US market. Between 2004 and2006, the value of Kenyan clothing exports to the US dropped 5.1 percent after the first two yearsof quota removal and dropped 4.6 percent between 2005 and 2011 (Kaplinsky 2008; Onjala 2008).Five factories closed in 2004-2005 with 4,603 job losses —though much fewer than the predicted25,000 job losses.
After the renewal of AGOA in 2008, Kenyan apparel exports rebounded and are steadily grow-ing (figure 12). Between 2010 and 2014, exports grew at a rate of 13.4 percent per year, faster thanthe Sub-Saharan Africa growth rate of 5.3 percent. By 2014, Kenya was 37.1 percent of Sub-SaharanAfrica’s apparel exports to the US, up from 29.4 percent in 2012. But even with the help of AGOA,Kenya’s exports are still much smaller than China’s. In 2014, Chinese exports were 81 times asmuch as Kenya’s. Chinese exports grew at a slower rate of 1.2 percent from US $28.8 billion in2010 to US $30.5 billion in 2014, but they are still 36.7 percent of total US apparel imports. Chinais becoming a supplier of choice for most US importers because it can meet the large volumesrequired by large US retailers and apparel companies. China also has lower labor costs, bettertechnology, and better connections in global value chains. If China can manage its market shareeven with AGOA, if AGOA is removed, Kenyan exports may experience a major loss of their USmarket share.
12
2 KENYA AND CHINA’S TRADE RELATIONSHIP
4
6
8
10
2000 2005 2010 2014
Year
Log
Exp
orts
to U
S (
US
D M
illio
ns)
World
China
Kenya
SSA
(a) China’s apparel exports strong even with AGOA
100
200
300
2000 2005 2010 2014
Year
Exp
orts
to U
S (
US
D M
illio
ns)
Kenya
(b) Kenya’s apparel exports hit hard in 2004, butrebounded from 2010
Figure 12: Kenya’s apparel exports to the US (2000-2014)
Source: UN Comtrade 2015
Kenya’s exports to Uganda and Tanzania are falling Chinese goods may have also hurt Kenya’sexports to its neighbors. Exports to Tanzania and Uganda are quite similar to China’s, compared toboth countries’ exports to the United States or the UK. The greater overlap in East Africa suggeststhat Chinese goods will likely displace Kenyan exports. Between 2008 and 2014, manufacturingexports to Tanzania fell 36.1 percent; exports to Uganda increased slightly by 4.5 percent, but com-pared to previous years, the growth was slow. 7
Some fear that Chinese imports could lead to deindustrialization Because Kenya producesand trades few intermediate goods, researchers have concluded that Chinese imports could leadto a de-industrialization. Many suspect a premature decline of industry because manufacturinggrowth was only 3.4 percent in 2014, down from 5.6 percent in 2013 (Chen et al 2015). The man-ufacturing sector is ten percent of GDP, but the government wants it to be 20 percent of GDP aspart of its Vision 2030 program (KNBS 2015). Kenya will need to promote more FDI into man-ufacturing, improve labor productivity and infrastructure, lower transport costs, and lighten theregulatory burden of trade it if hopes to boost exports and the share of manufacturing in GDP(Farole 2011).
But Ethiopia is building a strong manufacturing industry Ethiopia does a much better job ofattracting FDI in manufacturing. Between 2010 and 2013, the FDI to GDP ratio in Ethiopia was1.39 compared to only 0.67 in Kenya, and the FDI to Export ratio was 0.1 in Ethiopia and 0.03 inKenya; it also has a lower cost of doing business, offering lower taxes, electricity, and labor costs
7We calculate the export similarity of Kenya and China in Tanzania to be .0247 and in Uganda to be .164; in contrast,the export similarity in the United States is only 0.06. Let Xij be the share of product i in country j’s exports and Xik bethe share of product i in country k’s exports. The export similarity is
XSjk =n
∑i=1
min{Xij, Xik}
13
A. Sanghi and D. Johnson
than Kenya (Chen, Geiger, Fui 2015). Ethiopia’s manufacturing received 76 percent of total FDIfor projects in operation, and China is the second largest investor in manufacturing, investing US$545 million between 2008 and 2013; it also has 196 projects in operation, the greatest number ofprojects among all investors (Chen, Geiger, Fui 2015).
Within manufacturing, Ethiopia’s textiles, clothing, and leather sub-sector attracted US $2.5billion in investment. FDI in the textiles and clothing sub-sector is crucial for employment growth.In Ethiopia, 40,000 permanent jobs came from manufacturing FDI between 2008 and 2014, with22,000 manufacturing jobs originating from the textiles, clothing, leather and shoemaking sub-sectors (Chen, Geiger, Fui 2015). But many jobs in textiles and clothing come from two majorinvestors, China and India. Between 2008 and 2014, China created 24 percent and India createdsix percent of total jobs. If Kenya wishes to attract more manufacturing FDI from China and India,it will have to work towards lowering the cost of doing business to compete with Ethiopia’s morefavorable investment climate (Chen, Geiger, Fui 2015). Kenya has preferential access to the USmarket under AGOA, and may attract more manufacturing FDI in textiles to create permanentjobs and boost exports to the US market.
2.5 What drives Kenya’s exports?
2.5.1 Estimation
We estimate a gravity equation to explain what influences Kenya’s exports, and if Kenya underor over exports to China relative to comparable countries. The model is analogous to the physicalequation of gravity; just as the gravity is proportional to the mass of two planets and inverselyproportional to the distance between them, so are exports positively related to the sizes of thetwo economies and negatively related to the distance between the two economies. The detailedmodel is in appendix A.1. Using a full set of bilateral trade flows between all pairs of countriesas described in appendix B, we estimate a Poisson Quasi Maximum Likelihood regression modeldescribed in appendix A.
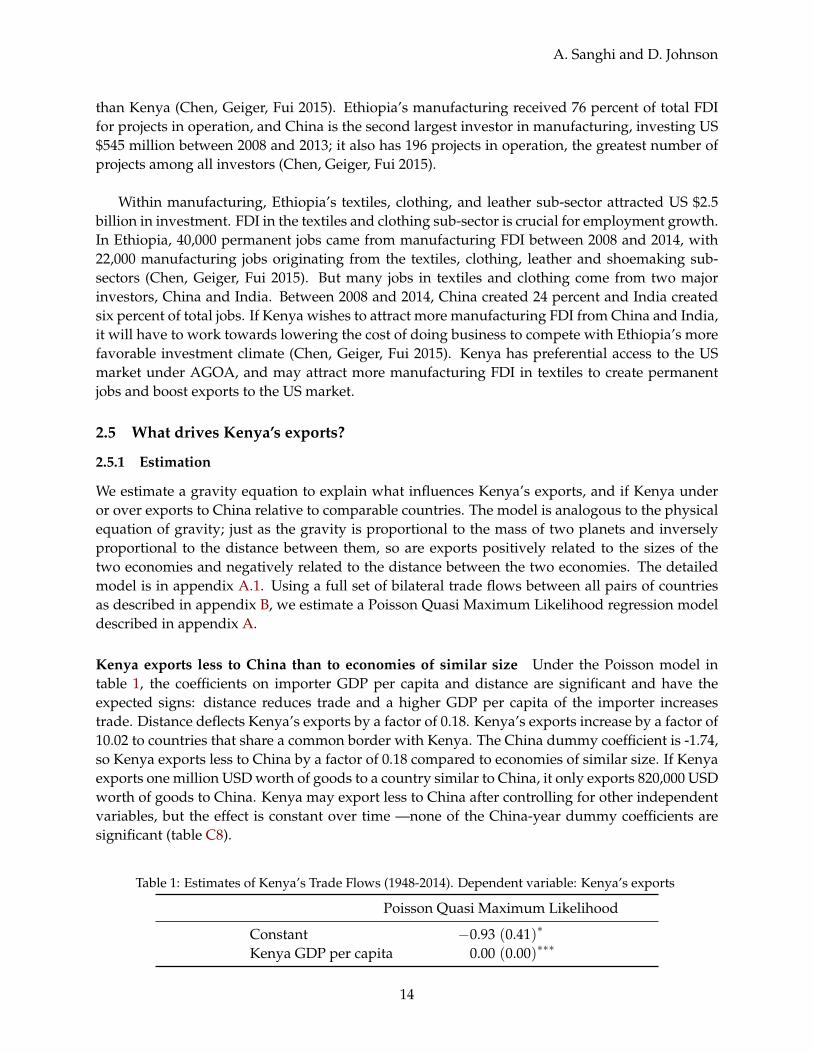
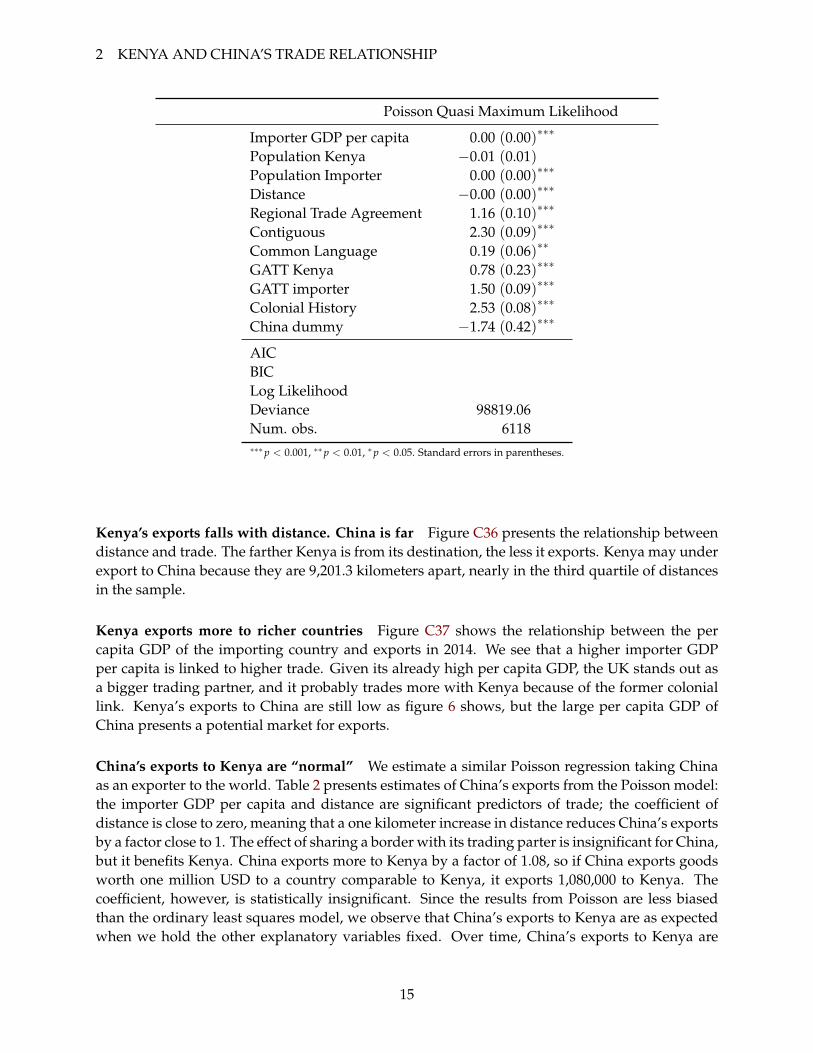
Kenya exports less to China than to economies of similar size Under the Poisson model intable 1, the coefficients on importer GDP per capita and distance are significant and have theexpected signs: distance reduces trade and a higher GDP per capita of the importer increasestrade. Distance deflects Kenya’s exports by a factor of 0.18. Kenya’s exports increase by a factor of10.02 to countries that share a common border with Kenya. The China dummy coefficient is -1.74,so Kenya exports less to China by a factor of 0.18 compared to economies of similar size. If Kenyaexports one million USD worth of goods to a country similar to China, it only exports 820,000 USDworth of goods to China. Kenya may export less to China after controlling for other independentvariables, but the effect is constant over time —none of the China-year dummy coefficients aresignificant (table C8).
Table 1: Estimates of Kenya’s Trade Flows (1948-2014). Dependent variable: Kenya’s exports
Poisson Quasi Maximum Likelihood
Constant −0.93 (0.41)∗
Kenya GDP per capita 0.00 (0.00)∗∗∗
14
2 KENYA AND CHINA’S TRADE RELATIONSHIP
Poisson Quasi Maximum Likelihood
Importer GDP per capita 0.00 (0.00)∗∗∗
Population Kenya −0.01 (0.01)Population Importer 0.00 (0.00)∗∗∗
Distance −0.00 (0.00)∗∗∗
Regional Trade Agreement 1.16 (0.10)∗∗∗
Contiguous 2.30 (0.09)∗∗∗
Common Language 0.19 (0.06)∗∗
GATT Kenya 0.78 (0.23)∗∗∗
GATT importer 1.50 (0.09)∗∗∗
Colonial History 2.53 (0.08)∗∗∗
China dummy −1.74 (0.42)∗∗∗
AICBICLog LikelihoodDeviance 98819.06Num. obs. 6118∗∗∗p < 0.001, ∗∗p < 0.01, ∗p < 0.05. Standard errors in parentheses.
Kenya’s exports falls with distance. China is far Figure C36 presents the relationship betweendistance and trade. The farther Kenya is from its destination, the less it exports. Kenya may underexport to China because they are 9,201.3 kilometers apart, nearly in the third quartile of distancesin the sample.
Kenya exports more to richer countries Figure C37 shows the relationship between the percapita GDP of the importing country and exports in 2014. We see that a higher importer GDPper capita is linked to higher trade. Given its already high per capita GDP, the UK stands out asa bigger trading partner, and it probably trades more with Kenya because of the former coloniallink. Kenya’s exports to China are still low as figure 6 shows, but the large per capita GDP ofChina presents a potential market for exports.
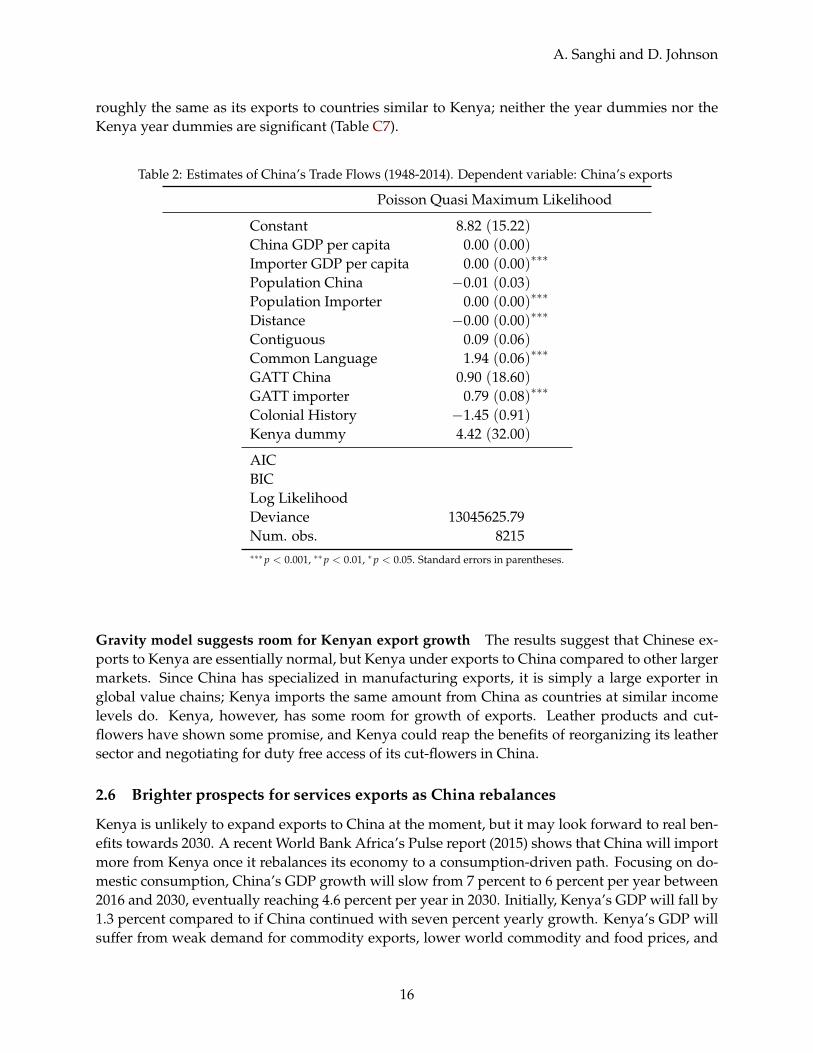
China’s exports to Kenya are “normal” We estimate a similar Poisson regression taking Chinaas an exporter to the world. Table 2 presents estimates of China’s exports from the Poisson model:the importer GDP per capita and distance are significant predictors of trade; the coefficient ofdistance is close to zero, meaning that a one kilometer increase in distance reduces China’s exportsby a factor close to 1. The effect of sharing a border with its trading parter is insignificant for China,but it benefits Kenya. China exports more to Kenya by a factor of 1.08, so if China exports goodsworth one million USD to a country comparable to Kenya, it exports 1,080,000 to Kenya. Thecoefficient, however, is statistically insignificant. Since the results from Poisson are less biasedthan the ordinary least squares model, we observe that China’s exports to Kenya are as expectedwhen we hold the other explanatory variables fixed. Over time, China’s exports to Kenya are
15
A. Sanghi and D. Johnson
roughly the same as its exports to countries similar to Kenya; neither the year dummies nor theKenya year dummies are significant (Table C7).
Table 2: Estimates of China’s Trade Flows (1948-2014). Dependent variable: China’s exports
Poisson Quasi Maximum Likelihood
Constant 8.82 (15.22)China GDP per capita 0.00 (0.00)Importer GDP per capita 0.00 (0.00)∗∗∗
Population China −0.01 (0.03)Population Importer 0.00 (0.00)∗∗∗
Distance −0.00 (0.00)∗∗∗
Contiguous 0.09 (0.06)Common Language 1.94 (0.06)∗∗∗
GATT China 0.90 (18.60)GATT importer 0.79 (0.08)∗∗∗
Colonial History −1.45 (0.91)Kenya dummy 4.42 (32.00)
AICBICLog LikelihoodDeviance 13045625.79Num. obs. 8215∗∗∗p < 0.001, ∗∗p < 0.01, ∗p < 0.05. Standard errors in parentheses.
Gravity model suggests room for Kenyan export growth The results suggest that Chinese ex-ports to Kenya are essentially normal, but Kenya under exports to China compared to other largermarkets. Since China has specialized in manufacturing exports, it is simply a large exporter inglobal value chains; Kenya imports the same amount from China as countries at similar incomelevels do. Kenya, however, has some room for growth of exports. Leather products and cut-flowers have shown some promise, and Kenya could reap the benefits of reorganizing its leathersector and negotiating for duty free access of its cut-flowers in China.
2.6 Brighter prospects for services exports as China rebalances
Kenya is unlikely to expand exports to China at the moment, but it may look forward to real ben-efits towards 2030. A recent World Bank Africa’s Pulse report (2015) shows that China will importmore from Kenya once it rebalances its economy to a consumption-driven path. Focusing on do-mestic consumption, China’s GDP growth will slow from 7 percent to 6 percent per year between2016 and 2030, eventually reaching 4.6 percent per year in 2030. Initially, Kenya’s GDP will fall by1.3 percent compared to if China continued with seven percent yearly growth. Kenya’s GDP willsuffer from weak demand for commodity exports, lower world commodity and food prices, and
16
2 KENYA AND CHINA’S TRADE RELATIONSHIP
higher spread on its sovereign bonds, the spread being already 600 basis points (6 percent) overUS Treasuries (World Bank Africa’s Pulse 2015).
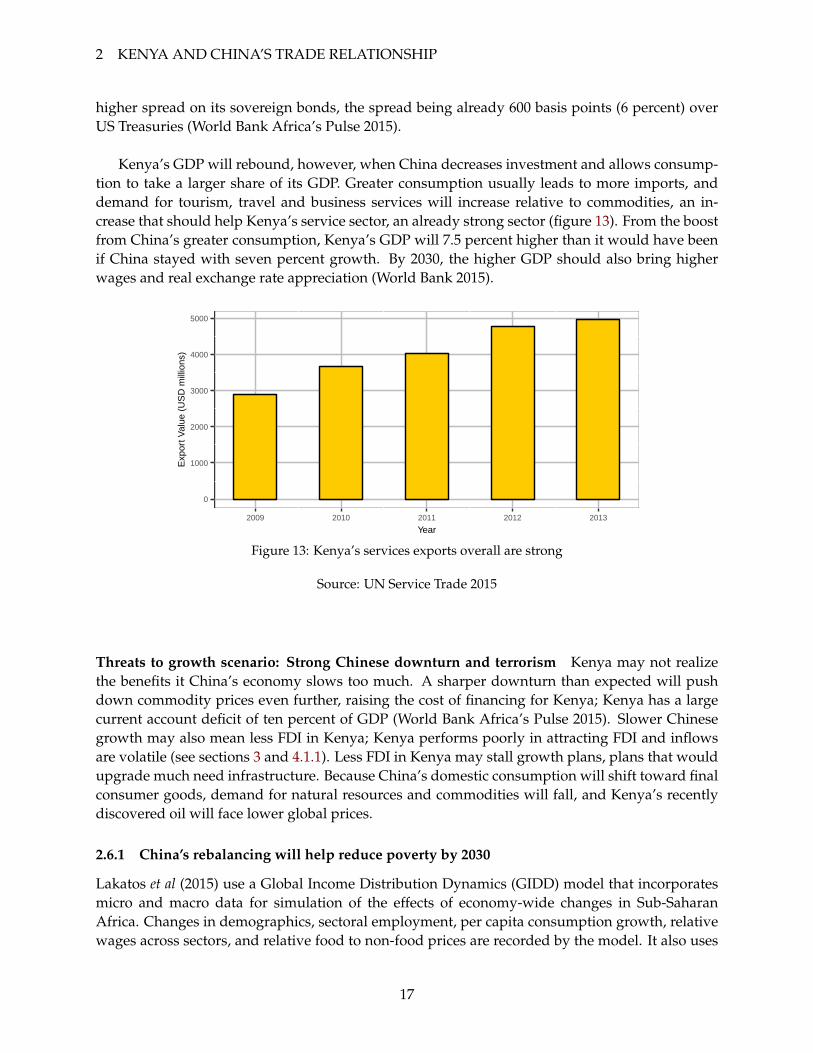
Kenya’s GDP will rebound, however, when China decreases investment and allows consump-tion to take a larger share of its GDP. Greater consumption usually leads to more imports, anddemand for tourism, travel and business services will increase relative to commodities, an in-crease that should help Kenya’s service sector, an already strong sector (figure 13). From the boostfrom China’s greater consumption, Kenya’s GDP will 7.5 percent higher than it would have beenif China stayed with seven percent growth. By 2030, the higher GDP should also bring higherwages and real exchange rate appreciation (World Bank 2015).
0
1000
2000
3000
4000
5000
2009 2010 2011 2012 2013
Year
Exp
ort V
alue
(U
SD
mill
ions
)
Figure 13: Kenya’s services exports overall are strong
Source: UN Service Trade 2015
Threats to growth scenario: Strong Chinese downturn and terrorism Kenya may not realizethe benefits it China’s economy slows too much. A sharper downturn than expected will pushdown commodity prices even further, raising the cost of financing for Kenya; Kenya has a largecurrent account deficit of ten percent of GDP (World Bank Africa’s Pulse 2015). Slower Chinesegrowth may also mean less FDI in Kenya; Kenya performs poorly in attracting FDI and inflowsare volatile (see sections 3 and 4.1.1). Less FDI in Kenya may stall growth plans, plans that wouldupgrade much need infrastructure. Because China’s domestic consumption will shift toward finalconsumer goods, demand for natural resources and commodities will fall, and Kenya’s recentlydiscovered oil will face lower global prices.
2.6.1 China’s rebalancing will help reduce poverty by 2030
Lakatos et al (2015) use a Global Income Distribution Dynamics (GIDD) model that incorporatesmicro and macro data for simulation of the effects of economy-wide changes in Sub-SaharanAfrica. Changes in demographics, sectoral employment, per capita consumption growth, relativewages across sectors, and relative food to non-food prices are recorded by the model. It also uses
17
A. Sanghi and D. Johnson
data from 130 countries and explicitly assesses the long-term behavior of income distributions,tracking demographic and educational changes over time.
Wealthier households in Sub-Saharan Africa benefit from demographic changes and wagechanges across sectors The wealthiest 40 percent of households will have higher per capita in-come growth from demographic changes, but the poorest 40 percent of households will see nobenefit. The poorest 20 percent of households will experience slower per capita income growthwhen demographic changes cause changes in relative wages across sectors. Upper middle incomehouseholds —those between the 60th and 80th percentile of the income distribution —will gainthe most from the wage changes, earning the fastest per capita income growth8
Poorer households are hurt by changes in food to non-food relative prices, but gain overallfrom Chinese slowdown and rebalancing Changes in food to non-food prices leave the poorest40 percent of households worse off: per capita income growth is 2.9 percent compared to the 3.07percent if China had continued to grow at seven percent. But thanks to greater Chinse consump-tion, the bottom 40 percent will increase their incomes; the number of people living in extremepoverty will fall by an additional 4.04 million people. The Chinese slowdown scenario increasespoverty initially, but the rebalancing reduces poverty enough for an overall drop. More important,the bottom 40 percent in Kenya will see a per capita income increase of 2.7 percent, the highest inSub-Saharan Africa (Lakatos et al 2015).
3 Foreign Direct Investment in Kenya
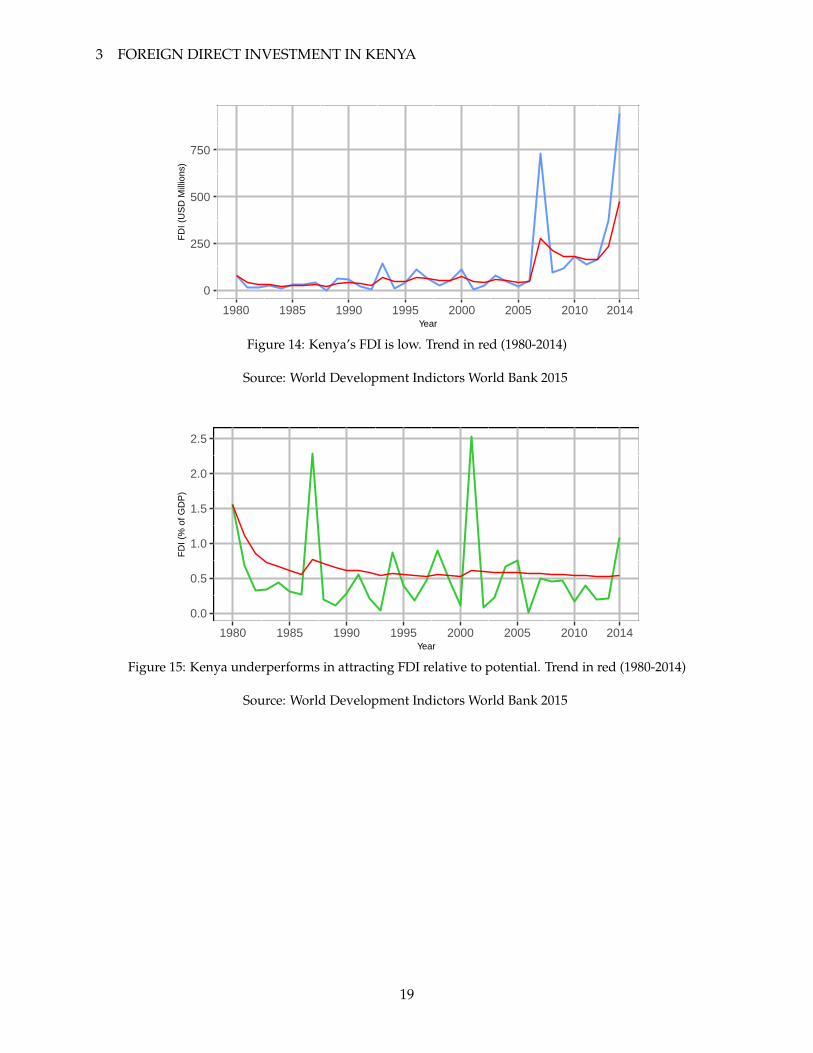
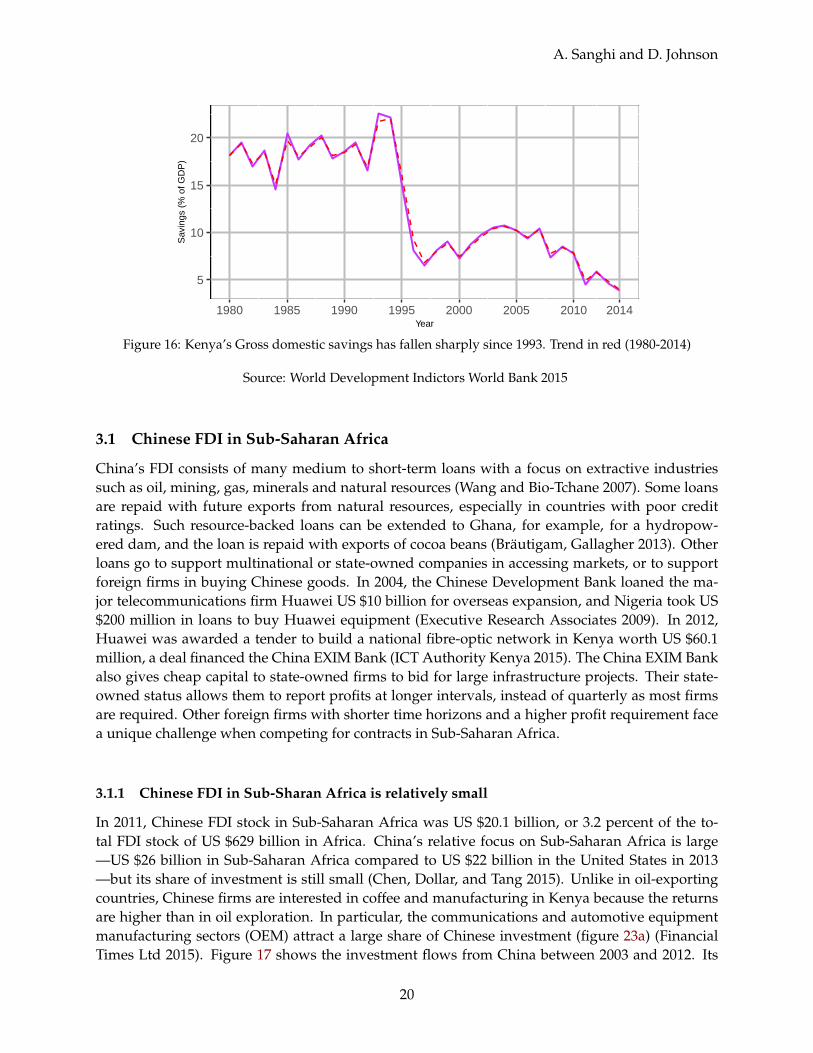
Kenya performs poorly in attracting foreign direct investment (FDI) given the size of its economy.Despite a larger economy, Kenya attracts even less FDI than Uganda and Tanzania. Figure 14shows Kenya’s net inflows of foreign direct investment (FDI) from 1980 to 2014. Kenya’s invest-ment levels dropped to less than 10 percent of GDP near 2000, but has since returned to levelsexperienced in the mid 1990s. Corruption, poor infrastructure, and poor investment climate havereduced foreign direct investment flows compared to pre 1980 levels. In 2007, Kenya receivedUS $729 million in FDI, but post-election violence in 2008 cut down flows to only US $96 mil-lion. Kenya has since recovered, but it only recently surpassed its former peak. Figure 15 showsKenya’s FDI as a percentage of GDP. The average FDI to GDP ratio between 1980 and 2014 was0.54. When compared with Kenya’s domestic savings rates, Kenya’s FDI signals a vulnerable cur-rent account because of weak domestic savings and investment. Figure 16 shows Kenya’s grossdomestic savings as a percent of GDP. From a peak of 22 in 1994, Kenya’s gross domestic savingsrate dropped to only 4 percent in 2014. Kenya’s savings rate is much lower than the average inSub-Saharan Africa of 20.4 percent. One reason for the low savings is Kenya’s large scale infras-tructure projects: the Standard Gauge Railway, Lamu berths, and Northern Corridor IntegrationProjects. Kenya’s high fiscal debt puts it at a sovereign risk level of B1 (Moody’s 2015; KPMG2013).9
8
9AAA is least risky and D is most risky.
18
3 FOREIGN DIRECT INVESTMENT IN KENYA
0
250
500
750
1980 1985 1990 1995 2000 2005 2010 2014Year
FD
I (U
SD
Mill
ions
)
Figure 14: Kenya’s FDI is low. Trend in red (1980-2014)
Source: World Development Indictors World Bank 2015
0.0
0.5
1.0
1.5
2.0
2.5
1980 1985 1990 1995 2000 2005 2010 2014Year
FD
I (%
of G
DP
)
Figure 15: Kenya underperforms in attracting FDI relative to potential. Trend in red (1980-2014)
Source: World Development Indictors World Bank 2015
19
A. Sanghi and D. Johnson
5
10
15
20
1980 1985 1990 1995 2000 2005 2010 2014Year
Sav
ings
(%
of G
DP
)
Figure 16: Kenya’s Gross domestic savings has fallen sharply since 1993. Trend in red (1980-2014)
Source: World Development Indictors World Bank 2015
3.1 Chinese FDI in Sub-Saharan Africa
China’s FDI consists of many medium to short-term loans with a focus on extractive industriessuch as oil, mining, gas, minerals and natural resources (Wang and Bio-Tchane 2007). Some loansare repaid with future exports from natural resources, especially in countries with poor creditratings. Such resource-backed loans can be extended to Ghana, for example, for a hydropow-ered dam, and the loan is repaid with exports of cocoa beans (Brautigam, Gallagher 2013). Otherloans go to support multinational or state-owned companies in accessing markets, or to supportforeign firms in buying Chinese goods. In 2004, the Chinese Development Bank loaned the ma-jor telecommunications firm Huawei US $10 billion for overseas expansion, and Nigeria took US$200 million in loans to buy Huawei equipment (Executive Research Associates 2009). In 2012,Huawei was awarded a tender to build a national fibre-optic network in Kenya worth US $60.1million, a deal financed the China EXIM Bank (ICT Authority Kenya 2015). The China EXIM Bankalso gives cheap capital to state-owned firms to bid for large infrastructure projects. Their state-owned status allows them to report profits at longer intervals, instead of quarterly as most firmsare required. Other foreign firms with shorter time horizons and a higher profit requirement facea unique challenge when competing for contracts in Sub-Saharan Africa.
3.1.1 Chinese FDI in Sub-Sharan Africa is relatively small
In 2011, Chinese FDI stock in Sub-Saharan Africa was US $20.1 billion, or 3.2 percent of the to-tal FDI stock of US $629 billion in Africa. China’s relative focus on Sub-Saharan Africa is large—US $26 billion in Sub-Saharan Africa compared to US $22 billion in the United States in 2013—but its share of investment is still small (Chen, Dollar, and Tang 2015). Unlike in oil-exportingcountries, Chinese firms are interested in coffee and manufacturing in Kenya because the returnsare higher than in oil exploration. In particular, the communications and automotive equipmentmanufacturing sectors (OEM) attract a large share of Chinese investment (figure 23a) (FinancialTimes Ltd 2015). Figure 17 shows the investment flows from China between 2003 and 2012. Its
20
3 FOREIGN DIRECT INVESTMENT IN KENYA
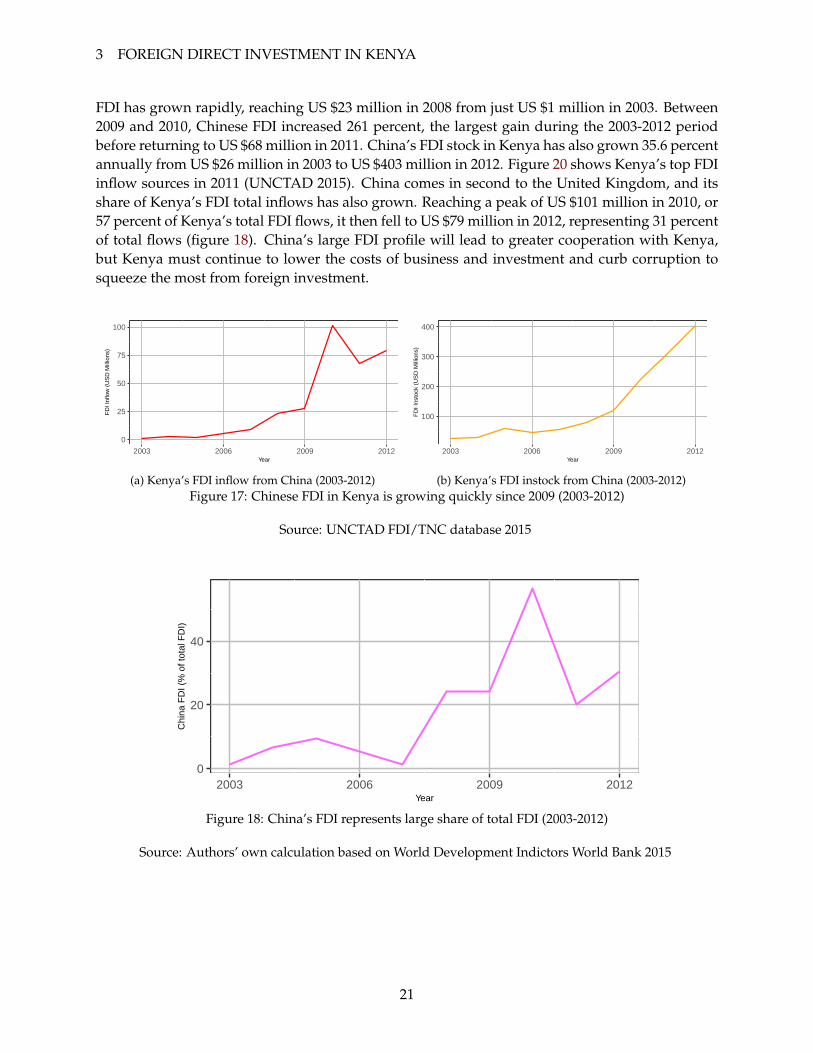
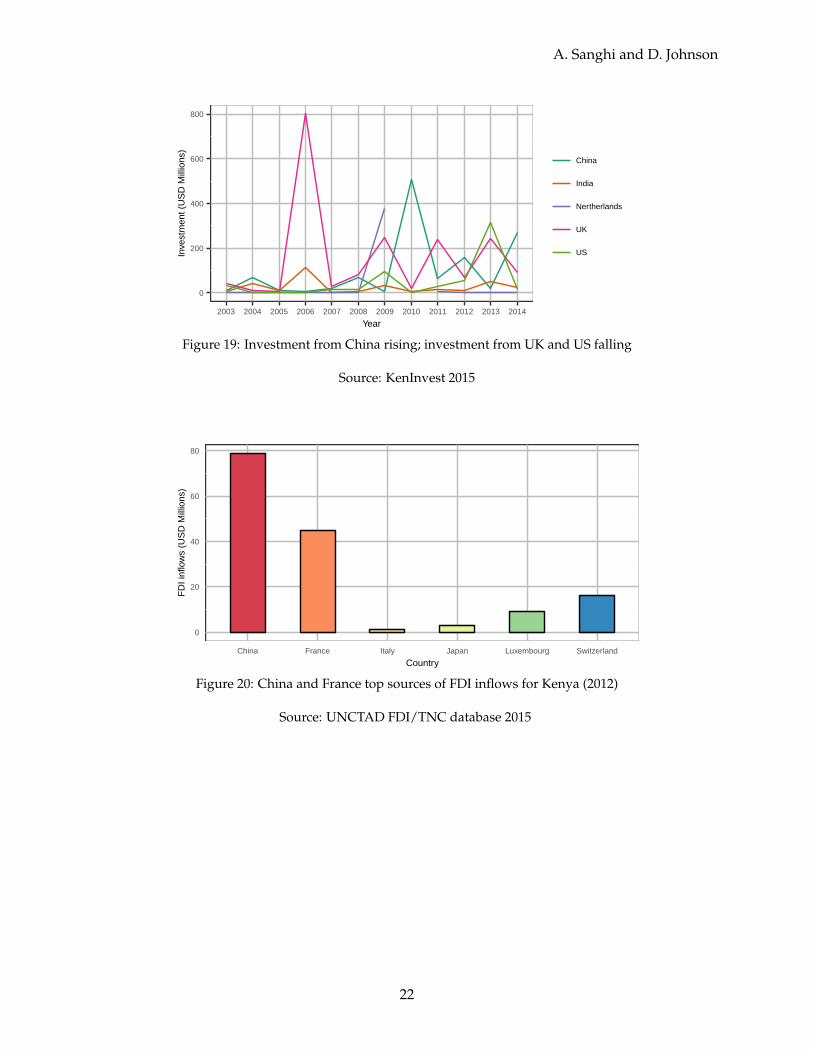
FDI has grown rapidly, reaching US $23 million in 2008 from just US $1 million in 2003. Between2009 and 2010, Chinese FDI increased 261 percent, the largest gain during the 2003-2012 periodbefore returning to US $68 million in 2011. China’s FDI stock in Kenya has also grown 35.6 percentannually from US $26 million in 2003 to US $403 million in 2012. Figure 20 shows Kenya’s top FDIinflow sources in 2011 (UNCTAD 2015). China comes in second to the United Kingdom, and itsshare of Kenya’s FDI total inflows has also grown. Reaching a peak of US $101 million in 2010, or57 percent of Kenya’s total FDI flows, it then fell to US $79 million in 2012, representing 31 percentof total flows (figure 18). China’s large FDI profile will lead to greater cooperation with Kenya,but Kenya must continue to lower the costs of business and investment and curb corruption tosqueeze the most from foreign investment.
0
25
50
75
100
2003 2006 2009 2012Year
FD
I Inf
low
(U
SD
Mill
ions
)
(a) Kenya’s FDI inflow from China (2003-2012)
100
200
300
400
2003 2006 2009 2012Year
FD
I Ins
tock
(U
SD
Mill
ions
)
(b) Kenya’s FDI instock from China (2003-2012)Figure 17: Chinese FDI in Kenya is growing quickly since 2009 (2003-2012)
Source: UNCTAD FDI/TNC database 2015
0
20
40
2003 2006 2009 2012Year
Chi
na F
DI (
% o
f tot
al F
DI)
Figure 18: China’s FDI represents large share of total FDI (2003-2012)
Source: Authors’ own calculation based on World Development Indictors World Bank 2015
21
A. Sanghi and D. Johnson
0
200
400
600
800
2003 2004 2005 2006 2007 2008 2009 2010 2011 2012 2013 2014
Year
Inve
stm
ent (
US
D M
illio
ns)
China
India
Nertherlands
UK
US
Figure 19: Investment from China rising; investment from UK and US falling
Source: KenInvest 2015
0
20
40
60
80
China France Italy Japan Luxembourg Switzerland
Country
FD
I inf
low
s (U
SD
Mill
ions
)
Figure 20: China and France top sources of FDI inflows for Kenya (2012)
Source: UNCTAD FDI/TNC database 2015
22
3 FOREIGN DIRECT INVESTMENT IN KENYA
0
200
400
600
800
China France South Africa Switzerland United Kingdom United States
Country
FD
I ins
tock
(U
SD
Mill
ions
)
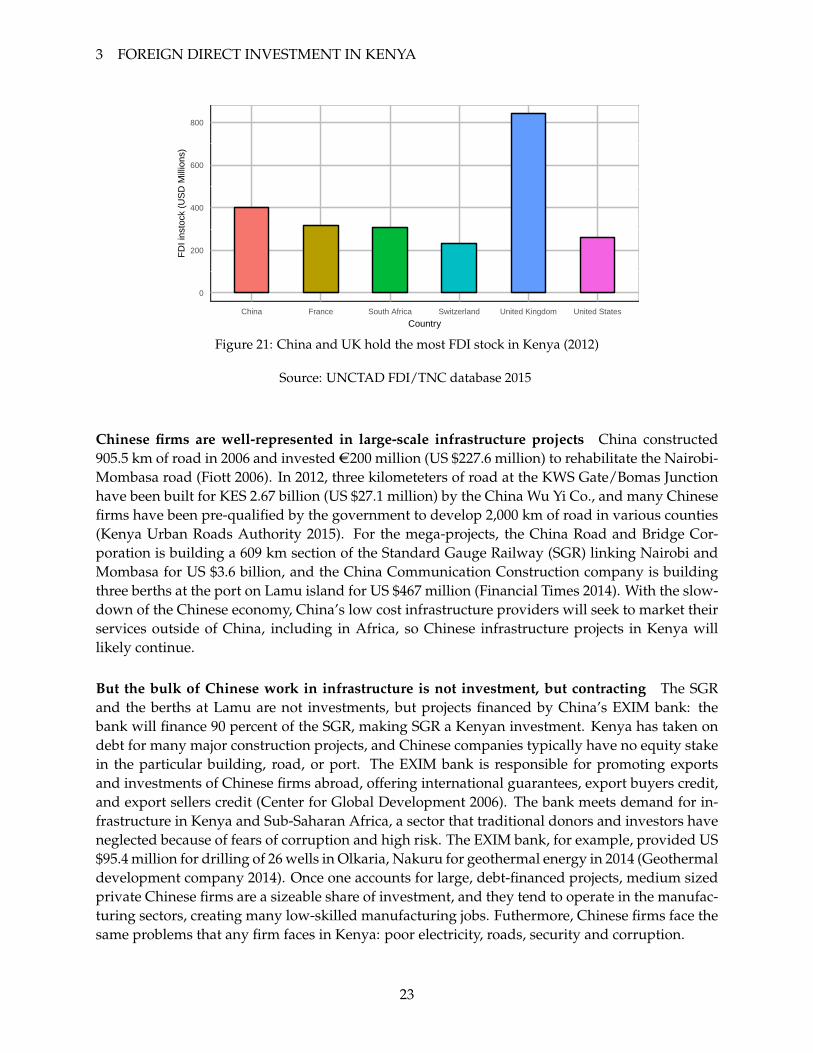
Figure 21: China and UK hold the most FDI stock in Kenya (2012)
Source: UNCTAD FDI/TNC database 2015
Chinese firms are well-represented in large-scale infrastructure projects China constructed905.5 km of road in 2006 and invested AC200 million (US $227.6 million) to rehabilitate the Nairobi-Mombasa road (Fiott 2006). In 2012, three kilometeters of road at the KWS Gate/Bomas Junctionhave been built for KES 2.67 billion (US $27.1 million) by the China Wu Yi Co., and many Chinesefirms have been pre-qualified by the government to develop 2,000 km of road in various counties(Kenya Urban Roads Authority 2015). For the mega-projects, the China Road and Bridge Cor-poration is building a 609 km section of the Standard Gauge Railway (SGR) linking Nairobi andMombasa for US $3.6 billion, and the China Communication Construction company is buildingthree berths at the port on Lamu island for US $467 million (Financial Times 2014). With the slow-down of the Chinese economy, China’s low cost infrastructure providers will seek to market theirservices outside of China, including in Africa, so Chinese infrastructure projects in Kenya willlikely continue.
But the bulk of Chinese work in infrastructure is not investment, but contracting The SGRand the berths at Lamu are not investments, but projects financed by China’s EXIM bank: thebank will finance 90 percent of the SGR, making SGR a Kenyan investment. Kenya has taken ondebt for many major construction projects, and Chinese companies typically have no equity stakein the particular building, road, or port. The EXIM bank is responsible for promoting exportsand investments of Chinese firms abroad, offering international guarantees, export buyers credit,and export sellers credit (Center for Global Development 2006). The bank meets demand for in-frastructure in Kenya and Sub-Saharan Africa, a sector that traditional donors and investors haveneglected because of fears of corruption and high risk. The EXIM bank, for example, provided US$95.4 million for drilling of 26 wells in Olkaria, Nakuru for geothermal energy in 2014 (Geothermaldevelopment company 2014). Once one accounts for large, debt-financed projects, medium sizedprivate Chinese firms are a sizeable share of investment, and they tend to operate in the manufac-turing sectors, creating many low-skilled manufacturing jobs. Futhermore, Chinese firms face thesame problems that any firm faces in Kenya: poor electricity, roads, security and corruption.
23

A. Sanghi and D. Johnson
3.2 Chinese companies in Kenya: From large state companies to small private ones
Kenya currently hosts around 400 Chinese firms spread across every sector. In February 2014,the Sino-African Centre of Excellence (SACE) foundation launched the Business Perception Index(BPI) survey to learn the views and experiences of Chinese companies in Kenya. The BPI surveyed75 companies: 25 state owned and 50 privately owned enterprises. Many firms in the sampleare in the manufacturing, construction, and resources sectors; Chinese firms are also involvedin trade, tourism, hotels, and restaurants. Chinese electrical companies are working with KenyaPower, the government-owned power company, to establish 33 power lines in five Kenyan towns:Kitale, Awendo, Konza and Kutus (Business Daily 2015). Oil companies are sure to be attractedto Kenya’s new oil discoveries in Turkana and the northwest part of the Rift Valley, but the UKbased Tullow Oil Plc has rights for drilling.
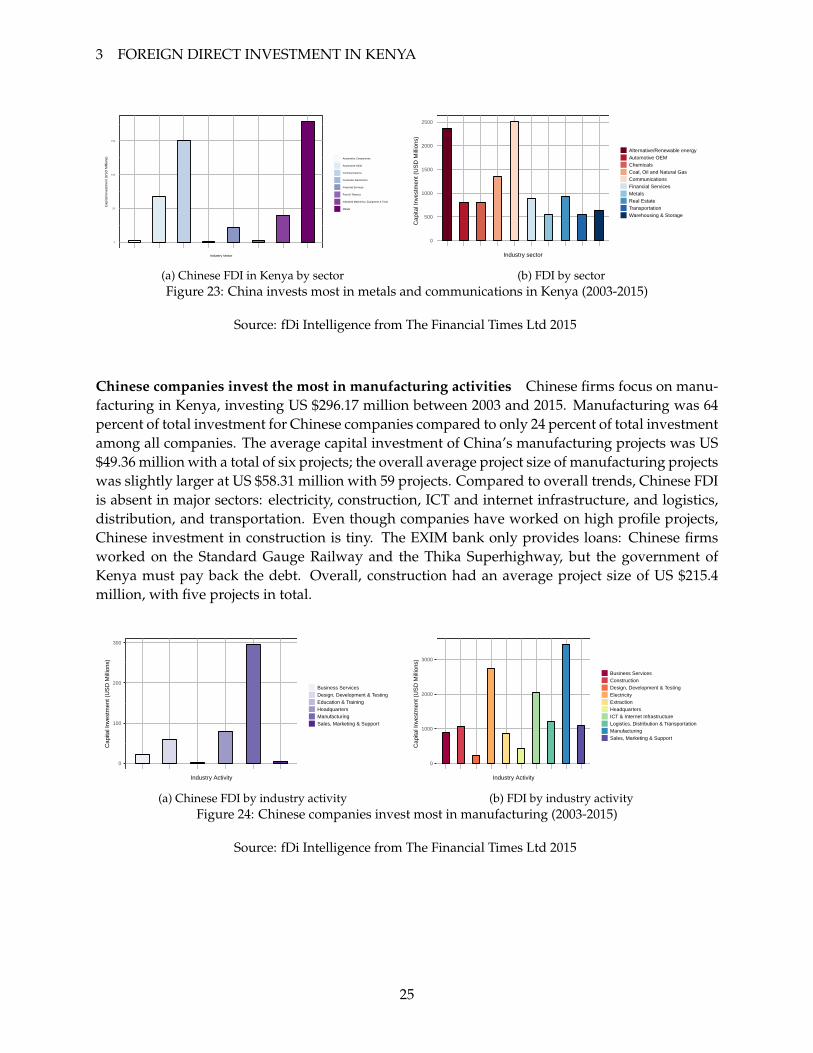
3.2.1 Chinese invest the most in metals, communications, and automotive original equipmentmanufacturing (OEM)
Figure 23a below gives the amount of Chinese investment by sector between 2003 and 2015. Chi-nese companies invested US $178.9 million in metals, US $150.9 in communications, and US $68million in automotive original equipment manufacturing (OEM). Investment in metals fits withKenya’s high exports of titanium ores and copper to China. Companies also want to take advan-tage of the growing telecommunications market in Kenya: the number of mobile telephone hasgrown significantly in the last five years, reaching over 33 million subscribers in 2014; Chinesefirms such as Huawei and ZTE wish to compete with other major companies such as Nokia orEricsson (see figure 22). Figure 23b shows the overall distribution of Kenya’s FDI. The top sectorsare communications at US $2.51 billion, alternative and renewable energy at US $2.36 billion, andcoal, oil and natural gas at US $1.35 billion. In total, Chinese companies contributed US $464.75million in capital investment with an average investment of US $35.75 million per project; otherforeign companies in Kenya had a similar project size of US $35.5 million.
0
10
20
30
2000 2002 2004 2006 2008 2010 2012 2014
Year
Sub
scrib
ers
(Mill
ions
)
Figure 22: Kenya’s mobile telephone subscriptions grew quickly over last decade
Source: International Telecommunications Union 2016
24
3 FOREIGN DIRECT INVESTMENT IN KENYA
0
50
100
150
Industry sector
Cap
ital I
nves
tmen
t (U
SD
Mill
ions
)
Automotive Components
Automotive OEM
Communications
Consumer Electronics
Financial Services
Food & Tobacco
Industrial Machinery, Equipment & Tools
Metals
(a) Chinese FDI in Kenya by sector
0
500
1000
1500
2000
2500
Industry sector
Cap
ital I
nves
tmen
t (U
SD
Mill
ions
)
Alternative/Renewable energyAutomotive OEMChemicalsCoal, Oil and Natural GasCommunicationsFinancial ServicesMetalsReal EstateTransportationWarehousing & Storage
(b) FDI by sectorFigure 23: China invests most in metals and communications in Kenya (2003-2015)
Source: fDi Intelligence from The Financial Times Ltd 2015
Chinese companies invest the most in manufacturing activities Chinese firms focus on manu-facturing in Kenya, investing US $296.17 million between 2003 and 2015. Manufacturing was 64percent of total investment for Chinese companies compared to only 24 percent of total investmentamong all companies. The average capital investment of China’s manufacturing projects was US$49.36 million with a total of six projects; the overall average project size of manufacturing projectswas slightly larger at US $58.31 million with 59 projects. Compared to overall trends, Chinese FDIis absent in major sectors: electricity, construction, ICT and internet infrastructure, and logistics,distribution, and transportation. Even though companies have worked on high profile projects,Chinese investment in construction is tiny. The EXIM bank only provides loans: Chinese firmsworked on the Standard Gauge Railway and the Thika Superhighway, but the government ofKenya must pay back the debt. Overall, construction had an average project size of US $215.4million, with five projects in total.
0
100
200
300
Industry Activity
Cap
ital I
nves
tmen
t (U
SD
Mill
ions
)
Business ServicesDesign, Development & TestingEducation & TrainingHeadquartersManufacturingSales, Marketing & Support
(a) Chinese FDI by industry activity
0
1000
2000
3000
Industry Activity
Cap
ital I
nves
tmen
t (U
SD
Mill
ions
)
Business ServicesConstructionDesign, Development & TestingElectricityExtractionHeadquartersICT & Internet InfrastructureLogistics, Distribution & TransportationManufacturingSales, Marketing & Support
(b) FDI by industry activityFigure 24: Chinese companies invest most in manufacturing (2003-2015)
Source: fDi Intelligence from The Financial Times Ltd 2015
25
A. Sanghi and D. Johnson
0
20
40
60
80
Industry Activity
Ave
rage
Cap
ital I
nves
tmen
t (U
SD
Mill
ions
)
Business ServicesDesign, Development & TestingEducation & TrainingHeadquartersManufacturingSales, Marketing & Support
(a) Average Chinese FDI by industry activity
0
50
100
150
200
Industry Activity
Ave
rage
Cap
ital I
nves
tmen
t (U
SD
Mill
ions
)
Business ServicesConstructionDesign, Development & TestingElectricityExtractionHeadquartersICT & Internet InfrastructureLogistics, Distribution & TransportationManufacturingSales, Marketing & Support
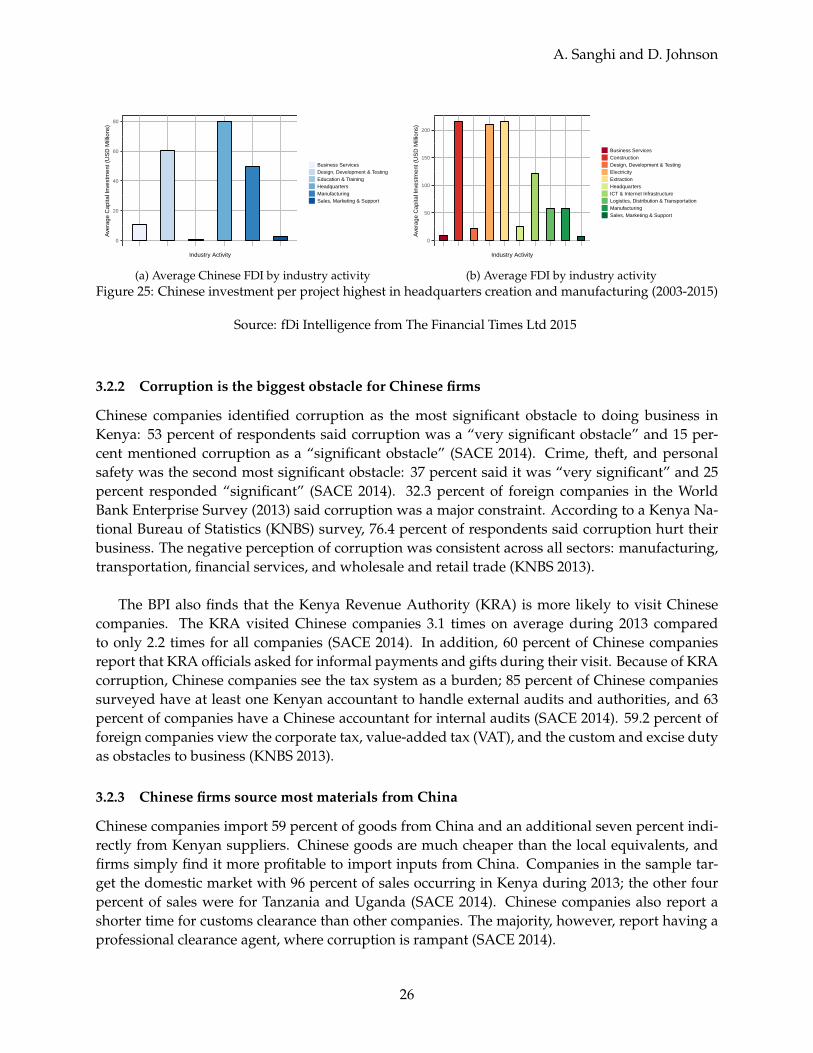
(b) Average FDI by industry activityFigure 25: Chinese investment per project highest in headquarters creation and manufacturing (2003-2015)
Source: fDi Intelligence from The Financial Times Ltd 2015
3.2.2 Corruption is the biggest obstacle for Chinese firms
Chinese companies identified corruption as the most significant obstacle to doing business inKenya: 53 percent of respondents said corruption was a “very significant obstacle” and 15 per-cent mentioned corruption as a “significant obstacle” (SACE 2014). Crime, theft, and personalsafety was the second most significant obstacle: 37 percent said it was “very significant” and 25percent responded “significant” (SACE 2014). 32.3 percent of foreign companies in the WorldBank Enterprise Survey (2013) said corruption was a major constraint. According to a Kenya Na-tional Bureau of Statistics (KNBS) survey, 76.4 percent of respondents said corruption hurt theirbusiness. The negative perception of corruption was consistent across all sectors: manufacturing,transportation, financial services, and wholesale and retail trade (KNBS 2013).
The BPI also finds that the Kenya Revenue Authority (KRA) is more likely to visit Chinesecompanies. The KRA visited Chinese companies 3.1 times on average during 2013 comparedto only 2.2 times for all companies (SACE 2014). In addition, 60 percent of Chinese companiesreport that KRA officials asked for informal payments and gifts during their visit. Because of KRAcorruption, Chinese companies see the tax system as a burden; 85 percent of Chinese companiessurveyed have at least one Kenyan accountant to handle external audits and authorities, and 63percent of companies have a Chinese accountant for internal audits (SACE 2014). 59.2 percent offoreign companies view the corporate tax, value-added tax (VAT), and the custom and excise dutyas obstacles to business (KNBS 2013).
3.2.3 Chinese firms source most materials from China
Chinese companies import 59 percent of goods from China and an additional seven percent indi-rectly from Kenyan suppliers. Chinese goods are much cheaper than the local equivalents, andfirms simply find it more profitable to import inputs from China. Companies in the sample tar-get the domestic market with 96 percent of sales occurring in Kenya during 2013; the other fourpercent of sales were for Tanzania and Uganda (SACE 2014). Chinese companies also report ashorter time for customs clearance than other companies. The majority, however, report having aprofessional clearance agent, where corruption is rampant (SACE 2014).
26

3 FOREIGN DIRECT INVESTMENT IN KENYA
3.2.4 Chinese firms employ a large share of local workers
Contrary to the popular belief that Chinese companies only hire Chinese workers, 93 percent ofcompanies report hiring Kenyan employees; private enterprises are more likely to hire locals thanstate enterprises. In addition, larger firms are more likely to hire Kenyans than smaller firms: 40percent of micro enterprises and all small, medium and large enterprises hire Kenyans (SACE2014). Of the companies surveyed, Kenyans represent 78 percent of full-time and 95 percent ofpart-time employees. The companies had an average of 360 local employees: 252 were part-time(70 percent) and 108 were full-time (30 percent) (SACE 2014). All foreign manufacturing compa-nies in Kenya had 127.8 full time workers and 19.3 part-time workers on average. Manufacturingand construction companies are larger employers, hiring 762 employees on average compared to45 in the services sector; all foreign manufacturing firms hire 158.3 full-time workers and 47.3part-time workers on average (World Bank Enterprise Survey 2013). Chinese companies in theservices sector hire 71 percent full-time employees, but the manfacturing and construction sectorshire only three percent full-time employees. 90 percent of manufacturing employees are local,and 82 percent of service sector employees are local. Chinese companies also hire more Kenyansover time: they had 102 full-time local employees upon establishment, and by the time of the BPIsurvey, they had hired 214 full-time local employees. 63 percent of Chinese companies said theyhad a policy of replacing Chinese employees with locals (SACE 2014). Larger firms were morewilling to replace Chinese workers than smaller firms, and private enterprises were more will-ing to replace Chinese workers than state enterprises. A local technician is much cheaper thana Chinese technician because a work permit costs US $4,597. Local employees also receive basicinsurance from Chinese companies: 44 of 68 companies noted that they offer basic insurance forall employees. Again, larger companies are more likely to provide basic insurance than smalleremployers. 84 percent of manufacturing and construction companies offer insurance for Kenyans,and 72 percent of service sector companies offer insurance for locals. Overall, there are 663 for-eign and 20,790 local workers in managerial positions, 781 foreign and 87,589 local employees inskilled positions, and 633 foreign and 131,618 workers in unskilled positions. The average numberof unskilled workers in foreign manufacturing companies is 49, or 37.3 percent of the workforce;detailed information about the workforce of Chinese companies is unavailable (KNBS 2013).
Chinese companies create the most jobs in communications Figure 26a presents the numberof jobs that Chinese companies have created in each sector. Chinese companies have created2,170 jobs, 5.3 percent of the total 40,646 jobs created through FDI. The greatest number of jobscame from the communications sector at 931 jobs, followed by 500 jobs in the automotive originalequipment manufacturing (OEM), and 342 jobs in the metals industry. Chinese companies havefocused more on Automotive OEM than other countries. It makes up 23 percent of China’s overalljobs created compared to only 11.4 percent of total overall jobs. As figures 27 and 28 highlight,manufacturing takes the largest share of employment for both Chinese FDI and total FDI. Chinesemanufacturing FDI created 1,600 jobs with 266.7 jobs on average, and manufacturing in total cre-ated 21,119 jobs with 357.9 jobs per project. Other major employers were customer contact centres,creating 2,218 jobs and 443.6 jobs per project.
27
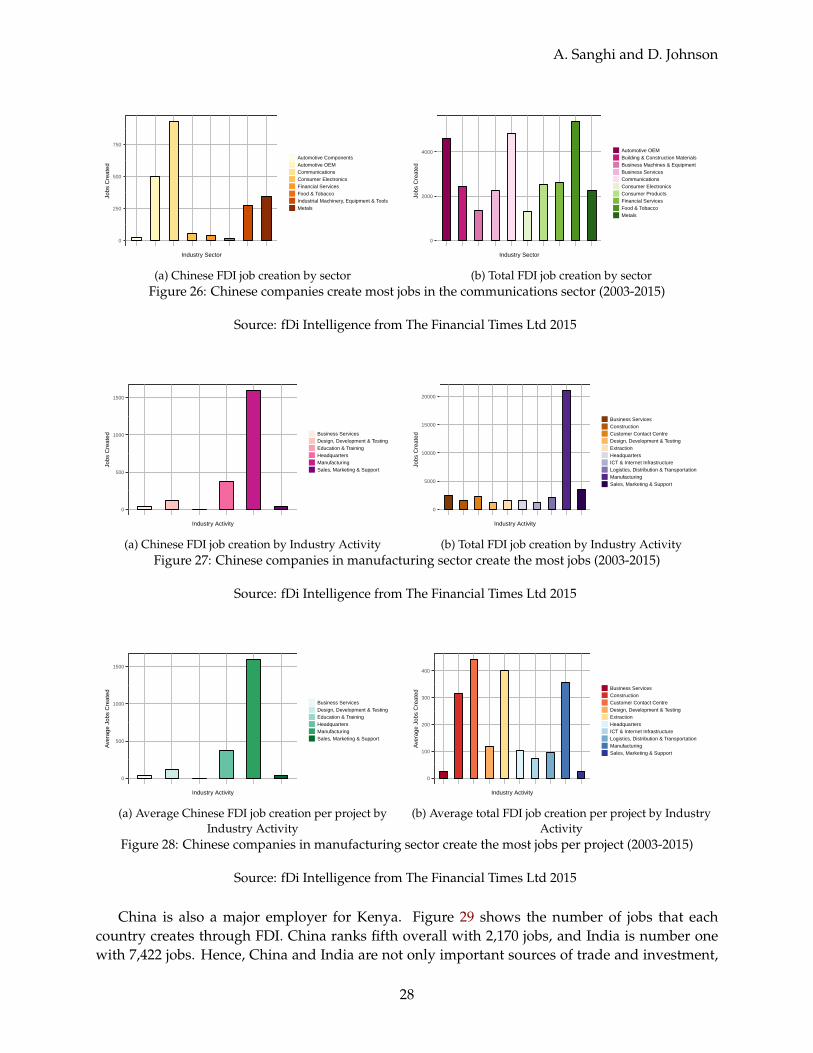
A. Sanghi and D. Johnson
0
250
500
750
Industry Sector
Jobs
Cre
ated
Automotive ComponentsAutomotive OEMCommunicationsConsumer ElectronicsFinancial ServicesFood & TobaccoIndustrial Machinery, Equipment & ToolsMetals
(a) Chinese FDI job creation by sector
0
2000
4000
Industry Sector
Jobs
Cre
ated
Automotive OEMBuilding & Construction MaterialsBusiness Machines & EquipmentBusiness ServicesCommunicationsConsumer ElectronicsConsumer ProductsFinancial ServicesFood & TobaccoMetals
(b) Total FDI job creation by sectorFigure 26: Chinese companies create most jobs in the communications sector (2003-2015)
Source: fDi Intelligence from The Financial Times Ltd 2015
0
500
1000
1500
Industry Activity
Jobs
Cre
ated Business Services
Design, Development & TestingEducation & TrainingHeadquartersManufacturingSales, Marketing & Support
(a) Chinese FDI job creation by Industry Activity
0
5000
10000
15000
20000
Industry Activity
Jobs
Cre
ated
Business ServicesConstructionCustomer Contact CentreDesign, Development & TestingExtractionHeadquartersICT & Internet InfrastructureLogistics, Distribution & TransportationManufacturingSales, Marketing & Support
(b) Total FDI job creation by Industry ActivityFigure 27: Chinese companies in manufacturing sector create the most jobs (2003-2015)
Source: fDi Intelligence from The Financial Times Ltd 2015
0
500
1000
1500
Industry Activity
Ave
rage
Job
s C
reat
ed
Business ServicesDesign, Development & TestingEducation & TrainingHeadquartersManufacturingSales, Marketing & Support
(a) Average Chinese FDI job creation per project byIndustry Activity
0
100
200
300
400
Industry Activity
Ave
rage
Job
s C
reat
ed
Business ServicesConstructionCustomer Contact CentreDesign, Development & TestingExtractionHeadquartersICT & Internet InfrastructureLogistics, Distribution & TransportationManufacturingSales, Marketing & Support
(b) Average total FDI job creation per project by IndustryActivity
Figure 28: Chinese companies in manufacturing sector create the most jobs per project (2003-2015)
Source: fDi Intelligence from The Financial Times Ltd 2015
China is also a major employer for Kenya. Figure 29 shows the number of jobs that eachcountry creates through FDI. China ranks fifth overall with 2,170 jobs, and India is number onewith 7,422 jobs. Hence, China and India are not only important sources of trade and investment,
28

3 FOREIGN DIRECT INVESTMENT IN KENYA
but new jobs as well. Chinese companies have a higher number of jobs per project because theyhave fewer projects than other countries. Between 2003 and 2015, FDI from China created 166.92jobs on average; total FDI generated 100 jobs per project.10 FDI has a strong ability to create jobs,and table 3 shows some of the progress.
0
2000
4000
6000
China Egypt India Japan Nigeria South AfricaSouth Korea Spain UK United States
Country
Jobs
Cre
ated
Figure 29: China is fifth largest creator of jobs. India creates the most jobs (2003-2015)
Source: fDi Intelligence from The Financial Times Ltd 2015
Table 3: FDI Projects and related employment (2007-2011)
Year Number of Projects Employment Employees perproject
2007 55 2,847 51.82008 73 4,341 59.52009 121 37,045 306.22010 129 15,753 122.12011 145 13,289 91.6
Source: Adapted from UNCTAD/DIAE/PCB/2012/6
Chinese firms already offer basic skills training 60 percent of Chinese companies offer formaltraining programs on skills, safety, and hygiene for local staff; 64 percent of all foreign firms inKenya offer formal training (SACE 2014; World Bank Enterprise Survey 2013). Companies in themanufacturing sector and state enterprises are more likely to offer formal training than privatecompanies and the service sector. A few Chinese projects aim specifically to provide skills train-ing for Kenyans, but businesses report that high turnover harms efforts for skills training andpromoting Kenyans to higher level management because the high staff turnover raises the cost oftraining employees (SACE 2014). The BPI suggests that companies engage local employees in for-mal contracts, regardless of skill level, to build more trust and reduce the incentive to switch jobsand vandalize property. The language barrier also presents a challenge in training, but the grow-ing interest in Chinese langauge study among Kenyans should slowly improve communication
10Kenya gained 40,646 jobs and 406 projects from FDI in total between 2003 and 2015.
29
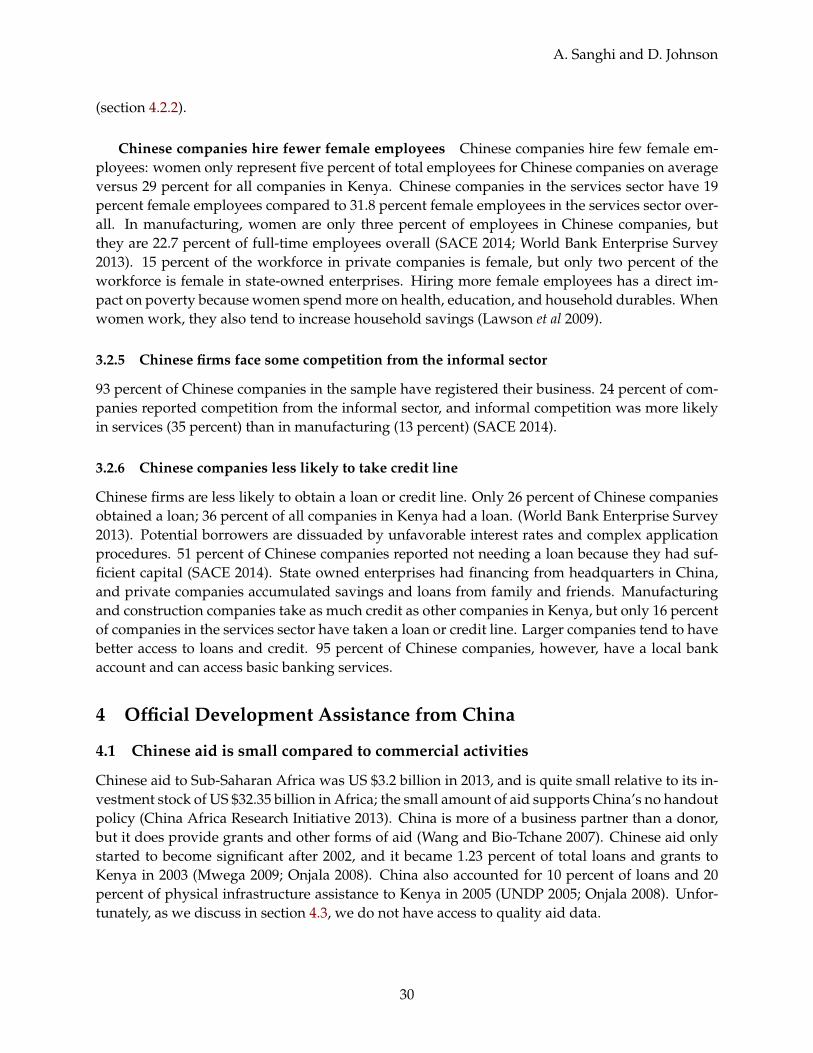
A. Sanghi and D. Johnson
(section 4.2.2).
Chinese companies hire fewer female employees Chinese companies hire few female em-ployees: women only represent five percent of total employees for Chinese companies on averageversus 29 percent for all companies in Kenya. Chinese companies in the services sector have 19percent female employees compared to 31.8 percent female employees in the services sector over-all. In manufacturing, women are only three percent of employees in Chinese companies, butthey are 22.7 percent of full-time employees overall (SACE 2014; World Bank Enterprise Survey2013). 15 percent of the workforce in private companies is female, but only two percent of theworkforce is female in state-owned enterprises. Hiring more female employees has a direct im-pact on poverty because women spend more on health, education, and household durables. Whenwomen work, they also tend to increase household savings (Lawson et al 2009).
3.2.5 Chinese firms face some competition from the informal sector
93 percent of Chinese companies in the sample have registered their business. 24 percent of com-panies reported competition from the informal sector, and informal competition was more likelyin services (35 percent) than in manufacturing (13 percent) (SACE 2014).
3.2.6 Chinese companies less likely to take credit line
Chinese firms are less likely to obtain a loan or credit line. Only 26 percent of Chinese companiesobtained a loan; 36 percent of all companies in Kenya had a loan. (World Bank Enterprise Survey2013). Potential borrowers are dissuaded by unfavorable interest rates and complex applicationprocedures. 51 percent of Chinese companies reported not needing a loan because they had suf-ficient capital (SACE 2014). State owned enterprises had financing from headquarters in China,and private companies accumulated savings and loans from family and friends. Manufacturingand construction companies take as much credit as other companies in Kenya, but only 16 percentof companies in the services sector have taken a loan or credit line. Larger companies tend to havebetter access to loans and credit. 95 percent of Chinese companies, however, have a local bankaccount and can access basic banking services.
4 Official Development Assistance from China
4.1 Chinese aid is small compared to commercial activities
Chinese aid to Sub-Saharan Africa was US $3.2 billion in 2013, and is quite small relative to its in-vestment stock of US $32.35 billion in Africa; the small amount of aid supports China’s no handoutpolicy (China Africa Research Initiative 2013). China is more of a business partner than a donor,but it does provide grants and other forms of aid (Wang and Bio-Tchane 2007). Chinese aid onlystarted to become significant after 2002, and it became 1.23 percent of total loans and grants toKenya in 2003 (Mwega 2009; Onjala 2008). China also accounted for 10 percent of loans and 20percent of physical infrastructure assistance to Kenya in 2005 (UNDP 2005; Onjala 2008). Unfor-tunately, as we discuss in section 4.3, we do not have access to quality aid data.
30

4 OFFICIAL DEVELOPMENT ASSISTANCE FROM CHINA
4.1.1 Kenya may rely more on Chinese aid because of volatile aid flows
Chinese aid may continue to play a bigger role over time because Kenya’s foreign aid flows arevolatile. The coefficient of variation of Kenya’s aid is 74.19 between 1960 to 2013; the coefficientof variation for Sub-Saharan Africa is 64.71 over the same period.11 Chinese official developmentassistance is a small fraction of Kenya’s total aid flows. Figure 30 shows Kenya’s top sources ofofficial development assistance in 2013.
0
200
400
600
800
Country
Gro
ss O
DA
(U
SD
Mill
ions
)
AfDF (African Dev.Fund)EU InstitutionsFranceGermanyGlobal FundIDAIMF (Concessional Trust Funds)JapanUnited KingdomUnited States
Figure 30: US is a top donor for Kenya. Chinese finance does not meet OECD/DAC aid criteria (2013)
Source: OECD DAC aid database 2015
China is not a member of OECD donors China is absent from the top ten donors because it is nota member of the OECD, so little of Chinese financing qualifies as official development assistanceunder the standard OECD definition (Brautigam 2011). Figure 31 gives a sectoral distribution ofaid to Kenya. Overall, aid to the health and population sector is the highest at US $574.3 million(31 percent) followed by economic infrastructure and services at US $407.5 million (22 percent).
11The coefficient of variation is the ratio of the standard deviation to the mean:
Cv =σ
|µ|
where µ is the average and σ is the standard deviation.
31
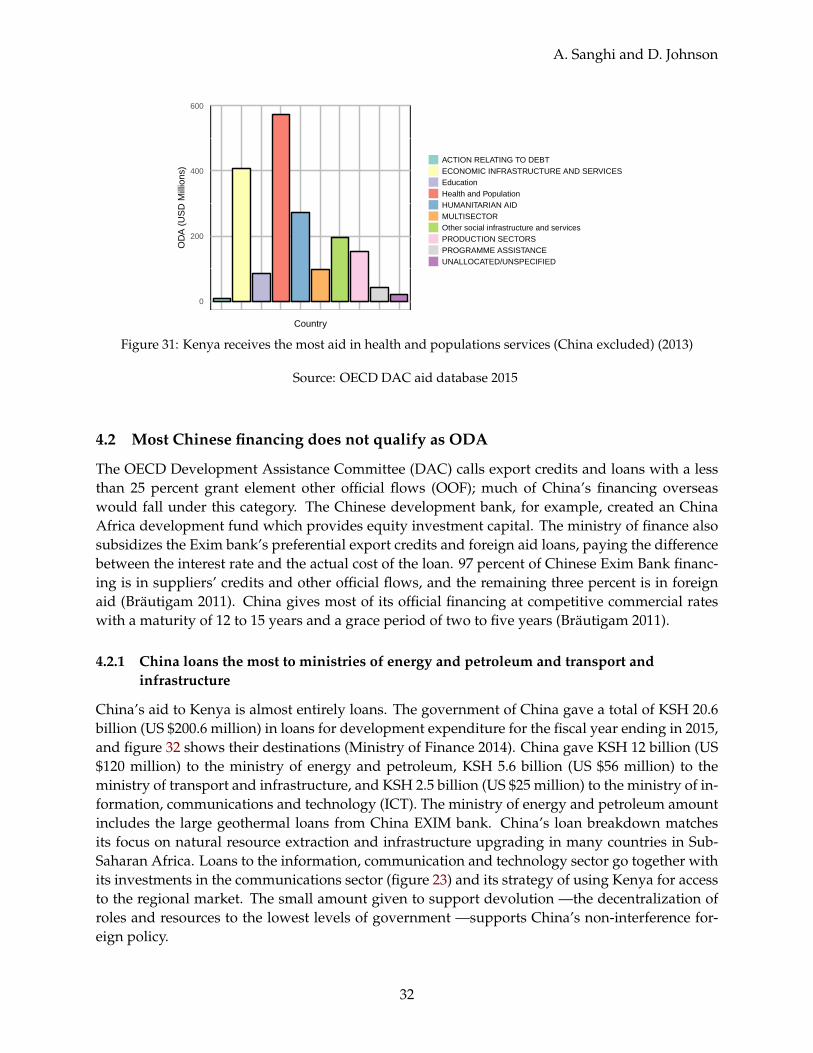
A. Sanghi and D. Johnson
0
200
400
600
Country
OD
A (
US
D M
illio
ns)
ACTION RELATING TO DEBTECONOMIC INFRASTRUCTURE AND SERVICESEducationHealth and PopulationHUMANITARIAN AIDMULTISECTOROther social infrastructure and servicesPRODUCTION SECTORSPROGRAMME ASSISTANCEUNALLOCATED/UNSPECIFIED
Figure 31: Kenya receives the most aid in health and populations services (China excluded) (2013)
Source: OECD DAC aid database 2015
4.2 Most Chinese financing does not qualify as ODA
The OECD Development Assistance Committee (DAC) calls export credits and loans with a lessthan 25 percent grant element other official flows (OOF); much of China’s financing overseaswould fall under this category. The Chinese development bank, for example, created an ChinaAfrica development fund which provides equity investment capital. The ministry of finance alsosubsidizes the Exim bank’s preferential export credits and foreign aid loans, paying the differencebetween the interest rate and the actual cost of the loan. 97 percent of Chinese Exim Bank financ-ing is in suppliers’ credits and other official flows, and the remaining three percent is in foreignaid (Brautigam 2011). China gives most of its official financing at competitive commercial rateswith a maturity of 12 to 15 years and a grace period of two to five years (Brautigam 2011).
4.2.1 China loans the most to ministries of energy and petroleum and transport andinfrastructure
China’s aid to Kenya is almost entirely loans. The government of China gave a total of KSH 20.6billion (US $200.6 million) in loans for development expenditure for the fiscal year ending in 2015,and figure 32 shows their destinations (Ministry of Finance 2014). China gave KSH 12 billion (US$120 million) to the ministry of energy and petroleum, KSH 5.6 billion (US $56 million) to theministry of transport and infrastructure, and KSH 2.5 billion (US $25 million) to the ministry of in-formation, communications and technology (ICT). The ministry of energy and petroleum amountincludes the large geothermal loans from China EXIM bank. China’s loan breakdown matchesits focus on natural resource extraction and infrastructure upgrading in many countries in Sub-Saharan Africa. Loans to the information, communication and technology sector go together withits investments in the communications sector (figure 23) and its strategy of using Kenya for accessto the regional market. The small amount given to support devolution —the decentralization ofroles and resources to the lowest levels of government —supports China’s non-interference for-eign policy.
32

4 OFFICIAL DEVELOPMENT ASSISTANCE FROM CHINA
0.0
2.5
5.0
7.5
10.0
12.5
Devolution Energy and Petroleum ICT Transport and Infrastructure
Ministry
Loan
am
ount
(K
SH
Bill
ions
)
Figure 32: Ministry of Energy and Petroleum receives most loans from China (2014)
Source: Estimates of Development Expenditure Government of Kenya (2014)
4.2.2 Chinese stands out in education aid
China is quite active in the education sector in Kenya and provides a number of training programs,university scholarships and language programs. Recent data is hard to gather, but China spentroughly US $120,000 on volunteers and US $1.2 million on trainings in 2010 (UNESCO 2015).Education aid is a small percentage of China’s bilateral loans and aid, but education is also a smallpart of the overall aid budget for traditional donors (figure 31). In 2011, China built St. FrancisSivo Primary School and four other primary schools in 2012 at an estimated cost of US $400,000,supported in part by China Youth Development Foundation (UNESCO 2015).
China focuses on scholarships, vocational and professional programs, less on the formal edu-cation sector China’s Nanjing Agricultural University (NAU) and Egerton University began apartnership in 1994 that created fellowships for Egerton students to study and work in Nanjing.The program has trained 200 agricultural technicians to date from ten countries in East Africa(UNESCO 2015). From 2004 to 2008, China trained 697 Kenyans in short courses, focusing onagricultural technology. China offers more than 50 short courses on topics such as hydropowertechnology, malaria control, and hybrid rice technology (King 2010). Since 1984, China providedten annual scholarhips to Kenyans and 40 annual scholarships in 2007. By 2013, China had morethan 300 Kenyans studying in China. China offered 34 scholarships in 2015 (Ministry of EducationKenya 2015).
Growing interest in Chinese language study in Kenya China also offers language scholarships:in 2009, the Confucious Institute at the University of Nairobi offered 49 language scholarshipsand the China information and culture communication center sent 40 self-sponsored students toChina for language study (King 2010). China is becoming a more popular educational destinationfor Kenyans. Even without financial assistance, Kenyans find the competitve cost of Chineseuniversities attractive. As China’s influence in Kenya grows, the popularity of languages studieswill likely rise. The Kenya Institute of Curriculum Design and Kenyatta University, for instance,
33
A. Sanghi and D. Johnson
are developing plans to offer Chinese language classes in primary and secondary schools (KICD2014).
4.3 Lack of quality Chinese aid data
Since OECD and other official sources do not track China’s aid, researchers at AidData have cre-ated their own database of Chinese aid to Africa.12 The database uses media reports, governmentinvestment websites, and other official sources to calculate the total amount of Chinese develop-ment finance to various African countries by project. The data collection occurs in two stages.First, researchers look through Factiva, a Dow-Jones owned media search engine, to identify me-dia reports about aid projects in various countries. The team also uses donor and recipient countrygovernment websites to search for projects that they may have missed in the initial Factiva search(Strange et al 2013). After selecting the first group of projects, AidData re-searches using Googleand other country search engines such as Baidu to retrieve the date, location, project cost, financialdetails, and status of the project. AidData then uses other staff members to review project detailsand information sources to correct mistakes.
4.3.1 Drawbacks of existing Chinese aid data: Media based data collection is problematic
Compiling data from various sources to create something usable for analysis is commendable andbrings more transparency to the debate on Chinese aid. Since the database is open source, anyonecan suggest improvements and make corrections, allowing the database to improve with time. Re-lying on media reports, however, is problematic. Newspapers often report inaccurate informationon the size and type of financial flows, or cover projects that are later cancelled. 6 of 20 Chinesedeals cited in an AidData paper, for example, never actually happened, and China only financed38 percent of the Merowe hydropower project in South Sudan. The authors, as a result, find thatthe total of the 20 Chinese deals was US $38 billion when the actual total is only US $9 billion(Brautigam 2013).
Data entry from media reports is also error-prone and classifying aid flows is hardly straight-forward. Selection bias is also a problem with media-based data collection: only projects that jour-nalists write about make it to the aid figures. Although AidData includes English and Chineselanguage media reports, researchers may also overlook other resources such as local newspapersin other languages or those only published in print. Given the issues with media data collection,we decide not to report aid numbers from these databases, and we will wait for a time when theopen source community and researchers have had more time to correct errors.
5 Review and future directions
FDI is usually beneficial for small countries when they have the capacity to absorb the investment.Chinese investment can become more transparent if Kenya can reduce corruption and promotegood governance. Reforms in the rule of law and the regulatory environment will also help com-panies run more efficiently. Just as Jamaica promoted itself as an entry point to markets in theCaribbean, so too can Kenya continue to encourage Chinese companies to use Kenya as an entry
12See china.aiddata.org
34
5 REVIEW AND FUTURE DIRECTIONS
point to markets in Eastern and Southern Africa, particularly the East African community (EAC)and the Common Market for Eastern and Southern Africa (COMESA) (UNCTAD 2010). More so-phisticated Chinese companies in Kenya may enhance spillover effects and improve technologytransfer.
5.1 Consider the long term growth of local industry
While there are certainly benefits to more competition, policy makers must also consider the long-term growth of labor-intensive local industries. One of the major failings of the SGR project isthe near-exclusion of local suppliers. Local manufacturers were only able to supply cement and aneglibible amount of steel to SGR; contracters imported the rest of the materials from China. Localmanufacturers missed a valuable opportunity for capacity building, knowledge sharing and long-term job creation. A positive outcome of SGR however, was that Chinese competition forced somelocal cement manufacturers to upgrade their standards. Policy makers can design policies to helpform linkages between small Kenyan firms, technical institutes, and Chinese contracters, treatingthe SGR project as a learning experience. With greater linkages, future infrastructure projects candraw from a larger pool of skilled labor and cut its costs. Inefficient Kenyan firms will close; firmsthat upgrade technology can enter the market, produce efficiently, and improve consumer welfare(UNCTAD 2010).
5.1.1 SGR spotlight: Non-existent capacity building
On 19 September 2015, the president chaired a Cabinet Steering committee meeting with theChina Road and Bridge Corporation (CRBC) on the progress of the SGR construction fromMombasa to Nairobi.
Nearly half of civil work construction is complete As of 31 August 2015, 49 percent of theconstruction of civil work such as bridges, culverts and sub-grade is complete.
Employment
• 25000 skilled and unskilled local laborers
• 17000 directly employed
• 7000 indirectly employed
• 2000 Chinese expatriates
Local content: dropping the ball on Phase 1, Mombasa to Nairobi The panel said thatpurchases of local content was 30 billion KSH (US $304.6 million) by 31 August 2015. Theinvolvement of local suppliers, however, was low. Prior to private sector engagement, CRBCimported 6000 tons of cement; afterwards, cement companies managed to supply the remain-der. Construction used negligible local steel and imported all other materials (Private sector,SGR consortium 2015). Since they do not have VAT exemption, local traders and suppliers
35
A. Sanghi and D. Johnson
cannot compete with Chinese contractors; they also pay many other taxes and fees that Chi-nese firm bypass. Local traders and suppliers are still waiting for VAT reimbursements todate; without VAT reimburesments, local private sector cannot supply goods on time and areessentially shut out.
Industrial parks along SGR The ministry of industrialization wants to place industrialzones along the SGR route and has already targeted land in Mariakani, Emali, Voi, Naivasha,and Athi River. At the moment, the ministry is seeking funding and commercial contracts areawaiting approval.
Construction of Phase 2 from Nairobi to Malaba: Local content still an afterthought Thepresident requested for skills building and local content manufacturing on the next portion ofthe railway between Nairobi and Malaba. Attendees discussed including a specific require-ment for local provision, but the extension of Phase 1 to Naivasha has already started. CRBCclaims to have a capacity building program in place and mentioned a plan to rebuild the rail-way technical institute near Nairobi’s Wilson airport. No concrete plans for the program orthe institute, though, are in place. Without a formal plan, capacity building will be forgot-ten. During phase one from Mombasa to Nairobi, CRBC also said they would consider localcontent and skills, but they did not have any obligation to buy from local private sector orbuild local capacity: they ended up importing the bulk of the materials from China. A repeatof Phase 1 will deny the next generation of local industry a valuable opportunity to learn,upgrade technologies, and gain efficiency.
New developments: Engagement with private sector The private sector has establishedthe Kenya Industry Sector Board Working Group and Linkage of Industry with Academia(LIWA) to promote dialogue and action across private sector, academia, and government.LIWA is working to help vocational institutes tailor curriculums that match the skills thatindustries demand. Cross-cutting groups can work around barriers to improving skills andstandards; they also ensure that stakeholders voice concerns before the start of large infras-tructure projects. An agreement among all stakeholders will result in a conscious effort oncreating jobs and advancing training and research (Private Sector, SGR consortium 2015).
5.2 Diversify FDI sources to avoid overreliance on China
China is a rapidly rising source of FDI, but Kenya must continue to attract FDI from other sourcesto avoid a dependency on Chinese FDI. Kenya performs poorly in attracting FDI relative to its po-tential, and it must improve its efforts at marketing investment opportunities to Chinese as wellas other Asian firms to increase FDI inflows. Kenya can attract FDI sources for much needed in-frastructure investment that will lead to more FDI in other sectors, lessening the dependence onChina. In other words, improving infrastructure, reforming taxes, and cutting labor costs shouldhelp Kenya attract more FDI in general; diverse FDI sources can serve as insurance against finan-cial shocks and China’s future slowed growth (UNCTAD 2010).
36
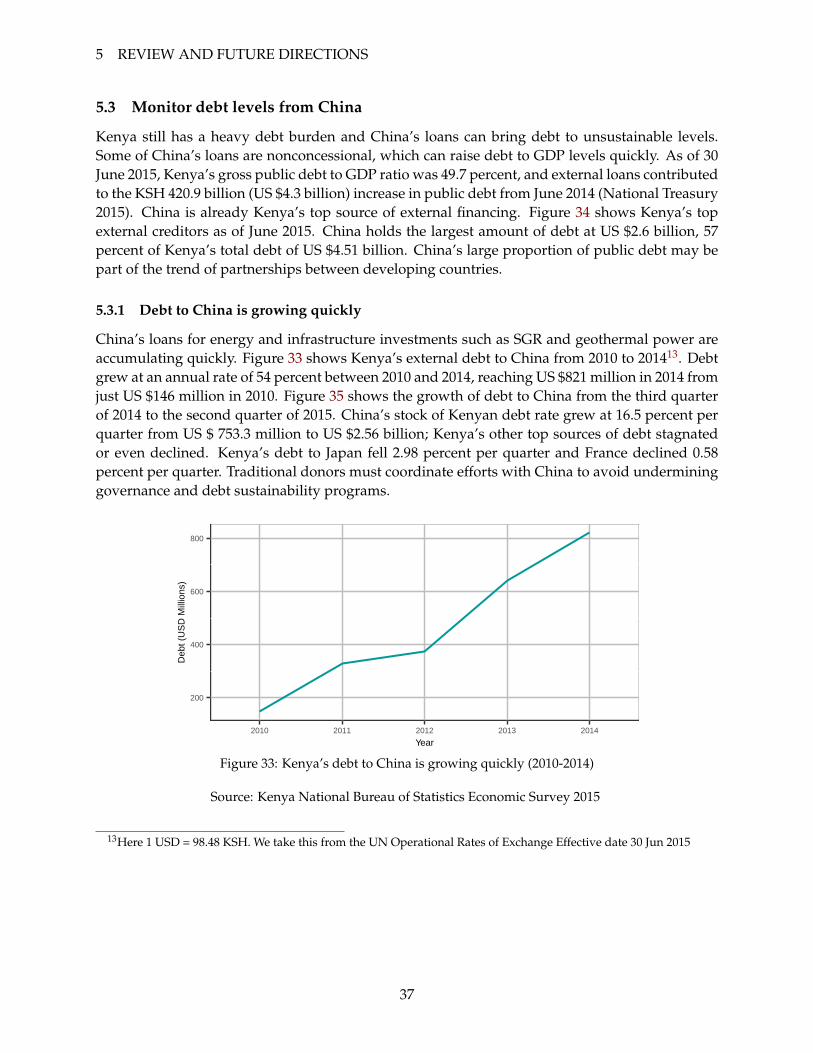
5 REVIEW AND FUTURE DIRECTIONS
5.3 Monitor debt levels from China
Kenya still has a heavy debt burden and China’s loans can bring debt to unsustainable levels.Some of China’s loans are nonconcessional, which can raise debt to GDP levels quickly. As of 30June 2015, Kenya’s gross public debt to GDP ratio was 49.7 percent, and external loans contributedto the KSH 420.9 billion (US $4.3 billion) increase in public debt from June 2014 (National Treasury2015). China is already Kenya’s top source of external financing. Figure 34 shows Kenya’s topexternal creditors as of June 2015. China holds the largest amount of debt at US $2.6 billion, 57percent of Kenya’s total debt of US $4.51 billion. China’s large proportion of public debt may bepart of the trend of partnerships between developing countries.
5.3.1 Debt to China is growing quickly
China’s loans for energy and infrastructure investments such as SGR and geothermal power areaccumulating quickly. Figure 33 shows Kenya’s external debt to China from 2010 to 201413. Debtgrew at an annual rate of 54 percent between 2010 and 2014, reaching US $821 million in 2014 fromjust US $146 million in 2010. Figure 35 shows the growth of debt to China from the third quarterof 2014 to the second quarter of 2015. China’s stock of Kenyan debt rate grew at 16.5 percent perquarter from US $ 753.3 million to US $2.56 billion; Kenya’s other top sources of debt stagnatedor even declined. Kenya’s debt to Japan fell 2.98 percent per quarter and France declined 0.58percent per quarter. Traditional donors must coordinate efforts with China to avoid undermininggovernance and debt sustainability programs.
200
400
600
800
2010 2011 2012 2013 2014
Year
Deb
t (U
SD
Mill
ions
)
Figure 33: Kenya’s debt to China is growing quickly (2010-2014)
Source: Kenya National Bureau of Statistics Economic Survey 2015
13Here 1 USD = 98.48 KSH. We take this from the UN Operational Rates of Exchange Effective date 30 Jun 2015
37
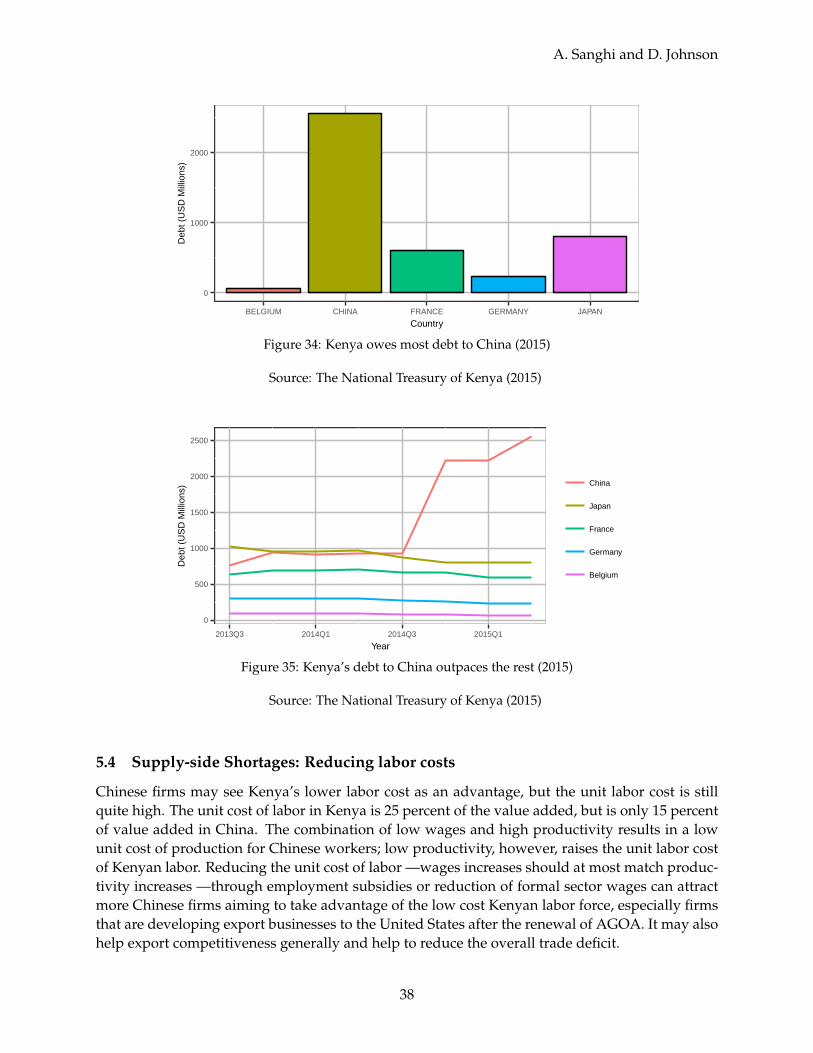
A. Sanghi and D. Johnson
0
1000
2000
BELGIUM CHINA FRANCE GERMANY JAPAN
Country
Deb
t (U
SD
Mill
ions
)
Figure 34: Kenya owes most debt to China (2015)
Source: The National Treasury of Kenya (2015)
0
500
1000
1500
2000
2500
2013Q3 2014Q1 2014Q3 2015Q1
Year
Deb
t (U
SD
Mill
ions
) China
Japan
France
Germany
Belgium
Figure 35: Kenya’s debt to China outpaces the rest (2015)
Source: The National Treasury of Kenya (2015)
5.4 Supply-side Shortages: Reducing labor costs
Chinese firms may see Kenya’s lower labor cost as an advantage, but the unit labor cost is stillquite high. The unit cost of labor in Kenya is 25 percent of the value added, but is only 15 percentof value added in China. The combination of low wages and high productivity results in a lowunit cost of production for Chinese workers; low productivity, however, raises the unit labor costof Kenyan labor. Reducing the unit cost of labor —wages increases should at most match produc-tivity increases —through employment subsidies or reduction of formal sector wages can attractmore Chinese firms aiming to take advantage of the low cost Kenyan labor force, especially firmsthat are developing export businesses to the United States after the renewal of AGOA. It may alsohelp export competitiveness generally and help to reduce the overall trade deficit.
38
5 REVIEW AND FUTURE DIRECTIONS
5.4.1 Encourage technology transfer and capacity building with infrastructure projects
Chinese firms involved in labor-intensive activities identified the lack of a skilled workforce as aconstraint to doing business in Kenya (SACE 2014). The language barrier is a constraint for skillstransfer, but Kenya may continue to promote Chinese language training. Many Kenyans are al-ready learning Chinese and the government of China offered 34 full scholarships to study in Chinain 2015; greater numbers of Kenyans learning Chinese will lower language barriers on both sides.Policy makers can also help initiatives such as LIWA to create links between Chinese firms andKenyan universities and training institutes to address key skills gaps. At the China-Africa summitin Johannesburg on 4 December 2015, China pledged to support capacity building in Africa andbuild five “Jiao Tong”, or transportation universities that train scientists, engineers, and techni-cians; leaders should negotiate for a “Jiao Tong” in Kenya, a step that will ensure more technologytransfer and skills development. The literature suggests that FDI creates an opportunity for do-mestic firms to enter and supply inputs to foreign firms, increasing labor demand. Since requiringlocal content is prohibited under the WTO Trade Related Investment Measures (TRIM) agreement,Kenya can seek alternatives to promote local content. For example, Estonia offered funds to largecompanies to develop linkages with local suppliers, and Jamaica took a “cluster” approach thatattracted FDI to sectors that could exploit synergies (UNCTAD 2010). Similarly, Kenya can buildcapacity in small and medium entreprises (SME) to supply Chinese businesses by connecting localsuppliers to large Chinese companies.
But Kenya should not push too hard for domestic content Though many countries have lo-cal content laws, Kenya should be careful to avoid overpushing for domestic content. Grossman(1981) finds that requiring local content is equivalent to taxing the foreign firm, hurting efforts toincrease and diversify FDI, and in some cases even lowering domestic value added. In fact, firmswill fail to meet the local content requirement if the cost of the foreign intermediate good is lessthan the cost of buying enough of the domestic intermediate good to meet the content require-ment. Chinese companies import 59 percent of inputs from China because they are cheaper thanlocal goods; restricting foreign inputs may be unprofitable for Chinese firms. When promotinglocal content, Kenya can also look to improve the competitiveness of local industry so firms nat-urally move towards local products. It can also offer support to companies that develop linkageswith local firms.
5.4.2 Bring more transparency to loans and infrastructure projects
China’s loans come with attractive interest rates and without strings attached for good gover-nance. Though Kenya faces few conditions on its aid, other countries in Sub-Saharan Africa lever-age China’s financing to gain bargaining power with traditional donors.14 The loans, however,could harm Kenya in the long-run because of their lack of transparency and failure to tie aidto key governance reforms. Traditional donors can work to help China follow the environmen-tal protection standards, and civil society groups can demand increased transparency in aid andfinance, pushing Chinese and non-Chinese firms in the natural resources sector to involve them-selves in the Extractive Industries Transparency Initiative (EITI) and report payments made to thegovernment.
14Angola turned down financing from the IMF that required measures to improve transparency in the oil sector, andaccepted US $2 billion in loans from the Chinese EXIM bank (Davies 2007)
39
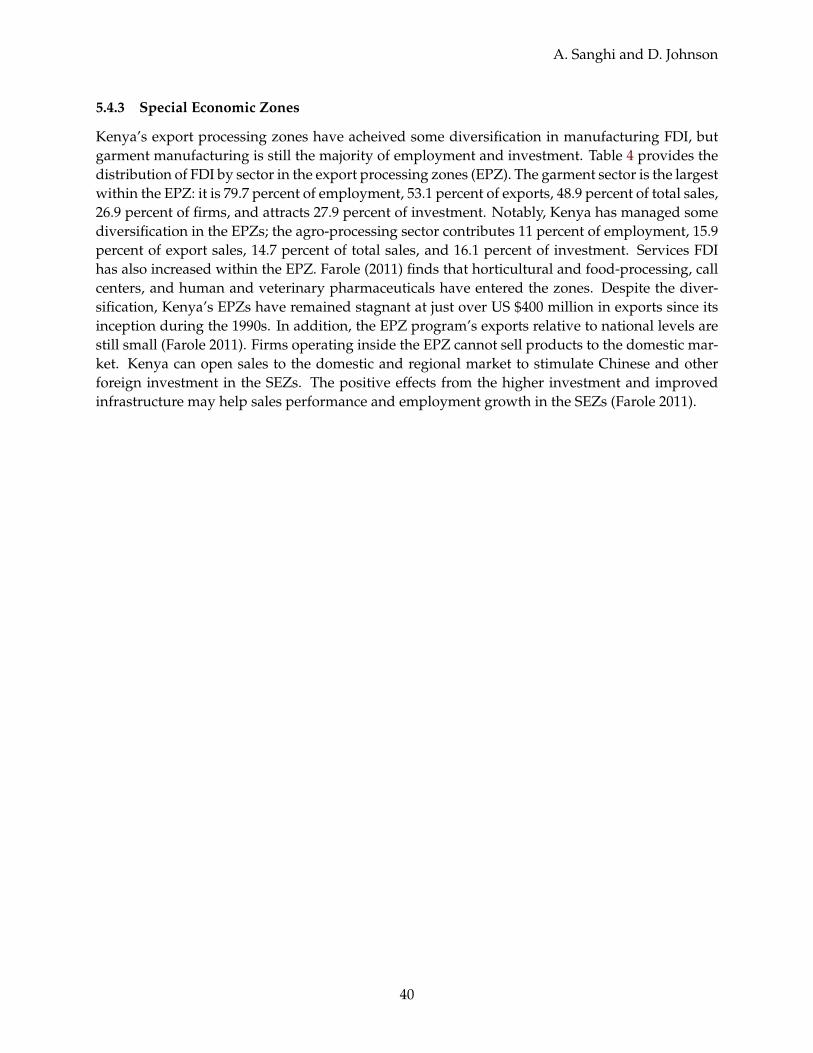
A. Sanghi and D. Johnson
5.4.3 Special Economic Zones
Kenya’s export processing zones have acheived some diversification in manufacturing FDI, butgarment manufacturing is still the majority of employment and investment. Table 4 provides thedistribution of FDI by sector in the export processing zones (EPZ). The garment sector is the largestwithin the EPZ: it is 79.7 percent of employment, 53.1 percent of exports, 48.9 percent of total sales,26.9 percent of firms, and attracts 27.9 percent of investment. Notably, Kenya has managed somediversification in the EPZs; the agro-processing sector contributes 11 percent of employment, 15.9percent of export sales, 14.7 percent of total sales, and 16.1 percent of investment. Services FDIhas also increased within the EPZ. Farole (2011) finds that horticultural and food-processing, callcenters, and human and veterinary pharmaceuticals have entered the zones. Despite the diver-sification, Kenya’s EPZs have remained stagnant at just over US $400 million in exports since itsinception during the 1990s. In addition, the EPZ program’s exports relative to national levels arestill small (Farole 2011). Firms operating inside the EPZ cannot sell products to the domestic mar-ket. Kenya can open sales to the domestic and regional market to stimulate Chinese and otherforeign investment in the SEZs. The positive effects from the higher investment and improvedinfrastructure may help sales performance and employment growth in the SEZs (Farole 2011).
40

5 REVIEW AND FUTURE DIRECTIONS
Table 4: Export Processing Zones sector contribution in 2012 (%)
Sector Number ofFirms
Employment Exports Total Sales Investment
Agro pro-cessing
22 11 15.9 14.7 16.1
Beverages 4 0.5 0.9 0.8 0.6Chemicals 1 0.2 0.1 0.1 2.9Dartboard 1 0.7 1.5 1.4 1.8Electricals 3.7 0.1 6.9 6.3 1.2Food Pro-cessing
3.7 0.9 1.0 1.5 5.6
Garments 26.9 79.7 53.1 48.9 27.9Garmentsupportedservices
6.1 0.1 0 0.1 0.2
Minerals,Metals, andGemstones
4.9 1.2 8.2 7.5 20.3
Medicineand medicalservices
2.4 0.8 1 1.4 2.7
Plastics 6.1 1.3 1 1.3 3Printing 1.2 0.7 1.5 7.5 6.2Relief sup-plies
2.4 0.3 2.5 2.5 1.4
Services 12.2 2.5 6.4 6.0 10Other 2.4 0.02 0.01 0.01 0.01
Total 100 100 100 100 100Source: Adapted from Export Processing Zones Annual Report 2012
5.4.4 Conclusion
Greater competition from imports lowers consumer prices and gives some producers access tocheaper inputs and capital goods. Chinese imports do not necessarily displace domestic produc-tion, as they may replace imports from other countries, lowering the cost of imports. The importscould also boost labor productivity within certain sectors and increase employment in services.But Kenya must still work to improve its manufacturing sector to compete with China’s low costmanufacturing; Kenyan producers have to upgrade their skills or specialize in areas where theyhave a comparative advantage. To improve exports, Kenya could negotiate for duty free accessfor cut flowers as part of the 404 primary products that China already allows to enter duty free.Exports to China, especially of services, may increase once China transitions to a consumption-driven economy closer to 2030. When focusing on trade, policy makers should shift attention toimproving export competitiveness and the overall balance of trade. Kenya’s exports need to im-prove overall, not just to China.
41
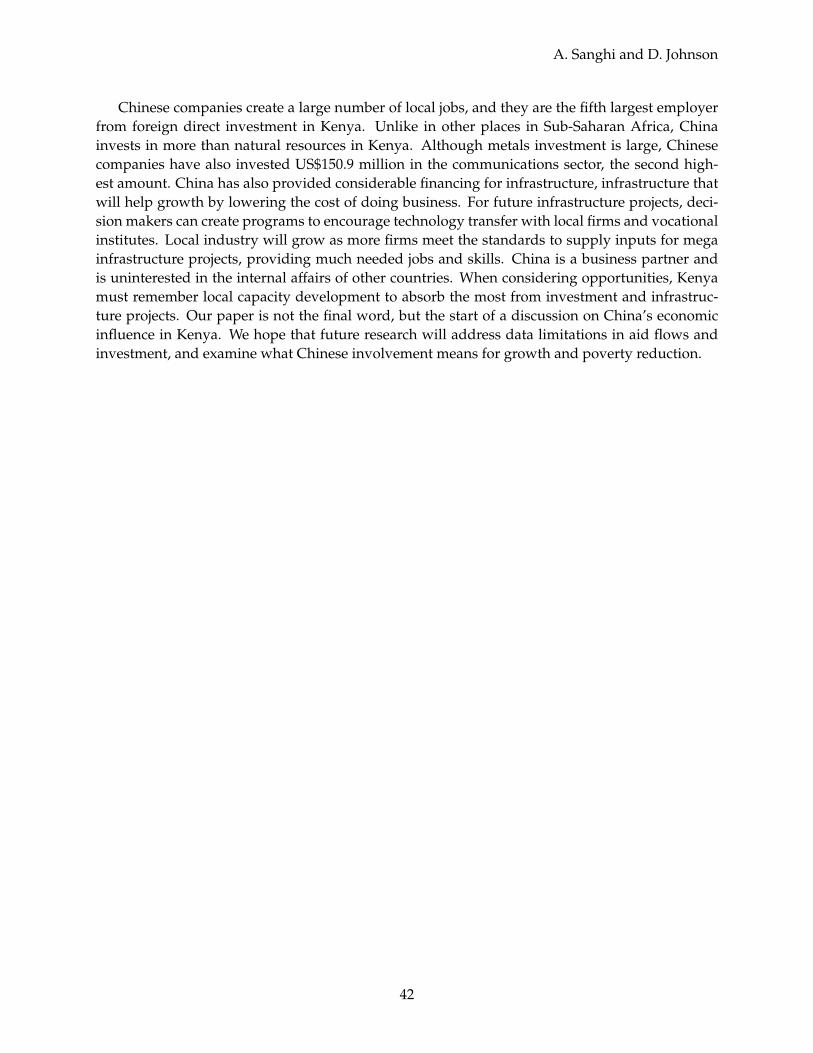
A. Sanghi and D. Johnson
Chinese companies create a large number of local jobs, and they are the fifth largest employerfrom foreign direct investment in Kenya. Unlike in other places in Sub-Saharan Africa, Chinainvests in more than natural resources in Kenya. Although metals investment is large, Chinesecompanies have also invested US$150.9 million in the communications sector, the second high-est amount. China has also provided considerable financing for infrastructure, infrastructure thatwill help growth by lowering the cost of doing business. For future infrastructure projects, deci-sion makers can create programs to encourage technology transfer with local firms and vocationalinstitutes. Local industry will grow as more firms meet the standards to supply inputs for megainfrastructure projects, providing much needed jobs and skills. China is a business partner andis uninterested in the internal affairs of other countries. When considering opportunities, Kenyamust remember local capacity development to absorb the most from investment and infrastruc-ture projects. Our paper is not the final word, but the start of a discussion on China’s economicinfluence in Kenya. We hope that future research will address data limitations in aid flows andinvestment, and examine what Chinese involvement means for growth and poverty reduction.
42
REFERENCES
References
Ajaikaye, O., “China and Africa-Opportunities and Challenges”, Presentation at the African UnionTask Force on Strategic Partnership Between Africa and Emerging Countries of the South, Addis Abba,Ethiopia, 11-13 September 2006
Arkolakis, C., “Notes on Graduate International Trade” Notes prepared for Graduate International Tradeat Yale, May 2012
Anderson, J. E., & Van Wincoop, E. (2003). “Gravity with gravitas: a solution to the border puzzle”,American Economic Review 93
Brautigam, D. (2011). “Aid With Chinese Characteristics: Chinese Foreign Aid and DevelopmentFinance Meet the OECD-DAC Aid Regime”. Journal of international development, 23(5), 752-764
Brautigam, D. “Rubbery Numbers for Chinese Aid to Africa”, China in Africa: The Real Story April2013
Brautigam, D., & Gallagher, K. P. (2014). “Bartering Globalization: China’s Commodity-backed Fi-nance in Africa and Latin America.” Global Policy, 5(3), 346-352.
Chege, M., “Economic relations between Kenya and China, 1963-2007.”, Washington D.C.: CSIS 2008
Chen, G., Geiger, M., and Mingui Fui, “Manufacturing FDI in Sub-Saharan Africa: Trends, Determi-nants, and Impact” World Bank Working Paper, June 2015
Chen, W., Dollar, D., and Tang, H. (2015). “Why is China investing in Africa? Evidence from thefirm level.”
Constantaras, E. (2014) “Tullow Oil sub-contractor employee data reveal contracting drivenby market forces, not economic policy in Turkana”, http://landquest.internewskenya.org/tullow-oil-sub-contractor-employee-data-reveal-contracting-driven-by-market-forces-not-economic-policy-in-turkana/
Accessed 6 November 2015
Davies, P. (2007). China and the end of poverty in Africa: towards mutual benefit?. Sundbyberg: Diakonia.
Dupasquier, C. and Patrick N. Osakwe, “Foreign Direct Investment in Africa: Performance, Chal-lenges, and Responsiblities”, Journal of Aisan Economics 17 (2): 241-60
Executive Research Associate (Pty) Ltd (2009), “China in Africa: A strategic overview”, http://www.ide.go.jp/English/Data/Africa_file/Manualreport/pdf/china_all.pdf
Farole, T. Special economic zones in Africa: comparing performance and learning from global experiences.World Bank Publications, 2011
Farole, Thomas and Mukim, M, “Manufacturing Export Competitiveness in Kenya : policy note.”,Washington, D.C.: World Bank Group http://documents.worldbank.org/curated/en/2013/
12/18746089/manufacturing-export-competitiveness-kenya-policy-note
Feinberg, Robert M. “Do international shocks affect small wholesalers and retailers?” Review ofWorld Economics 146, no. 2 (2010): 323-338
43
A. Sanghi and D. Johnson
Fiott, D., “The EU and China in Africa: the case of Kenya”, Madariaga Paper, Vol. 3 No. 5, July 2010
Grossman, G. M. (1981). “The theory of domestic content protection and content preference”. TheQuarterly Journal of Economics, 583-603
Goldstein, A., Pinaud, N., Helmet, R. and Xiaobao Chen, “China and India: What’s in it for Africa?”,OECD Development Centre, Feb 2006
Musembi, R., “Gdc¡U+0080¿¡U+0099¿S Geothermal Development Strategy For Kenya: Progress& Opportunities”, Presented for Power Africa-Africa Union Commission Geothermal Roadshow,September-October 2014
Hansen, Eric Rolf; Moon, Young; Mogollon, Maria Paulina. 2015. Kenya -Leather industry : diagnosis, strategy, and action plan Washington, D.C. : WorldBank Group. http://documents.worldbank.org/curated/en/2015/09/25022153/
kenya-leather-industry-diagnosis-strategy-action-plan
Head, K., Mayer, T., & Ries, J. (2010). The erosion of colonial trade linkages after independence.Journal of International Economics, 81(1), 1-14
Herbling, D., “Investor targets Chinese with Westlands hotel”, Business Daily, August 2014
Kalinaki, D. “Kenya’s ambitious infrastructure projects will improve links with neighbours”, Finan-cial Times, 02 December 2014
Kaplinsky, R., Morris, M. “Dangling by a thread: How sharp are the Chinese scissors?”, Institute ofDevelopment studies at University of Sussex. Report prepared for DFID trade division, Feb 2006, http://asiandrivers.open.ac.uk/documents/Dangling_by_a_thread_Feb_06_%20final.pdf
Kaplinsky, R., McCormick, D., and Mike Morris, “The Impact of China on Sub-Saharan Africa”,http://opendocs.ids.ac.uk/opendocs/handle/123456789/4142
Kaplinsky, R., “What does the rise of China do for industrialisation in Sub-Saharan Africa?”, Reviewof African Political Economy 35 (115): 7-22
Kaplinsky, R. and Mike Morris, “Chinese FDI in Sub-Saharan Africa: Engaging with Large Drag-ons”, http://www.palgrave-journals.com/ejdr/journal/v21/n4/pdf/ejdr200924a.pdf
Fengler, Wolfgang and Kiringai, Jane (2010). Kenya economic update : running onone engine - Kenya’s uneven economic performance with a special focus on the portof Mombasa Kenya Economic Update; edition no. 2. Washington D.C.: WorldBank Group http://documents.worldbank.org/curated/en/2010/06/12384899/
running-one-engine-kenyas-uneven-economic-performance-special-focus-port-mombasa
World Bank. (2015). Kenya economic update : storm clouds gathering ¡U+0080¿¡U+0093¿the economy facing strong headwinds with a special focus on public participa-tion. Kenya economic update; edition no. 12. Washington D.C.: WorldBank Group. http://documents.worldbank.org/curated/en/2015/10/25153454/
kenya-economic-update-storm-clouds-gathering-economy-facing-strong-headwinds-special-focus-public-participation
44
REFERENCES
Kenya Institute of Curriculum Development (2014). “KICD and KU partner to intro-duce Chinese curricular in schools”. http://kicd.ac.ke/newsletter/index.php/news/
item/405-kicd-and-ku-partner-to-introduce-chinese-curricular-in-schools. AccessedSeptember 25, 2015
King, K. (2010). “China’s cooperation in education and training with Kenya: A different model?”International Journal of Educational Development, 30(5), 488-496
Kenya National Bureau of Statistics, Foreign Investment Survey 2013 (2013)
Kenya National Bureau of Statistics, Economic Survey 2015 (2015)
KPMG, Kenya Country Profile: KPMG Africa Region 2012/2013 http://www.kpmg.com/Africa/
en/KPMG-in-Africa/Documents/2012-2013%20Country%20Profiles/Kenya%20Country%
20Profile_2012-2013.pdf Accessed May 15, 2015
Kremer, Michael, Jean N. Lee, Jonathan M. Robinson, and Olga Rostapshova. “The return to capitalfor small retailers in Kenya: evidence from inventories.”, Working paper, Harvard and UCSC. 2010.
Lakatos, Csilla, Maryla Maliszeska, and Israel Osorio-Rodarte (2015). “China’s slowdown and re-balancing: Potential Growth and Poverty Impacts on Sub-Saharan Africa”. Mimeo
Lyman, P. 2005. “China’s Rising Role in Africa.” Presented to the U.S.-China Commission. July 21.Washington D.C.: Council on Foreign Relations
Lawson, S., and Gilman, D. B. (2009). The Power of the Purse: Gender Equality and Middle-Class Spend-ing. Goldman Sachs, Global Markets Inst.
Leifield, P. (2013). texreg: Conversion of Statistical Model Output in R to LaTeX and HTML Tables.Journal of Statistical Software, 55(8), 1-24. http://www.jstatsoft.org/v55/i08/
Manson, K. “Walmart lines up for slice of Kenyan retail.” Financial Times, June 1, 2015
Ministry of Finance. “Estimates of Development Expenditure of the Government of Kenya forthe year ending 30th June 2015”, April 2014. http://www.cofek.co.ke/GoK%20Development%20Budget%202014-2015.pdf
Moss, T and Sarah Rose, “China Exim Bank and Africa: New Lending, New Challenges” CGD Notes(2006)
Mutegi, M. “Kenya Power signs deal to connect five key towns” Business Daily Africa January 2015
Mwega, Francis M., “A case study of aid effectiveness in Kenya” Wolfensohn Center for DevelopmentWorking Paper 8 2009
Nord, R., Harris E., Giugale, M., and Jeffrey Lewis. “Kenya Fifth Review Under The Three-YearArrangement Under The Extended Credit Facility And Request For A Waiver And ModificationOf Performance Criteria-Debt Sustainability Analysis” International Monetary Fund April 2013
45
A. Sanghi and D. Johnson
Onjala, J. “A Scoping Study on China-Africa Economic Relations: The Case of Kenya”,AERC Scoping Studies on China-Africa Relations. AERC, Nairobi, March 2008 http:
//www.researchgate.net/profile/Joseph_Onjala/publication/239732019_A_Scoping_
Study_on_China-_Africa_Economic_Relations_The_Case_of_Kenya_Revised_Final_
Report/links/0deec51c27bde2ac11000000.pdf
R Core Team (2015). R: A language and environment for statistical computing. R Foundation forStatistical Computing, Vienna, Austria. http://www.R-project.org/
Reilly, J (2015). “The role of China as an education aid donor”, Background paper prepared for the Edu-cation for All Global Monitoring Report 2015 http://unesdoc.unesco.org/images/0023/002324/
232475e.pdf
SinoAfrica Centre of Excellence Foundation. Business Percpetion Index Kenya 2014: Chinese companies’perception of doing business in Kenya 2014 2014.
Santos Silva, J. and Tenreyo, S. (2006). “The Log of Gravity”, Review of Economics and Statistics, 88(4),641-658.
Situma, E. “Chinese firm to rebuild Nginyo Kariuki’s Lenana Mount hotel”, Business Daily May 2015
Strange, M. A., O’Donnell, B., Gamboa, D., Parks, B., and Charles Perla, “AidData’s Methodologyfor Tracking Underreported Financial Flows” AidData: Open Data for Development. 2010
Subramanian, U. and Matthias Matthijs, “Can Sub-Saharan Africa Leap into Global NetworkTrade?” World Bank Publications Vol. 4112 https://openknowledge.worldbank.org/bitstream/
handle/10986/6888/wps4112.pdf
Toyoshima, Toshihiro, Yutaka Yoshino, and Chad Leechor. “Patterns of Africa-Asia Trade and In-vestment: Potential for Ownership and Partnership.” (2004)
United Nations Conference on Trade and Development, How to Attract and Benefit from FDI in SmallCountries: Lessons from Estonia and Jamaica (2011)
United Nations Conference on Trade and Development, Report on the implementation of the investmentpolicy review (2013)
United Nations Conference on Trade and Development, A Practical Guide to Trade Policy Analysis(2012)
Wang, J., Abdoulaye, B., “Africa’s Burgeoning Ties with China”, Finance & Development, 45
Wickham, Hadley. ggplot2: elegant graphics for data analysis. Springer New York, 2009
World Bank. Commodity Markets Outlook Accessed June 20, 2015 www.worldbank.org/content/dam/
Worldbank/GEP/GEPcommodities/GEP2015b_commodity_Apr2015.pdf
World Bank. Africa’s Pulse (October 2015). Washington, D.C. World Bank Group http://documents.
worldbank.org/curated/en/2015/10/25116683/africas-pulse-october-2015
46
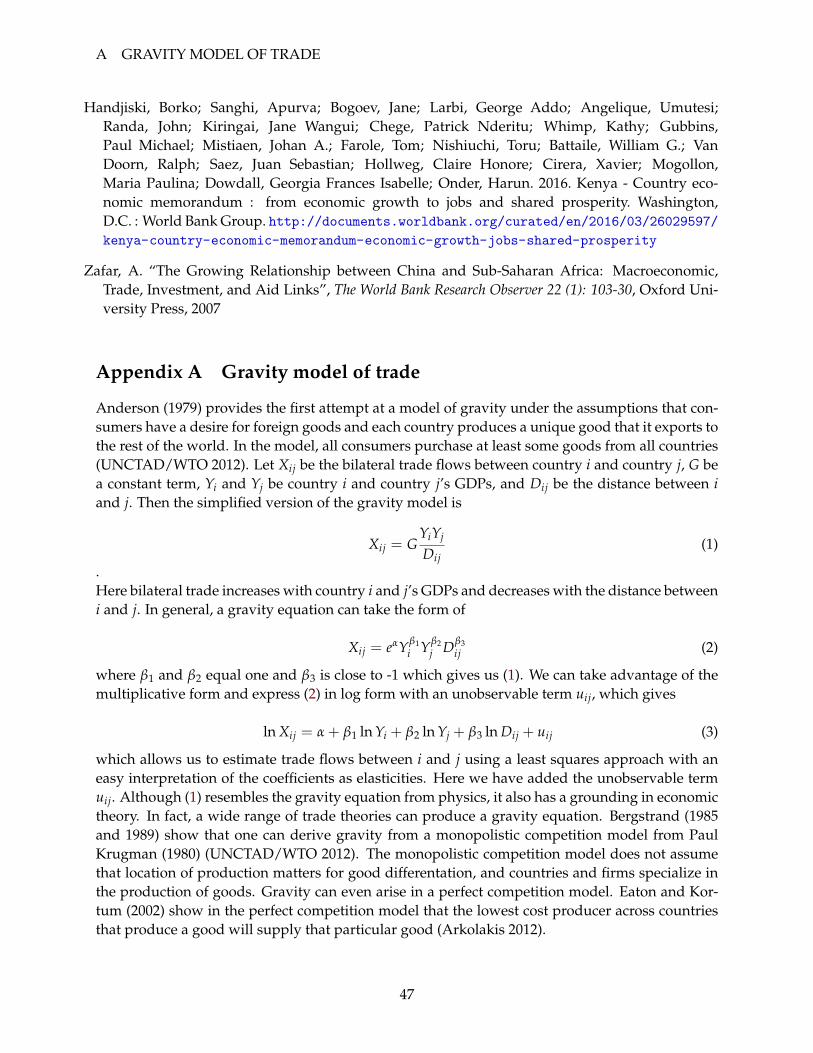
A GRAVITY MODEL OF TRADE
Handjiski, Borko; Sanghi, Apurva; Bogoev, Jane; Larbi, George Addo; Angelique, Umutesi;Randa, John; Kiringai, Jane Wangui; Chege, Patrick Nderitu; Whimp, Kathy; Gubbins,Paul Michael; Mistiaen, Johan A.; Farole, Tom; Nishiuchi, Toru; Battaile, William G.; VanDoorn, Ralph; Saez, Juan Sebastian; Hollweg, Claire Honore; Cirera, Xavier; Mogollon,Maria Paulina; Dowdall, Georgia Frances Isabelle; Onder, Harun. 2016. Kenya - Country eco-nomic memorandum : from economic growth to jobs and shared prosperity. Washington,D.C. : World Bank Group. http://documents.worldbank.org/curated/en/2016/03/26029597/kenya-country-economic-memorandum-economic-growth-jobs-shared-prosperity
Zafar, A. “The Growing Relationship between China and Sub-Saharan Africa: Macroeconomic,Trade, Investment, and Aid Links”, The World Bank Research Observer 22 (1): 103-30, Oxford Uni-versity Press, 2007
Appendix A Gravity model of trade
Anderson (1979) provides the first attempt at a model of gravity under the assumptions that con-sumers have a desire for foreign goods and each country produces a unique good that it exports tothe rest of the world. In the model, all consumers purchase at least some goods from all countries(UNCTAD/WTO 2012). Let Xij be the bilateral trade flows between country i and country j, G bea constant term, Yi and Yj be country i and country j’s GDPs, and Dij be the distance between iand j. Then the simplified version of the gravity model is
Xij = GYiYj
Dij(1)
.Here bilateral trade increases with country i and j’s GDPs and decreases with the distance betweeni and j. In general, a gravity equation can take the form of
Xij = eαYβ1i Yβ2
j Dβ3ij (2)
where β1 and β2 equal one and β3 is close to -1 which gives us (1). We can take advantage of themultiplicative form and express (2) in log form with an unobservable term uij, which gives
ln Xij = α + β1 ln Yi + β2 ln Yj + β3 ln Dij + uij (3)
which allows us to estimate trade flows between i and j using a least squares approach with aneasy interpretation of the coefficients as elasticities. Here we have added the unobservable termuij. Although (1) resembles the gravity equation from physics, it also has a grounding in economictheory. In fact, a wide range of trade theories can produce a gravity equation. Bergstrand (1985and 1989) show that one can derive gravity from a monopolistic competition model from PaulKrugman (1980) (UNCTAD/WTO 2012). The monopolistic competition model does not assumethat location of production matters for good differentation, and countries and firms specialize inthe production of goods. Gravity can even arise in a perfect competition model. Eaton and Kor-tum (2002) show in the perfect competition model that the lowest cost producer across countriesthat produce a good will supply that particular good (Arkolakis 2012).
47
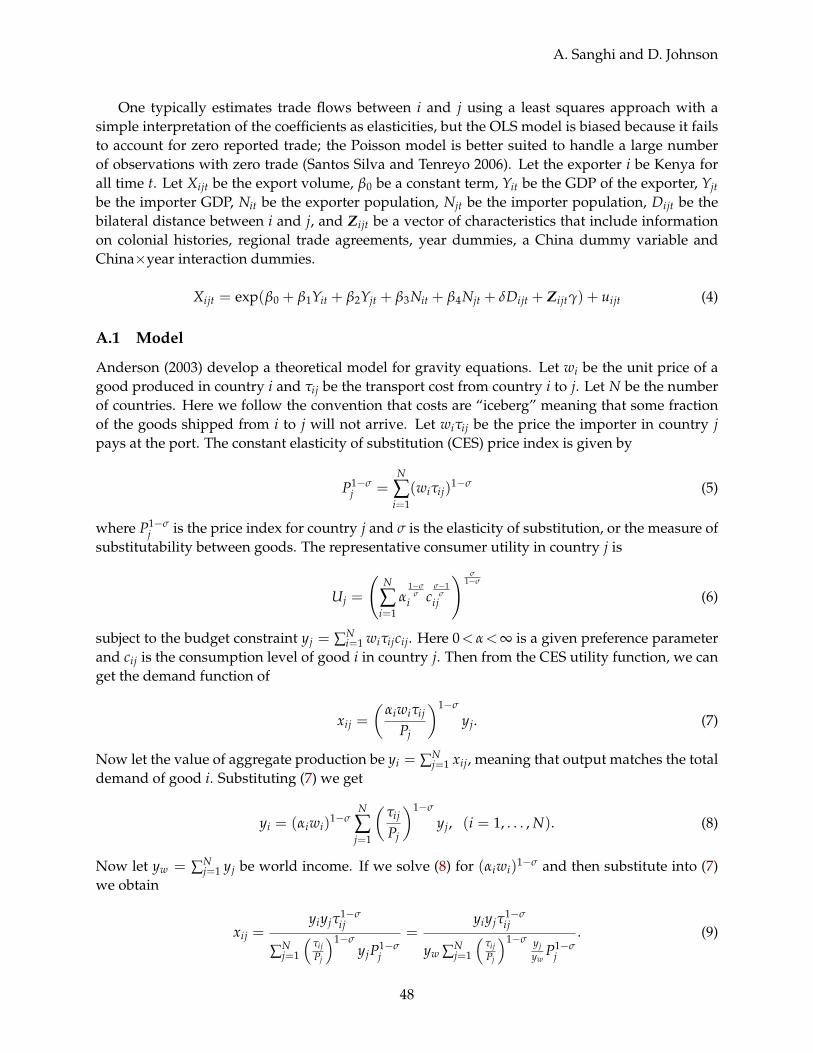
A. Sanghi and D. Johnson
One typically estimates trade flows between i and j using a least squares approach with asimple interpretation of the coefficients as elasticities, but the OLS model is biased because it failsto account for zero reported trade; the Poisson model is better suited to handle a large numberof observations with zero trade (Santos Silva and Tenreyo 2006). Let the exporter i be Kenya forall time t. Let Xijt be the export volume, β0 be a constant term, Yit be the GDP of the exporter, Yjtbe the importer GDP, Nit be the exporter population, Njt be the importer population, Dijt be thebilateral distance between i and j, and Zijt be a vector of characteristics that include informationon colonial histories, regional trade agreements, year dummies, a China dummy variable andChina×year interaction dummies.
Xijt = exp(β0 + β1Yit + β2Yjt + β3Nit + β4Njt + δDijt + Zijtγ) + uijt (4)
A.1 Model
Anderson (2003) develop a theoretical model for gravity equations. Let wi be the unit price of agood produced in country i and τij be the transport cost from country i to j. Let N be the numberof countries. Here we follow the convention that costs are “iceberg” meaning that some fractionof the goods shipped from i to j will not arrive. Let wiτij be the price the importer in country jpays at the port. The constant elasticity of substitution (CES) price index is given by
P1−σj =
N
∑i=1
(wiτij)1−σ (5)
where P1−σj is the price index for country j and σ is the elasticity of substitution, or the measure of
substitutability between goods. The representative consumer utility in country j is
Uj =
(N
∑i=1
α1−σ
σi c
σ−1σ
ij
) σ1−σ
(6)
subject to the budget constraint yj = ∑Ni=1 wiτijcij. Here 0<α<∞ is a given preference parameter
and cij is the consumption level of good i in country j. Then from the CES utility function, we canget the demand function of
xij =
(αiwiτij
Pj
)1−σ
yj. (7)
Now let the value of aggregate production be yi = ∑Nj=1 xij, meaning that output matches the total
demand of good i. Substituting (7) we get
yi = (αiwi)1−σ
N
∑j=1
(τij
Pj
)1−σ
yj, (i = 1, . . . , N). (8)
Now let yw = ∑Nj=1 yj be world income. If we solve (8) for (αiwi)
1−σ and then substitute into (7)we obtain
xij =yiyjτ
1−σij
∑Nj=1
(τijPj
)1−σyjP1−σ
j
=yiyjτ
1−σij
yw ∑Nj=1
(τijPj
)1−σ yjyw
P1−σj
. (9)
48
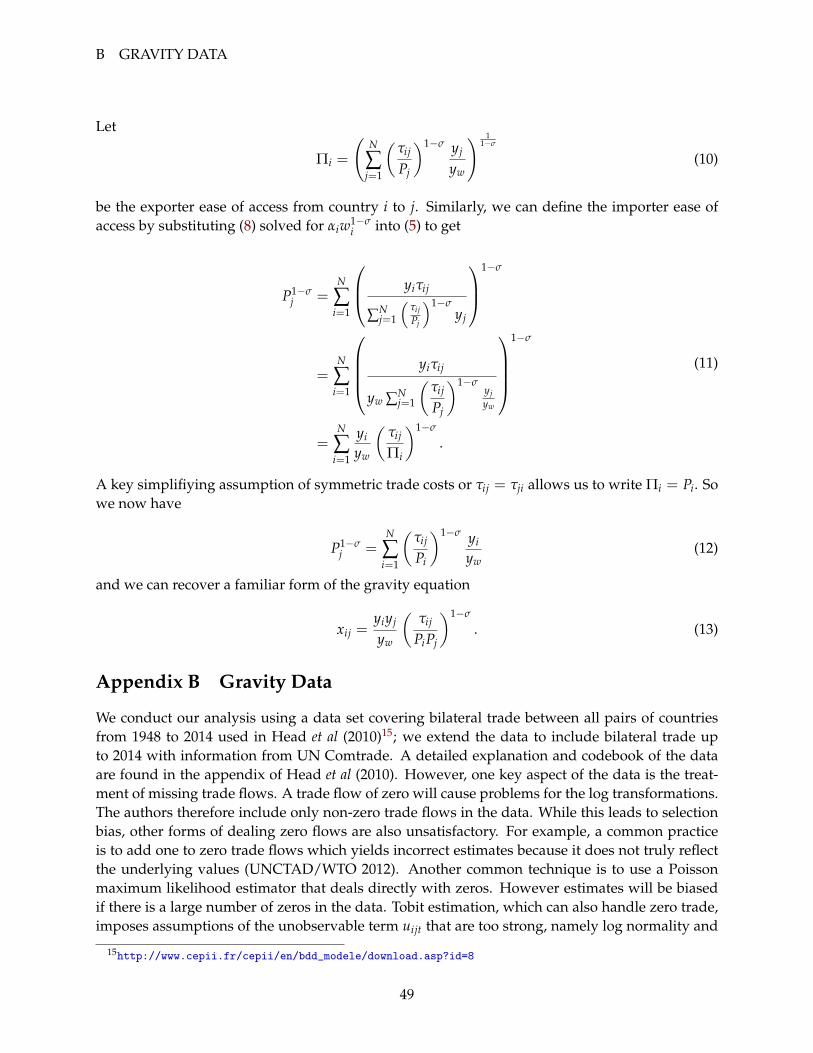
B GRAVITY DATA
Let
Πi =
(N
∑j=1
(τij
Pj
)1−σ yj
yw
) 11−σ
(10)
be the exporter ease of access from country i to j. Similarly, we can define the importer ease ofaccess by substituting (8) solved for αiw1−σ
i into (5) to get
P1−σj =
N
∑i=1
yiτij
∑Nj=1
(τijPj
)1−σyj
1−σ
=N
∑i=1
yiτij
yw ∑Nj=1
(τij
Pj
)1−σyjyw
1−σ
=N
∑i=1
yi
yw
(τij
Πi
)1−σ
.
(11)
A key simplifiying assumption of symmetric trade costs or τij = τji allows us to write Πi = Pi. Sowe now have
P1−σj =
N
∑i=1
(τij
Pi
)1−σ yi
yw(12)
and we can recover a familiar form of the gravity equation
xij =yiyj
yw
(τij
PiPj
)1−σ
. (13)
Appendix B Gravity Data
We conduct our analysis using a data set covering bilateral trade between all pairs of countriesfrom 1948 to 2014 used in Head et al (2010)15; we extend the data to include bilateral trade upto 2014 with information from UN Comtrade. A detailed explanation and codebook of the dataare found in the appendix of Head et al (2010). However, one key aspect of the data is the treat-ment of missing trade flows. A trade flow of zero will cause problems for the log transformations.The authors therefore include only non-zero trade flows in the data. While this leads to selectionbias, other forms of dealing zero flows are also unsatisfactory. For example, a common practiceis to add one to zero trade flows which yields incorrect estimates because it does not truly reflectthe underlying values (UNCTAD/WTO 2012). Another common technique is to use a Poissonmaximum likelihood estimator that deals directly with zeros. However estimates will be biasedif there is a large number of zeros in the data. Tobit estimation, which can also handle zero trade,imposes assumptions of the unobservable term uijt that are too strong, namely log normality and
15http://www.cepii.fr/cepii/en/bdd_modele/download.asp?id=8
49

A. Sanghi and D. Johnson
homoskedasticity. Choosing a left censor or lower bound also presents problems because esti-mates are highly sensitive to the choice of left censor value, or the value assigned to zero trade.Hence, in using this data set we have also dropped zero trade flows.
Appendix C Results
Table C5: Estimates of Kenya’s Trade Flows (1948-2014). Dependent variable: Kenya’s exports
Pooled OLS Fixed Effects Random Effects
Constant 5.26 (0.61)∗∗∗ 5.26 (0.61)∗∗∗
Kenya GDP per capita (Log) 0.95 (0.13)∗∗∗ 0.95 (0.13)∗∗∗
Importer GDP per capita (Log) 0.64 (0.02)∗∗∗ 0.69 (0.03)∗∗∗ 0.64 (0.02)∗∗∗
Population Kenya (Log) −1.47 (0.14)∗∗∗ −1.47 (0.14)∗∗∗
Importer Population (Log) 0.42 (0.01)∗∗∗ 0.64 (0.03)∗∗∗ 0.42 (0.01)∗∗∗
Distance (log) −1.25 (0.05)∗∗∗ −1.31 (0.10)∗∗∗ −1.25 (0.05)∗∗∗
Regional Trade Agreement 1.73 (0.13)∗∗∗ 1.80 (0.15)∗∗∗ 1.73 (0.13)∗∗∗
Contiguous 1.14 (0.14)∗∗∗ 0.77 (0.17)∗∗∗ 1.14 (0.14)∗∗∗
Common Language 0.67 (0.06)∗∗∗ 0.92 (0.08)∗∗∗ 0.67 (0.06)∗∗∗
GATT Kenya −1.36 (0.12)∗∗∗ −1.33 (0.11)∗∗∗ −1.36 (0.12)∗∗∗
GATT importer 0.09 (0.06) −0.05 (0.05) 0.09 (0.06)Colonial History 2.88 (0.14)∗∗∗ 2.16 (0.11)∗∗∗ 2.88 (0.14)∗∗∗
China dummy 1.11 (0.19)∗∗∗ 1.11 (0.19)∗∗∗
Year dummiesYear1949 −0.04 (0.37) 0.04 (0.40) −0.04 (0.37)Year1950 0.01 (0.37) 0.03 (0.38) 0.01 (0.37)Year1951 −0.25 (0.37) −0.25 (0.35) −0.25 (0.37)Year1952 0.39 (0.40) 0.46 (0.40) 0.39 (0.40)Year1953 0.68 (0.35) 0.81 (0.39)∗ 0.68 (0.35)Year1954 0.14 (0.34) 0.31 (0.30) 0.14 (0.34)Year1955 −0.02 (0.35) 0.13 (0.34) −0.02 (0.35)Year1956 −0.43 (0.37) −0.34 (0.36) −0.43 (0.37)Year1957 −0.32 (0.38) −0.24 (0.38) −0.32 (0.38)Year1958 0.01 (0.34) 0.20 (0.36) 0.01 (0.34)Year1959 −0.49 (0.35) −0.37 (0.34) −0.49 (0.35)Year1960 0.21 (0.34) 0.36 (0.34) 0.21 (0.34)Year1961 0.08 (0.33) 0.30 (0.29) 0.08 (0.33)Year1962 0.29 (0.31) 0.41 (0.30) 0.29 (0.31)Year1963 0.11 (0.33) 0.22 (0.31) 0.11 (0.33)Year1964 0.11 (0.36) 0.14 (0.29) 0.11 (0.36)Year1965 0.01 (0.34) 0.04 (0.33) 0.01 (0.34)Year1966 0.19 (0.35) 0.16 (0.35) 0.19 (0.35)Year1967 −0.16 (0.33) −0.14 (0.30) −0.16 (0.33)Year1968 0.40 (0.32) 0.54 (0.32) 0.40 (0.32)Year1969 0.18 (0.32) 0.27 (0.29) 0.18 (0.32)Year1970 −0.12 (0.33) −0.05 (0.35) −0.12 (0.33)
50
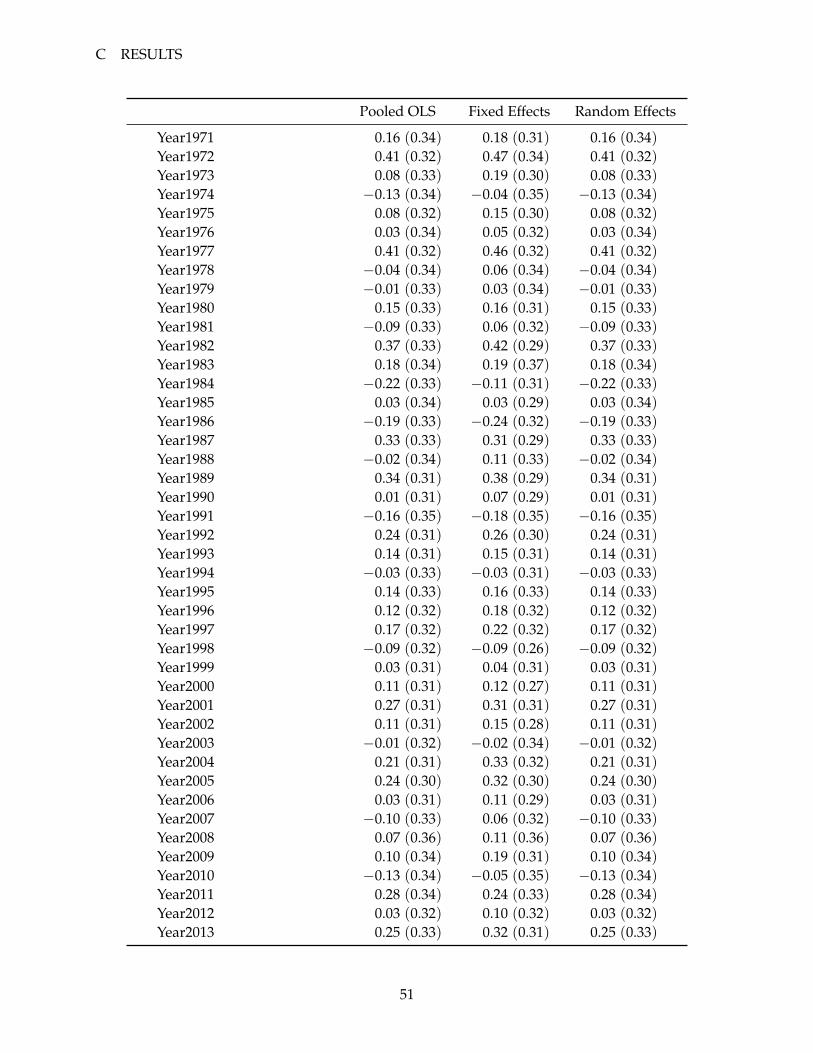
C RESULTS
Pooled OLS Fixed Effects Random Effects
Year1971 0.16 (0.34) 0.18 (0.31) 0.16 (0.34)Year1972 0.41 (0.32) 0.47 (0.34) 0.41 (0.32)Year1973 0.08 (0.33) 0.19 (0.30) 0.08 (0.33)Year1974 −0.13 (0.34) −0.04 (0.35) −0.13 (0.34)Year1975 0.08 (0.32) 0.15 (0.30) 0.08 (0.32)Year1976 0.03 (0.34) 0.05 (0.32) 0.03 (0.34)Year1977 0.41 (0.32) 0.46 (0.32) 0.41 (0.32)Year1978 −0.04 (0.34) 0.06 (0.34) −0.04 (0.34)Year1979 −0.01 (0.33) 0.03 (0.34) −0.01 (0.33)Year1980 0.15 (0.33) 0.16 (0.31) 0.15 (0.33)Year1981 −0.09 (0.33) 0.06 (0.32) −0.09 (0.33)Year1982 0.37 (0.33) 0.42 (0.29) 0.37 (0.33)Year1983 0.18 (0.34) 0.19 (0.37) 0.18 (0.34)Year1984 −0.22 (0.33) −0.11 (0.31) −0.22 (0.33)Year1985 0.03 (0.34) 0.03 (0.29) 0.03 (0.34)Year1986 −0.19 (0.33) −0.24 (0.32) −0.19 (0.33)Year1987 0.33 (0.33) 0.31 (0.29) 0.33 (0.33)Year1988 −0.02 (0.34) 0.11 (0.33) −0.02 (0.34)Year1989 0.34 (0.31) 0.38 (0.29) 0.34 (0.31)Year1990 0.01 (0.31) 0.07 (0.29) 0.01 (0.31)Year1991 −0.16 (0.35) −0.18 (0.35) −0.16 (0.35)Year1992 0.24 (0.31) 0.26 (0.30) 0.24 (0.31)Year1993 0.14 (0.31) 0.15 (0.31) 0.14 (0.31)Year1994 −0.03 (0.33) −0.03 (0.31) −0.03 (0.33)Year1995 0.14 (0.33) 0.16 (0.33) 0.14 (0.33)Year1996 0.12 (0.32) 0.18 (0.32) 0.12 (0.32)Year1997 0.17 (0.32) 0.22 (0.32) 0.17 (0.32)Year1998 −0.09 (0.32) −0.09 (0.26) −0.09 (0.32)Year1999 0.03 (0.31) 0.04 (0.31) 0.03 (0.31)Year2000 0.11 (0.31) 0.12 (0.27) 0.11 (0.31)Year2001 0.27 (0.31) 0.31 (0.31) 0.27 (0.31)Year2002 0.11 (0.31) 0.15 (0.28) 0.11 (0.31)Year2003 −0.01 (0.32) −0.02 (0.34) −0.01 (0.32)Year2004 0.21 (0.31) 0.33 (0.32) 0.21 (0.31)Year2005 0.24 (0.30) 0.32 (0.30) 0.24 (0.30)Year2006 0.03 (0.31) 0.11 (0.29) 0.03 (0.31)Year2007 −0.10 (0.33) 0.06 (0.32) −0.10 (0.33)Year2008 0.07 (0.36) 0.11 (0.36) 0.07 (0.36)Year2009 0.10 (0.34) 0.19 (0.31) 0.10 (0.34)Year2010 −0.13 (0.34) −0.05 (0.35) −0.13 (0.34)Year2011 0.28 (0.34) 0.24 (0.33) 0.28 (0.34)Year2012 0.03 (0.32) 0.10 (0.32) 0.03 (0.32)Year2013 0.25 (0.33) 0.32 (0.31) 0.25 (0.33)
51
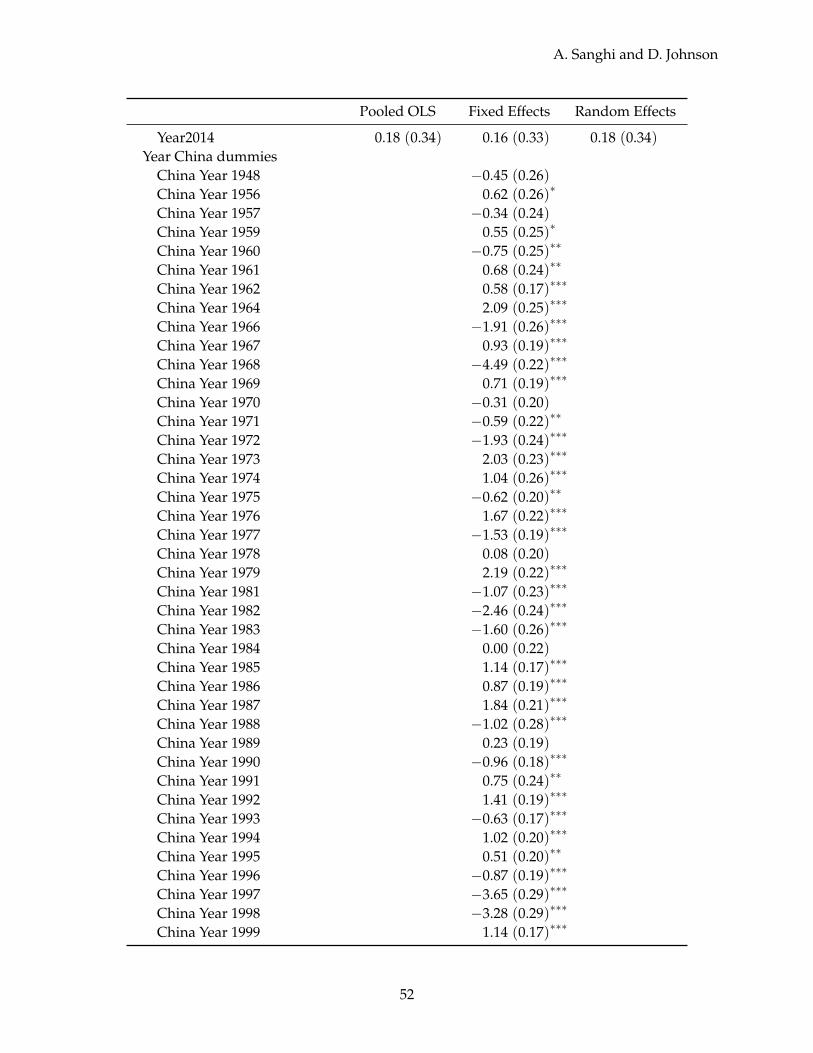
A. Sanghi and D. Johnson
Pooled OLS Fixed Effects Random Effects
Year2014 0.18 (0.34) 0.16 (0.33) 0.18 (0.34)Year China dummies
China Year 1948 −0.45 (0.26)China Year 1956 0.62 (0.26)∗
China Year 1957 −0.34 (0.24)China Year 1959 0.55 (0.25)∗
China Year 1960 −0.75 (0.25)∗∗
China Year 1961 0.68 (0.24)∗∗
China Year 1962 0.58 (0.17)∗∗∗
China Year 1964 2.09 (0.25)∗∗∗
China Year 1966 −1.91 (0.26)∗∗∗
China Year 1967 0.93 (0.19)∗∗∗
China Year 1968 −4.49 (0.22)∗∗∗
China Year 1969 0.71 (0.19)∗∗∗
China Year 1970 −0.31 (0.20)China Year 1971 −0.59 (0.22)∗∗
China Year 1972 −1.93 (0.24)∗∗∗
China Year 1973 2.03 (0.23)∗∗∗
China Year 1974 1.04 (0.26)∗∗∗
China Year 1975 −0.62 (0.20)∗∗
China Year 1976 1.67 (0.22)∗∗∗
China Year 1977 −1.53 (0.19)∗∗∗
China Year 1978 0.08 (0.20)China Year 1979 2.19 (0.22)∗∗∗
China Year 1981 −1.07 (0.23)∗∗∗
China Year 1982 −2.46 (0.24)∗∗∗
China Year 1983 −1.60 (0.26)∗∗∗
China Year 1984 0.00 (0.22)China Year 1985 1.14 (0.17)∗∗∗
China Year 1986 0.87 (0.19)∗∗∗
China Year 1987 1.84 (0.21)∗∗∗
China Year 1988 −1.02 (0.28)∗∗∗
China Year 1989 0.23 (0.19)China Year 1990 −0.96 (0.18)∗∗∗
China Year 1991 0.75 (0.24)∗∗
China Year 1992 1.41 (0.19)∗∗∗
China Year 1993 −0.63 (0.17)∗∗∗
China Year 1994 1.02 (0.20)∗∗∗
China Year 1995 0.51 (0.20)∗∗
China Year 1996 −0.87 (0.19)∗∗∗
China Year 1997 −3.65 (0.29)∗∗∗
China Year 1998 −3.28 (0.29)∗∗∗
China Year 1999 1.14 (0.17)∗∗∗
52
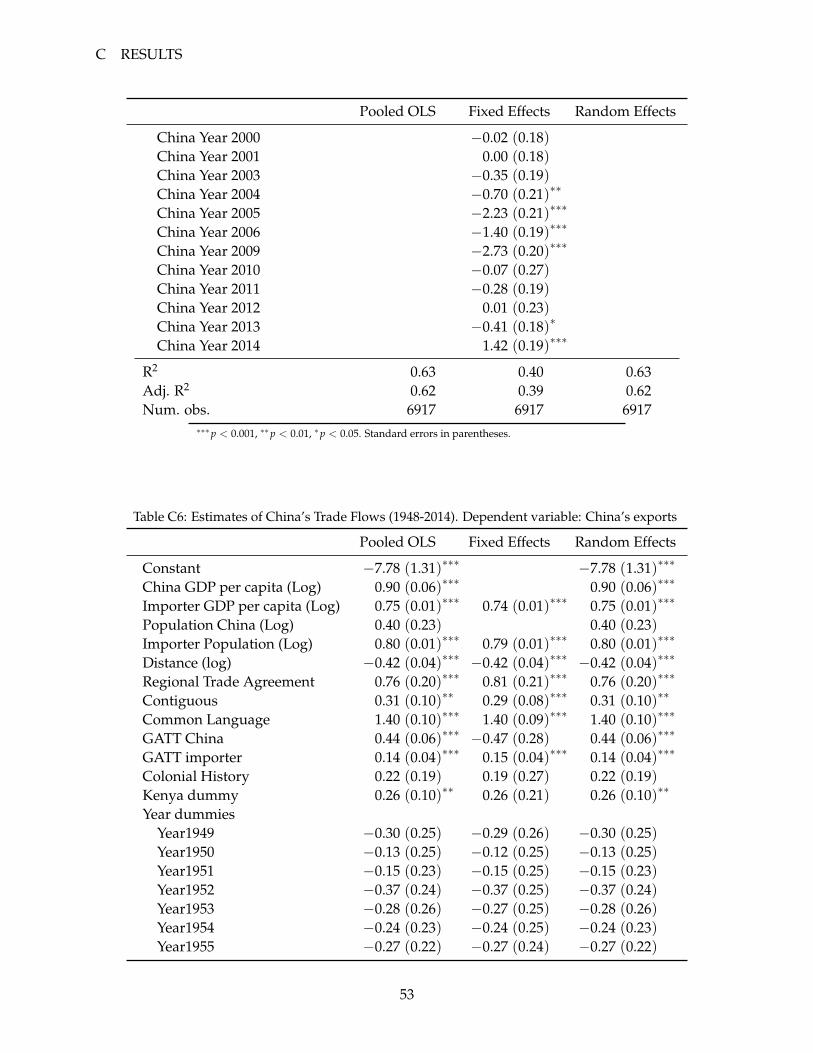
C RESULTS
Pooled OLS Fixed Effects Random Effects
China Year 2000 −0.02 (0.18)China Year 2001 0.00 (0.18)China Year 2003 −0.35 (0.19)China Year 2004 −0.70 (0.21)∗∗
China Year 2005 −2.23 (0.21)∗∗∗
China Year 2006 −1.40 (0.19)∗∗∗
China Year 2009 −2.73 (0.20)∗∗∗
China Year 2010 −0.07 (0.27)China Year 2011 −0.28 (0.19)China Year 2012 0.01 (0.23)China Year 2013 −0.41 (0.18)∗
China Year 2014 1.42 (0.19)∗∗∗
R2 0.63 0.40 0.63Adj. R2 0.62 0.39 0.62Num. obs. 6917 6917 6917
∗∗∗p < 0.001, ∗∗p < 0.01, ∗p < 0.05. Standard errors in parentheses.
Table C6: Estimates of China’s Trade Flows (1948-2014). Dependent variable: China’s exports
Pooled OLS Fixed Effects Random Effects
Constant −7.78 (1.31)∗∗∗ −7.78 (1.31)∗∗∗
China GDP per capita (Log) 0.90 (0.06)∗∗∗ 0.90 (0.06)∗∗∗
Importer GDP per capita (Log) 0.75 (0.01)∗∗∗ 0.74 (0.01)∗∗∗ 0.75 (0.01)∗∗∗
Population China (Log) 0.40 (0.23) 0.40 (0.23)Importer Population (Log) 0.80 (0.01)∗∗∗ 0.79 (0.01)∗∗∗ 0.80 (0.01)∗∗∗
Distance (log) −0.42 (0.04)∗∗∗ −0.42 (0.04)∗∗∗ −0.42 (0.04)∗∗∗
Regional Trade Agreement 0.76 (0.20)∗∗∗ 0.81 (0.21)∗∗∗ 0.76 (0.20)∗∗∗
Contiguous 0.31 (0.10)∗∗ 0.29 (0.08)∗∗∗ 0.31 (0.10)∗∗
Common Language 1.40 (0.10)∗∗∗ 1.40 (0.09)∗∗∗ 1.40 (0.10)∗∗∗
GATT China 0.44 (0.06)∗∗∗ −0.47 (0.28) 0.44 (0.06)∗∗∗
GATT importer 0.14 (0.04)∗∗∗ 0.15 (0.04)∗∗∗ 0.14 (0.04)∗∗∗
Colonial History 0.22 (0.19) 0.19 (0.27) 0.22 (0.19)Kenya dummy 0.26 (0.10)∗∗ 0.26 (0.21) 0.26 (0.10)∗∗
Year dummiesYear1949 −0.30 (0.25) −0.29 (0.26) −0.30 (0.25)Year1950 −0.13 (0.25) −0.12 (0.25) −0.13 (0.25)Year1951 −0.15 (0.23) −0.15 (0.25) −0.15 (0.23)Year1952 −0.37 (0.24) −0.37 (0.25) −0.37 (0.24)Year1953 −0.28 (0.26) −0.27 (0.25) −0.28 (0.26)Year1954 −0.24 (0.23) −0.24 (0.25) −0.24 (0.23)Year1955 −0.27 (0.22) −0.27 (0.24) −0.27 (0.22)
53
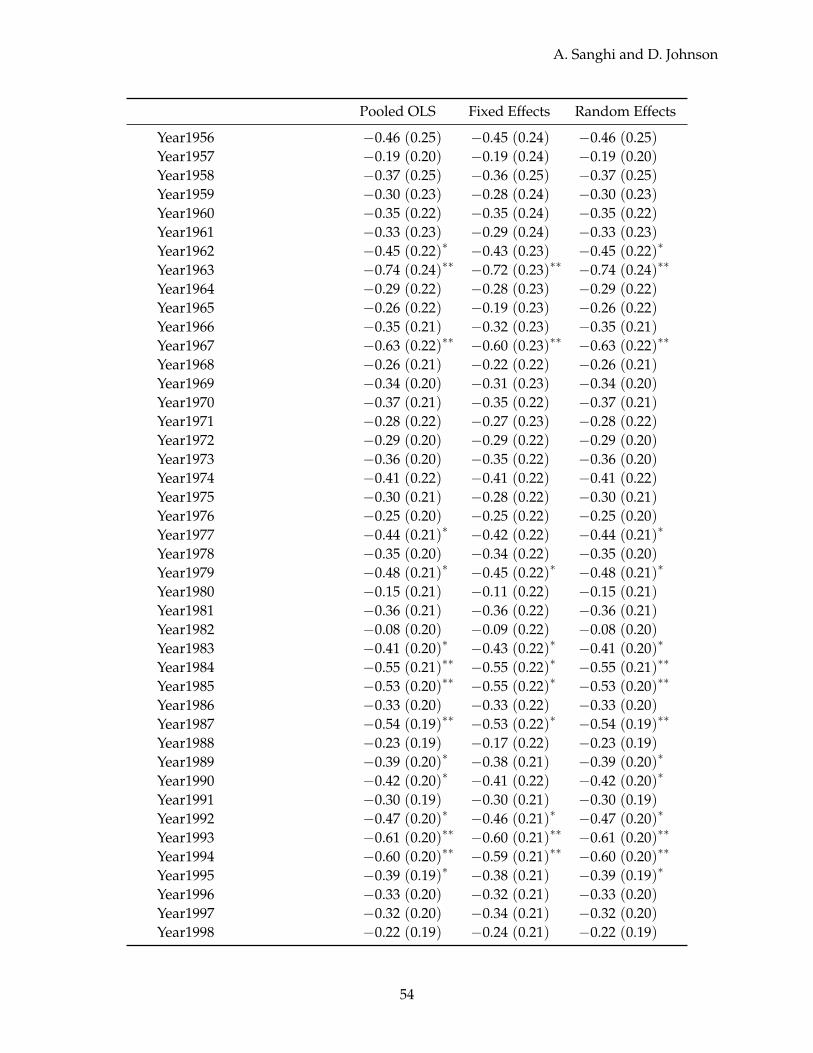
A. Sanghi and D. Johnson
Pooled OLS Fixed Effects Random Effects
Year1956 −0.46 (0.25) −0.45 (0.24) −0.46 (0.25)Year1957 −0.19 (0.20) −0.19 (0.24) −0.19 (0.20)Year1958 −0.37 (0.25) −0.36 (0.25) −0.37 (0.25)Year1959 −0.30 (0.23) −0.28 (0.24) −0.30 (0.23)Year1960 −0.35 (0.22) −0.35 (0.24) −0.35 (0.22)Year1961 −0.33 (0.23) −0.29 (0.24) −0.33 (0.23)Year1962 −0.45 (0.22)∗ −0.43 (0.23) −0.45 (0.22)∗
Year1963 −0.74 (0.24)∗∗ −0.72 (0.23)∗∗ −0.74 (0.24)∗∗
Year1964 −0.29 (0.22) −0.28 (0.23) −0.29 (0.22)Year1965 −0.26 (0.22) −0.19 (0.23) −0.26 (0.22)Year1966 −0.35 (0.21) −0.32 (0.23) −0.35 (0.21)Year1967 −0.63 (0.22)∗∗ −0.60 (0.23)∗∗ −0.63 (0.22)∗∗
Year1968 −0.26 (0.21) −0.22 (0.22) −0.26 (0.21)Year1969 −0.34 (0.20) −0.31 (0.23) −0.34 (0.20)Year1970 −0.37 (0.21) −0.35 (0.22) −0.37 (0.21)Year1971 −0.28 (0.22) −0.27 (0.23) −0.28 (0.22)Year1972 −0.29 (0.20) −0.29 (0.22) −0.29 (0.20)Year1973 −0.36 (0.20) −0.35 (0.22) −0.36 (0.20)Year1974 −0.41 (0.22) −0.41 (0.22) −0.41 (0.22)Year1975 −0.30 (0.21) −0.28 (0.22) −0.30 (0.21)Year1976 −0.25 (0.20) −0.25 (0.22) −0.25 (0.20)Year1977 −0.44 (0.21)∗ −0.42 (0.22) −0.44 (0.21)∗
Year1978 −0.35 (0.20) −0.34 (0.22) −0.35 (0.20)Year1979 −0.48 (0.21)∗ −0.45 (0.22)∗ −0.48 (0.21)∗
Year1980 −0.15 (0.21) −0.11 (0.22) −0.15 (0.21)Year1981 −0.36 (0.21) −0.36 (0.22) −0.36 (0.21)Year1982 −0.08 (0.20) −0.09 (0.22) −0.08 (0.20)Year1983 −0.41 (0.20)∗ −0.43 (0.22)∗ −0.41 (0.20)∗
Year1984 −0.55 (0.21)∗∗ −0.55 (0.22)∗ −0.55 (0.21)∗∗
Year1985 −0.53 (0.20)∗∗ −0.55 (0.22)∗ −0.53 (0.20)∗∗
Year1986 −0.33 (0.20) −0.33 (0.22) −0.33 (0.20)Year1987 −0.54 (0.19)∗∗ −0.53 (0.22)∗ −0.54 (0.19)∗∗
Year1988 −0.23 (0.19) −0.17 (0.22) −0.23 (0.19)Year1989 −0.39 (0.20)∗ −0.38 (0.21) −0.39 (0.20)∗
Year1990 −0.42 (0.20)∗ −0.41 (0.22) −0.42 (0.20)∗
Year1991 −0.30 (0.19) −0.30 (0.21) −0.30 (0.19)Year1992 −0.47 (0.20)∗ −0.46 (0.21)∗ −0.47 (0.20)∗
Year1993 −0.61 (0.20)∗∗ −0.60 (0.21)∗∗ −0.61 (0.20)∗∗
Year1994 −0.60 (0.20)∗∗ −0.59 (0.21)∗∗ −0.60 (0.20)∗∗
Year1995 −0.39 (0.19)∗ −0.38 (0.21) −0.39 (0.19)∗
Year1996 −0.33 (0.20) −0.32 (0.21) −0.33 (0.20)Year1997 −0.32 (0.20) −0.34 (0.21) −0.32 (0.20)Year1998 −0.22 (0.19) −0.24 (0.21) −0.22 (0.19)
54
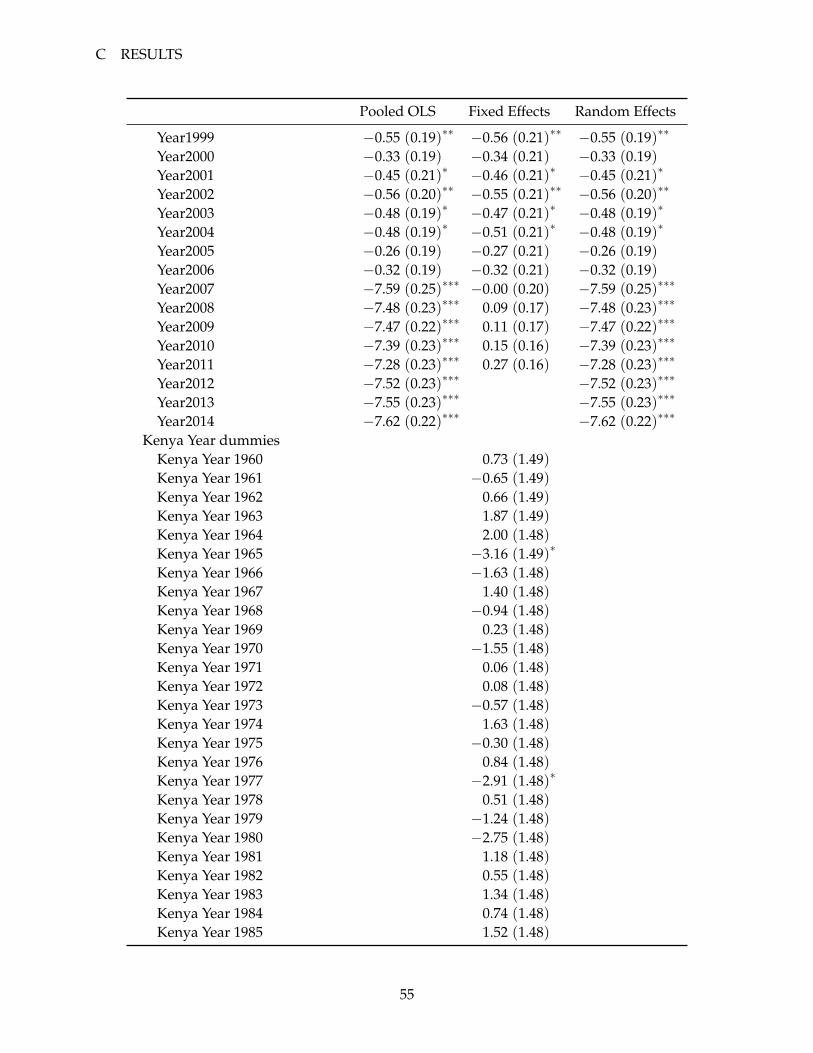
C RESULTS
Pooled OLS Fixed Effects Random Effects
Year1999 −0.55 (0.19)∗∗ −0.56 (0.21)∗∗ −0.55 (0.19)∗∗
Year2000 −0.33 (0.19) −0.34 (0.21) −0.33 (0.19)Year2001 −0.45 (0.21)∗ −0.46 (0.21)∗ −0.45 (0.21)∗
Year2002 −0.56 (0.20)∗∗ −0.55 (0.21)∗∗ −0.56 (0.20)∗∗
Year2003 −0.48 (0.19)∗ −0.47 (0.21)∗ −0.48 (0.19)∗
Year2004 −0.48 (0.19)∗ −0.51 (0.21)∗ −0.48 (0.19)∗
Year2005 −0.26 (0.19) −0.27 (0.21) −0.26 (0.19)Year2006 −0.32 (0.19) −0.32 (0.21) −0.32 (0.19)Year2007 −7.59 (0.25)∗∗∗ −0.00 (0.20) −7.59 (0.25)∗∗∗
Year2008 −7.48 (0.23)∗∗∗ 0.09 (0.17) −7.48 (0.23)∗∗∗
Year2009 −7.47 (0.22)∗∗∗ 0.11 (0.17) −7.47 (0.22)∗∗∗
Year2010 −7.39 (0.23)∗∗∗ 0.15 (0.16) −7.39 (0.23)∗∗∗
Year2011 −7.28 (0.23)∗∗∗ 0.27 (0.16) −7.28 (0.23)∗∗∗
Year2012 −7.52 (0.23)∗∗∗ −7.52 (0.23)∗∗∗
Year2013 −7.55 (0.23)∗∗∗ −7.55 (0.23)∗∗∗
Year2014 −7.62 (0.22)∗∗∗ −7.62 (0.22)∗∗∗
Kenya Year dummiesKenya Year 1960 0.73 (1.49)Kenya Year 1961 −0.65 (1.49)Kenya Year 1962 0.66 (1.49)Kenya Year 1963 1.87 (1.49)Kenya Year 1964 2.00 (1.48)Kenya Year 1965 −3.16 (1.49)∗
Kenya Year 1966 −1.63 (1.48)Kenya Year 1967 1.40 (1.48)Kenya Year 1968 −0.94 (1.48)Kenya Year 1969 0.23 (1.48)Kenya Year 1970 −1.55 (1.48)Kenya Year 1971 0.06 (1.48)Kenya Year 1972 0.08 (1.48)Kenya Year 1973 −0.57 (1.48)Kenya Year 1974 1.63 (1.48)Kenya Year 1975 −0.30 (1.48)Kenya Year 1976 0.84 (1.48)Kenya Year 1977 −2.91 (1.48)∗
Kenya Year 1978 0.51 (1.48)Kenya Year 1979 −1.24 (1.48)Kenya Year 1980 −2.75 (1.48)Kenya Year 1981 1.18 (1.48)Kenya Year 1982 0.55 (1.48)Kenya Year 1983 1.34 (1.48)Kenya Year 1984 0.74 (1.48)Kenya Year 1985 1.52 (1.48)
55
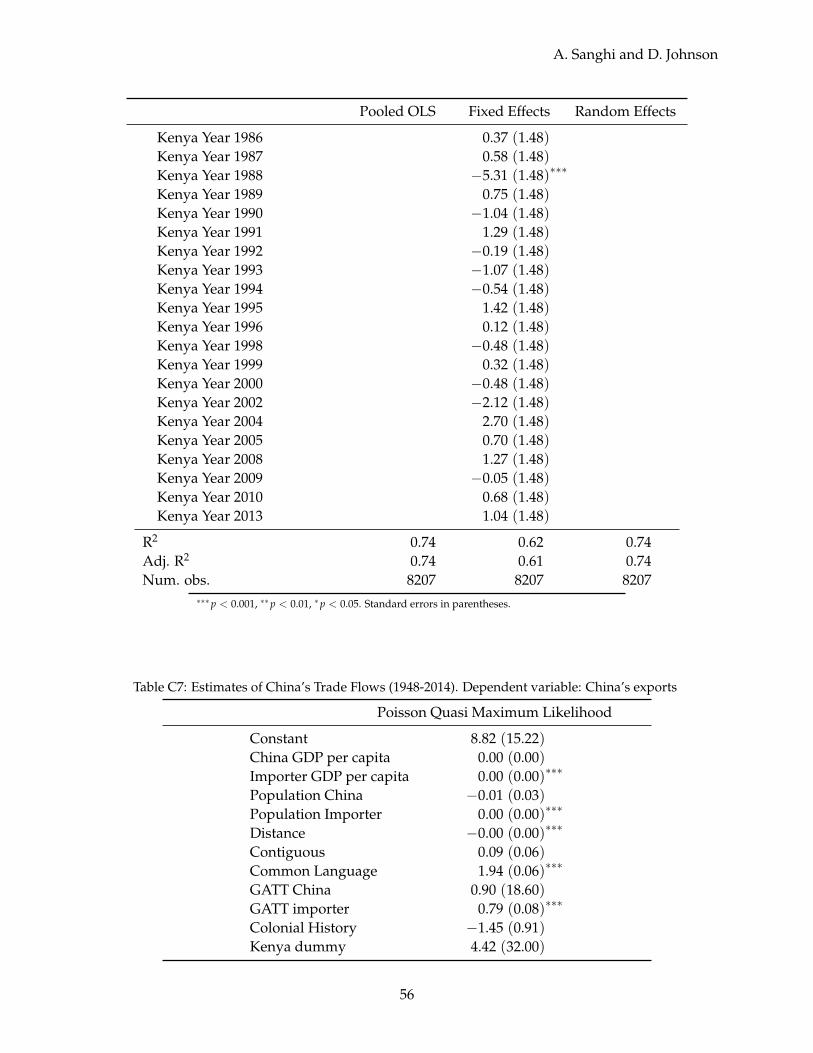
A. Sanghi and D. Johnson
Pooled OLS Fixed Effects Random Effects
Kenya Year 1986 0.37 (1.48)Kenya Year 1987 0.58 (1.48)Kenya Year 1988 −5.31 (1.48)∗∗∗
Kenya Year 1989 0.75 (1.48)Kenya Year 1990 −1.04 (1.48)Kenya Year 1991 1.29 (1.48)Kenya Year 1992 −0.19 (1.48)Kenya Year 1993 −1.07 (1.48)Kenya Year 1994 −0.54 (1.48)Kenya Year 1995 1.42 (1.48)Kenya Year 1996 0.12 (1.48)Kenya Year 1998 −0.48 (1.48)Kenya Year 1999 0.32 (1.48)Kenya Year 2000 −0.48 (1.48)Kenya Year 2002 −2.12 (1.48)Kenya Year 2004 2.70 (1.48)Kenya Year 2005 0.70 (1.48)Kenya Year 2008 1.27 (1.48)Kenya Year 2009 −0.05 (1.48)Kenya Year 2010 0.68 (1.48)Kenya Year 2013 1.04 (1.48)
R2 0.74 0.62 0.74Adj. R2 0.74 0.61 0.74Num. obs. 8207 8207 8207
∗∗∗p < 0.001, ∗∗p < 0.01, ∗p < 0.05. Standard errors in parentheses.
Table C7: Estimates of China’s Trade Flows (1948-2014). Dependent variable: China’s exports
Poisson Quasi Maximum Likelihood
Constant 8.82 (15.22)China GDP per capita 0.00 (0.00)Importer GDP per capita 0.00 (0.00)∗∗∗
Population China −0.01 (0.03)Population Importer 0.00 (0.00)∗∗∗
Distance −0.00 (0.00)∗∗∗
Contiguous 0.09 (0.06)Common Language 1.94 (0.06)∗∗∗
GATT China 0.90 (18.60)GATT importer 0.79 (0.08)∗∗∗
Colonial History −1.45 (0.91)Kenya dummy 4.42 (32.00)
56
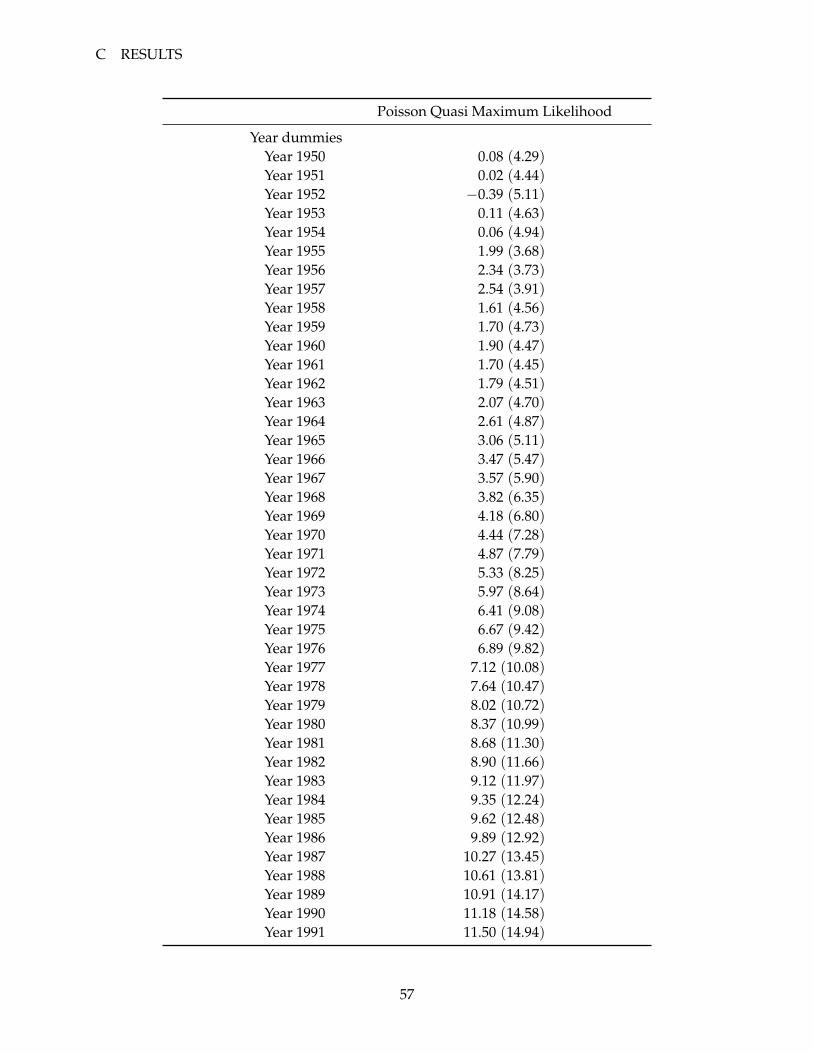
C RESULTS
Poisson Quasi Maximum Likelihood
Year dummiesYear 1950 0.08 (4.29)Year 1951 0.02 (4.44)Year 1952 −0.39 (5.11)Year 1953 0.11 (4.63)Year 1954 0.06 (4.94)Year 1955 1.99 (3.68)Year 1956 2.34 (3.73)Year 1957 2.54 (3.91)Year 1958 1.61 (4.56)Year 1959 1.70 (4.73)Year 1960 1.90 (4.47)Year 1961 1.70 (4.45)Year 1962 1.79 (4.51)Year 1963 2.07 (4.70)Year 1964 2.61 (4.87)Year 1965 3.06 (5.11)Year 1966 3.47 (5.47)Year 1967 3.57 (5.90)Year 1968 3.82 (6.35)Year 1969 4.18 (6.80)Year 1970 4.44 (7.28)Year 1971 4.87 (7.79)Year 1972 5.33 (8.25)Year 1973 5.97 (8.64)Year 1974 6.41 (9.08)Year 1975 6.67 (9.42)Year 1976 6.89 (9.82)Year 1977 7.12 (10.08)Year 1978 7.64 (10.47)Year 1979 8.02 (10.72)Year 1980 8.37 (10.99)Year 1981 8.68 (11.30)Year 1982 8.90 (11.66)Year 1983 9.12 (11.97)Year 1984 9.35 (12.24)Year 1985 9.62 (12.48)Year 1986 9.89 (12.92)Year 1987 10.27 (13.45)Year 1988 10.61 (13.81)Year 1989 10.91 (14.17)Year 1990 11.18 (14.58)Year 1991 11.50 (14.94)
57
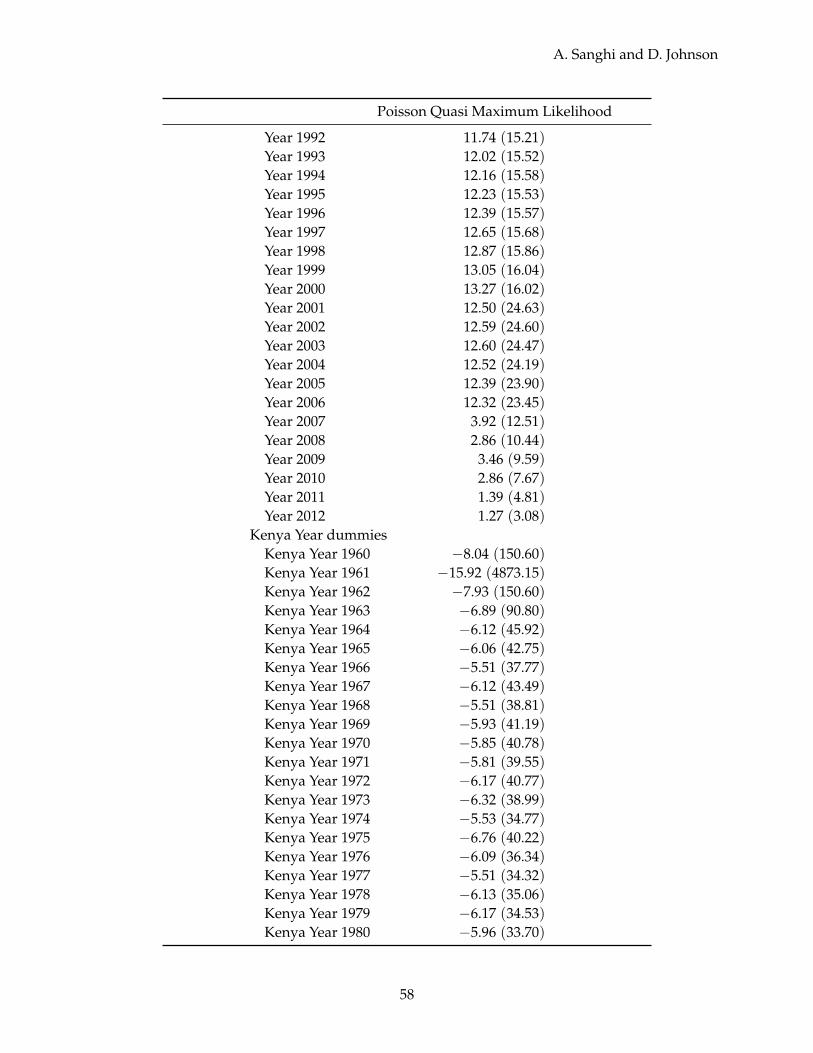
A. Sanghi and D. Johnson
Poisson Quasi Maximum Likelihood
Year 1992 11.74 (15.21)Year 1993 12.02 (15.52)Year 1994 12.16 (15.58)Year 1995 12.23 (15.53)Year 1996 12.39 (15.57)Year 1997 12.65 (15.68)Year 1998 12.87 (15.86)Year 1999 13.05 (16.04)Year 2000 13.27 (16.02)Year 2001 12.50 (24.63)Year 2002 12.59 (24.60)Year 2003 12.60 (24.47)Year 2004 12.52 (24.19)Year 2005 12.39 (23.90)Year 2006 12.32 (23.45)Year 2007 3.92 (12.51)Year 2008 2.86 (10.44)Year 2009 3.46 (9.59)Year 2010 2.86 (7.67)Year 2011 1.39 (4.81)Year 2012 1.27 (3.08)
Kenya Year dummiesKenya Year 1960 −8.04 (150.60)Kenya Year 1961 −15.92 (4873.15)Kenya Year 1962 −7.93 (150.60)Kenya Year 1963 −6.89 (90.80)Kenya Year 1964 −6.12 (45.92)Kenya Year 1965 −6.06 (42.75)Kenya Year 1966 −5.51 (37.77)Kenya Year 1967 −6.12 (43.49)Kenya Year 1968 −5.51 (38.81)Kenya Year 1969 −5.93 (41.19)Kenya Year 1970 −5.85 (40.78)Kenya Year 1971 −5.81 (39.55)Kenya Year 1972 −6.17 (40.77)Kenya Year 1973 −6.32 (38.99)Kenya Year 1974 −5.53 (34.77)Kenya Year 1975 −6.76 (40.22)Kenya Year 1976 −6.09 (36.34)Kenya Year 1977 −5.51 (34.32)Kenya Year 1978 −6.13 (35.06)Kenya Year 1979 −6.17 (34.53)Kenya Year 1980 −5.96 (33.70)
58
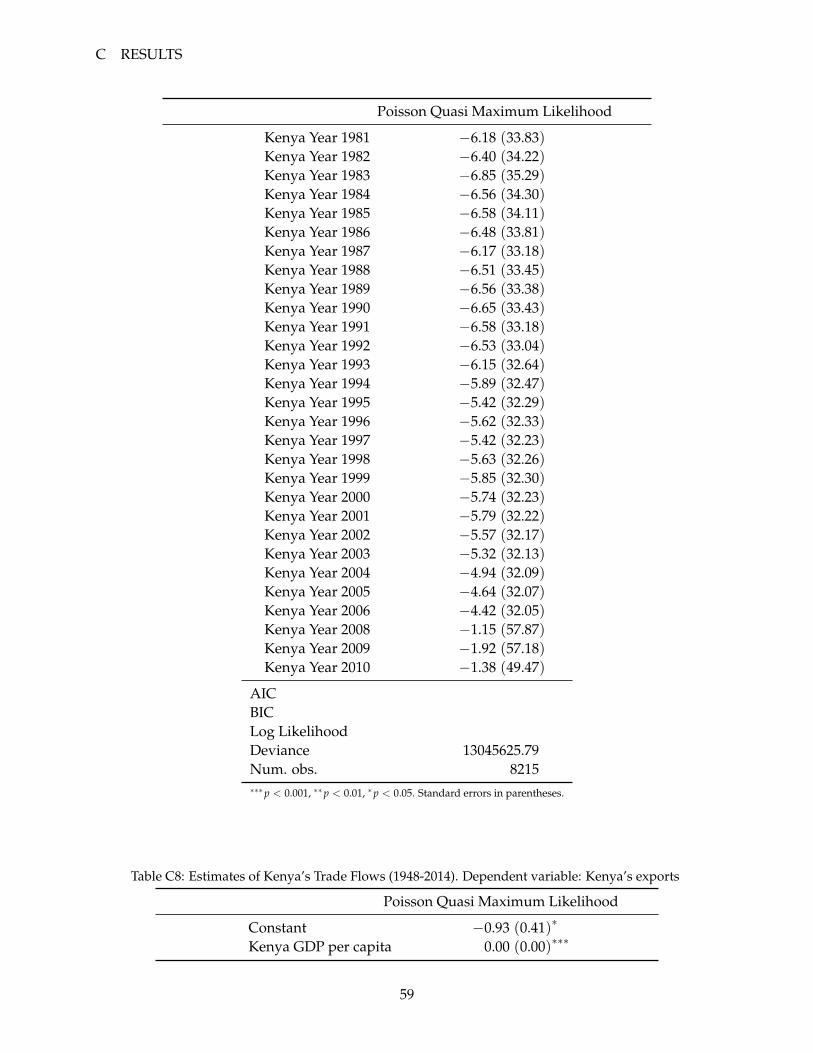
C RESULTS
Poisson Quasi Maximum Likelihood
Kenya Year 1981 −6.18 (33.83)Kenya Year 1982 −6.40 (34.22)Kenya Year 1983 −6.85 (35.29)Kenya Year 1984 −6.56 (34.30)Kenya Year 1985 −6.58 (34.11)Kenya Year 1986 −6.48 (33.81)Kenya Year 1987 −6.17 (33.18)Kenya Year 1988 −6.51 (33.45)Kenya Year 1989 −6.56 (33.38)Kenya Year 1990 −6.65 (33.43)Kenya Year 1991 −6.58 (33.18)Kenya Year 1992 −6.53 (33.04)Kenya Year 1993 −6.15 (32.64)Kenya Year 1994 −5.89 (32.47)Kenya Year 1995 −5.42 (32.29)Kenya Year 1996 −5.62 (32.33)Kenya Year 1997 −5.42 (32.23)Kenya Year 1998 −5.63 (32.26)Kenya Year 1999 −5.85 (32.30)Kenya Year 2000 −5.74 (32.23)Kenya Year 2001 −5.79 (32.22)Kenya Year 2002 −5.57 (32.17)Kenya Year 2003 −5.32 (32.13)Kenya Year 2004 −4.94 (32.09)Kenya Year 2005 −4.64 (32.07)Kenya Year 2006 −4.42 (32.05)Kenya Year 2008 −1.15 (57.87)Kenya Year 2009 −1.92 (57.18)Kenya Year 2010 −1.38 (49.47)
AICBICLog LikelihoodDeviance 13045625.79Num. obs. 8215∗∗∗p < 0.001, ∗∗p < 0.01, ∗p < 0.05. Standard errors in parentheses.
Table C8: Estimates of Kenya’s Trade Flows (1948-2014). Dependent variable: Kenya’s exports
Poisson Quasi Maximum Likelihood
Constant −0.93 (0.41)∗
Kenya GDP per capita 0.00 (0.00)∗∗∗
59
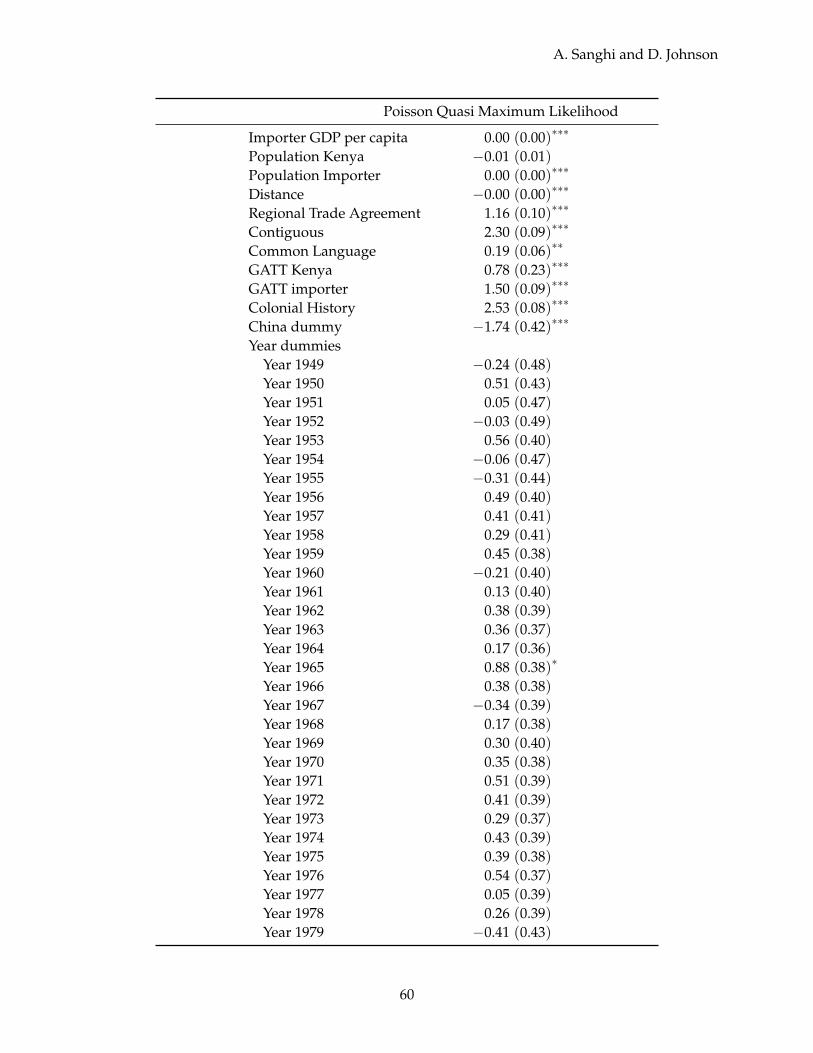
A. Sanghi and D. Johnson
Poisson Quasi Maximum Likelihood
Importer GDP per capita 0.00 (0.00)∗∗∗
Population Kenya −0.01 (0.01)Population Importer 0.00 (0.00)∗∗∗
Distance −0.00 (0.00)∗∗∗
Regional Trade Agreement 1.16 (0.10)∗∗∗
Contiguous 2.30 (0.09)∗∗∗
Common Language 0.19 (0.06)∗∗
GATT Kenya 0.78 (0.23)∗∗∗
GATT importer 1.50 (0.09)∗∗∗
Colonial History 2.53 (0.08)∗∗∗
China dummy −1.74 (0.42)∗∗∗
Year dummiesYear 1949 −0.24 (0.48)Year 1950 0.51 (0.43)Year 1951 0.05 (0.47)Year 1952 −0.03 (0.49)Year 1953 0.56 (0.40)Year 1954 −0.06 (0.47)Year 1955 −0.31 (0.44)Year 1956 0.49 (0.40)Year 1957 0.41 (0.41)Year 1958 0.29 (0.41)Year 1959 0.45 (0.38)Year 1960 −0.21 (0.40)Year 1961 0.13 (0.40)Year 1962 0.38 (0.39)Year 1963 0.36 (0.37)Year 1964 0.17 (0.36)Year 1965 0.88 (0.38)∗
Year 1966 0.38 (0.38)Year 1967 −0.34 (0.39)Year 1968 0.17 (0.38)Year 1969 0.30 (0.40)Year 1970 0.35 (0.38)Year 1971 0.51 (0.39)Year 1972 0.41 (0.39)Year 1973 0.29 (0.37)Year 1974 0.43 (0.39)Year 1975 0.39 (0.38)Year 1976 0.54 (0.37)Year 1977 0.05 (0.39)Year 1978 0.26 (0.39)Year 1979 −0.41 (0.43)
60
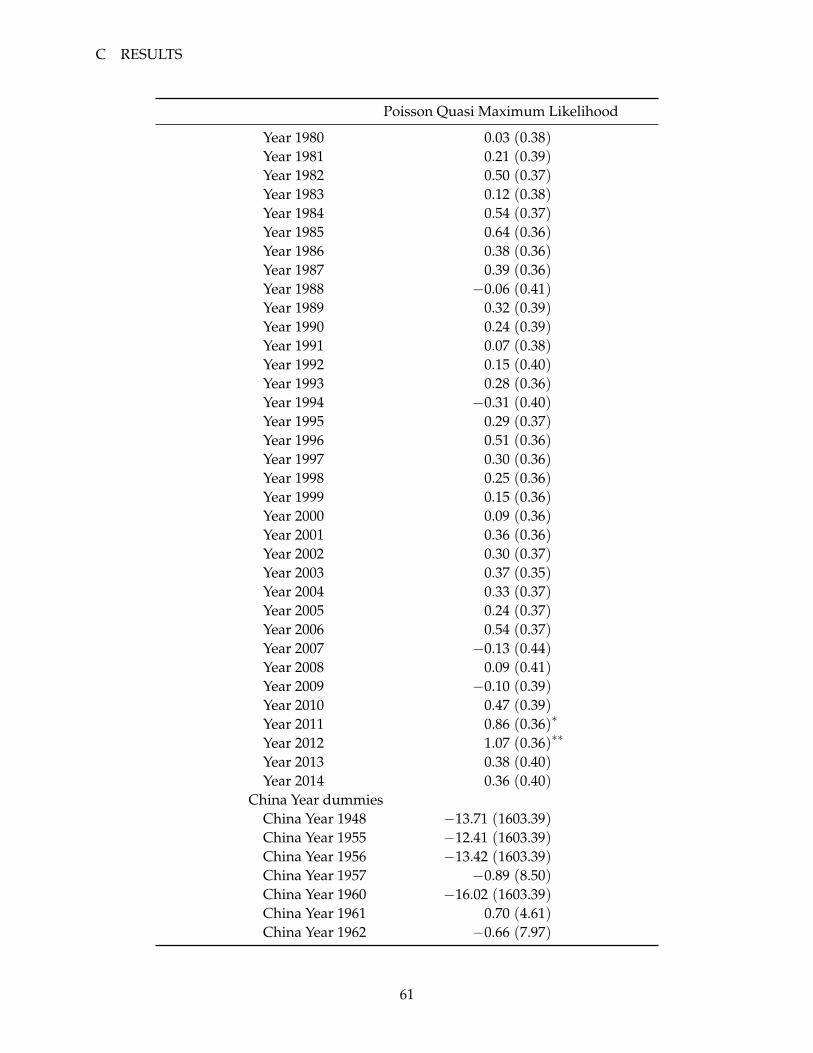
C RESULTS
Poisson Quasi Maximum Likelihood
Year 1980 0.03 (0.38)Year 1981 0.21 (0.39)Year 1982 0.50 (0.37)Year 1983 0.12 (0.38)Year 1984 0.54 (0.37)Year 1985 0.64 (0.36)Year 1986 0.38 (0.36)Year 1987 0.39 (0.36)Year 1988 −0.06 (0.41)Year 1989 0.32 (0.39)Year 1990 0.24 (0.39)Year 1991 0.07 (0.38)Year 1992 0.15 (0.40)Year 1993 0.28 (0.36)Year 1994 −0.31 (0.40)Year 1995 0.29 (0.37)Year 1996 0.51 (0.36)Year 1997 0.30 (0.36)Year 1998 0.25 (0.36)Year 1999 0.15 (0.36)Year 2000 0.09 (0.36)Year 2001 0.36 (0.36)Year 2002 0.30 (0.37)Year 2003 0.37 (0.35)Year 2004 0.33 (0.37)Year 2005 0.24 (0.37)Year 2006 0.54 (0.37)Year 2007 −0.13 (0.44)Year 2008 0.09 (0.41)Year 2009 −0.10 (0.39)Year 2010 0.47 (0.39)Year 2011 0.86 (0.36)∗
Year 2012 1.07 (0.36)∗∗
Year 2013 0.38 (0.40)Year 2014 0.36 (0.40)
China Year dummiesChina Year 1948 −13.71 (1603.39)China Year 1955 −12.41 (1603.39)China Year 1956 −13.42 (1603.39)China Year 1957 −0.89 (8.50)China Year 1960 −16.02 (1603.39)China Year 1961 0.70 (4.61)China Year 1962 −0.66 (7.97)
61
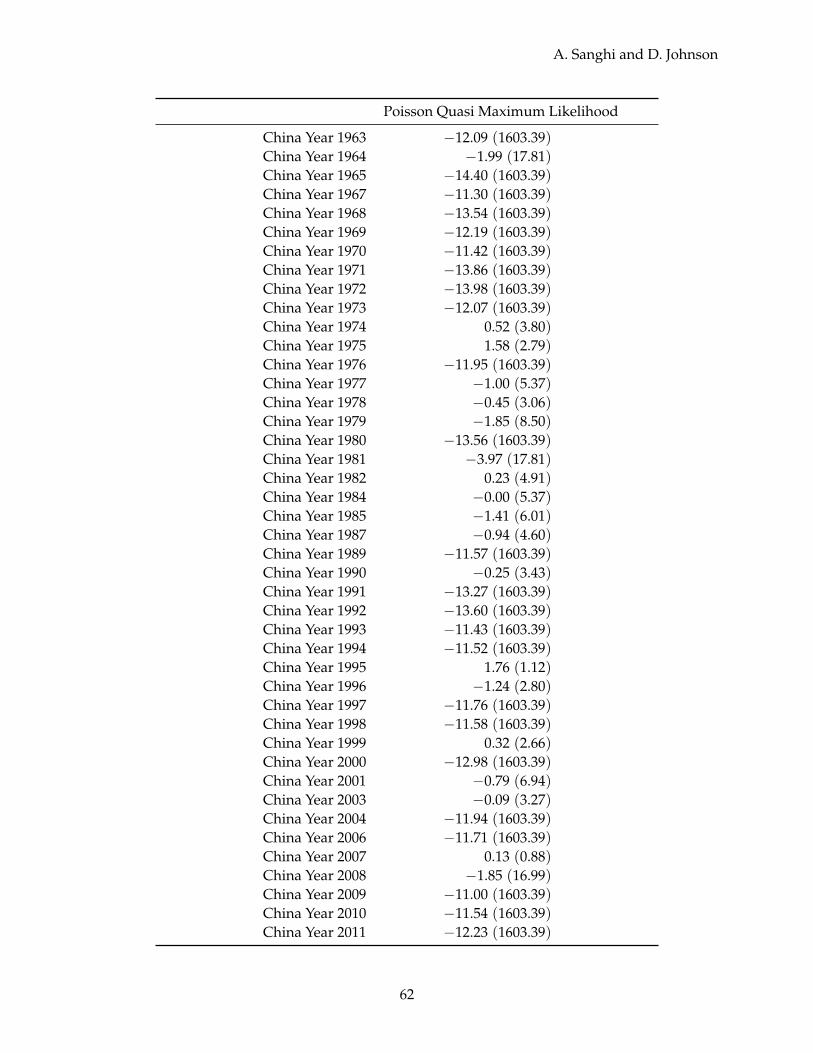
A. Sanghi and D. Johnson
Poisson Quasi Maximum Likelihood
China Year 1963 −12.09 (1603.39)China Year 1964 −1.99 (17.81)China Year 1965 −14.40 (1603.39)China Year 1967 −11.30 (1603.39)China Year 1968 −13.54 (1603.39)China Year 1969 −12.19 (1603.39)China Year 1970 −11.42 (1603.39)China Year 1971 −13.86 (1603.39)China Year 1972 −13.98 (1603.39)China Year 1973 −12.07 (1603.39)China Year 1974 0.52 (3.80)China Year 1975 1.58 (2.79)China Year 1976 −11.95 (1603.39)China Year 1977 −1.00 (5.37)China Year 1978 −0.45 (3.06)China Year 1979 −1.85 (8.50)China Year 1980 −13.56 (1603.39)China Year 1981 −3.97 (17.81)China Year 1982 0.23 (4.91)China Year 1984 −0.00 (5.37)China Year 1985 −1.41 (6.01)China Year 1987 −0.94 (4.60)China Year 1989 −11.57 (1603.39)China Year 1990 −0.25 (3.43)China Year 1991 −13.27 (1603.39)China Year 1992 −13.60 (1603.39)China Year 1993 −11.43 (1603.39)China Year 1994 −11.52 (1603.39)China Year 1995 1.76 (1.12)China Year 1996 −1.24 (2.80)China Year 1997 −11.76 (1603.39)China Year 1998 −11.58 (1603.39)China Year 1999 0.32 (2.66)China Year 2000 −12.98 (1603.39)China Year 2001 −0.79 (6.94)China Year 2003 −0.09 (3.27)China Year 2004 −11.94 (1603.39)China Year 2006 −11.71 (1603.39)China Year 2007 0.13 (0.88)China Year 2008 −1.85 (16.99)China Year 2009 −11.00 (1603.39)China Year 2010 −11.54 (1603.39)China Year 2011 −12.23 (1603.39)
62

C RESULTS
Poisson Quasi Maximum Likelihood
China Year 2012 −2.53 (17.81)China Year 2013 −2.22 (16.98)
AICBICLog LikelihoodDeviance 98819.06Num. obs. 6118∗∗∗p < 0.001, ∗∗p < 0.01, ∗p < 0.05. Standard errors in parentheses.
−20
−10
0
7 8 9
Distance (Log)
Trad
e/G
DP
(Lo
g)
Figure C36: Trade and Distance Kenya and Rest of the World (1948-2014)
Source: CEPII Gravity Database 2010 and UN Comtrade 2015
−15
−10
−5
0
6 7 8 9 10
Distance (Log)
Trad
e/G
DP
(Lo
g)
63
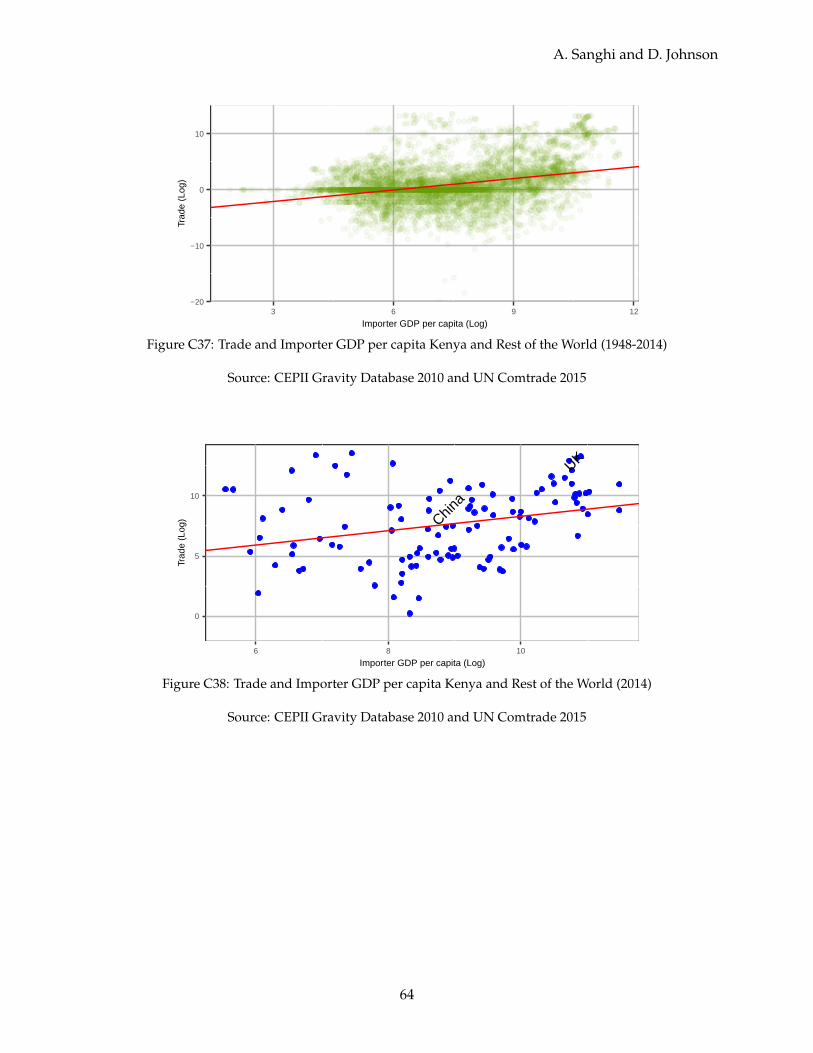
A. Sanghi and D. Johnson
−20
−10
0
10
3 6 9 12
Importer GDP per capita (Log)
Trad
e (L
og)
Figure C37: Trade and Importer GDP per capita Kenya and Rest of the World (1948-2014)
Source: CEPII Gravity Database 2010 and UN Comtrade 2015
China
UK
0
5
10
6 8 10
Importer GDP per capita (Log)
Trad
e (L
og)
Figure C38: Trade and Importer GDP per capita Kenya and Rest of the World (2014)
Source: CEPII Gravity Database 2010 and UN Comtrade 2015
64
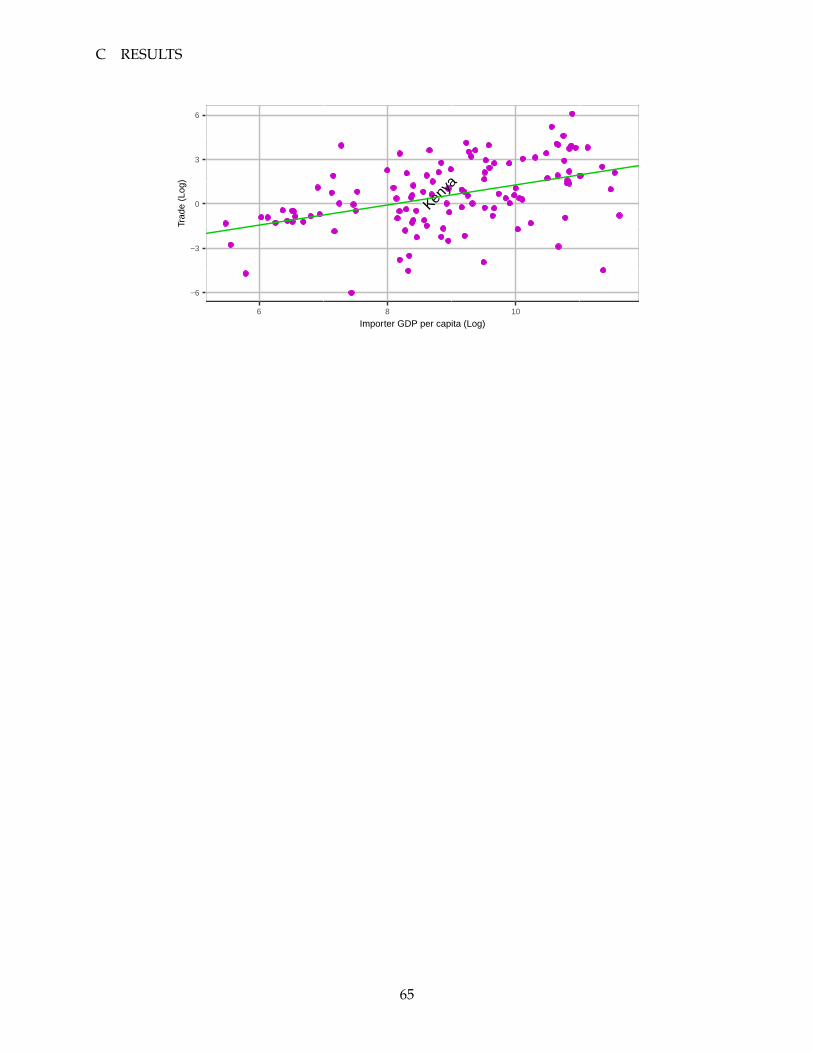
C RESULTS
Kenya
−6
−3
0
3
6
6 8 10
Importer GDP per capita (Log)
Trad
e (L
og)
65


