Deadwood Aquifer - USGS
33
42 Water-Quality Characteristics in the Black Hills Area, South Dakota Common Ions Summary statistics for selected common ions, including dissolved solids, calcium, magnesium, sodium, percent sodium, sodium-adsorption ratio (SAR), potassium, bicarbonate, carbonate, sulfate, chloride, fluoride, bromide, iodide, and silica, are presented in table 4. The significance of the various common ions is described in table 1. Boxplots are pre- sented in figure 16 for each of the common ions, except for carbonate. The water type for the various aquifers also is discussed in this section. Trilinear diagrams (fig. 17) are presented for each of the aquifers. Changes in water type as ground water flows down- gradient are discussed for the Madison, Minnelusa, and Inyan Kara aquifers. Specific conductance can be used to estimate the concentration of dissolved solids using the equations presented in table 5. Linear regression was performed using specific conductance and concentrations of dis- solved solids (sum of constituents or residue) for each aquifer having sufficient measurements of both to indicate the strength of the relation between specific conductance and dissolved solids concentration. The general suitability of water for irrigation from the aquifers in the study area can be determined by using the South Dakota irrigation-water diagram (fig. 18). The diagram is based on South Dakota irrigation-water standards (revised January 7, 1982) and shows the State’s water-quality and soil-texture requirements for the issuance of an irrigation permit. For each aquifer, the adjusted SAR, which is used to classify South Dakota irrigation waters, was calculated according to Koch (1983) from the mean concentra- tions of calcium, magnesium, sodium, and bicarbonate (or alkalinity from table 3) presented in table 4 for each aquifer. Based on mean concentrations, water from all aquifers, with the exceptions of the Pierre and Sundance aquifers, generally is suitable for irrigation, but may not be in specific instances if either the specific conductance or the SAR is high. A strong relation exists between specific con- ductance and dissolved sulfate concentrations for samples from the Madison, Minnelusa, and Inyan Kara aquifers (fig. 19). Linear regression was performed using specific conductance and sulfate concentrations for each of these aquifers. Sulfate concentrations for these aquifers can be estimated using the equations presented in figure 19. Precambrian Aquifers Generally, water from the Precambrian aquifers is fresh (less than 1,000 mg/L dissolved solids concen- tration). Calcium and bicarbonate generally are dominant among the common ions. Water from the Precambrian aquifers has the highest median chloride concentration, lowest mean and median concentrations of calcium, magnesium, and bicarbonate, and the lowest median sulfate (equal to the Deadwood aquifer) of the major aquifers. The water type of the Precambrian aquifers generally is a calcium bicarbonate or a calcium magne- sium bicarbonate type but also can be a mixed type (fig. 17). The original rock mineralogy, degree of metamorphism, and degree of weathering all can contribute to the variations in water type. Two of 56 samples from Precambrian aquifers exceed the SMCL of 500 mg/L for dissolved solids. Two of 112 samples exceed the SMCL of 250 mg/L for sulfate; both were collected from the same well. Three of 55 samples exceed the SMCL of 2.0 mg/L for fluoride; all three samples were collected from the same well. None of the samples exceeded the MCL of 4.0 mg/L for fluoride. Deadwood Aquifer Water from the Deadwood aquifer generally is fresh. Generally, calcium and bicarbonate are domi- nant among the common ions. Of samples collected from the major aquifers, the Deadwood aquifer has the lowest mean and median sulfate concentration (equal to the Precambrian aquifers). Variability in sulfate concentrations in the Deadwood aquifer is low. The Deadwood aquifer generally has a calcium magnesium bicarbonate water type (fig. 17) in wells located on or near the outcrop. This water type results from the dissolution of calcite and dolomite. The downgradient water type is not known because no samples were collected from wells located more than 5 miles from the outcrop of the Deadwood Formation. Samples collected from three wells located about 3 miles from the outcrop have either a sodium bicar- bonate or calcium sodium bicarbonate water type. Sodium may become the dominant cation in the Deadwood aquifer as the water flows downgradient. Relations between various common ions and well depth are shown in figure 20. Fluoride and sodium concentrations, percent sodium, and SAR generally increase with increasing well depth. Two of 33 samples equal or exceed the MCL for fluoride; both of these samples were collected from a well with a depth of 1,105 feet.
Transcript of Deadwood Aquifer - USGS

42 Water-Quality Characteristics in the Black Hills Area, South Dakota
Common Ions
Summary statistics for selected common ions, including dissolved solids, calcium, magnesium, sodium, percent sodium, sodium-adsorption ratio (SAR), potassium, bicarbonate, carbonate, sulfate, chloride, fluoride, bromide, iodide, and silica, are presented in table 4. The significance of the various common ions is described in table 1. Boxplots are pre-sented in figure 16 for each of the common ions, except for carbonate. The water type for the various aquifers also is discussed in this section. Trilinear diagrams (fig. 17) are presented for each of the aquifers. Changes in water type as ground water flows down-gradient are discussed for the Madison, Minnelusa, and Inyan Kara aquifers.
Specific conductance can be used to estimate the concentration of dissolved solids using the equations presented in table 5. Linear regression was performed using specific conductance and concentrations of dis-solved solids (sum of constituents or residue) for each aquifer having sufficient measurements of both to indicate the strength of the relation between specific conductance and dissolved solids concentration.
The general suitability of water for irrigation from the aquifers in the study area can be determined by using the South Dakota irrigation-water diagram (fig. 18). The diagram is based on South Dakota irrigation-water standards (revised January 7, 1982) and shows the State’s water-quality and soil-texture requirements for the issuance of an irrigation permit. For each aquifer, the adjusted SAR, which is used to classify South Dakota irrigation waters, was calculated according to Koch (1983) from the mean concentra-tions of calcium, magnesium, sodium, and bicarbonate (or alkalinity from table 3) presented in table 4 for each aquifer. Based on mean concentrations, water from all aquifers, with the exceptions of the Pierre and Sundance aquifers, generally is suitable for irrigation, but may not be in specific instances if either the specific conductance or the SAR is high.
A strong relation exists between specific con-ductance and dissolved sulfate concentrations for samples from the Madison, Minnelusa, and Inyan Kara aquifers (fig. 19). Linear regression was performed using specific conductance and sulfate concentrations for each of these aquifers. Sulfate concentrations for these aquifers can be estimated using the equations presented in figure 19.
Precambrian Aquifers
Generally, water from the Precambrian aquifers is fresh (less than 1,000 mg/L dissolved solids concen-tration). Calcium and bicarbonate generally are dominant among the common ions. Water from the Precambrian aquifers has the highest median chloride concentration, lowest mean and median concentrations of calcium, magnesium, and bicarbonate, and the lowest median sulfate (equal to the Deadwood aquifer) of the major aquifers.
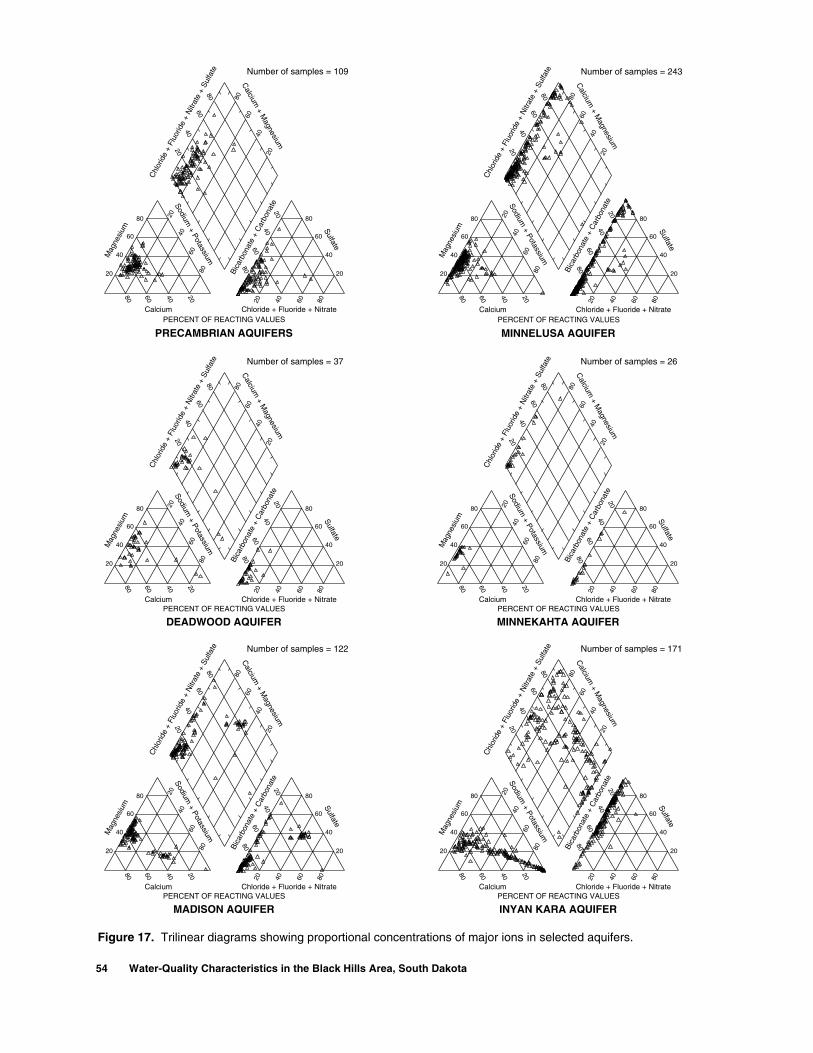
The water type of the Precambrian aquifers generally is a calcium bicarbonate or a calcium magne-sium bicarbonate type but also can be a mixed type (fig. 17). The original rock mineralogy, degree of metamorphism, and degree of weathering all can contribute to the variations in water type.
Two of 56 samples from Precambrian aquifers exceed the SMCL of 500 mg/L for dissolved solids. Two of 112 samples exceed the SMCL of 250 mg/L for sulfate; both were collected from the same well. Three of 55 samples exceed the SMCL of 2.0 mg/L for fluoride; all three samples were collected from the same well. None of the samples exceeded the MCL of 4.0 mg/L for fluoride.
Deadwood Aquifer
Water from the Deadwood aquifer generally is fresh. Generally, calcium and bicarbonate are domi-nant among the common ions. Of samples collected from the major aquifers, the Deadwood aquifer has the lowest mean and median sulfate concentration (equal to the Precambrian aquifers). Variability in sulfate concentrations in the Deadwood aquifer is low.
The Deadwood aquifer generally has a calcium magnesium bicarbonate water type (fig. 17) in wells located on or near the outcrop. This water type results from the dissolution of calcite and dolomite. The downgradient water type is not known because no samples were collected from wells located more than 5 miles from the outcrop of the Deadwood Formation. Samples collected from three wells located about 3 miles from the outcrop have either a sodium bicar-bonate or calcium sodium bicarbonate water type. Sodium may become the dominant cation in the Deadwood aquifer as the water flows downgradient.
Relations between various common ions and well depth are shown in figure 20. Fluoride and sodium concentrations, percent sodium, and SAR generally increase with increasing well depth. Two of 33 samples equal or exceed the MCL for fluoride; both of these samples were collected from a well with a depth of 1,105 feet.

Water-Quality Characteristics of Selected Aquifers 43
Table 4. Summary of concentrations of common ions in ground water
[Results based on data stored in U.S. Geological Survey National Water Information System water-quality database. Results in milligrams per liter except as indicated. One milligram per liter (mg/L) is approximately equal to one part per million; --, not analyzed or not determined; <, less than indicated detection limit]
Dissolved constituentNumber ofsamples
Number ofcensoredsamples
Mean Median Minimum Maximum
Precambrian aquifers
Solids, residue at 180°C 58 0 293 249 60 1,970
Solids, sum of constituents 56 0 230 221 54 642
Calcium 112 0 44 44 6.0 108
Magnesium 112 0 15 14 1.7 52
Sodium 108 0 10 8.1 1.5 70
Sodium, percent 57 0 13 10 6.0 41
Sodium-adsorption ratio 108 0 0.3 0.3 0 2.0
Potassium 58 0 4.0 3.8 1.0 16
Bicarbonate 22 0 165 168 21 268
Carbonate 0 0 -- -- -- --
Sulfate 112 9 35 21 <5.0 345
Chloride 109 41 11 5.6 0.5 161
Fluoride 55 3 0.5 0.3 0.1 2.5
Bromide 0 0 -- -- -- --
Iodide 0 0 -- -- -- --
Silica 64 0 10 8.6 3.5 27Deadwood aquifer
Solids, residue at 180°C 31 0 254 248 65 528
Solids, sum of constituents 32 0 262 248 48 469
Calcium 37 0 46 50 8.6 70
Magnesium 37 0 23 20 2.5 78
Sodium 37 0 17 5.9 1.2 160
Sodium, percent 32 0 14 7.0 1.0 85
Sodium-adsorption ratio 37 0 0.7 0.2 0 9.0
Potassium 32 0 2.8 2.2 0.1 10
Bicarbonate 3 0 249 260 220 268
Carbonate 2 0 0 0 0 0
Sulfate 37 2 27 21 3.4 88
Chloride 37 4 5.2 2.0 0.5 40
Fluoride 33 1 0.7 0.3 <0.1 5.4
Bromide 1 0 -- -- 0.3 0.3
Iodide 0 0 -- -- -- --
Silica 33 0 11 10 3.3 18Madison aquifer
Solids, residue at 180°C 80 0 490 260 162 2,300
Solids, sum of constituents 99 0 428 260 161 1,820
Calcium 127 0 70 54 5.6 430
Magnesium 127 0 26 25 2.0 120
Sodium 122 0 39 5.4 0.8 260
Sodium, percent 103 0 14 6.0 1.0 57
Sodium-adsorption ratio 122 0 1.0 0.2 0 18
Potassium 103 0 6.0 2.8 0.7 55
Bicarbonate 41 0 250 222 166 454
Carbonate 24 0 0.3 0 0 6.0

44 Water-Quality Characteristics in the Black Hills Area, South Dakota
Madison aquifer—Continued
Sulfate 127 10 96 23 <1.0 453
Chloride 124 15 55 3.5 0.2 1,000
Fluoride 89 0 0.7 0.4 0.1 18
Bromide 4 0 0.18 0.10 0.1 0.4
Iodide 2 0 0.03 0.03 0.01 0.04
Silica 62 0 11 11 3.4 34Minnelusa aquifer
Solids, residue at 180°C 190 0 619 296 128 5,055
Solids, sum of constituents 176 0 512 271 120 2,700
Calcium 250 0 127 68 2.2 695
Magnesium 248 0 32 23 0.6 194
Sodium 245 0 18 3.8 0.05 731
Sodium, percent 196 0 4.4 2.0 0 37
Sodium-adsorption ratio 243 0 0.3 0.1 0 21
Potassium 197 0 3.0 2.0 0.7 19
Bicarbonate 86 0 252 249 149 370
Carbonate 15 0 -- 0 0 10
Sulfate 249 15 257 32 <2.0 3,438
Chloride 236 38 12 2.0 <0.1 230
Fluoride 185 8 0.5 0.3 0.01 2.8
Bromide 5 0 0.3 0.1 0.1 0.8
Iodide 3 0 0.01 0.01 0.01 0.01
Silica 104 0 9.8 11 2.2 33Minnekahta aquifer
Solids, residue at 180°C 24 0 509 346 228 2,255
Solids, sum of constituents 24 0 410 330 233 1,920
Calcium 28 0 109 80 45 425
Magnesium 28 0 30 26 12 105
Sodium 26 0 7.9 4.0 1.1 100
Sodium, percent 25 0 3.2 2.0 1.0 15
Sodium-adsorption ratio 26 0 0.1 0.1 0 1.0
Potassium 25 0 2.4 1.9 1.1 12
Bicarbonate 21 0 321 316 230 412
Carbonate 2 0 0 0 0 0
Sulfate 28 1 139 32 <1.0 1,385
Chloride 28 2 7.5 3.0 0.5 119
Fluoride 25 4 0.3 0.2 <0.1 1.0
Bromide 0 0 -- -- -- --
Iodide 0 0 -- -- -- --
Silica 7 0 12 12 4.8 24Inyan Kara aquifer
Solids, residue at 180°C 111 0 760 682 174 3,170
Solids, sum of constituents 102 0 742 673 170 3,300
Calcium 177 0 95 71 1.6 505
Table 4. Summary of concentrations of common ions in ground water—Continued
[Results based on data stored in U.S. Geological Survey National Water Information System water-quality database. Results in milligrams per liter except as indicated. One milligram per liter (mg/L) is approximately equal to one part per million; --, not analyzed or not determined; <, less than indicated detection limit]
Dissolved constituentNumber ofsamples
Number ofcensoredsamples
Mean Median Minimum Maximum

Water-Quality Characteristics of Selected Aquifers 45
Inyan Kara aquifer—Continued
Magnesium 174 1 34 24 <1.0 279
Sodium 171 0 145 127 1.0 1,000
Sodium, percent 103 0 45 37 1.0 99
Sodium-adsorption ratio 169 0 8.9 2.0 0 79
Potassium 105 0 6.4 6.2 0.1 19
Bicarbonate 31 0 254 258 167 438
Carbonate 0 0 -- -- -- --
Sulfate 177 0 462 330 5.0 2,030
Chloride 176 42 11 5.0 0.1 140
Fluoride 105 1 0.6 0.5 0.1 4.0
Bromide 9 0 0.2 0.1 0.1 0.7
Iodide 10 0 0.04 0.01 0.01 0.26
Silica 112 1 6.1 4.6 <0.1 17Spearfish aquifer
Solids, residue at 180°C 3 0 294 286 274 322
Solids, sum of constituents 3 0 257 259 247 266
Calcium 13 0 223 116 36 661
Magnesium 13 0 42 23 10 109
Sodium 13 0 63 5.0 2.0 608
Sodium, percent 4 0 3.3 2.0 2.0 7.0
Sodium-adsorption ratio 13 0 0.9 0.2 0.1 8.0
Potassium 4 0 3.9 2.1 1.5 10
Bicarbonate 2 0 224 224 221 227
Carbonate 0 0 -- -- -- --
Sulfate 13 0 635 98 10 2,338
Chloride 13 7 11 4.4 1.5 50
Fluoride 4 0 0.6 0.3 0.2 1.6
Bromide 0 0 -- -- -- --
Iodide 0 0 -- -- -- --
Silica 9 0 5.5 4.8 3.5 9.4Sundance aquifer
Solids, residue at 180°C 12 0 1,264 1,440 414 1,930
Solids, sum of constituents 12 0 1,202 1,365 399 1,820
Calcium 14 0 155 150 56 352
Magnesium 14 0 86 89 10 220
Sodium 14 0 144 118 6.7 512
Sodium, percent 12 0 29 24 3.0 84
Sodium-adsorption ratio 14 0 3.3 2.0 0.2 16
Potassium 12 0 8.2 6.9 3.9 14
Bicarbonate 2 0 305 305 283 326
Carbonate 0 0 -- -- -- --
Sulfate 14 0 780 1,000 99 1,724
Chloride 14 0 13 8.2 1.1 65
Fluoride 12 0 2.5 0.5 0.1 25
Table 4. Summary of concentrations of common ions in ground water—Continued
[Results based on data stored in U.S. Geological Survey National Water Information System water-quality database. Results in milligrams per liter except as indicated. One milligram per liter (mg/L) is approximately equal to one part per million; --, not analyzed or not determined; <, less than indicated detection limit]
Dissolved constituentNumber ofsamples
Number ofcensoredsamples
Mean Median Minimum Maximum

46 Water-Quality Characteristics in the Black Hills Area, South Dakota
Sundance aquifer—Continued
Bromide 2 0 0.15 0.15 0.1 0.2
Iodide 2 0 0.03 0.03 0.01 0.05
Silica 13 0 10 9.7 2.2 26Morrison aquifer
Solids, residue at 180°C 8 0 460 383 256 751
Solids, sum of constituents 7 0 443 340 234 793
Calcium 15 0 146 74 2.5 519
Magnesium 15 0 52 23 1.1 268
Sodium 13 0 77 30 2.7 357
Sodium, percent 8 0 22 15 5.0 81
Sodium-adsorption ratio 13 0 2.8 0.8 0 19
Potassium 8 0 6.4 6.7 2.9 9.0
Bicarbonate 1 0 -- -- 208 208
Carbonate 0 0 -- -- -- --
Sulfate 15 0 489 208 46 2,056
Chloride 15 5 7.8 3.0 0.4 56
Fluoride 9 0 0.5 0.5 0.2 0.9
Bromide 0 0 -- -- -- --
Iodide 0 0 -- -- -- --
Silica 11 0 8.9 5.3 3.8 17Pierre aquifer
Solids, residue at 180°C 0 0 -- -- -- --
Solids, sum of constituents 0 0 -- -- -- --
Calcium 28 0 164 144 41 365
Magnesium 28 0 88 49 10 508
Sodium 28 0 227 176 8.7 757
Sodium, percent 0 0 -- -- -- --
Sodium-adsorption ratio 28 0 3.6 3.0 0.3 11
Potassium 0 0 -- -- -- --
Bicarbonate 0 0 -- -- -- --
Carbonate 0 0 -- -- -- --
Sulfate 28 0 964 659 15 4,126
Chloride 28 7 52 26 <10 222
Fluoride 0 0 -- -- -- --
Bromide 0 0 -- -- -- --
Iodide 0 0 -- -- -- --
Silica 28 0 6.9 6.3 2.0 13Graneros aquifer
Solids, residue at 180°C 0 0 --- -- -- --
Solids, sum of constituents 0 0 -- -- -- --
Calcium 10 0 168 133 25 459
Magnesium 10 0 54 51 12 122
Sodium 10 0 91 66 3.6 289
Sodium, percent 0 0 -- -- -- --
Table 4. Summary of concentrations of common ions in ground water—Continued
[Results based on data stored in U.S. Geological Survey National Water Information System water-quality database. Results in milligrams per liter except as indicated. One milligram per liter (mg/L) is approximately equal to one part per million; --, not analyzed or not determined; <, less than indicated detection limit]
Dissolved constituentNumber ofsamples
Number ofcensoredsamples
Mean Median Minimum Maximum

Water-Quality Characteristics of Selected Aquifers 47
Graneros aquifer—Continued
Sodium-adsorption ratio 10 0 1.6 1.5 0 4.0
Potassium 0 0 -- -- -- --
Bicarbonate 0 0 -- -- -- --
Carbonate 0 0 -- -- -- --
Sulfate 10 0 539 286 87 1,598
Chloride 10 7 41 39 <10 57
Fluoride 0 0
Bromide 0 0 -- -- -- --
Iodide 0 0 -- -- -- --
Silica 10 0 4.7 4.7 3.7 6.4Newcastle aquifer
Solids, residue at 180°C 8 0 460 400 279 1,010
Solids, sum of constituents 8 0 415 355 277 862
Calcium 8 0 80 76 10 170
Magnesium 8 0 18 18 1.9 32
Sodium 8 0 35 13 8.0 164
Sodium, percent 8 0 20 11 6.0 90
Sodium-adsorption ratio 8 0 1.9 0.4 0.2 12
Potassium 8 0 8.0 7.1 4.1 17
Bicarbonate 0 0 -- -- -- --
Carbonate 0 0 -- -- -- --
Sulfate 8 0 128 103 23 410
Chloride 8 0 3.4 2.6 1.1 8.7
Fluoride 8 0 0.6 0.6 0.3 1.4
Bromide 0 0 -- -- -- --
Iodide 0 0 -- -- -- --
Silica 5 0 8.4 8.6 6.9 10Alluvial aquifers
Solids, residue at 180°C 78 0 559 329 127 2,380
Solids, sum of constituents 81 0 503 323 100 2,280
Calcium 116 0 121 77 13 536
Magnesium 116 0 39 25 3.2 274
Sodium 115 0 62 10 2.0 778
Sodium, percent 85 0 13 6.0 1.0 87
Sodium-adsorption ratio 115 0 1.1 0.3 0 12
Potassium 85 0 5.0 4.0 0.9 42
Bicarbonate 21 0 266 244 158 458
Carbonate 3 0 0 0 0 0
Sulfate 116 0 360 99 2.9 3,000
Chloride 114 15 19 6.1 1.0 194
Fluoride 73 1 0.4 0.3 0.1 1.5
Bromide 3 0 0.09 0.08 0.06 0.13
Iodide 0 0 -- -- -- --
Silica 51 0 7.7 7.1 0.7 25
Table 4. Summary of concentrations of common ions in ground water—Continued
[Results based on data stored in U.S. Geological Survey National Water Information System water-quality database. Results in milligrams per liter except as indicated. One milligram per liter (mg/L) is approximately equal to one part per million; --, not analyzed or not determined; <, less than indicated detection limit]
Dissolved constituentNumber ofsamples
Number ofcensoredsamples
Mean Median Minimum Maximum

48 Water-Quality Characteristics in the Black Hills Area, South Dakota
Figure 16. Boxplots of concentrations of selected common ions for selected aquifers.
AQUIFER
PrecambrianDeadwood
MadisonMinnelusa
MinnekahtaInyan Kara
SpearfishSundance
MorrisonPierre
Graneros AlluvialNewcastle
0
800
200
400
600
DIS
SO
LVE
D C
ALC
IUM
,IN
MIL
LIG
RA
MS
PE
R L
ITE
R
112/0 37/0 127/0 250/0 28/0 177/0 13/0 14/0 15/0 28/0 10/0 8/0 116/0
0
3,600
1,000
2,000
3,000
DIS
SO
LVE
D S
OLI
DS
, SU
M O
F C
ON
ST
ITU
EN
TS
,IN
MIL
LIG
RA
MS
PE
R L
ITE
R
56/0 32/0 99/0 176/0 24/0 102/0 3/0 12/0 7/0 0/0 0/0 8/0 81/0
0
2,000
1,000
4,000
3,000
5,000
6,000D
ISS
OLV
ED
SO
LID
S, R
ES
IDU
E A
T 1
80 D
EG
RE
ES
CE
LSIU
S, I
N M
ILLI
GR
AM
S P
ER
LIT
ER
58/0 31/0 80/0 190/0 24/0 111/0 3/0 8/012/0 0/0 0/0 8/0 78/0
Major aquifers Minor aquifers

Water-Quality Characteristics of Selected Aquifers 49
Figure 16. Boxplots of concentrations of selected common ions for selected aquifers.--Continued
AQUIFER
PrecambrianDeadwood
MadisonMinnelusa
MinnekahtaInyan Kara
SpearfishSundance
MorrisonPierre
Graneros AlluvialNewcastle
0
120
20
40
60
80
100
PE
RC
EN
T S
OD
IUM
57/0 32/0 103/0 196/0 25/0 103/0 4/0 12/0 8/0 0/0 0/0 8/0 85/0
0
600
100
200
300
400
500D
ISS
OLV
ED
MA
GN
ES
IUM
,IN
MIL
LIG
RA
MS
PE
R L
ITE
R
112/0 37/0 127/0 248/0 28/0 174/1 13/0 14/0 15/0 28/0 10/0 8/0 116/0
0
1,200
200
400
600
800
1,000
DIS
SO
LVE
D S
OD
IUM
,IN
MIL
LIG
RA
MS
PE
R L
ITE
R
108/0 37/0 122/0 245/0 26/0 171/0 13/0 14/0 13/0 28/0 10/0 8/0 115/0
Major aquifers Minor aquifers

50 Water-Quality Characteristics in the Black Hills Area, South Dakota
Figure 16. Boxplots of concentrations of selected common ions for selected aquifers.--Continued
AQUIFER
PrecambrianDeadwood
MadisonMinnelusa
MinnekahtaInyan Kara
SpearfishSundance
MorrisonPierre
Graneros AlluvialNewcastle
0
500
100
200
300
400
DIS
SO
LVE
D B
ICA
RB
ON
AT
E,
IN M
ILLI
GR
AM
S P
ER
LIT
ER
22/0 3/0 41/0 86/0 21/0 31/0 2/0 2/0 1/0 0/0 0/0 0/0 21/0
0
100
20
40
60
80
SO
DIU
M-A
DS
OR
PT
ION
RA
TIO
108/0 37/0 122/0 243/0 26/0 169/0 13/0 14/0 13/0 28/0 10/0 8/0 115/0
0
60
10
20
30
40
50
DIS
SO
LVE
D P
OT
AS
SIU
M,
IN M
ILLI
GR
AM
S P
ER
LIT
ER
58/0 32/0 103/0 197/0 25/0 105/0 4/0 12/0 8/0 0/0 0/0 8/0 85/0
Major aquifers Minor aquifers

Water-Quality Characteristics of Selected Aquifers 51
Figure 16. Boxplots of concentrations of selected common ions for selected aquifers.--Continued
AQUIFER
PrecambrianDeadwood
MadisonMinnelusa
MinnekahtaInyan Kara
SpearfishSundance
MorrisonPierre
Graneros AlluvialNewcastle
0
30
5
10
15
20
25
DIS
SO
LVE
D F
LUO
RID
E,
IN M
ILLI
GR
AM
S P
ER
LIT
ER
55/3 33/1 89/0 185/8 25/4 105/1 4/0 12/0 9/0 0/0 0/0 8/0 73/1
0
5,000
1,000
2,000
3,000
4,000D
ISS
OLV
ED
SU
LFA
TE
,IN
MIL
LIG
RA
MS
PE
R L
ITE
R
112/0 37/2 127/10 249/15 28/1 177/0 13/0 14/0 15/0 28/0 10/0 8/0 116/0
0
400
100
200
300
DIS
SO
LVE
D C
HLO
RID
E,
IN M
ILLI
GR
AM
S P
ER
LIT
ER
109/41 37/4 124/15 236/38 28/2 176/42 13/7 14/0 15/5 28/7 10/7 8/0 114/151,100
1,000
Major aquifers Minor aquifers

52 Water-Quality Characteristics in the Black Hills Area, South Dakota
Figure 16. Boxplots of concentrations of selected common ions for selected aquifers.--Continued
AQUIFER
PrecambrianDeadwood
MadisonMinnelusa
MinnekahtaInyan Kara
SpearfishSundance
MorrisonPierre
Graneros AlluvialNewcastle
0
40
10
20
30
DIS
SO
LVE
D S
ILIC
A,
IN M
ILLI
GR
AM
S P
ER
LIT
ER
64/0 33/0 62/0 104/0 7/0 112/1 9/0 13/0 11/0 28/0 10/0 5/0 51/0
0
1.0
0.2
0.4
0.6
0.8
DIS
SO
LVE
D B
RO
MID
E,
IN M
ILLI
GR
AM
S P
ER
LIT
ER
0/0 1/0 4/0 5/0 0/0 9/0 0/0 2/0 0/0 0/0 0/0 3/00/0
0
0.4
0.1
0.2
0.3
DIS
SO
LVE
D IO
DID
E,
IN M
ILLI
GR
AM
S P
ER
LIT
ER
0/0 0/0 2/0 3/0 0/00/0 10/0 0/0 2/0 0/0 0/0 0/0 0/0
Major aquifers Minor aquifers

Water-Quality Characteristics of Selected Aquifers 53
Figure 16. Boxplots of concentrations of selected common ions for selected aquifers.--Continued
EXPLANATION
Single sample
Number of samples/Number of samples with concentrations below the laboratory reporting limit
114/15
Secondary Maximum Contaminant Level (recommended) (U.S. Environmental Protection Agency, 1994a)
Highest detection limitMaximum Contaminant Level (mandatory (U.S. Environmental Protection Agency, 1994a)
25th percentile
Median
75th percentile
Data value less than or equal to 1.5 times theinterquartile range outside the quartile
Outlier data value less than or equal to 3and more than 1.5 times theinterquartile range outside the quartile
Outlier data value more than 3 times theinterquartile range outside the quartile
54 Water-Quality Characteristics in the Black Hills Area, South Dakota
Figure 17. Trilinear diagrams showing proportional concentrations of major ions in selected aquifers.
Calcium
+ Magnesium
Sulfate
Sodium + Potassium
Chl
orid
e +
Fluo
ride
+ N
itrat
e +
Sul
fate
Bic
arbo
nate
+ C
arbo
nate
Mag
nesi
um
Calcium Chloride + Fluoride + NitratePERCENT OF REACTING VALUES PERCENT OF REACTING VALUES
PERCENT OF REACTING VALUES PERCENT OF REACTING VALUES
PERCENT OF REACTING VALUES PERCENT OF REACTING VALUES
80
60
40
20
80
8060
4020
20
20 40 60 80
4060
80
60
40
20
20
20406080
40
60
80
80
60
40
20
PRECAMBRIAN AQUIFERS
Calcium
+ Magnesium
Sulfate
Sodium + Potassium
Chl
orid
e +
Fluo
ride
+ N
itrat
e +
Sul
fate
Bic
arbo
nate
+ C
arbo
nate
Mag
nesi
um
Calcium Chloride + Fluoride + Nitrate
80
60
40
20
80
8060
4020
20
20 40 60 80
4060
80
60
40
20
20
20406080
40
60
80
80
60
40
20
DEADWOOD AQUIFER
Calcium
+ Magnesium
Sulfate
Sodium + Potassium
Chl
orid
e +
Fluo
ride
+ N
itrat
e +
Sul
fate
Bic
arbo
nate
+ C
arbo
nate
Mag
nesi
um
Calcium Chloride + Fluoride + Nitrate
80
60
40
20
80
8060
4020
20
20 40 60 80
4060
80
60
40
20
20
20406080
40
60
80
80
60
40
20
MINNELUSA AQUIFER
Calcium
+ Magnesium
Sulfate
Sodium + Potassium
Chl
orid
e +
Fluo
ride
+ N
itrat
e +
Sul
fate
Bic
arbo
nate
+ C
arbo
nate
Mag
nesi
um
Calcium Chloride + Fluoride + Nitrate
80
60
40
20
80
8060
4020
20
20 40 60 80
4060
80
60
40
20
20
20406080
40
60
80
80
60
40
20
MINNEKAHTA AQUIFER
Calcium
+ Magnesium
Sulfate
Sodium + Potassium
Chl
orid
e +
Fluo
ride
+ N
itrat
e +
Sul
fate
Bic
arbo
nate
+ C
arbo
nate
Mag
nesi
um
Calcium Chloride + Fluoride + Nitrate
80
60
40
20
80
8060
4020
20
20 40 60 80
4060
80
60
40
20
20
20406080
40
60
80
80
60
40
20
INYAN KARA AQUIFER
Calcium
+ Magnesium
Sulfate
Sodium + Potassium
Chl
orid
e +
Fluo
ride
+ N
itrat
e +
Sul
fate
Bic
arbo
nate
+ C
arbo
nate
Mag
nesi
um
Calcium Chloride + Fluoride + Nitrate
80
60
40
20
80
8060
4020
20
20 40 60 80
4060
80
60
40
20
20
20406080
40
60
80
80
60
40
20
MADISON AQUIFER
Number of samples = 109 Number of samples = 243
Number of samples = 37 Number of samples = 26
Number of samples = 122 Number of samples = 171

Water-Quality Characteristics of Selected Aquifers 55
Figure 17. Trilinear diagrams showing proportional concentrations of major ions in selected aquifers.--Continued
Calcium
+ Magnesium
Sulfate
Sodium + Potassium
Chl
orid
e +
Fluo
ride
+ N
itrat
e +
Sul
fate
Bic
arbo
nate
+ C
arbo
nate
Mag
nesi
um
Calcium Chloride + Fluoride + Nitrate
80
60
40
20
80
8060
4020
20
20 40 60 80
4060
80
60
40
20
20
20406080
40
60
80
80
60
40
20
SPEARFISH AQUIFER
Calcium
+ Magnesium
Sulfate
Sodium + Potassium
Chl
orid
e +
Fluo
ride
+ N
itrat
e +
Sul
fate
Bic
arbo
nate
+ C
arbo
nate
Mag
nesi
um
Calcium Chloride + Fluoride + Nitrate
80
60
40
20
80
8060
4020
20
20 40 60 80
4060
80
60
40
20
20
20406080
40
60
80
80
60
40
20
SUNDANCE AQUIFER
Calcium
+ Magnesium
Sulfate
Sodium + Potassium
Chl
orid
e +
Fluo
ride
+ N
itrat
e +
Sul
fate
Bic
arbo
nate
+ C
arbo
nate
Mag
nesi
um
Calcium Chloride + Fluoride + Nitrate
80
60
40
20
80
8060
4020
20
20 40 60 80
4060
80
60
40
20
20
20406080
40
60
80
80
60
40
20
PIERRE AQUIFER
Calcium
+ Magnesium
Sulfate
Sodium + Potassium
Chl
orid
e +
Fluo
ride
+ N
itrat
e +
Sul
fate
Bic
arbo
nate
+ C
arbo
nate
Mag
nesi
um
Calcium Chloride + Fluoride + Nitrate
80
60
40
20
80
8060
4020
20
20 40 60 80
4060
80
60
40
20
20
20406080
40
60
80
80
60
40
20
GRANEROS AQUIFER
Calcium
+ Magnesium
Sulfate
Sodium + Potassium
Chl
orid
e +
Fluo
ride
+ N
itrat
e +
Sul
fate
Bic
arbo
nate
+ C
arbo
nate
Mag
nesi
um
Calcium Chloride + Fluoride + Nitrate
80
60
40
20
80
8060
4020
20
20 40 60 80
4060
80
60
40
20
20
20406080
40
60
80
80
60
40
20
NEWCASTLE AQUIFER
Calcium
+ Magnesium
Sulfate
Sodium + Potassium
Chl
orid
e +
Fluo
ride
+ N
itrat
e +
Sul
fate
Bic
arbo
nate
+ C
arbo
nate
Mag
nesi
um
Calcium Chloride + Fluoride + Nitrate
80
60
40
20
80
8060
4020
20
20 40 60 80
4060
80
60
40
20
20
20406080
40
60
80
80
60
40
20
MORRISON AQUIFER
Number of samples = 13 Number of samples = 28
Number of samples = 14 Number of samples = 10
Number of samples = 13 Number of samples = 8
PERCENT OF REACTING VALUES PERCENT OF REACTING VALUES
PERCENT OF REACTING VALUES PERCENT OF REACTING VALUES
PERCENT OF REACTING VALUES PERCENT OF REACTING VALUES

56 Water-Quality Characteristics in the Black Hills Area, South Dakota
Table 5. Relation between specific conductance and dissolved solidsfor selected aquifers
[S = dissolved solids, in milligrams per liter; K = specific conductance, in microsiemensper centimeter]
Aquifer Equation of line R2 Number ofsamples
Precambrian S = 0.6151K - 14.42 0.9108 39
Deadwood S = 0.5792K - 1.93 .9687 33
Madison S = 0.6091K - 3.73 .9793 91
Minnelusa S = 1.0070K - 215.09 .9777 159
Minnekahta S = 0.8860K - 177.62 .9912 25
Inyan Kara S - 0.7842K - 98.49 .9479 85
Sundance S = 0.7986K - 129.34 .9750 10
Morrison S = 0.7601K - 66.71 .9781 7
Newcastle S = 0.7105K - 67.20 .9817 8
Alluvial S = 0.8302K - 105.62 .9601 64
Figure 17. Trilinear diagrams showing proportionalconcentrations of major ions in selected aquifers.--Continued
Calcium
+ Magnesium
Sulfate
Sodium + Potassium
Chl
orid
e +
Fluo
ride
+ N
itrat
e +
Sul
fate
Bic
arbo
nate
+ C
arbo
nate
Mag
nesi
umCalcium Chloride + Fluoride + Nitrate
80
60
40
20
80
8060
4020
20
20 40 60 80
4060
80
60
40
20
20
20406080
40
60
80
80
60
40
20
ALLUVIAL AQUIFERS
Number of samples = 115
PERCENT OF REACTING VALUES

Water-Quality Characteristics of Selected Aquifers 57
A1 A2 A1 A2 A1 A2
B1
C1
B2 B1
C1 B2
D2 E1
D3 E2 E1 B3
C2
D1
B3
B1
B2
C1C2
D1C3
D2
E3 E2 C2
C3
D3
E3 C3
B3
0 3 6 7 8 9 10 11 12
3,100
3,000
2,900
2,800
2,700
2,600
2,500
2,400
2,300
2,200
2,100
2,000
1,900
1,800
1,700
1,600
1,500
1,400
1,300
1,200
1,100
1,000
ADJUSTED SODIUM-ADSORPTION RATIO (SAR)MULTIPLIED BY 0.7
SP
EC
IFIC
CO
ND
UC
TA
NC
E, I
N M
ICR
OS
IEM
EN
S P
ER
CE
NT
IME
TE
R A
T 2
5o C
ELS
IUS
(E
Cx1
0 A
T 2
5o C
) A
DJU
ST
ED
FO
R C
ALC
IUM
, SU
LFA
TE
, AN
D R
AIN
FA
LL6
EXPLANATIONSOIL TEXTURE Sand Loamy sands, sandy loams Loams, silts, silt loams Sandy clay loams, silty clay loams, clay loams Silty clays, sandy clays, clays
DEPTH BELOW LAND SURFACE TO A MORE-PERMEABLE OR LESS-PERMEABLE MATERIAL 40 inches or less to a more- permeable material 40 to 72 inches to a more- permeable material 20 to 60 inches to a less- permeable material
SPECIFIC CONDUCTANCE Maximum values are based on 12 inches or less average rainfall during the frost-free season. For each additonal inch of rainfall, the maximum values of conductivity may be increased by 100. Average growing season rainfall for the Black Hills area is 14 inches, so the conductivity of each plotted value has been reduced by 200 microsiemens. For water having more than 200 milligrams per liter of calcium and more than 960 milligrams per liter of sulfate, the maximum conductance value may be increased by 400 microsiemens.
ABC
E
1
2
3
AVERAGE CHEMICAL QUALITY OF MAJOR AQUIFERS
AVERAGE CHEMICAL QUALITY OF MINOR AQUIFERS
Figure 18. South Dakota irrigation-water classification diagram. This diagram is based on South Dakota standards(revised Jan. 7, 1982) for maximum allowable specific conductance and adjusted sodium-adsorption-ratio values forwhich an irrigation permit can be issued for applying water under various soil-texture conditions. Water can be appliedunder all conditions at or above the plotted point, but not below it, provided other conditions as defined by the StateConservation Commission are met (from Koch, 1983).
D
Inyan KaraMinnekahtaMinnelusaMadisonDeadwoodPrecambrian
Alluvial
GranerosNewcastle
PierreMorrisonSundanceSpearfish
900
800
700
600
500
400
300
200
100
x
x
x**
##
x
**
#
#

58 Water-Quality Characteristics in the Black Hills Area, South Dakota
Figure 19. Relations between sulfate and specific conductance in the Madison, Minnelusa, and Inyan Kara aquifers.
MADISON AQUIFER
INYAN KARA AQUIFER
MINNELUSA AQUIFER
00 500 1,000 1,500 2,000 2,500 3,000 3,500 4,000 4,500
2,000200 400 600 800 1,000 1,200 1,400 1,600 1,800 00 500 1,000 1,500 2,000 2,500 3,000 3,500
SPECIFIC CONDUCTANCE, IN MICROSIEMENS PER CENTIMETER
500
0
50
100
150
200
250
300
350
400
450D
ISS
OLV
ED
SU
LFA
TE
, IN
MIL
LIG
RA
MS
PE
R L
ITE
R
Sulfate=0.2649K-71.88 where K=specific conductance in microsiemens per centimeterR2=0.7582n=99
0
2,200
200
400
600
800
1,000
1,200
1,400
1,600
1,800
2,000
DIS
SO
LVE
D S
ULF
AT
E, I
N M
ILLI
GR
AM
S P
ER
LIT
ER Sulfate=0.7143K-306.49
where K=specific conductance in microsiemens per centimeterR2=0.9551n=180
0
2,400
200
400
600
800
1,000
1,200
1,400
1,600
1,800
2,000
2,200
DIS
SO
LVE
D S
ULF
AT
E, I
N M
ILLI
GR
AM
S P
ER
LIT
ER Sulfate=0.5439K-193.37
where K=specific conductance in microsiemens per centimeterR2=0.8223n=150

Water-Quality Characteristics of Selected Aquifers 59
Figure 20. Selected relations between common ions and well depth for selected aquifers.
DEADWOOD AQUIFER
WELL DEPTH, IN FEET
0 200 400 600 800 1,000 1,200 1,400 1,600
WELL DEPTH, IN FEET
0 200 400 600 800 1,000 1,200 1,400 1,600
0
170
10
20
30
40
50
60
70
80
90
100
110
120
130
140
150
160D
ISS
OLV
ED
SO
DIU
M, I
N M
ILLI
GR
AM
S P
ER
LIT
ER R2 = 0.1457
0
90
5
10
15
20
25
30
35
40
45
50
55
60
65
70
75
80
85
PE
RC
EN
T S
OD
IUM
R2 = 0.1430
0
10
1
2
3
4
5
6
7
8
9
SO
DIU
M-A
DS
OR
PT
ION
RA
TIO
R2 = 0.1098
0
6.0
0.5
1.0
1.5
2.0
2.5
3.0
3.5
4.0
4.5
5.0
5.5
DIS
SO
LVE
D F
LUO
RID
E, N
MIL
LIG
RA
MS
PE
R L
ITE
R R2 = 0.1672

60 Water-Quality Characteristics in the Black Hills Area, South Dakota
Figure 20. Selected relations between common ions and well depth for selected aquifers.--Continued
WELL DEPTH, IN FEET
MADISON AQUIFERWELL DEPTH, IN FEET
0 5,0000 500 1,000 1,500 2,000 2,500 3,000 3,500 4,000 4,500 0 5,0000 500 1,000 1,500 2,000 2,500 3,000 3,500 4,000 4,500
440
020406080
100120140160180200220240260280300320340360380400420
DIS
SO
LVE
D C
ALC
IUM
, IN
MIL
LIG
RA
MS
PE
R L
ITE
R R2 = 0.2398
0
280
20
40
60
80
100
120
140
160
180
200
220
240
260
DIS
SO
LVE
D S
OD
IUM
, IN
MIL
LIG
RA
MS
PE
R L
ITE
R R2 = 0.2418
0
60
5
10
15
20
25
30
35
40
45
50
55
PE
RC
EN
T S
OD
IUM
R2 = 0.2032
0
60
5
10
15
20
25
30
35
40
45
50
55
DIS
SO
LVE
D P
OT
AS
SIU
M, I
N M
ILLI
GR
AM
S P
ER
LIT
ER
R2 = 0.2688
100
10,000
150
200
250300
400
500600700800900
1,000
1,500
2,000
2,5003,000
4,000
5,0006,0007,0008,0009,000
DIS
SO
LVE
D S
OLI
DS
, RE
SID
UE
ON
EV
AP
OR
AT
ION
AT
180
DE
GR
EE
S C
ELS
IUS
, IN
MIL
LIG
RA
MS
PE
R L
ITE
R
R2 = 0.4651
100
10,000
150
200
250300
400
500600700800900
1,000
1,500
2,000
2,5003,000
4,000
5,0006,0007,0008,0009,000
DIS
SO
LVE
D S
OLI
DS
, SU
M O
F C
ON
ST
ITU
EN
TS
,IN
MIL
LIG
RA
MS
PE
R L
ITE
R
R2 = 0.4812

Water-Quality Characteristics of Selected Aquifers 61
Figure 20. Selected relations between common ions and well depth for selected aquifers.--Continued
WELL DEPTH, IN FEET
MADISON AQUIFER
WELL DEPTH, IN FEET
0 5,0000 500 1,000 1,500 2,000 2,500 3,000 3,500 4,000 4,500
0 5,0000 500 1,000 1,500 2,000 2,500 3,000 3,500 4,000 4,5000
500
50
100
150
200
250
300
350
400
450
DIS
SO
LVE
D S
ULF
AT
E, I
N M
ILLI
GR
AM
S P
ER
LIT
ER R2 = 0.3801
0
1,100
100
200
300
400
500
600
700
800
900
1,000
DIS
SO
LVE
D C
HLO
RID
E, I
N M
ILLI
GR
AM
S P
ER
LIT
ER
R2 = 0.1505
2
36
4
6
8
10
12
14
16
18
20
22
24
26
28
30
32
34
DIS
SO
LVE
D S
ILIC
A, I
N M
ILLI
GR
AM
S P
ER
LIT
ER R2 = 0.4805

62 Water-Quality Characteristics in the Black Hills Area, South Dakota
Figure 20. Selected relations between common ions and well depth for selected aquifers.--Continued
WELL DEPTH
MINNELUSA AQUIFERWELL DEPTH
0 4,5000 500 1,000 1,500 2,000 2,500 3,000 3,500 4,000 0 4,5000 500 1,000 1,500 2,000 2,500 3,000 3,500 4,0000
750
50
100
150
200
250
300
350
400
450
500
550
600
650
700
DIS
SO
LVE
D C
ALC
IUM
, IN
MIL
LIG
RA
MS
PE
R L
ITE
R
R2 = 0.2766
0
200
20
40
60
80
100
120
140
160
180
DIS
SO
LVE
D M
AG
NE
SIU
M, I
N M
ILLI
GR
AM
S P
ER
LIT
ER
R2 = 0.3367
0
2,000
200
400
600
800
1,000
1,200
1,400
1,600
1,800
DIS
SO
LVE
D S
ULF
AT
E, I
N M
ILLI
GR
AM
S P
ER
LIT
ER R2 = 0.2888
0
3.0
0.2
0.4
0.6
0.8
1.0
1.2
1.4
1.6
1.8
2.0
2.2
2.4
2.6
2.8
DIS
SO
LVE
D F
LUO
RID
E, I
N M
ILLI
GR
AM
S P
ER
LIT
ER
R2 = 0.2496
DIS
SO
LVE
D S
OLI
DS
, RE
SID
UE
ON
EV
AP
OR
AT
ION
AT
180
DE
GR
EE
S C
ELS
IUS
, IN
MIL
LIG
RA
MS
PE
R L
ITE
RD
ISS
OLV
ED
SO
LID
S, S
UM
OF
CO
NS
TIT
UE
NT
S,
IN M
ILLI
GR
AM
S P
ER
LIT
ER
5,500
0
500
1,000
1,500
2,000
2,500
3,000
3,500
4,000
4,500
5,000R2 = 0.3993
3,000
0
200
400
600
800
1,000
1,200
1,400
1,600
1,800
2,000
2,200
2,400
2,600
2,800 R2 = 0.3084

Water-Quality Characteristics of Selected Aquifers 63
Figure 20. Selected relations between common ions and well depth for selected aquifers.--Continued
WELL DEPTH, IN FEETMINNELUSA AQUIFER
0 4,5000 500 1,000 1,500 2,000 2,500 3,000 3,500 4,0000
34
2
4
6
8
10
12
14
16
18
20
22
24
26
28
30
32
DIS
SO
LVE
D S
ILIC
A, I
N M
ILLI
GR
AM
S P
ER
LIT
ER R2 = 0.3915

64 Water-Quality Characteristics in the Black Hills Area, South Dakota
Figure 20. Selected relations between common ions and well depth for selected aquifers.--Continued
WELL DEPTH, IN FEETINYAN KARA AQUIFER
0 2,8000200
400600
8001,000
1,2001,400
1,6001,800
2,0002,200
2,4002,600
WELL DEPTH, IN FEET
0 2,8000200
400600
8001,000
1,2001,400
1,6001,800
2,0002,200
2,4002,600
0
100
10
20
30
40
50
60
70
80
90
PE
RC
EN
T S
OD
IUM
R2 = 0.2987
0
18
1
2
3
4
5
6
7
8
9
10
11
12
13
14
15
16
17
DIS
SO
LVE
D S
ILIC
A, I
N M
ILLI
GR
AM
S P
ER
LIT
ER R2 = 0.1262
0
550
50
100
150
200
250
300
350
400
450
500D
ISS
OLV
ED
CA
LCIU
M, I
N M
ILLI
GR
AM
S P
ER
LIT
ER
R2 = 0.1393
0
300
20
40
60
80
100
120
140
160
180
200
220
240
260
280
DIS
SO
LVE
D M
AG
NE
SIU
M, I
N M
ILLI
GR
AM
S P
ER
LIT
ER
R2 = 0.1238
0
85
5
10
15
20
25
30
35
40
45
50
55
60
65
70
75
80
SO
DIU
M-A
DS
OR
PT
ION
RA
TIO
R2 = 0.1065

Water-Quality Characteristics of Selected Aquifers 65
Madison Aquifer
Water from the Madison aquifer generally is fresh, but can be slightly saline (dissolved solids concentration of 1,000 to 3,000 mg/L) near Edgemont, Rapid City, and northwest of Spearfish. Samples from the Madison aquifer have the highest mean chloride concentration of the major aquifers.
The two main water types in the Madison aquifer are calcium magnesium bicarbonate type and calcium sodium chloride sulfate type (fig. 17). Calcium, magnesium, and bicarbonate are dominant among the common ions throughout most of the study area due to the dissolution of calcite and dolomite. The latter water type exists only in the southwestern part of the study area (Naus and others, in press). The high concentra-tions of chloride, sulfate, and sodium in the south-western part of the study area relative to the rest of the study area probably reflect the presence of more evolved ground water and regional flow from the west, and/or the presence of evaporite minerals available for dissolution (Naus and others, in press).
In the Madison aquifer, calcium, sodium, potas-sium, sulfate, chloride, and silica concentrations and percent sodium generally increase with increasing well depth (fig. 20). Although there were not enough values of bicarbonate concentrations with a corresponding well depth for a statistical correlation, a visual check of the well locations in relation to the outcrop showed that bicarbonate concentrations decrease with increasing distance from the outcrop and, hence, probably decrease with increasing well depth. Generally, chloride concentrations, sodium concentrations, and percent sodium are higher in Fall River County than in other counties in the study area.
About 25 percent of the samples (25 of 99) exceed the SMCL for dissolved solids (sum of constit-uents); all but one of these samples were collected from wells located downgradient from the outcrop with depths greater than 2,000 feet. About 16 percent of the samples (21 of 127 samples) equal or exceed the SMCL for sulfate, and about 12 percent of the samples (15 of 124 samples) equal or exceed the SMCL of 250 mg/L for chloride. All of the samples that exceed these SMCL’s were collected from wells located down-gradient of the outcrop and most of the wells were in Fall River County. The higher sulfate concentrations in the Madison aquifer may be caused by the dissolution of anhydrite or leakage of water from the Minnelusa aquifer (Kyllonen and Peter, 1987). One of 89 samples exceeds the MCL for fluoride.
Minnelusa Aquifer
Water from the Minnelusa aquifer typically is fresh, but can be slightly saline at some locations greater than about 5 miles from the outcrop. Generally, calcium, bicarbonate, and sulfate are dominant among the common ions in the Minnelusa aquifer. Of all the major aquifers, the Minnelusa aquifer had the highest mean calcium concentration and the lowest median sodium concentration, percent sodium (equal to samples from the Minnekahta aquifer), and SAR (equal to samples from the Minnekahta aquifer).
The three main water types in the Minnelusa Formation are calcium magnesium bicarbonate type, calcium magnesium sulfate type, and calcium magne-sium bicarbonate sulfate chloride type. Water in the Minnelusa aquifer generally evolves downgradient from a calcium magnesium bicarbonate type to a cal-cium magnesium sulfate type due to dissolution of anhydrite. In the southern part of the study area, ground water is characterized by higher concentrations of sodium and chloride. The higher chloride concen-trations in this area could reflect hydraulic connection between the Madison and Minnelusa aquifers (Naus and others, in press). The dissolution of evaporite min-erals and the presence of more evolved ground water also may contribute toward the occurrence of this water type in the Minnelusa aquifer (Naus and others, in press).
In the Minnelusa aquifer, calcium, magnesium, sulfate, fluoride, and silica concentrations generally increase with increasing well depth (fig. 20). The increasing concentrations reflect the dissolution of many minerals as the water flows downgradient from the outcrop of the Minnelusa Formation. Concentra-tions of chloride and sodium vary with geographic location and do not show a relation to well depth (or distance from outcrop). The chloride and sodium concentrations are higher in the southern Black Hills than in other areas.
The concentration of sulfate in the aquifer is dependent on the amount of anhydrite present in the Minnelusa Formation. Near the outcrop, anhydrite has been dissolved and removed; hence, sulfate concentra-tions near the outcrop are low (less than 250 mg/L). Surrounding the core of the Black Hills and down-gradient from the Minnelusa Formation outcrop is a sulfate transition zone (Kyllonen and Peter, 1987), within which the sulfate concentrations range from 250 to 1,000 mg/L. The transition zone is approximately 2 to 10 miles wide (fig. 21) and marks an area of active

66 Water-Quality Characteristics in the Black Hills Area, South Dakota
BUTTE CO
LAWRENCE CO MEADE CO
PENNINGTON CO
CUSTER CO
FALL RIVER CO
WY
OM
ING
SO
UT
H
DA
KO
TA
LIM
ES
TO
NE
PL
AT
EA
U
Whitewood
Spearfish
Maurice
Savoy
SaintOnge
DEADWOODLead
Nemo
CentralCity
BELLE FOURCHE
Newell
STURGIS
Blackhawk
Piedmont
Tilford
Box Elder
RAPID CITY
Hill City
Hermosa
CUSTER
HOT SPRINGS
Edgemont
Roubaix
Keystone
Hayward
Fairburn
Buffalo Gap
Pringle
NF
orkR
apidC
r
Belle FourcheReservoir
FOURCHE
Victoria
Spring
Grace
Cool i d ge
AngosturaReservoir
Iron
Castl eC
r
N Fork Castle Cr
Can
yon
Red
BearG
ulch
Creek
Crow
SheridanLake
DeerfieldReservoir
PactolaReservoir
Indian Cr
Horse
Creek
OwlCreek
BELLE
RIVER
REDWATER R I VE
RC
reek
Spea
rfis
h
Whi
tewoo
d
Cre
ek
Creek
Bear
Butte
Elk
ElkCreek
Creek
Boxelder
Rapid
Rapid
Creek
Creek
Creek
Creek
Creek
Creek
Creek
Cre
ek
S. Fork
S. Fork Rapid Cr
Battle
French
Beaver
Creek
Creek
Creek
FallR
Hat
Cre
ek
Creek
Horsehead
CHEYENNE
RIVER
Cot
tonw
ood
CreekHay
Spokane
Lame
Johnny
Bea
ver
Cre
ek
Robison
Gulch
Gulch
Castle
Cas
tle
Bear
Little
Creek
Gulch
Hig
gins
Creek
C reekCr
Bot
tom
Fal
seCreek
Wind CaveNational Park
CUSTER
STATE
PARK
WindCave
HarneyPeakx
0 10 20
0 10 20 MILES
KILOMETERS
Less than 250
SULFATE CONCENTRATIONS, IN MILLIGRAMS PER LITER
250 - 1,000
Greater than 1,000
Figure 21. Distribution of sulfate concentrations in the Minnelusa aquifer (from Naus and others, in press).
WELL COMPLETED IN THE MINNELUSA AQUIFER FOR WHICH THERE IS A SULFATE ANALYSIS
EXPLANATIONOUTCROP OF MINNELUSA FORMATION (from Strobel and others, 1999)
MINNELUSA FORMATION ABSENT (from Carter and Redden, 1999c)
Base modified from U.S. Geological Survey digital data, 1:100,000Rapid City, Office of City Engineer map, 1:18,000, 1996Universal Transverse Mercator projection, zone 13
104o 45' 103o30'
15' 103o
30'
44o45'
15'
44o
45'
30'
43o15'

Water-Quality Characteristics of Selected Aquifers 67
removal of anhydrite by dissolution. The transition zone probably is shifting downgradient over geologic time as the anhydrite in the formation is dissolved (Kyllonen and Peter, 1987). Downgradient from the transition zone, sulfate concentrations are greater than 1,000 mg/L, which represents a zone in which thick anhydrite beds remain in the formation.
More than 20 percent of the samples (38 of 176) exceed the SMCL for dissolved solids (sum of constit-uents); most of these samples were collected from wells located downgradient from the outcrop with depths greater than 1,000 feet. About 20 percent of the samples (51 of 249) collected exceed the SMCL for sulfate; generally most of these samples are from wells located downgradient from the outcrop. Seven of 185 samples equal or exceed the SMCL for fluoride; all 7 of these samples were located downgradient from the outcrop. None of the samples exceed the MCL for fluoride.
Minnekahta Aquifer
Water from the Minnekahta aquifer generally is fresh. Generally, calcium and bicarbonate are domi-nant among the common ions, although a few samples also had high sulfate concentrations. Of the major aquifers, the Minnekahta aquifer had the highest median calcium and magnesium concentrations and the highest mean and median bicarbonate and silica con-centrations (table 4). The Minnekahta aquifer also had the lowest mean sodium concentration and the lowest mean and median potassium concentration, percent sodium (equal to the median of the Minnelusa aquifer), and SAR (equal to the median of the Minnelusa aquifer).
The Minnekahta aquifer generally yields a cal-cium bicarbonate water (fig. 17) due to the dissolution of calcite. In samples from four wells completed in the Minnekahta aquifer, the water type is calcium sulfate. The four wells with a substantial sulfate component generally are farther from the outcrop than the wells dominated by bicarbonate. A possible source for the sulfate is leakage from or through the underlying Minnelusa aquifer.
Four of 24 samples exceed the SMCL for dis-solved solids (sum of constituents). Four of 28 samples exceed the SMCL for sulfate; all of these samples were collected from wells that are farther from the outcrop than the other wells that were sampled.
Inyan Kara Aquifer
Water from the Inyan Kara aquifer is fresh to slightly saline, with the highest salinity occurring in the southern Black Hills. Generally, sodium and sulfate are dominant among the common ions, although calcium and bicarbonate concentrations also can be high depending on well depth and geographic location. Of the major aquifers, the Inyan Kara aquifer had the highest mean and median sodium concentration, per-cent sodium, SAR, and sulfate concentration and the highest mean magnesium concentration (table 4). The Inyan Kara aquifer also had the lowest mean and median silica concentration.
The Inyan Kara aquifer may yield a sodium sulfate, calcium sulfate, calcium bicarbonate, or sodium bicarbonate water type (fig. 17) depending on geographical location and distance from the outcrop. The initial water types are similar to those of the Minnelusa aquifer—calcium sulfate or calcium bicar-bonate—possibly because the Inyan Kara aquifer receives recharge from the underlying aquifers. Wells located on and near the outcrop of the Inyan Kara Group in the southern Black Hills generally yield a calcium sulfate water type, whereas wells in the eastern and northern Black Hills generally yield a calcium bicarbonate water type. In the southern Black Hills, the water evolves as it moves downgradient to a sodium sulfate water type or, locally, to a sodium bicarbonate water type (Gott and others, 1974). In the eastern and northern Black Hills, the water evolves to a sodium sulfate water type as it moves downgradient.
Percent sodium, SAR, and silica concentrations generally increase with increasing well depth, whereas calcium and magnesium concentrations decrease with increasing well depth. The change in concentrations indicates that sodium and silica are dissolving and cal-cium and magnesium are precipitating as the water flows downgradient from the outcrop of the Inyan Kara Group. The source of high sulfate concentrations on or near the outcrop may be from upward leakage of water from the Minnelusa aquifer or gypsiferous formations (Gypsum Spring or Spearfish Formations) or from the oxidation of sulfide minerals in the Inyan Kara aquifer (Kyllonen and Peter, 1987).
Chloride concentrations vary with geographic location as opposed to distance from outcrop. In the southern Black Hills, chloride concentrations generally are higher than those in other areas. Sulfate concentra-tions generally are higher in the southern Black Hills than those in other areas, whereas silica concentrations generally are lower in the southern Black Hills.

68 Water-Quality Characteristics in the Black Hills Area, South Dakota
More than 60 percent of the samples (65 of 102 samples) analyzed for dissolved solids (sum of constit-uents) exceed the SMCL for dissolved solids; most of these samples were collected from wells in the southern Black Hills or from wells located downgradient from the outcrop with depths greater than 500 feet. More than 60 percent of the samples (110 of 177 samples) collected exceed the SMCL for sulfate; almost every sample collected in the southern Black Hills exceeds the SMCL for sulfate. Two of 105 samples equal or exceed the SMCL for fluoride, and one of these samples equals the MCL for fluoride.
Minor Aquifers
Only three samples were analyzed for dissolved solids from the Spearfish aquifer. However, at least 25 percent of the total number of samples probably would exceed the SMCL for dissolved solids, based on sulfate concentrations that are greater than 500 mg/L. Calcium, sulfate, and bicarbonate are dominant among the common ions in the Spearfish aquifer. About 45 percent of the samples (6 of 13 samples) exceed the SMCL for sulfate. Water from the Spearfish aquifer generally is a calcium bicarbonate or calcium sulfate type (fig. 17). The dominance of sulfate increases with the amount of gypsum present in the formation.
Most samples (10 of 12 samples) from wells completed in the Sundance aquifer and some samples (3 of 7 samples) from wells completed in the Morrison aquifer exceed the SMCL for dissolved solids. In the Sundance aquifer, calcium, sodium, sulfate, and bicar-bonate are dominant among the common ions. Almost all of the samples from the Sundance aquifer (12 of 14 samples) exceed the SMCL for sulfate, and 1 of 12 samples exceeds the MCL for fluoride. Most samples from the Sundance aquifer are slightly saline. Calcium, sulfate, and bicarbonate are dominant among the common ions in the Morrison aquifer. About 45 percent of the samples (7 of 15 samples) exceed the SMCL for sulfate in water from the Morrison aquifer.
No samples from the Pierre aquifer were analyzed for dissolved solids; however, it is likely that most would exceed the SMCL for dissolved solids, based on sulfate concentrations. Sodium, calcium, sulfate, and bicarbonate (based on alkalinity) are dom-inant among the common ions in the Pierre aquifer. The mean bicarbonate concentration is about 360 mg/L and was determined by dividing the mean alkalinity (table 3) by 0.8202 (Hem, 1985). Almost all of the
samples (24 of 28 samples) exceed the SMCL for sulfate.
Water from the Sundance, Morrison, and Pierre aquifers generally is a mixed type that includes domi-nant cations of sodium, calcium, and magnesium, and the dominant anions of sulfate and bicarbonate (fig. 17). The dominance of sodium and sulfate increases with increasing amounts of shale present in the formations due to the large cation-exchange capac-ities of clay minerals (generally sodium concentrations increase) and due to the reduced circulation of water through the shale (Hem, 1985). The dominance of calcium, magnesium, and bicarbonate increases with increasing amounts of sandstone (where calcium carbonate commonly is the cementing material) and carbonate rocks present in the formations.
No samples from aquifers in the Graneros Group (excluding the Newcastle aquifer) were analyzed for dissolved solids; however, at least 25 percent of the samples probably would exceed the SMCL for dis-solved solids, based on sulfate concentrations. Wells completed in the Newcastle aquifer generally yield water that is low in specific conductance and dissolved solids, although one of eight samples from the New-castle aquifer did exceed the SMCL for dissolved solids. Calcium, bicarbonate (based on alkalinity), and sulfate are the dominant common ions in the Graneros aquifer. Calcium and bicarbonate (based on alkalinity) are the dominant common ions in the Newcastle aquifer. None of the samples for either the Graneros or Newcastle aquifers were analyzed for bicarbonate. The mean bicarbonate concentration of the samples for both aquifers is about 300 mg/L based on the mean alka-linity (table 3). Fifty percent of the samples (5 of 10 samples) collected from the Graneros aquifer exceed the SMCL for sulfate, and one of eight samples col-lected from the Newcastle aquifer exceeds the SMCL for sulfate. Of the minor aquifers, the Newcastle aquifer generally has the lowest sulfate concentrations and has the lowest dissolved solids concentrations.
The water type yielded from the Graneros aquifer varies from a calcium bicarbonate sulfate type to a mixed type (fig. 17), depending on the formation in which the well is completed. Most wells completed within the Graneros Group are completed in the Newcastle aquifer, which generally yields a calcium bicarbonate or calcium bicarbonate sulfate water type.
Generally, calcium, sulfate, and bicarbonate are dominant among the common ions in the alluvial aquifers. The concentrations of all of the common ions

Water-Quality Characteristics of Selected Aquifers 69
increase with distance from the central core of the Black Hills, which is largely due to the increasing dissolved ions in the streams and in the geologic formations that underlie the alluvial deposits. About 25 percent of the samples (20 of 81 samples) exceed the SMCL for dissolved solids (sum of constituents); almost all those samples are from wells completed in alluvial deposits that overlie the Cretaceous-age shales. More than 30 percent of the samples (38 of 116 samples) from alluvial aquifers exceed the SMCL for sulfate, and most of these are from wells completed in alluvial deposits that overlie the Cretaceous-age shales.
The water type yielded from wells completed in alluvial aquifers varies greatly (fig. 17) and largely is dependent on the geologic formation that underlies the alluvial deposit. Generally, wells completed in alluvial deposits that do not overlie Cretaceous-age shales yield fresh water with a calcium bicarbonate or calcium mag-nesium bicarbonate water type. Wells that are com-pleted in alluvial deposits that overlie the Cretaceous-age shales generally yield slightly saline water with a mixed water type or a water type in which sodium is the dominant cation and/or sulfate is the dominant anion.
Nutrients
Nitrogen and phosphorus are essential nutrients for plant growth. The major form of nitrogen in ground water is nitrate, although it also can occur in other forms including ammonium, ammonia, nitrite, and as part of organic solutes. Nitrate is very mobile in ground water, and it moves with little or no retardation (Freeze and Cherry, 1979). Elevated nitrate concentra-tions in ground water can originate from natural pro-cesses or as contamination from nitrogen sources, such as fertilizers and sewage. Nitrate concentrations above 10 mg/L (U.S. Environmental Protection Agency, 1994a) can cause methemoglobinemia (blue-baby syndrome) in small children.
In ground water, phosphorus generally occurs as phosphate. Orthophosphate generally is the most stable phosphate species that occurs. Phosphorus has a low solubility and, therefore, dissolved concentrations in ground water generally are no more than a few tenths of a milligram per liter (Hem, 1985). Concentrations above this level may indicate contamination by
fertilizer or sewage. Concentrations of orthophosphate that were reported as phosphate were converted to concentrations as phosphorus for this report.
Summary statistics for selected nutrients, including nitrite, nitrite plus nitrate, ammonia, ammonia plus organic, phosphorus, and orthophos-phate, are presented in table 6, and the significance of the various nutrients is described in table 1. Boxplots are presented in figure 22 for each of the nutrients.
Generally, concentrations of nitrogen and phos-phorus are low in water from the major aquifers. Two of 40 samples collected from wells completed in Precambrian aquifers exceed the MCL of 10 mg/L for nitrite plus nitrate. No samples from the Deadwood, Madison, or Minnekahta aquifers exceed the MCL for any regulated nutrient constituent. A sample from the Madison aquifer has the highest concentration of ammonia plus organic (5.0 mg/L) of all the samples from all of the aquifers considered in this study. In the Minnelusa aquifer, 2 of 157 samples exceed the MCL for nitrite plus nitrate. A sample from the Minnelusa aquifer has the highest phosphorus concentration (2.1 mg/L) of all the samples from all aquifers considered in this study.
Nitrogen and phosphorus concentrations gener-ally are low in water from the Inyan Kara aquifer. Of the samples collected from wells completed in the Inyan Kara aquifer, 1 of 41 samples equalled the MCL of 1.0 mg/L for nitrite, and 1 of 81 samples exceeds the MCL for nitrite plus nitrate. Three individual samples from the Inyan Kara aquifer have the highest concen-tration of nitrite (1.0 mg/L), nitrite plus nitrate (60 mg/L), and ammonia (2.2 mg/L) of all the samples from all aquifers considered in this study (fig. 22). The extreme values for nitrite and nitrite plus nitrate are unusually high and may reflect poor well construction and surface contamination as opposed to aquifer conditions.
With the exception of alluvial aquifers, few samples from the minor aquifers were analyzed for nitrogen or phosphorus. Of the samples analyzed, nitrogen and phosphorus concentrations are low and none exceed the MCL for nitrite or for nitrite plus nitrate.

70 Water-Quality Characteristics in the Black Hills Area, South Dakota
Table 6. Summary of concentrations of nutrients in ground water
[Results based on data stored in U.S. Geological Survey National Water Information System water-quality database. Results in milligrams per liter. One milligram per liter is approximately equal to one part per million; --, not analyzed or not determined; <, less than indicated detection limit]
Dissolved constituentNumber ofsamples
Number ofcensoredsamples
Mean Median Minimum Maximum
Precambrian aquifers
Nitrite, as N 18 17 -- -- <0.01 0.01
Nitrite plus nitrate, as N 40 8 1.6 0.7 <0.1 12
Ammonia, as N 0 -- -- -- -- --
Ammonia plus organic, as N 0 -- -- -- -- --
Phosphorus, as P 51 44 1-- 1-- <0.04 0.12
Orthophosphate, as P 0 -- -- -- -- --
Deadwood aquifer
Nitrite, as N 5 5 -- -- <0.01 <0.01
Nitrite plus nitrate, as N 8 4 0.2 <0.1 <0.1 0.5
Ammonia, as N 2 0 0.025 0.025 0.02 0.03
Ammonia plus organic, as N 3 1 -- -- <0.2 0.6
Phosphorus, as P 7 5 -- -- <0.01 0.25
Orthophosphate, as P 1 1 -- -- <0.001 <0.001
Madison aquifer
Nitrite, as N 56 50 1-- 1-- <0.01 0.03
Nitrite plus nitrate, as N 74 14 0.4 0.2 <0.05 2.6
Ammonia, as N 31 12 0.2 0.01 <0.01 1.9
Ammonia plus organic, as N 36 23 0.4 0.1 0.05 5.0
Phosphorus, as P 59 42 0.01 <0.01 <0.01 0.22
Orthophosphate, as P 28 14 <0.01 <0.01 <0.01 0.02
Minnelusa aquifer
Nitrite, as N 61 49 1-- 1-- <0.01 0.05
Nitrite plus nitrate, as N 157 29 0.6 0.3 0.01 16
Ammonia, as N 22 6 0.04 0.02 <0.01 0.3
Ammonia plus organic, as N 28 16 0.2 0.2 <0.1 0.8
Phosphorus, as P 68 54 0.04 <0.01 <0.01 2.1
Orthophosphate, as P 19 11 <0.01 <0.01 <0.01 0.03
Minnekahta aquifer
Nitrite, as N 10 9 -- -- <0.01 0.01
Nitrite plus nitrate, as N 23 4 1.5 0.7 <0.1 9.5
Ammonia, as N 3 1 -- -- <0.02 0.07
Ammonia plus organic, as N 3 1 -- -- <0.2 0.2
Phosphorus, as P 4 3 -- -- <0.01 <0.04
Orthophosphate, as P 3 1 -- -- <0.01 0.03

Water-Quality Characteristics of Selected Aquifers 71
Inyan Kara aquifer
Nitrite, as N 41 31 0.06 <0.01 <0.01 1.0
Nitrite plus nitrate, as N 81 29 1.1 0.1 0.01 60
Ammonia, as N 17 2 0.5 0.25 <0.01 2.2
Ammonia plus organic, as N 18 1 0.8 0.5 <0.1 2.7
Phosphorus, as P 81 74 -- -- <0.01 0.03
Orthophosphate, as P 0 0 -- -- -- --
Spearfish aquifer
Nitrite, as N 3 3 -- -- <0.01 <0.01
Nitrite plus nitrate, as N 4 0 1.8 0.8 0.5 5.0
Ammonia, as N 0 -- -- -- -- --
Ammonia plus organic, as N 0 -- -- -- -- --
Phosphorus, as P 9 9 -- -- <0.04 <0.04
Orthophosphate, as P 0 -- -- -- -- --
Sundance aquifer
Nitrite, as N 3 0 0.02 0.02 0.02 0.02
Nitrite plus nitrate, as N 9 0 0.4 0.1 0.02 2.1
Ammonia, as N 3 0 0.2 0.03 0.02 0.5
Ammonia plus organic, as N 3 0 0.5 0.5 0.3 0.6
Phosphorus, as P 5 4 -- -- <0.01 <0.04
Orthophosphate, as P 0 -- -- -- -- --
Morrison aquifer
Nitrite, as N 2 2 -- -- <0.01 <0.01
Nitrite plus nitrate, as N 7 0 0.5 0.5 0.2 0.7
Ammonia, as N 0 -- -- -- -- --
Ammonia plus organic, as N 0 -- -- -- -- --
Phosphorus, as P 6 6 -- -- <0.04 <0.04
Orthophosphate, as P 0 -- -- -- -- --
Pierre aquifer
Nitrite, as N 0 -- -- -- -- --
Nitrite plus nitrate, as N 0 -- -- -- -- --
Ammonia, as N 0 -- -- -- -- --
Ammonia plus organic, as N 0 -- -- -- -- --
Phosphorus, as P 28 26 -- -- <0.04 0.10
Orthophosphate, as P 0 -- -- -- -- --
Table 6. Summary of concentrations of nutrients in ground water—Continued
[Results based on data stored in U.S. Geological Survey National Water Information System water-quality database. Results in milligrams per liter. One milligram per liter is approximately equal to one part per million; --, not analyzed or not determined; <, less than indicated detection limit]
Dissolved constituentNumber ofsamples
Number ofcensoredsamples
Mean Median Minimum Maximum

72 Water-Quality Characteristics in the Black Hills Area, South Dakota
Graneros aquifer
Nitrite, as N 0 -- -- -- -- --
Nitrite plus nitrate, as N 0 -- -- -- -- --
Ammonia, as N 0 -- -- -- -- --
Ammonia plus organic, as N 0 -- -- -- -- --
Phosphorus, as P 10 10 -- -- <0.04 <0.04
Orthophosphate, as P 0 -- -- -- -- --
Newcastle aquifer
Nitrite, as N 4 4 -- -- <0.01 <0.01
Nitrite plus nitrate, as N 6 4 -- -- <0.1 <0.1
Ammonia, as N 1 0 -- -- 0.01 0.01
Ammonia plus organic, as N 1 1 -- -- <0.1 <0.1
Phosphorus, as P 1 0 -- -- 0.01 0.01
Orthophosphate, as P 0 -- -- -- -- --
Alluvial aquifers
Nitrite, as N 18 17 -- -- <0.01 0.01
Nitrite plus nitrate, as N 70 9 0.7 0.4 0.01 3.1
Ammonia, as N 14 5 0.01 <0.01 <0.01 0.02
Ammonia plus organic, as N 4 3 -- -- <0.2 0.2
Phosphorus, as P 33 29 1-- 1-- <0.01 0.77
Orthophosphate, as P 23 13 <0.01 <0.01 <0.001 0.02
1Boxplot for constituent is shown in figure 22, although percent of censored values is greater than 80 percent. Mean and median are not reported because they are unreliable.
Table 6. Summary of concentrations of nutrients in ground water—Continued
[Results based on data stored in U.S. Geological Survey National Water Information System water-quality database. Results in milligrams per liter. One milligram per liter is approximately equal to one part per million; --, not analyzed or not determined; <, less than indicated detection limit]
Dissolved constituentNumber ofsamples
Number ofcensoredsamples
Mean Median Minimum Maximum

Water-Quality Characteristics of Selected Aquifers 73
Figure 22. Boxplots of concentrations of selected nutrients for selected aquifers.
AQUIFER
PrecambrianDeadwood
MadisonMinnelusa
MinnekahtaInyan Kara
SpearfishSundance
MorrisonPierre
Graneros AlluvialNewcastle
0
1.4
0.2
0.4
0.6
0.8
1.0
1.2
1.4
DIS
SO
LVE
D N
ITR
ITE
, IN
MIL
LIG
RA
MS
PE
R L
ITE
R
18/17 5/5 56/50 61/49 10/9 41/31 3/3 3/0 2/2 0/0 0/0 4/4 18/17
0
20
5
10
15
DIS
SO
LVE
D N
ITR
ITE
PLU
S N
ITR
AT
E,
IN M
ILLI
GR
AM
S P
ER
LIT
ER
40/8 8/4 74/14 157/29 23/4 81/29 4/0 9/0 7/0 0/0 0/0 6/4 70/965
60
0
2.5
0.5
1.0
1.5
2.0
DIS
SO
LVE
D A
MM
ON
IA,
IN M
ILLI
GR
AM
S P
ER
LIT
ER
0/0 2/0 31/12 22/6 3/1 17/2 0/0 3/0 0/0 0/0 1/0 14/50/0
Major aquifers Minor aquifers
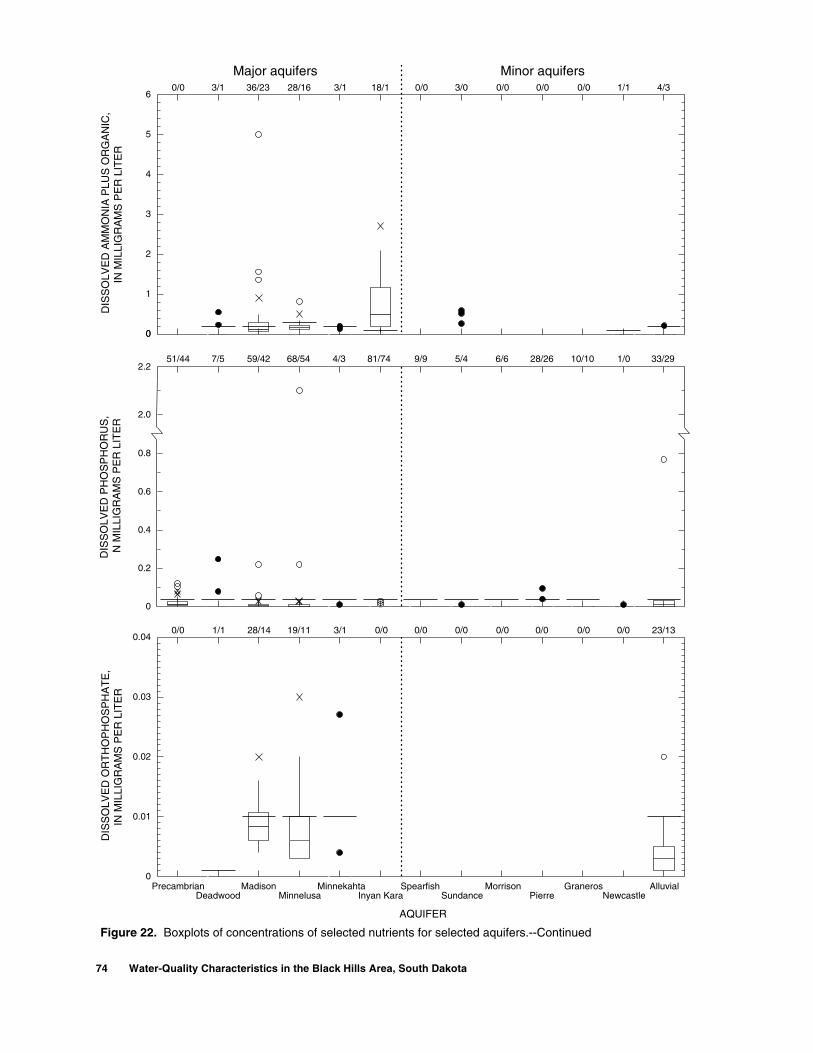
74 Water-Quality Characteristics in the Black Hills Area, South Dakota
Figure 22. Boxplots of concentrations of selected nutrients for selected aquifers.--Continued
AQUIFER
PrecambrianDeadwood
MadisonMinnelusa
MinnekahtaInyan Kara
SpearfishSundance
MorrisonPierre
Graneros AlluvialNewcastle
0
6
0
1
2
3
4
5
DIS
SO
LVE
D A
MM
ON
IA P
LUS
OR
GA
NIC
,IN
MIL
LIG
RA
MS
PE
R L
ITE
R
0/0 3/1 36/23 28/16 3/1 18/1 0/0 3/0 0/0 0/0 0/0 1/1 4/3
0
0.2
0.4
0.6
0.8
DIS
SO
LVE
D P
HO
SP
HO
RU
S,
N M
ILLI
GR
AM
S P
ER
LIT
ER
51/44 7/5 59/42 68/54 4/3 81/74 9/9 5/4 6/6 28/26 10/10 1/0 33/29
2.0
2.2
0
0.04
0.01
0.02
0.03
DIS
SO
LVE
D O
RT
HO
PH
OS
PH
AT
E,
IN M
ILLI
GR
AM
S P
ER
LIT
ER
0/0 1/1 28/14 19/11 3/1 0/0 0/0 0/0 0/0 0/0 0/0 0/0 23/13
Major aquifers Minor aquifers