Dead space: the physiology of wasted ventilation · 2015-08-12 · Dead space: the physiology of...
13
Dead space: the physiology of wasted ventilation H. Thomas Robertson Number 9 in the series “Physiology in respiratory medicine” Edited by R. Naeije, D. Chemla, A. Vonk-Noordegraaf and A.T. Dinh-Xuan Affiliation: Division of Pulmonary and Critical Care Medicine, University of Washington, Seattle, WA, USA. Correspondence: H. Thomas Robertson, Division of Pulmonary and Critical Care Medicine, Depts of Medicine and Physiology and Biophysics, University of Washington, Box 356522 Seattle, WA, 98195-6522, USA. E-mail: [email protected] ABSTRACT An elevated physiological dead space, calculated from measurements of arterial CO 2 and mixed expired CO 2 , has proven to be a useful clinical marker of prognosis both for patients with acute respiratory distress syndrome and for patients with severe heart failure. Although a frequently cited explanation for an elevated dead space measurement has been the development of alveolar regions receiving no perfusion, evidence for this mechanism is lacking in both of these disease settings. For the range of physiological abnormalities associated with an increased physiological dead space measurement, increased alveolar ventilation/perfusion ratio (V′A/Q′) heterogeneity has been the most important pathophysiological mechanism. Depending on the disease condition, additional mechanisms that can contribute to an elevated physiological dead space measurement include shunt, a substantial increase in overall V′A/Q′ ratio, diffusion impairment, and ventilation delivered to unperfused alveolar spaces. @ERSpublications A review of current understanding of factors accounting for abnormal physiological dead space measurements in disease http://ow.ly/Dnyw1 Copyright ©ERS 2015 The online version of this article has been corrected. The correction is outlined in the erratum published in the October 2015 issue of the European Respiratory Journal [DOI: 10.1183/09031936.50137614]. Previous articles in this series: No. 1: Naeije R, Vachiery J-L, Yerly P, et al. The transpulmonary pressure gradient for the diagnosis of pulmonary vascular diseases. Eur Respir J 2013; 41: 217–223. No. 2: Hughes JMB, van der Lee I. The TL,NO/TL,CO ratio in pulmonary function test interpretation. Eur Respir J 2013; 41: 453–461. No. 3: Vonk-Noordegraaf A, Westerhof N. Describing right ventricular function. Eur Respir J 2013; 41: 1419–1423. No. 4: Hamzaoui O, Monnet X, Teboul J-L. Pulsus paradoxus. Eur Respir J 2013; 42: 1696–1705. No. 5: Prisk GK. Microgravity and the respiratory system. Eur Respir J 2014; 43: 1459–1471. No. 6: Dempsey JA, Smith CA. Pathophysiology of human ventilatory control. Eur Respir J 2014; 44: 495–512. No. 7: Petersson J, Glenny RW. Gas exchange and ventilation–perfusion relationships in the lung. Eur Respir J 2014; 44: 1023–1041. No. 8: Wagner PD. The physiological basis of pulmonary gas exchange: implications for clinical interpretation of arterial blood gases. Eur Respir J 2015; 45: 227–243. Received: July 27 2014 | Accepted after revision: Sept 29 2014 | First published online: Nov 13 2014 Conflict of interest: None declared. 1704 Eur Respir J 2015; 45: 1704–1716 | DOI: 10.1183/09031936.00137614 SERIES PHYSIOLOGY IN RESPIRATORY MEDICINE
Transcript of Dead space: the physiology of wasted ventilation · 2015-08-12 · Dead space: the physiology of...
Dead space: the physiology of wastedventilation
H. Thomas Robertson
Number 9 in the series “Physiology in respiratory medicine”Edited by R. Naeije, D. Chemla, A. Vonk-Noordegraaf and A.T. Dinh-Xuan
Affiliation:Division of Pulmonary and Critical Care Medicine, University of Washington, Seattle, WA, USA.
Correspondence:H. Thomas Robertson, Division of Pulmonary and Critical Care Medicine, Depts of Medicine and Physiologyand Biophysics, University of Washington, Box 356522 Seattle, WA, 98195-6522, USA.E-mail: [email protected]
ABSTRACT An elevated physiological dead space, calculated from measurements of arterial CO2 andmixed expired CO2, has proven to be a useful clinical marker of prognosis both for patients with acuterespiratory distress syndrome and for patients with severe heart failure. Although a frequently citedexplanation for an elevated dead space measurement has been the development of alveolar regionsreceiving no perfusion, evidence for this mechanism is lacking in both of these disease settings. For therange of physiological abnormalities associated with an increased physiological dead space measurement,increased alveolar ventilation/perfusion ratio (V′A/Q′) heterogeneity has been the most importantpathophysiological mechanism. Depending on the disease condition, additional mechanisms that cancontribute to an elevated physiological dead space measurement include shunt, a substantial increase inoverall V′A/Q′ ratio, diffusion impairment, and ventilation delivered to unperfused alveolar spaces.
@ERSpublicationsA review of current understanding of factors accounting for abnormal physiological dead spacemeasurements in disease http://ow.ly/Dnyw1
Copyright ©ERS 2015
The online version of this article has been corrected. The correction is outlined in the erratum published in the October2015 issue of the European Respiratory Journal [DOI: 10.1183/09031936.50137614].
Previous articles in this series: No. 1: Naeije R, Vachiery J-L, Yerly P, et al. The transpulmonary pressure gradient forthe diagnosis of pulmonary vascular diseases. Eur Respir J 2013; 41: 217–223. No. 2: Hughes JMB, van der Lee I. TheTL,NO/TL,CO ratio in pulmonary function test interpretation. Eur Respir J 2013; 41: 453–461. No. 3: Vonk-Noordegraaf A,Westerhof N. Describing right ventricular function. Eur Respir J 2013; 41: 1419–1423. No. 4: Hamzaoui O, Monnet X,Teboul J-L. Pulsus paradoxus. Eur Respir J 2013; 42: 1696–1705. No. 5: Prisk GK. Microgravity and the respiratorysystem. Eur Respir J 2014; 43: 1459–1471. No. 6: Dempsey JA, Smith CA. Pathophysiology of human ventilatory control.Eur Respir J 2014; 44: 495–512. No. 7: Petersson J, Glenny RW. Gas exchange and ventilation–perfusion relationships inthe lung. Eur Respir J 2014; 44: 1023–1041. No. 8: Wagner PD. The physiological basis of pulmonary gas exchange:implications for clinical interpretation of arterial blood gases. Eur Respir J 2015; 45: 227–243.
Received: July 27 2014 | Accepted after revision: Sept 29 2014 | First published online: Nov 13 2014
Conflict of interest: None declared.
1704 Eur Respir J 2015; 45: 1704–1716 | DOI: 10.1183/09031936.00137614
SERIESPHYSIOLOGY IN RESPIRATORY MEDICINE

IntroductionRecent recognition of the prognostic relevance of measurements of physiological dead space for patientswith the acute respiratory distress syndrome (ARDS) has brought new attention to a simple gas exchangecalculation described over 120 years ago. The current calculation of physiological dead space, utilisingmeasurements of arterial CO2 tension (PaCO2) and mixed expired CO2 tension (PECO2), was initiallythought to include an anatomical dead space, representing the fraction of ventilation advancing no furtherthan the conducting airways, and an alveolar dead space, representing the fraction of ventilation deliveredto alveolar surfaces receiving no pulmonary artery perfusion. With the subsequent development of a simplemeasurement of anatomical dead space, it became apparent that the alveolar dead space component wassubstantially increased in a range of pulmonary diseases, and that its original interpretation as ventilationdelivered to unperfused alveolar surfaces was not adequate to explain the pathophysiology of most diseaseconditions. This review will cover the findings in gas exchange pathophysiology that shape our currentunderstanding of the factors that influence physiological dead space measurements, with a primary focuson dead space measurements acquired in patients with respiratory or cardiac diseases.
Bohr dead spaceBecause of the tidal nature of ventilation, every exhaled breath contains a fraction of the inspired gas thatdoes not participate in gas exchange. In 1891, the Danish respiratory physiologist Christian Bohrintroduced his calculation to represent the volume of gas within the conducting airways that constitutedthe respiratory dead space [1]. The Bohr model conceptually divided the volume of the exhaled breath(VT) into two compartments, with the first (VA) representing the fraction of exhaled breath participatingin gas exchange, and the second (VD) representing the fraction of exhaled breath penetrating no furtherthan the conducting airways, the respiratory dead space:
VT ¼ VAþ VD
The Bohr calculation utilised two measurements of exhaled CO2: the fractional CO2 concentration in thetotal mixed exhaled breath (FECO2), and an estimate of mean alveolar CO2 concentration (FACO2) based ona sample of gas collected late in exhalation. The mass balance calculation using CO2 assumes the deadspace contributes no CO2 to the exhaled breath (FDCO2=0):
VT� FECO2 ¼ VA � FACO2 þ VD� FDCO2
Substituting (VT−VD) for VA yields:
VT � FECO2 ¼ (VT � VD)� FACO2
Rearranging the terms describes VD/VT, the fraction of ventilation not contributing to CO2 exchange:
VD=VT ¼ (FACO2 � FECO2)=FACO2
The Bohr estimates of the volume of respiratory dead space correlated reasonably well with anatomicalmeasurements of the respiratory pathway, and represented a noninvasive means of measuring the extent ofventilation inefficiency attributable to the constraints of tidal ventilation.
In the decades following the introduction of the Bohr dead space estimate, two factors that interfered withthe accuracy of the measurement as an index of conducting airways volume became apparent. Thedevelopment of a method to sample multiple within-breath samples of CO2 [2] demonstrated modestvariability in partial pressures within an exhaled breath in normal subjects, leading to the recognition thata gas sample captured within a breath would not necessarily reflect the true mean alveolar gascomposition. While that effect was minor in normal subjects, it became a substantial source of variabilityin patients with significant underlying lung disease. Furthermore, Bohr calculations performed on suchpatients revealed increases in dead space fraction that could not be ascribed to conducting airway volume.While the latter finding was an insight that drove subsequent investigations of gas exchangepathophysiology, problems with identifying a simple method to identify mean alveolar CO2 tension(PACO2) in patients with lung disease led to the later abandonment of the traditional Bohr measurement.
Current airway CO2 monitoring systems for intubated patients provide accurate measurements of end-tidalCO2 concentrations that are acceptable estimates of alveolar CO2 in normal subjects, and reflect at leastdirectional changes in alveolar CO2 in patients with underlying lung disease, but cannot provide an accurate
DOI: 10.1183/09031936.00137614 1705
PHYSIOLOGY IN RESPIRATORY MEDICINE | H.T. ROBERTSON
measurement of Bohr dead space in a diseased lung because the end-tidal CO2 does not reflect the meanalveolar CO2. One current application of the traditional Bohr measurement that substitutes end-tidal CO2
measurements for mean alveolar CO2 is seen with commercial exercise testing systems that calculate a Bohrdead space during exercise. At rest, CO2 concentrations measured within a single exhalation increasemodestly, a consequence of a constant mixed venous CO2 delivery and the intermittent inspiration of freshgas into the alveoli. However, during heavy exercise, when mixed venous CO2 tension (PCO2) may exceed 60mmHg, exhaled CO2 concentrations increase substantially within the course of each exhaled breath. Henceduring heavy exercise, although mean alveolar CO2 concentrations within an exhaled breath stillapproximate arterial values, the end-tidal values are substantially higher than the mean alveolar values. JONESet al. [3] documented end-tidal PCO2 measurements exceeding PaCO2 measurements by 4–6 mmHg duringheavy exercise. Hence during heavy exercise the Bohr estimate of dead space utilising measurements ofend-tidal CO2 yields an inappropriately high value because the end-tidal CO2 consistently exceeds the meanalveolar (and arterial) PCO2. A recent method to identify an accurate mean alveolar CO2 from an expiratorycapnogram has been validated in experimental animals, and could be incorporated in commercial ventilatorsystems to calculate a Bohr dead space [4]. However for critically ill patients, that calculation substantiallyunderestimates the more familiar Enghoff modification of the Bohr dead space, which substitutes the PaCO2
measurement for the mean PACO2 measurement [4]. (See the physiological dead space section formechanisms accounting for increased arterial–alveolar PCO2 differences in abnormal lungs.)
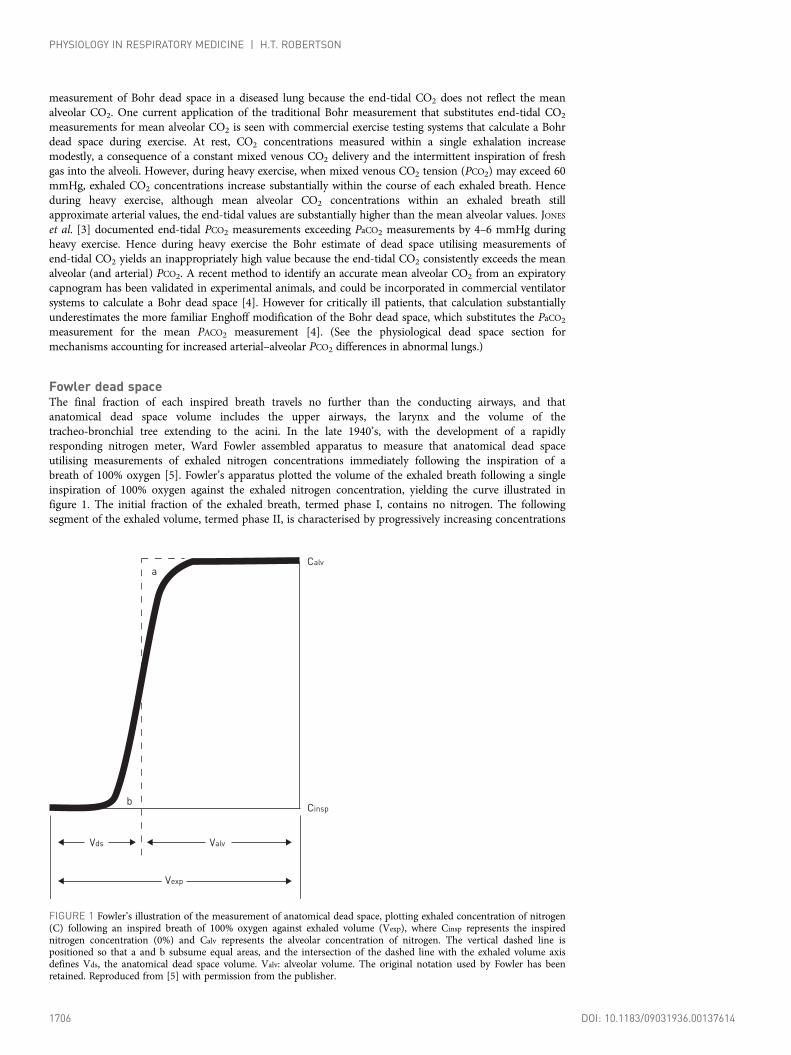
Fowler dead spaceThe final fraction of each inspired breath travels no further than the conducting airways, and thatanatomical dead space volume includes the upper airways, the larynx and the volume of thetracheo-bronchial tree extending to the acini. In the late 1940’s, with the development of a rapidlyresponding nitrogen meter, Ward Fowler assembled apparatus to measure that anatomical dead spaceutilising measurements of exhaled nitrogen concentrations immediately following the inspiration of abreath of 100% oxygen [5]. Fowler’s apparatus plotted the volume of the exhaled breath following a singleinspiration of 100% oxygen against the exhaled nitrogen concentration, yielding the curve illustrated infigure 1. The initial fraction of the exhaled breath, termed phase I, contains no nitrogen. The followingsegment of the exhaled volume, termed phase II, is characterised by progressively increasing concentrations
Calv
Cinsp
Valv
Vexp
Vds
b
a
FIGURE 1 Fowler’s illustration of the measurement of anatomical dead space, plotting exhaled concentration of nitrogen(C) following an inspired breath of 100% oxygen against exhaled volume (Vexp), where Cinsp represents the inspirednitrogen concentration (0%) and Calv represents the alveolar concentration of nitrogen. The vertical dashed line ispositioned so that a and b subsume equal areas, and the intersection of the dashed line with the exhaled volume axisdefines Vds, the anatomical dead space volume. Valv: alveolar volume. The original notation used by Fowler has beenretained. Reproduced from [5] with permission from the publisher.
1706 DOI: 10.1183/09031936.00137614
PHYSIOLOGY IN RESPIRATORY MEDICINE | H.T. ROBERTSON

of nitrogen prior to reaching the plateau that represents the nitrogen concentration in alveolar gas, termedphase III. The rising slope of phase II reflects the length differences among the large airway pathwayswithin the lung, with shorter length conducting airways contributing alveolar gas concentrations in phaseII, and longer regions still contributing 100% oxygen from dead space gas. Fowler’s graphical method toaccount for the dead space contribution from phase II was to place a straight line along phase III and adjusta vertical line within phase II so that the two areas labelled A and B in figure 1 represent equal areas.The exhaled volume identified by the intersection of that vertical line with the volume axis on the abscissaidentifies the dead space, a measurement he termed the physiological dead space, but is now described asthe anatomical dead space or Fowler dead space [6].
The Fowler dead space measurement is dependent on the subject size. An approximation suggested byFowler based on measurements in 45 subjects was that anatomical dead space in cubic centimetres roughlyequalled a subject’s ideal body weight in pounds [5]. While that anatomical dead space is usuallyconsidered a fixed quantity, conducting airway diameter is dependent on lung volume, and when Fowlercompared measurements made at different end-inspiratory lung volumes he noted an average 100 cm3
difference in dead space measurements between the largest and smallest starting volumes. In addition,Fowler demonstrated that the measured dead space would decrease if a 20-s breath-hold preceded theexhalation. He postulated this effect primarily arose because of gas diffusion from alveolar regions backinto the conducting airways during the breath hold. While a subsequent study did not show significantdifferences among Fowler measurements carried out with both nitrogen and helium [7], an influence ofgas diffusivity was later documented as part of a study utilising inspirations of helium (atomic weight 4)and SF6 (molecular weight 146), demonstrating a smaller Fowler dead space with helium compared withSF6 [8]. Gas mixing between small airways and alveolar spaces also takes place as a result of cardiogenicmovement, and this effect could also explain the progressive decrease in Fowler dead space measurementsobserved after a sustained breath hold. The importance of cardiogenic motion in Fowler dead spacemeasurements was documented in an animal study utilising dead space measurements made before andafter cardiac arrest, with a 20% larger dead space measurement obtained after cardiac arrest [9]. Asubsequent study established those cardiogenic oscillations as more important than molecular diffusion inreducing the dead space measured by the Fowler method [10]. Hence cardiogenic lung motion and a moremodest contribution from gas diffusion combine to decrease the measured Fowler dead space comparedwith the actual volume of the respiratory pathway between the lips and the respiratory bronchioles.
Physiological dead spaceIn 1938, in recognition of the problem with obtaining an appropriate estimate of mean PACO2 forcalculations using the Bohr equation, Enghoff proposed the substitution of PaCO2 for the mean PACO2
estimate in the Bohr calculation [11]:
VD=VT ¼ (PaCO2 � PECO2)=PaCO2
Where PECO2 is the PCO2 in the total mixed exhaled breath. It is the Enghoff modification of the Bohrdead space calculation that is in general use today, and is described as the physiological dead space, wherethat term represents the sum of the anatomical dead space and the alveolar dead space, where in currentusage the alveolar dead space component is defined by the difference between the physiological dead spaceand the anatomical dead space [12]. The substitution of PaCO2 for the PACO2 avoided the difficulty ofidentifying an appropriate mean PACO2. However this modification of the Bohr equation added a newcomponent to the dead space estimate that is particularly relevant when the equation is utilised to describegas exchange in disease. The mean PACO2 is always less than mean PaCO2, although this difference is quitesmall in normal lungs. However, just as any gas exchange abnormality will increase the alveolar–arterialO2 difference, the same statement holds for the arterial–alveolar CO2 difference. Hence the physiologicaldead space, incorporating the PaCO2, will always be greater than the classic Bohr dead space, and thephysiological factors determining the arterial–alveolar CO2 difference can be anything that influences theefficiency of gas exchange. Specifically, in contrast to the original Bohr dead space calculation, thephysiological dead space calculation will be sensitive to intrapulmonary shunt and diffusion impairment,and will have a greater sensitivity to alveolar ventilation/perfusion ratio (V′A/Q′) heterogeneity. As theEnghoff modification of the Bohr dead space measurement is sensitive to a range of physiological gasexchange abnormalities, it provides a convenient index of overall gas exchange impairment, but it isimportant to understand that elevated measurements can arise from multiple mechanisms, dependent onthe specific pathophysiology producing the gas exchange impairment.
DOI: 10.1183/09031936.00137614 1707
PHYSIOLOGY IN RESPIRATORY MEDICINE | H.T. ROBERTSON
Shunt contribution to physiological dead spaceShunt increases not only the alveolar–arterial O2 difference but also the arterial–alveolar CO2 differenceand, therefore, increases calculated physiological dead space. Table 1 presents a simple two-compartmentalveolar model without anatomical dead space, containing a shunt compartment and a normal alveolarunit. The alveolar space of the shunt compartment is gas that is in equilibrium with the mixed venous gasesand does not contribute to the exhaled gas mixture. One third of the total perfusion of 4.5 L is delivered tothe shunt unit and all of the ventilation is delivered to the normal lung unit, yielding a V′A/Q′ of 0 for theshunt unit, a V′A/Q′ of 1.5 for the normal unit, and an overall V′A/Q′ for the two units combined of 1.0.Assuming a mixed venous PCO2 of 46 mmHg, and sufficient alveolar ventilation to reduce the mixedarterial CO2 to 40 mmHg, the lower alveolar CO2 in the single ventilated compartment produces a 7.5%contribution to that calculated alveolar dead space (VD/VT−alv), even though the model does not contain anunperfused alveolar unit. While a large shunt is required to achieve this result, note that thisshunt-mediated contribution to the alveolar dead space calculation would be increased by either a decreasein cardiac output or increase in metabolic rate, where either change would increase the mixed venous PCO2.
V′A/Q′ heterogeneity contribution to physiological dead spaceWhile regional ventilation/perfusion heterogeneity does contribute to the classic Bohr dead space, thephysiological dead space is more heavily influenced by V′A/Q′ heterogeneity. Table 2 provides a simplethree-compartment alveolar model of V′A/Q′ heterogeneity, again without anatomical dead space, withV′A/Q′ values of 0.1, 1.0 and 10 in the three compartments to illustrate the effect. As with the example intable 1, the mixed venous CO2 is assumed to be 46 mmHg, and the overall alveolar ventilation is adjustedso that the mixed PaCO2 will be 40 mmHg. For the three compartments, the overall summed ventilation is4.2 L and overall summed perfusion is 4.2 L, with an overall V′A/Q′ of 1.0. Combining the CO2 partialpressures in the ventilated and perfused components of the three units yields a calculated physiologicaldead space of 26% in this simple V′A/Q′ heterogeneity model that includes no unperfused alveolar spacesand no anatomical dead space. While the influence of V′A/Q′ heterogeneity on the alveolar–arterial O2
difference is well known, its influence on CO2 exchange receives little clinical attention, as most patientscan simply increase minute ventilation (V′E) as CO2 exchange becomes less efficient, thereby concealingthe impaired exchange of CO2. Unless a patient requires ventilator support, the requirement for relativelyincreased V′E is never noticed. John West employed a more sophisticated computer model of V′A/Q′heterogeneity to illustrate how disease-relevant degrees of V′A/Q′ heterogeneity would increasephysiological dead space, requiring compensatory increases in V′E to maintain normal PaCO2 values [13].
Physiological dead space in an abnormal lungIn contrast to the simple compartmental models of tables 1 and 2, abnormal lungs ordinarily havecombinations of factors that contribute to the physiological dead space measurement. Figure 2 illustrates adistribution of V′A/Q′ units typical for an abnormal lung that includes increased ventilation/perfusionheterogeneity, shunt and anatomical dead space. Note that a normal lung would have the samebell-shaped distribution of V′A/Q′ units centred on the overall mean V′A/Q′ of 1.0, but the lung unitswould be contained within a V′A/Q′ range between 0.5 and 2.0. To quantitatively characterise the relativeroles of combinations of physiological abnormalities on the physiological dead space measurement requiressome familiarity with features of the multiple inert gas elimination technique (MIGET).
To employ MIGET, partial pressures of six intravenously infused inert gases are measured in arterial andmixed venous blood and mixed expired gas to provide the data required for the mathematical model that
TABLE 1 A simple two-compartment alveolar model containing a shunt compartment and anormal alveolar unit
Compartment 1(shunt)
Compartment 2(ventilated)
Combined output
V′A 0.0 L·min−1 4.5 L·min−1 4.5 L·min−1
Q′ 1.5 L·min−1 3.0 L·min−1 4.5 L·min−1
V′A/Q′ 0.0 L·L−1 1.5 L·L−1 1.0 L·L−1
PaCO2 46 mmHg 37 mmHg 40 mmHgPACO2 46 mmHg 37 mmHg 37 mmHgAlveolar VD/VT 7.5%
V′A: alveolar ventilation; Q′: perfusion; PaCO2: arterial CO2 tension; PACO2: alveolar CO2 tension; VD/VT:alveolar dead space.
1708 DOI: 10.1183/09031936.00137614
PHYSIOLOGY IN RESPIRATORY MEDICINE | H.T. ROBERTSON

describes the distribution of ventilation and perfusion in the lung [14, 15]. The infusion technique with itsassociated model provides a quantitative estimate of the allocation of pulmonary blood flow to shunt, toregions with V′A/Q′ ratios ranging between .001 and 100, and ventilation to inert gas dead space, aparameter that correlates well with anatomical dead space [16]. While this technique provides a uniquemeans of fully characterising gas exchange abnormalities in humans, useful insights into the physiologicaldead space calculation in disease can be obtained from examining the basic inert gas data itself [17, 18].
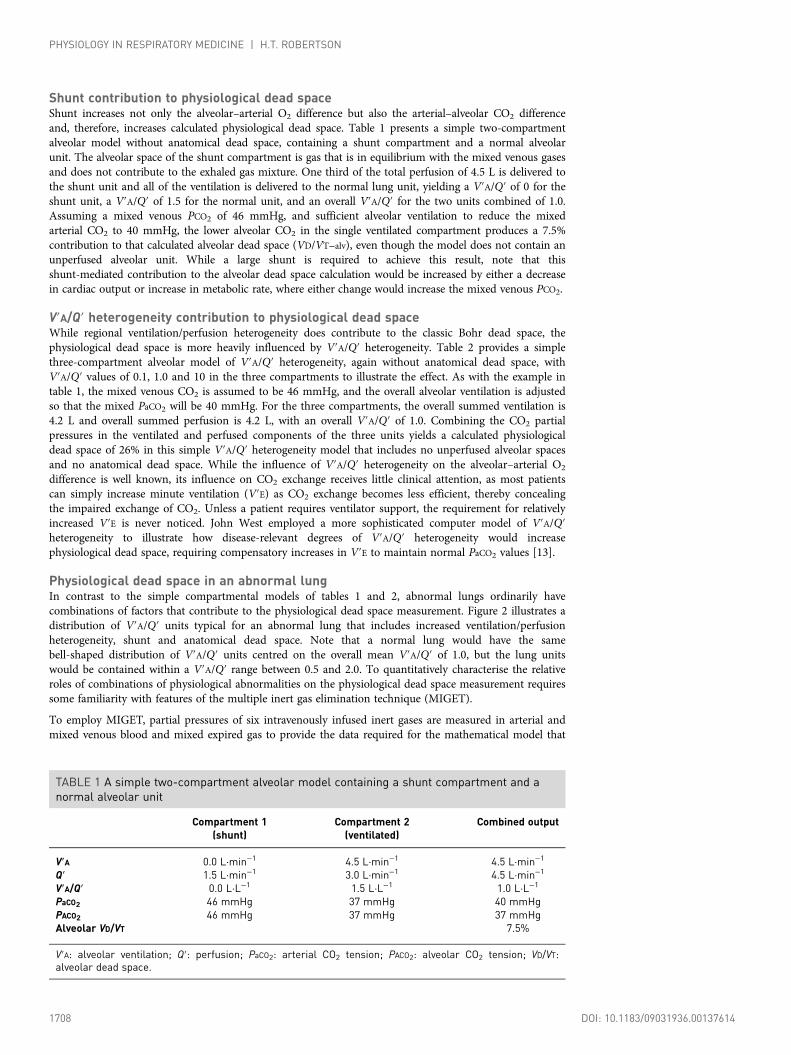
In a publication that provided the insights crucial to the subsequent development of MIGET, FARHI [17]demonstrated that the alveolar or arterial partial pressure of an intravenously infused inert gas could bepredicted based on the solubility of the gas in blood and the V′A/Q′ ratio of the lung unit. For any givenV′A/Q′ value, the predicted arterial (or alveolar) partial pressures of infused inert gases covering a widerange of solubility in blood form a sigmoid curve when plotted against the log of gas solubilities. Thesingle solid line in figure 3 illustrates this retention–solubility diagram for a homogenous lung. If lungunits including a distribution of different V′A/Q′ ratios are combined, the arterial and alveolar lines on thediagram diverge (dashed lines in fig. 3). The vertical line on figure 3 labelled λG represents the solubilityappropriate for CO2, ranging between 2 and 4 mL of gas per mL of blood, depending on the influence ofthe Haldane effect [20]. The intersection of the λG line with the arterial and alveolar curves identifies thetwo partial pressures needed to make an alveolar dead space calculation for the gas with the solubility λG:
VD=VT ¼ (arterial� alveolar)=arterial
TABLE 2 A simple three-compartment alveolar model of V′A/Q′ heterogeneity
Compartment 1(low V′A/Q′)
Compartment 2(normal V′A/Q′)
Compartment 3(high V′A/Q′)
Combined output
V′A 0.2 L·min−1 2.0 L·min−1 2.0 L·min−1 4.2 L·min−1
Q′ 2.0 L·min−1 2.0 L·min−1 0.2 L·min−1 4.2 L·min−1
V′A/Q′ 0.1 L·L−1 1 L·L−1 10 L·L−1 1 L·L−1
PaCO2 42 mmHg 40 mmHg 20 mmHg 40 mmHgPACO2 42 mmHg 40 mmHg 20 mmHg 29.6 mmHgAlveolar VD/VT 26%
V′A: alveolar ventilation; Q′: perfusion; PaCO2: arterial CO2 tension; PACO2: alveolar CO2 tension; VD/VT: alveolar dead space.
15
10
5
0
Freq
uenc
y %
V’A/Q’ ratio
Low V’A/Q’ High V’A/Q’ Dead spaceShunt
0.010 0.1 1.0 10 100 8
FIGURE 2 Allocation of ventilation and blood flow in an abnormal lung that includes shunt, increased alveolarventilation/perfusion ratio (V′A/Q′) heterogeneity and increased anatomical dead space. The lung has an overall V′A/Q′of 1.0 and has the component lung units sorted according to their individual V′A/Q′ ratios. The broad base of thebell-shaped curve reflects substantial overall V′A/Q′ heterogeneity. The bar on the left represents the frequency of lungunits compromising shunt, and the bar on the right represents lung units receiving ventilation but no pulmonary arteryblood flow. Figure reproduced courtesy of R.W. Glenny (Division of Pulmonary and Critical Care Medicine, Universityof Washington, Seattle, WA, USA).
DOI: 10.1183/09031936.00137614 1709
PHYSIOLOGY IN RESPIRATORY MEDICINE | H.T. ROBERTSON
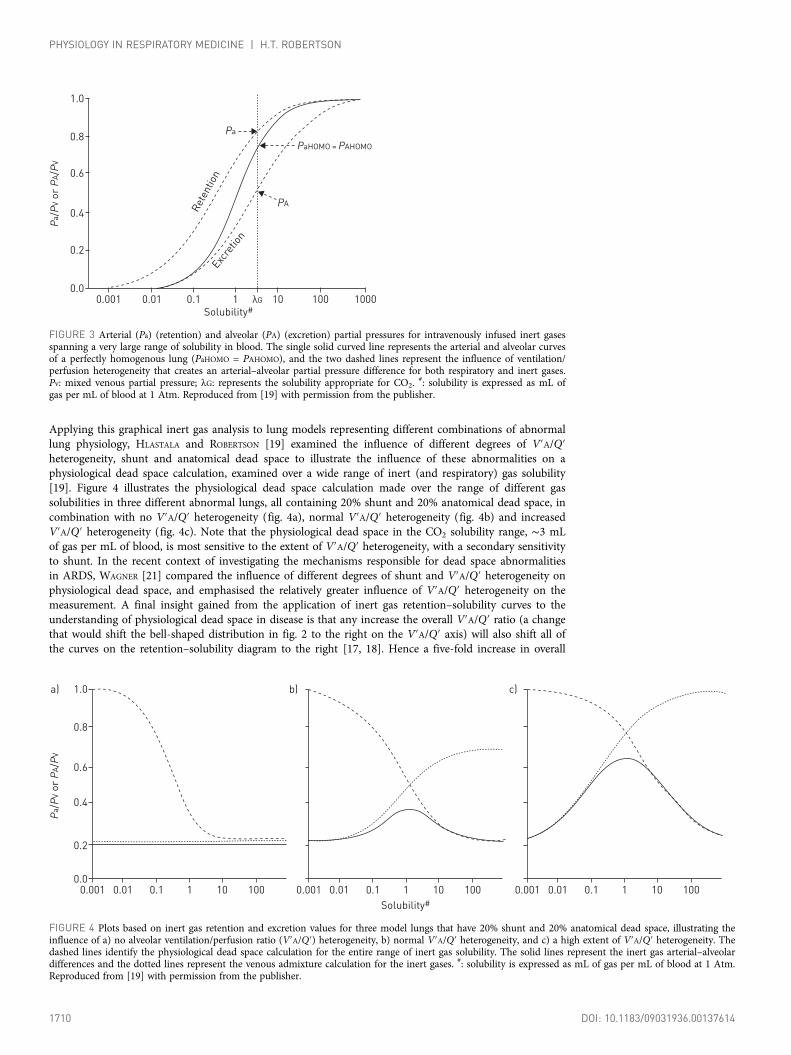
Applying this graphical inert gas analysis to lung models representing different combinations of abnormallung physiology, HLASTALA and ROBERTSON [19] examined the influence of different degrees of V′A/Q′heterogeneity, shunt and anatomical dead space to illustrate the influence of these abnormalities on aphysiological dead space calculation, examined over a wide range of inert (and respiratory) gas solubility[19]. Figure 4 illustrates the physiological dead space calculation made over the range of different gassolubilities in three different abnormal lungs, all containing 20% shunt and 20% anatomical dead space, incombination with no V′A/Q′ heterogeneity (fig. 4a), normal V′A/Q′ heterogeneity (fig. 4b) and increasedV′A/Q′ heterogeneity (fig. 4c). Note that the physiological dead space in the CO2 solubility range, ∼3 mLof gas per mL of blood, is most sensitive to the extent of V′A/Q′ heterogeneity, with a secondary sensitivityto shunt. In the recent context of investigating the mechanisms responsible for dead space abnormalitiesin ARDS, WAGNER [21] compared the influence of different degrees of shunt and V′A/Q′ heterogeneity onphysiological dead space, and emphasised the relatively greater influence of V′A/Q′ heterogeneity on themeasurement. A final insight gained from the application of inert gas retention–solubility curves to theunderstanding of physiological dead space in disease is that any increase the overall V′A/Q′ ratio (a changethat would shift the bell-shaped distribution in fig. 2 to the right on the V′A/Q′ axis) will also shift all ofthe curves on the retention–solubility diagram to the right [17, 18]. Hence a five-fold increase in overall
1.0
0.8
0.6
0.4
0.2
0.0
Pa/P
V or
PA/PV
Solubility#0.001 0.01 0.1 1 10
Excre
tion
Rete
ntio
n
λG 100 1000
PA
Pa
PaHOMO = PAHOMO
FIGURE 3 Arterial (Pa) (retention) and alveolar (PA) (excretion) partial pressures for intravenously infused inert gasesspanning a very large range of solubility in blood. The single solid curved line represents the arterial and alveolar curvesof a perfectly homogenous lung (PaHOMO = PAHOMO), and the two dashed lines represent the influence of ventilation/perfusion heterogeneity that creates an arterial–alveolar partial pressure difference for both respiratory and inert gases.Pv: mixed venous partial pressure; λG: represents the solubility appropriate for CO2.
#: solubility is expressed as mL ofgas per mL of blood at 1 Atm. Reproduced from [19] with permission from the publisher.
1.0a)
Pa/P
V or
PA/PV
0.8
0.6
0.4
0.2
0.0
Solubility#0.001 0.01 0.1 1 10 100
b)
0.001 0.01 0.1 1 10 100
c)
0.001 0.01 0.1 1 10 100
FIGURE 4 Plots based on inert gas retention and excretion values for three model lungs that have 20% shunt and 20% anatomical dead space, illustrating theinfluence of a) no alveolar ventilation/perfusion ratio (V′A/Q′) heterogeneity, b) normal V′A/Q′ heterogeneity, and c) a high extent of V′A/Q′ heterogeneity. Thedashed lines identify the physiological dead space calculation for the entire range of inert gas solubility. The solid lines represent the inert gas arterial–alveolardifferences and the dotted lines represent the venous admixture calculation for the inert gases. #: solubility is expressed as mL of gas per mL of blood at 1 Atm.Reproduced from [19] with permission from the publisher.
1710 DOI: 10.1183/09031936.00137614
PHYSIOLOGY IN RESPIRATORY MEDICINE | H.T. ROBERTSON
V′A/Q′ ratio will shift all of the figure 4 curves five units to the right along the solubility axis. As gassolubility in blood is fixed, any increase in the mean V′A/Q′ value by increased ventilation and/ordecreased perfusion will also increase the calculated physiological dead space. Of note, the influence of asubstantial increase in the mean V′A/Q′ ratio on the physiological dead space measurement was firstdescribed by John West, based on calculations utilising his initial computer model of ventilation/perfusioninteractions in the lung [22].
Physiological dead space during exerciseThe initial studies of gas exchange during a progressive work exercise test by WASSERMAN et al. [23]demonstrated a progressive decrease in physiological dead space from rest to maximal exercise, with anormal response identified as a VD/VT of <20% at maximal effort. This decrease is readily explained bythe progressive increase in tidal volume during the first half of a progressive work exercise test to ∼60% ofthe vital capacity, associated with an anatomical dead space that increases only trivially with the increasein end-inspiratory volume induced by exercise. The decrease in dead space during exercise was originallypostulated to also include improved ventilation/perfusion matching, but measurements of ventilation/perfusion heterogeneity during exercise in normal humans assessed by MIGET have not demonstrated adecrease in overall ventilation/perfusion heterogeneity at low and moderate levels of exercise [24], theperiod in a progressive work exercise test when the VD/VT decreases most appreciably [23]. At the highesttolerated levels of exercise, V′A/Q′ heterogeneity increases modestly [24], and is associated with thewell-known increase in the alveolar–arterial O2 difference. From these MIGET observations, it might beexpected that physiological VD/VT should increase slightly with maximal effort, but increases at maximaleffort are inconsistent and small in comparison with the overall decrease in VD/VT seen early during aprogressive exercise work test.
Can “true” alveolar dead space also exchange CO2?The original interpretation of alveolar dead space was as a compartment in alveolar spaces that received nopulmonary artery perfusion, although the current definition of the term alveolar dead space refers toanything in the physiological dead space that does not include anatomical dead space [12]. Whileventilated alveolar regions without pulmonary artery perfusion (here defined as “true” alveolar dead space)develop following acute pulmonary emboli and should lead to abnormal dead space measurements,physiological dead space as a diagnostic test for pulmonary emboli was found to lack sensitivity for all butthe most massive occlusions. Some of that lack of sensitivity may be secondary to gas exchange providedby the bronchial circulation. Alveolar regions of lung with acute loss of pulmonary artery perfusion canreceive capillary perfusion in variable amounts from connections to the bronchial circulation and draininto the mixed pulmonary venous output to the left atrium [25]. With sustained occlusion, this bronchialartery perfusion of alveolar capillaries can be appreciably augmented [25]. Although the systemic bronchialartery blood perfusing those alveolar capillaries will not be further oxygenated during that second passthrough the lung, it will exchange additional CO2. Hence for segments of embolised lung that only receiveblood from the bronchial arteries, those units function as high V′A/Q′ units from the perspective of CO2
gas exchange, and physiological dead space measurements will underrepresent the true extent ofpulmonary artery occlusion. In the setting of severe bronchiectasis, the elimination of CO2 via thebronchial circulation can provide a clinically significant contribution to overall CO2 exchange, a situationoccasionally recognised following the embolisation of bronchial arteries for acute haemoptysis in patientswith severe bronchiectasis [26].
Interaction between anatomical dead space and V′A/Q′ heterogeneityThe presence of both anatomical dead space and instrument dead space means that the first portion ofeach breath is re-inspired alveolar gas. In the presence of substantial V′A/Q′ heterogeneity, the re-inspiredalveolar gas might be mixed and, therefore, the re-inspired dead space could alter the measuredheterogeneity among the different units of an abnormal lung. The effect of gas re-inspired from awell-mixed “common” dead space in a lung with overall V′A/Q′ heterogeneity was first analysed utilisingthe perspective of the O2–CO2 diagram by ROSS and FARHI [27]. Based on the assumption that there-inspired dead space gas was well mixed, they demonstrated that this influence would reduce themeasured extent of overall V′A/Q′ heterogeneity and hence reduce the measured alveolar dead spacecontribution to the physiological dead space. A second possibility is that the exhaled dead space gasremains “personal”, that is, each V′A/Q′ unit would re-inspire its own exhaled gas, an effect that wouldhave no influence on measured V′A/Q′ heterogeneity. The “common” and “personal” hypotheses for thedistribution of re-inspired gas were modelled by FORTUNE and WAGNER [28] in normal lungs. Theydemonstrated that for normal lungs, the assumption that re-inspired dead space gas was “personal” was anadequate description. However when successive increments of external instrument dead space were addedin an animal study, progressively increasing the proportion of re-inspired gas, PETRINI et al. [29]
DOI: 10.1183/09031936.00137614 1711
PHYSIOLOGY IN RESPIRATORY MEDICINE | H.T. ROBERTSON

demonstrated that there was an appreciable reduction in the extent of externally measured V′A/Q′heterogeneity. Hence with the addition of larger amounts of instrument dead space, the calculated alveolardead space component of the physiological dead space will decrease without changing the actual V′A/Q′distribution within the lung.
Diffusion impairment and physiological dead spaceCarbon dioxide, as a relatively soluble gas in tissue, is not ordinarily considered subject to diffusionimpairment during pulmonary gas exchange. However, the delivery of CO2 to the alveolar spaces frompulmonary capillary blood requires the catalysis of carbonic anhydrase within the erythrocyte, as theprincipal transport of metabolically produced CO2 to the lung is in the form of bicarbonate rather thandissolved CO2 [13]. Since that chemical reaction requires time, a very fast capillary transit time couldpossibly lead to a transpulmonary partial pressure profile identical to that seen with a molecular diffusionimpairment. Model studies have suggested that PCO2 in alveolar gas might be slightly lower that thesystemically sampled PaCO2 if there was decreased alveolar capillary residence time for this reaction [30].In addition, any drug that impairs the action of erythrocyte carbonic anhydrase can increase the PaCO2 toPACO2 difference, a reversible drug effect previously documented in burn patients treated with the oldtopical sulfonamides with substantial carbonic anhydrase inhibitory effects [31]. Acetazolamide, a weakdiuretic currently used to prevent symptoms in high altitude sojourners, acts by inhibition of renalcarbonic anhydrase, and also influences erythrocyte carbonic anhydrase. While inhibition could produce amild arterial–alveolar CO2 gradient in the lung, at recommended clinical doses a measurable influencewould probably only be apparent during heavy exercise [30].
Dead space measurements in ARDSClinical interest in the physiological dead space measurement was reawakened by the publication by NUCKTON
et al. [32] in 2002, linking dead space measurements to prognosis in the ARDS. Physiological dead space wasmeasured in 179 mechanically ventilated ARDS patients on the day of the syndrome onset. The mean deadspace fraction was 0.54 in eventual survivors and 0.63 in patients who succumbed to the syndrome, and therisk of death increased with every 0.05 increment in dead space. The physiological dead space measurementoutperformed all of the previous prognostic measures including traditional measures of oxygenationimpairment, lung compliance and illness severity. The authors postulated that the abnormal measurementwas due to regions with blocked microcirculation that remained ventilated, in short, that the abnormality wassecondary to the creation of “true” alveolar dead space. CEPOVKA et al. [33] performed a subsequent study ofARDS patients ventilated with 6 cm3·kg−1 tidal volumes, demonstrating a nearly identical predictive power ofphysiological dead space measurements, but no significant correlation between pulmonary artery pressuresand the dead space measurements. Further confirmation of the prognostic value of physiological dead spacemeasurement in both acute lung injury (ALI) and ARDS was presented by SIDDIKI et al. [34] utilisingpreviously collected ARDS network data from 1896 patients. While arterial blood gas and ventilatormeasurements were available, the mixed expired CO2 values were not measured, and hence mixed expiredCO2 had to be calculated based on predicted CO2 production rates appropriate for acutely ill mechanicallyventilated patients. Based on the arterial CO2 measurements and predicted mixed expired CO2
concentrations, SIDDIKI et al. [34] found that at both day 1 and day 3 of ARDS diagnosis, patients with a deadspace fraction in excess of 0.50 had a risk for death that increased with every additional 0.10 increment indead space fraction, a risk prediction that almost exactly equalled the predictive power of the complete CO2
measurements on ARDS patients described by NUCKTON et al. [32] and CEPOVKA et al. [33].
Factors contributing to the elevated VD/VT in ARDSBy contrast to the postulated development of unperfused regions of lung in ARDS to explain the elevatedphysiological dead space, both increased V′A/Q′ heterogeneity and shunt are the more likely contributorsto that observation [21, 35]. However, because the gas exchange characteristics of ARDS are multifactorial,it is instructive to review previous studies of ALI performed using MIGET, which provides quantitativemeasurement of the influence of shunt, V′A/Q′ heterogeneity and dead space. COFFEY et al. [36] utilised anoleic acid model of ALI to study the influence of positive end-expiratory pressure (PEEP) on dead spacecalculations, including MIGET measurements to fully characterise the gas exchange responses. After theinjury stabilised in the anaesthetised animals, gas exchange measurements were acquired at randomlyallocated levels of PEEP ranging between 0 and 20 cmH2O. Physiological dead space measurements weremade at each level of PEEP, and the contributions of the components of shunt, V′A/Q′ heterogeneity,anatomical dead space, and alveolar dead space (defined as V′A/Q′ >100) were noted. In this animalmodel, progressive addition of PEEP improved both shunt and V′A/Q′ heterogeneity, with an initialreduction in the physiological dead space. However, higher levels of PEEP increased the Fowler deadspace, accounting for increased ventilation to regions with V′A/Q′ >100, and modestly increased thephysiological dead space. In this animal model with randomly allocated PEEP levels, the high V′A/Q′
1712 DOI: 10.1183/09031936.00137614
PHYSIOLOGY IN RESPIRATORY MEDICINE | H.T. ROBERTSON

regions resolved when PEEP levels were lowered, so the development of very high V′A/Q′ regions withhigh PEEP was the result of PEEP-created increases in Fowler dead space and zone 3 regions of lungrather than ventilated lung regions with microvascular blockade that had been postulated in the humanARDS study of NUCKTON et al. [32].
Three studies utilising MIGET to investigate gas exchange in ARDS patients, all performed in the era whenapplication of high tidal volumes (10–15 cm3·kg−1) was the clinical standard, described variouscombinations of shunt, very low V′A/Q′ regions and increased overall V′A/Q′ heterogeneity, but with aninfrequent incidence of isolated high V′A/Q′ regions among all patients studied [37–39]. The study of RALPH
et al. [38] included data obtained during progressive application of PEEP and did not observe thedevelopment of high V′A/Q′ units at the higher levels of PEEP that had been noted in the dog model ofALI. A current era MIGET study of ARDS patients by FEIHL et al. [40] comparing the gas exchangeresponses to ventilation with tidal volumes of 10 cm3·kg−1 or 6 cm3·kg−1 showed minimal evidence of highV′A/Q′ regions at 10 cm3·kg−1 tidal volumes. With the 6 cm3·kg−1 tidal volumes, the shunt fractionincreased, but evidence for high V′A/Q′ regions had essentially vanished, as evidenced by the very smallretention–excretion differences for the most soluble gases. The patient population in the FEIHL et al. [40]study had an average physiological VD/VT of 65% at both 10 cm3·kg−1 and 6 cm3·kg−1 tidal volumes,and while the lower tidal volume did have a proportionately larger anatomical dead space, the unchangedVD/VT observed at 6 cm3·kg−1 was explained by the higher cardiac output and lower mixed venous PCO2 atthat lower tidal volume. This ARDS patient population, with no demonstrable high V′A/Q′ component totheir gas exchange when receiving 6 cm3·kg−1 tidal volumes, had a higher overall VD/VT than the meanvalues from patients in the NUCKTON et al. [32] and CEPOVKA et al. [33] studies. Hence, MIGET studies ofpatients with ARDS have not revealed any consistent elevation in unperfused alveolar dead space, andindeed the MIGET study performed utilising the current 6 cm3·kg−1 tidal volumes demonstrated a strikingabsence of any high V′A/Q′ component, despite severe elevations in the physiological VD/VT measurement.
A final potential influence on the physiological VD/VT in the most severely ill ARDS patients relates to theoverall V′A/Q′ ratio. For patients with a very low cardiac output who are receiving very high V′E, theoverall V′A/Q′ ratio may exceed 5 L·L−1. An increase in the mean V′A/Q′ ratio will shift all the curves onthe retention–solubility diagram to the right, increasing the physiological dead space measurement, just asa decrease in the mean V′A/Q′ ratio would have the opposite effect. Hence while physiological dead spaceabnormalities in ARDS patients are a compelling indicator of prognosis, the interpretation that abnormalvalues primarily represent the creation of lung parenchyma that is ventilated but not perfused is notconsistent with the human data obtained utilising MIGET. The physiological dead space abnormalities inARDS patients supported with the currently utilised 6 cm3·kg−1 tidal volumes arise primarily as aconsequence of the presence of both shunt and increased low and mid-range V′A/Q′ heterogeneity [40].
Abnormal exercise dead space measurements in heart failureExercise studies done on patients with stable severe heart failure have demonstrated an abnormallyelevated exercise ventilation response that is present at all levels of exertion. The ventilatory equivalent forCO2 (V′E/carbon dioxide production (V′CO2)), calculated as the slope of the two measurements acquiredthroughout a maximal progressive exercise test, has become a standard tool for evaluation of patients withsevere heart failure [41]. The finding of a V′E/V′CO2 >34 L·L−1 is associated with adverse cardiacoutcomes, and the risk increases progressively for patients with additional increases in that measurement[42]. The elevated V′E/V′CO2 in a heart failure patient is primarily attributable to alveolar hyperventilation,as peripheral chemoreceptor hyperactivity, demonstrated by an enhanced ventilation response to hypoxia,is a consistent feature in heart failure patients with significant impairment [43]. However, that augmentedexercise ventilation response in the most impaired patients is also associated with an elevated physiologicaldead space during exercise [44–46]. The hypothesis that this elevated exercise dead space reflected regionsof very high V′A/Q′ in the lung [45] was not consistent with the single MIGET study of heart failurepatients at rest that revealed no increases in high V′A/Q′ regions or increases in inert gas dead space [47].While there are currently no MIGET studies of severe heart failure patients during exercise, an alternativeexplanation for the increased dead space arises as a consequence of the exercise hyperventilation andimpaired cardiac output. The consistent feature of the exercise response in severe heart failure patients isthe exceptionally high ventilation relative to cardiac output during a progressive work exercise test. Themost impaired patients can barely double their cardiac output from rest to maximal effort [48]. Thatdisproportionate increase in exercise ventilation associated with an impaired cardiac output can yieldoverall V′A/Q′ ratios that may approach 10 L·L−1 during exercise in the most impaired patients. Thatincrease in overall V′A/Q′ ratio will shift the retention and excretion curves in figure 3 to the right, andtherefore also shift all the derived curves in figure 4 to the right. As the solubility of CO2 remainsunchanged, the exercise associated V′A/Q′ shift leads to an increased physiological dead spacemeasurement for CO2. Hence a consistent explanation for the elevated dead space measurements seen
DOI: 10.1183/09031936.00137614 1713
PHYSIOLOGY IN RESPIRATORY MEDICINE | H.T. ROBERTSON

during exercise in the most impaired heart failure patients is the abnormally elevated overall V′A/Q′ ratioand its interaction with V′A/Q′ heterogeneity [49, 50].
Abnormal exercise dead space measurements in pulmonary hypertensionWhile normal subjects ordinarily demonstrate at least a 50% reduction in physiological dead space duringheavy exercise compared with their resting measurement, patients with pulmonary hypertension typicallyfail to show any reduction in dead space during exercise, despite demonstrating typical increases in tidalvolume as the exercise intensity increases. The original explanation proposed for this observation was thatexercise produced more high V′A/Q′ regions in the lungs of those patients. A MIGET study of restingpatients with idiopathic pulmonary hypertension (IPH) or chronic thromboembolic pulmonaryhypertension (CTEPH) by DANTZKER et al. [51] revealed a modest increase in both V′A/Q′ heterogeneityand shunt, although resting physiological dead space still remained within normal limits. A follow-upstudy by DANTZKER et al. [52], which included MIGET measurements taken during exercise on sevenpulmonary hypertension patients, found that the extent of overall V′A/Q′ heterogeneity during exerciseremained unchanged. The exercise study patients had a mean resting physiological VD/VT of 42% thatincreased to 44% with maximal effort. The patients showed the characteristic haemodynamic andventilatory responses to exercise seen in patients with severe pulmonary hypertension, with markedexercise hyperventilation and only modest increases in cardiac output leading to exercise mean V′A/Q′ratios in the range of 3–12. As the extent of V′A/Q′ heterogeneity and shunt fraction remained unchangedin the transition from rest to exercise, this study represents the best documented instance of the influenceof an exercise-elevated mean V′A/Q′ ratio on the physiological dead space measurement. While theincrease in mean V′A/Q′ with exercise appears to be an important determinant of the abnormalphysiological dead space measurement in pulmonary hypertension patients, their underlying V′A/Q′heterogeneity and shunt are still important contributors to the exercise measurement abnormality, asnormal subjects at maximal exercise will show at least two-fold increases in mean V′A/Q′, and stillmanifest the normal decrease in VD/VT with progressive exercise.
A recent study by ZHAI et al. [53] comparing exercise physiological dead space measurements in patientswith IPH and CTEPH found higher VD/VT in the CTEPH patients, despite comparable restinghaemodynamic measurements in the two groups. In addition, unlike the IPH patients, the functional statusof the CTEPH patients did not correlate with the extent of physiological dead space abnormality, and theauthors suggested that the balance of factors determining the physiological dead space in CTEPH duringexercise might be different from that in IPH. DANTZKER et al. [51] did not identify an increased inert gasdead space in the three CTEPH patients included in their study, but as the bronchial artery flow increasesdramatically to chronically embolised regions of lung [25], those chronically embolised regions willfunction as high V′A/Q′ units, thereby increasing the V′A/Q′ heterogeneity contribution to the physiologicaldead space calculation. Another explanation for the higher exercise VD/VT observed in the CTEPH patientscould be a relatively higher mean exercise V′A/Q′ in comparison with the IPH patients [53].
Summary and conclusionThe physiological dead space is defined as including anatomical dead space and alveolar dead spacecomponents. In normal subjects, the measurement is primarily determined by the contribution of theanatomical dead space, with a small addition from the alveolar dead space attributable to normalventilation/perfusion heterogeneity. However, in a wide range of pulmonary disease conditions the alveolardead space component becomes more important, and the original concept that it reflects the influence ofregions of lung parenchyma receiving no pulmonary artery perfusion is never an adequate explanation.Any of the physiological mechanisms contributing to an increased arterial–alveolar CO2 difference willincrease the measured physiological dead space, but ordinarily the extent of overall V′A/Q′ heterogeneity isthe most important contributor. In addition, in the presence of increased V′A/Q′ heterogeneity, anystimulus increasing the overall mean V′A/Q′, such as extreme hyperventilation with exercise, will furtherincrease the physiological dead space measurement.
References1 Bohr C. [Ueber die Lungenathmung]. Skand Arch Physiol 1891; 2: 236–268.2 Krogh A, Lindhard J. The volume of the dead space in breathing and the mixing of gases in the lungs of man.
J Physiol 1917; 51: 59–90.3 Jones NL, Robertson DG, Kane JW. Difference between end-tidal and arterial PCO2 in exercise. J Appl Physiol
Respir Environ Exerc Physiol 1979; 47: 954–960.4 Suarez-Sipmann F, Santos A, Böhm SH, et al. Corrections of Enghoff’s dead space formula for shunt effects still
overestimate Bohr’s dead space. Respir Physiol Neurobiol 2013; 189: 99–105.5 Fowler WS. Lung function studies; the respiratory dead space. Am J Physiol 1948; 154: 405–416.6 Klocke RA. Dead space: simplicity to complexity. J Appl Physiol 2006; 100: 1–2.
1714 DOI: 10.1183/09031936.00137614
PHYSIOLOGY IN RESPIRATORY MEDICINE | H.T. ROBERTSON

7 Bartels J, Severinghaus JW, Forster RE, et al. The respiratory dead space measured by single breath analysis ofoxygen, carbon dioxide, nitrogen or helium. J Clin Invest 1954; 33: 41–48.
8 Crawford AB, Makowska M, Paiva M, et al. Convection- and diffusion-dependent ventilation maldistribution innormal subjects. J Appl Physiol 1985; 59: 838–846.
9 Engel LA, Menkes H, Wood LD, et al. Gas mixing during breath holding studied by intrapulmonary gas sampling.J Appl Physiol 1973; 35: 9–17.
10 Fukuchi Y, Roussos CS, Macklem PT, et al. Convection, diffusion and cardiogenic mixing of inspired gas in thelung; an experimental approach. Respir Physiol 1976; 26: 77–90.
11 Enghoff H. [Volumen inefficax. Bermekungen zur Frage des shadlichen Raumes. Upsala Laekarefoeren]. Foerh1938; 44: 191–218.
12 West JB. Respiratory Physiology – The Essentials. 6th Edn. Philadelphia, Lippincott, Williams & Wilkins, 200013 West JB. Causes of carbon dioxide retention in lung disease. N Engl J Med 1971; 284: 1232–1236.14 Wagner PD, Naumann PF, Laravuso RB. Simultaneous measurement of eight foreign gases in blood by gas
chromatography. J Appl Physiol 1974; 36: 600–605.15 Wagner PD, Saltzman HA, West JB. Measurement of continuous distributions of ventilation-perfusion ratios:
theory. J Appl Physiol 1974; 36: 588–599.16 Dueck R, Wagner PD, West JB. Effects of positive end-expiratory pressure on gas exchange in dogs with normal
and edematous lungs. Anesthesiology 1977; 47: 359–366.17 Farhi LE. Elimination of inert gas by the lung. Respir Physiol 1967; 3: 1–11.18 West JB, Wagner PD, Derks CM. Gas exchange in distributions of VA-Q ratios: partial pressure-solubility
diagram. J Appl Physiol 1974; 37: 533–540.19 Hlastala MP, Robertson HT. Inert gas elimination characteristics of the normal and abnormal lung. J Appl Physiol
Respir Environ Exerc Physiol 1978; 44: 258–266.20 Robertson HT, Hlastala MP. Elevated alveolar PCO2 relative to predicted values during normal gas exchange.
J Appl Physiol Respir Environ Exerc Physiol 1977; 43: 357–364.21 Wagner PD. Causes of a high physiological dead space in critically ill patients. Crit Care 2008; 12: 148.22 West JB. Ventilation-perfusion inequality and overall gas exchange in computer models of the lung. Respir Physiol
1969; 7: 88–110.23 Wasserman K, Van Kessel AL, Burton GG. Interaction of physiological mechanisms during exercise. J Appl
Physiol 1967; 22: 71–85.24 Wagner PD, Gale GE, Moon RE, et al. Pulmonary gas exchange in humans exercising at sea level and simulated
altitude. J Appl Physiol 1986; 61: 260–270.25 Deffebach ME, Charan NB, Lakshminarayan S, et al. The bronchial circulation. Small, but a vital attribute of the
lung. Am Rev Respir Dis 1987; 135: 463–481.26 Henig NR, Glenny RW, Aitken ML. A hypertrophied bronchial circulatory system may participate in gas
exchange. Lancet 1998; 351: 113.27 Ross BB, Farhi LE. Dead-space ventilation as a determinant in the ventilation-perfusion concept. J Appl Physiol
1960; 15: 363–371.28 Fortune JB, Wagner PD. Effects of common dead space on inert gas exchange in mathematical models of the
lung. J Appl Physiol 1979; 47: 896–906.29 Petrini MF, Robertson HT, Hlastala MP. Interaction of series and parallel dead space in the lung. Respir Physiol
1983; 54: 121–136.30 Swenson ER, Maren TH. A quantitative analysis of CO2 transport at rest and during maximal exercise. Respir
Physiol 1978; 35: 129–159.31 White MG, Asch MJ. Acid-base effects of topical mafenide acetate in the burned patient. N Engl J Med 1971; 284:
1281–1286.32 Nuckton TJ, Alonso JA, Kallet RH, et al. Pulmonary dead-space fraction as a risk factor for death in the acute
respiratory distress syndrome. N Engl J Med 2002; 346: 1281–1286.33 Cepkova M, Kapur V, Ren X, et al. Pulmonary dead space fraction and pulmonary artery systolic pressure as early
predictors of clinical outcome in acute lung injury. Chest 2007; 132: 836–842.34 Siddiki H, Kojicic M, Li G, et al. Bedside quantification of dead-space fraction using routine clinical data in
patients with acute lung injury: secondary analysis of two prospective trials. Crit Care 2010; 14: R141.35 Robertson HT, Swenson ER. What do dead-space measurements tell us about the lung with acute respiratory
distress syndrome?. Respir Care 2004; 49: 1006–1007.36 Coffey RL, Albert RK, Robertson HT. Mechanisms of physiological dead space response to PEEP after acute oleic
acid lung injury. J Appl Physiol Respir Environ Exerc Physiol 1983; 55: 1550–1557.37 Dantzker DR, Brook CJ, Dehart P, et al. Ventilation-perfusion distributions in the adult respiratory distress
syndrome. Am Rev Respir Dis 1979; 120: 1039–1052.38 Ralph DD, Robertson HT, Weaver LJ, et al. Distribution of ventilation and perfusion during positive
end-expiratory pressure in the adult respiratory distress syndrome. Am Rev Respir Dis 1985; 131: 54–60.39 Mélot C, Lejeune P, Leeman M, et al. Prostaglandin E1 in the adult respiratory distress syndrome. Benefit for
pulmonary hypertension and cost for pulmonary gas exchange. Am Rev Respir Dis 1989; 139: 106–110.40 Feihl F, Eckert P, Brimioulle S, et al. Permissive hypercapnia impairs pulmonary gas exchange in the acute
respiratory distress syndrome. Am J Respir Crit Care Med 2000; 162: 209–215.41 Coats AJ. Why ventilatory inefficiency matters in chronic heart failure. Eur Heart J 2005; 26: 426–427.42 Ponikowski P, Francis DP, Piepoli MF, et al. Enhanced ventilatory response to exercise in patients with chronic
heart failure and preserved exercise tolerance: marker of abnormal cardiorespiratory reflex control and predictor ofpoor prognosis. Circulation 2001; 103: 967–972.
43 Ponikowski P, Chua TP, Anker SD, et al. Peripheral chemoreceptor hypersensitivity: an ominous sign in patientswith chronic heart failure. Circulation 2001; 104: 544–549.
44 Myers J, Salleh A, Buchanan N, et al. Ventilatory mechanisms of exercise intolerance in chronic heart failure.Am Heart J 1992; 124: 710–719.
45 Wasserman K, Zhang YY, Gitt A, et al. Lung function and exercise gas exchange in chronic heart failure.Circulation 1997; 96: 2221–2227.
DOI: 10.1183/09031936.00137614 1715
PHYSIOLOGY IN RESPIRATORY MEDICINE | H.T. ROBERTSON
46 Johnson RL Jr. Gas exchange efficiency in congestive heart failure II. Circulation 2001; 103: 916–918.47 Adnot S, Radermacher P, Andrivet P, et al. Effects of sodium-nitroprusside and urapidil on gas exchange and
ventilation-perfusion relationships in patients with congestive heart failure. Eur Respir J 1991; 4: 69–75.48 Agostoni PG, Wasserman K, Perego GB, et al. Non-invasive measurement of stroke volume during exercise in
heart failure patients. Clin Sci 2000; 98: 545–551.49 Robertson HT. Gas exchange consequences of left heart failure. Compr Physiol 2011; 1: 621–634.50 Robertson HT. Excess ventilation during exercise and prognosis in chronic heart failure. Am J Respir Crit Care
Med 2012; 185: 227.51 Dantzker DR, Bower JS. Mechanisms of gas exchange abnormality in patients with chronic obliterative pulmonary
vascular disease. J Clin Invest 1979; 64: 1050–1055.52 Dantzker DR, D’Alonzo GE, Bower JS, et al. Pulmonary gas exchange during exercise in patients with chronic
obliterative pulmonary hypertension. Am Rev Respir Dis 1984; 130: 412–416.53 Zhai Z, Murphy K, Tighe H, et al. Differences in ventilatory inefficiency between pulmonary arterial hypertension
and chronic thromboembolic pulmonary hypertension. Chest 2011; 140: 1284–1291.
1716 DOI: 10.1183/09031936.00137614
PHYSIOLOGY IN RESPIRATORY MEDICINE | H.T. ROBERTSON