de l’évaluation,de la prospective -...
82
Transcript of de l’évaluation,de la prospective -...


> if you are looking for statistical informationTelephoneor written inquieries
Centre de documentation61-65, rue Dutot75732 Paris Cedex 15
Telephone +33 (0) 1 55 55 73 58 [email protected]
> if you wish to peruse a publication by the Direction de l’évaluation,de la prospective et de la performanceonlinewww.education.gouv.fr
> if you wish to obtain publications by theDirection de l’évaluation,de la prospective et de la performance
Catalogues, purchase, subscription
DEPPDépartement de la valorisation et de l’édition61-65, rue Dutot75732 Paris Cedex 15
Sales: +33 (0) 1 55 55 72 04Fax: +33 (0) 1 55 55 72 29
This document is published by The Ministry of Education,Higher Educationand ResearchDirection de l’évaluation,de la prospectiveet de la performance61-65, rue Dutot75732 Paris Cedex 15
Publication DirectorDaniel Vitry
Chief EditorPaul Esquieu
AuthorsJean-Paul CailleLaurent DaveziesSéverine Dos Santos
Sébastien DurierJérôme FabreFabienne GibertPauline GirardotMartine JeljoulFlorence LégerSylvie LemaireBenoît LeseurIsabelle MaetzClaude MalègueFrançoise MartinezSylvaine PéanDelphine PerelmuterPascale Poulet-CoulibandoDanièle ProuteauThierry RocherFabienne RosenwaldVéronique SandovalAlexia StéfanouAnnick Vialla
Vanessa ViardSaïd Yacoub
DEPP/Département de la valorisation et de l’éditionEditorial DeskMarie ZilbermanLayoutSolange Guégeais
PrintingDEPP/DVE
DEPP/DVE Salesévelyne Deslandes61-65, rue Dutot75735 Paris Cedex 15
TranslationAGS Traduction

The state of Education


This sixteenth edition of The state of Education is once again an opportunity to assess the way our education system operates as well as the resources available and results achieved.It illustrates the remarkable progress made in terms of democratisation of the access to education and level of qualifica-tion. It also indicates the direction needed to be taken to reach the more ambitious targets that the nation has the right to expect of its education system.
Helping all students acquire basic knowledge, encouraging their success, notably that of children experiencing difficul-ties at an early age, providing collège and lycée pupils and higher education students with the right guidance in terms of courses best suited to their future careers: these legitimate ambitions are at the heart of the different projects that I have decided to implement, and are reflected in concrete measures at the beginning of the 2006 school year.
The revival of priority education, development of merit-based scholarships and wider access to elite courses should all lead to the enhancement of “equal opportunities”, which is both a republican requirement and a pre-requisite to main-tain or revive our confidence in the education system.
The impact of certain measures implemented will be perceived in the 2007 issue of The state of Education; others will take two, three or even four years to come to fruition. They all reflect the shared desire to educate all our pupils and all our students for a better integration into the modern world, in the best possible conditions.
Gilles de Robien
Foreword

The implementation of the LOLF (Constitutional bylaw on budget acts), the development of indicators and comparative surveys on an international scale (OECD, EUROSTAT, UNESCO), the definition of common objectives for European educa-tion systems (for example, those set in 2000 in Lisbon) and the vote on a new law on orientation and programmes for the future of the Education system in April 2005, incite a focus on education and training efforts, on the results achieved and improvements still to be made.
Since the first 1991 edition, the means devoted to our education system, its activity, operation and results, both internal and external, have constituted the analytical structure of 30 summary indicators brought together in The State of Education, the objective being to provide evolution throughout time and geographical comparisons (nearly half of the indicators provide international comparisons).
This new edition is in line with the previous ones, focusing on the live issues such as equal opportunities, success for all pupils, notably in terms of acquiring basic knowledge, the selection of an appropriate education course, leading to the best possible professional integration. It takes into consideration the new context relative to the implementation of the LOLF, which concerns the efficiency of the State budget, while adopting a more comprehensive approach, covering the entire spectrum of the education system. Thus, whenever deemed relevant, this edition points out the indicators selected in the LOLF in order to assess the performance of the State. Similarly, within the context of international comparisons, an entire page is devoted to the European objectives of Lisbon.
The quality, accuracy and relevance of these indicators are based on the existence of an information system for which every effort must be made to ensure constant adjustment and improvement. In this respect, this sixteenth edition benefits from several renewed or enhanced sources of information:
– the Education account, the reorganisation of which has enabled the better understanding, in mainland France and over-seas départements, of all the expenditure of the State, regional authorities, private companies and households;– new evaluations-assessments carried out at the end of primary school and collège;– INSEE’s Employment Survey, which in particular provides quarterly information on the situation of individuals, notably young people who have recently left the education system, comparing their studies and qualifications with their profes-sional status.– the results from cross-sectional monitoring of pupils (“panels”).
Increased resources for school populations which are on the decline
In 2005, France devoted 117.9 billion Euros to its education system as a whole (mainland France + overseas départements), i.e. 6.9% of the GDP (gross domestic product), which represents a total of 1,880 Euros per inhabitant or 6,970 Euros per pupil or student. Continuing education excluded, this financial effort positions us above the average of OECD countries (6.3% compared with 5.9% in 2003).
The education expenditure share of the GDP increased significantly in the early 1990s, reaching 7.6% in 1993 as opposed to 6.4% in 1980. Since then, the trend has slowly and gradually reversed; education expenditure has continued to rise though less rapidly than the GDP, which until 2000 saw growth in excess of 3% per annum, and slightly less thereafter (indicator 01).
The state of Education
� I 5 The state of Education no. 16 [2006 issue]

Since 1980, education expenditure has increased by 83%, on a constant price basis, developing at an annual rate greater than that of the GDP (2.4% compared with 2.1%). With the exception of higher education, this growth is due to the cost per pupil more than the increase in the number of pupils and students. If all levels of education are combined, this unit cost has risen by 70% since 1980, because of the particular development of relatively more expensive courses in the second cycle of secondary education and in higher education, and above all because of improvements in educa-tion conditions for pupils and in enhanced career prospects and upgraded salaries of teachers.
Although the average expenditure per pupil in the primary and secondary sectors rose by 76% and 62% respectively over this period, the average expenditure per higher education student grew by only 29%, as the significant increase in student numbers until 1996 absorbed most of the additional funds devoted to this sector.In primary education, stability in the number of teachers combined with a fall in pupil numbers resulted in a substantial improvement in class sizes up to 2002 (indicator 16).
Secondary education has not benefited from such a favourable trend, but receives relatively high levels of resources when compared with other comparable countries. The high staffing levels characteristic of our secondary sector, reinforced by the current demographic downturn, result in particular from the fact that a large number of teaching hours (on average one third, and half in lycées) are provided to smaller groups of pupils as opposed to whole classes (indicator 19).The share of higher education in the education expenditure has risen since 1980 (indicator 23), due to the sharp in-crease in student numbers, while unit costs have not developed as much as in the primary and secondary school sec-tors. In 2005, the average cost per student is hardly higher than that of a secondary school pupil (8,940 Euros compared with 8,650), and the cost of a university student is significantly lower than that of a lycée pupil (7,210 Euros compared with over 10,000).
The State is predominant in the funding of education expenditure, with a 63% ratio in 2005, 55.5% of which comes from the Ministry of national Education. Its budget is mainly used to pay staff (nearly 1.3 million in January 2006), whose num-bers and, more importantly, structure have evolved considerably. Thus, more than 85% of public sector teachers are now professeurs des écoles in primary education, and nearly 75% agrégés (associate teachers) or certifiés (certified) in the secondary sector (indicators 02 and 03).Local authorities contributed 21% to the “initial” funding of education in 2005 compared with 14% in 1980, this share increasing to 40% in the primary sector, where local communes bear the cost of non-teaching personnel expenditure as well as operating and investment expenditure (indicator 15).
Significant progress in the level of education up to the mid-1990s….The education career of a generation currently enrolled in our education system, or who have just dropped out, can be summed up as follows:– 6% of young people drop out of initial education without qualification (in the sense of the French classification of education levels) – 70% reach the baccalauréat level (level IV)– 62% obtain the baccalauréat

– approximately 50% go onto higher education– a little over 40% obtain a higher education qualification
Our education system experienced three decades of substantial quantitative development: the 1960s and 1970s saw con-siderable growth in pre-school attendance and access to secondary education, and from the mid-1980s, a massive influx of collège pupils into the second cycle of secondary education with the aim of taking a general, technological or vocational baccalauréat, and then moving onto higher education.
Although the objective in the 1980s of bringing 80% of a generation entering the terminale year of secondary education, to baccalauréat level, was not met, this target led to the spectacular development, over 30 points, of this access rate in the space of a decade: from under 40% to 70% in 1995 (indicator 20).Similarly, important progress was made in ensuring all young people obtain a minimum level of qualification at the end of their studies.
Nowadays, approximately 50,000 young people, i.e. approximately 6% of their generation, leave the education system without reaching CAP (Vocational Training Qualification) or BEP (Certificate of Technical Education) level, or without being admitted to a general and technological lycée. However, this figure was above 30% in the 1960s (indicator 09).
Therefore, the education system has made it possible for the younger generations to achieve much higher levels of edu-cation than their elders. Over half of those born at the end of the 1970s went on to higher education, 8 out 10 times suc-cessfully by obtaining a qualification. Thus, 40% of young people are higher education graduates, compared with 30% for the generations of the late 1960s (indicator 08). For those who entered higher education, an average failure rate of 20% is observed (i.e. 11% of a generation), confirmed by the results of INSEE’s Employment survey and by information collected on the education career of young people within the framework of the DEPP’s 1989 panel. However, while 11% of general baccalauréat holders who enter higher education drop out without a higher education qualification, this figure reaches one third of technological baccalauréat holders and two thirds of vocational baccalauréat holders (indicator 27).
In the last decade, most indicators showed a stabilisation. The trend towards a sustained lengthening in the duration of studies has now ceased. The total duration of schooling, from pre-school to the end of higher education, has stabilised at around 19 years (indicator 04). Almost all members of a generation now complete collège education but after a period at the end of the 1980s during which there was a pronounced trend in favour of general courses, collège pupils more fre-quently turned to vocational training, particularly in agriculture or as apprentices (indicator 18). The access rate of a gen-eration to baccalauréat level has stopped increasing and remains stable at around 70%, including 6% in courses outside the national Education system (indicator 20). Among young baccalauréat holders, whose share of a generation is stable at around 62%, only a little more than half have completed general courses. Access to and orientation toward higher educa-tion is affected by this new balance, by the increasing proportion of vocational baccalauréat holders, who do not intend to continue studying, but also by the fact that, to a certain extent, general and technological baccalauréat holders have been less interested in general university courses in the last few years (indicator 24). Therefore, in the early 2000s, a slight downturn in the schooling rates in higher education was observed, at least amongst 19 to 21 year-olds (indicator 26).
� I 7 The state of Education no. 16 [2006 issue]
Democratisation of access to the baccalauréat and higher educationSuccessive rises in schooling figures have unquestionably favoured the democratisation of our education system.Secondary education has gradually become open to all, in collèges during the 1960s and then in lycées by the end of the 1980s. Among younger generations, nearly half of the children of working-class parents obtain a baccalauréat, and are often the first to have achieved this in their family, compared with only 10% in the fifties.Thanks in particular to the development of welfare assistance for students (indicator 06), more and more young people have been able to enter higher education. Within a decade, the chances of becoming a student have more than doubled, and even tripled for the children of working-class parents, whose relative handicap has been diminished (indicator 10).
…but significant differences in educational success remain, especially socio-economic onesThe development of schooling and the opening up of higher levels of education to new categories of pupils have not removed the profound differences in education knowledge and success, which continue to distinguish pupils and are often related to their social origin or family background.
So that the education system can accomplish its fundamental task of passing on knowledge and skills, the possibility of com-paring several approaches to pupils’ education is now available at national and international level. Thus, the “Programme for International Student Assessment” (PISA) provided, in 2000 and 2003, a range of results in the field of written comprehension, mathematical literacy and scientific literacy for 15 year-olds. These results demonstrate that young French people show av-erage skills compared with other OECD countries in written comprehension and scientific literacy, with an improvement on the 2000 and 2003 performance of our pupils, and slightly above average in mathematics (editions no. 12 and 13 of the state of Education). Regarding reading skills, the results of the 2003 PISA survey reveal that 6% of young French people may be able to read in the technical sense of the word, but experience severe comprehension difficulties, and that 11% find it difficult to relate a simple text to everyday knowledge, i.e. a total of 17% compared with an average of nearly 20% for all European Union countries (indicator 14).
This worrying observation of reading difficulties is confirmed during national defence preparation days (JAPD): they affect one out of ten teenagers, and are particularly severe for half of them. These difficulties obviously relate primarily to teenagers with a lower education level (indicator 07).
The new evaluations-assessments implemented at the end of primary education and the end of collège depending of the re-quirements of the programmes, provide a further insight into this diagnostic, and highlight the existence of persistent learning problems for a minority of pupils.This is obvious for one out of six to seven pupils who show very poor or non-existent oral and written comprehension skills at the end of their primary education, or general skills at the end of collège. Conversely, these evaluations show that only one out of three or four pupils shows a satisfactory or very satisfactory command of the expected skills required for the programmes of these classes.These inequalities in success contain a strong social component. The children of managers achieve higher scores, on aver-age, at national assessments than those of working-class parents. Similarly, at the end of collège education, written and oral

comprehension appears poorer in priority education establishments, and the success rate in the written examinations of the brevet significantly lower in the 249 collèges catering for a particularly fragile or underprivileged school population (indicator 05).
Conversely, children from more privileged backgrounds benefit more significantly from their higher academic skills through the application of far more targeted options in terms of education career, which allow them to pursue the academic cours-es most favourable to their future social and professional success.At the baccalauréat, their over-representation appears to peak in scientific courses (S), as well as preparatory classes for Grandes écoles (CPGE) and healthcare courses at the beginning of higher education, while the children of working-class parents are more likely to follow technological and vocational courses: preparation for CAP, BEP and vocational baccalau-réat in secondary education, preparation for BTS (Higher Technician Certificate) in higher education (indicators 10 and 25). The risk of dropping out without a qualification or just the brevet remains much higher in 2005 for the children of a working-class background than for those of managers, technicians or company directors (23% compared with 7% ; indicator 10).
Although boys and girls tend to follow distinct education careers, the differences in this case are of another nature. Taking advantage of their greater skills in French, girls reach higher education levels than boys. While in the majority amongst baccalauréat holders and students, they continue to favour literary and tertiary courses, leaving boys to predominate in the more profitable scientific and industrial courses (indicator 13).
Recent trends and possibility of improvementDemographic recovery and increase in school population, in both primary and higher educationDue to the lack of progress in terms of number of pupils in the past decade or so, the decrease in the number of births registered in France, more moderate than in other countries like Germany or Italy, has resulted in a general downturn in school populations, which had even started to affect higher education from 1995 to 1998. With the exception of the 1980-1982 generations, each of them having 800,000 young people, the generations enrolled from primary school to university only amounted to 700,000 to 750,000 young people. The number of births even came close to the 700,000 mark in 1993 and 1994. The last few years, however, have seen a significant demographic recovery, with over 760,000 annual births from 2000 to 2005. Breaking away from the previous trend, the total number of pupils, apprentices and students has been in-creasing again, with the primary sector benefiting from the demographic recovery and the higher education sector from a higher rate of enrolment, notably foreign students (indicator 26 and appendix).
Reduced academic failure but more serious consequences for the future of young people
At the same time as the improvement in their level of education and qualification, academic failure, resulting in a dropping out of initial education without a qualification, has become less frequent among younger generations. According to the accepted definition in France, leaving the education system “without a qualification” means a break in study before the final year of preparation for the Vocational Training Qualification (CAP) or Certificate of Technical Education (BEP), or just after collège. In 2005, only 6% of young people (50,000) left without a qualification compared with one third in 1965, one out
� I 9 The state of Education no. 16 [2006 issue]

of five in 1975 and one out of eight in 1985. According to European and international indicators taking into consideration the qualifications of the second cycle of secondary education, 17% of the French 20 to 24 year-old were poorly qualified in 2005 (i.e. approximately 130,000 per generation): they have obtained no CAP, or BEP, or baccalauréat qualification (indicator 14). This proportion has continued to diminish, from 23% in 1996 and over 30% in the late seventies.
In France, as in most developed countries, access to qualifications and degrees tends to protect young people from the risk of unemployment (indicator 11). However, France is in a rather less favourable situation than other countries in terms of professional integration. The frequency of the combined work and study courses is not as high and conditions of access to employment of young people having completed their initial education tend to be oversensitive to the evolu-tion of the economy. Young people dropping out without a qualification were the first affected by the substantial rise in unemployment since the late 1970s, and their situation has become particularly worrying in the last few years, with unemployment rates reaching and even exceeding 40% of the active 15 to 24 year-old population (indicators 11, 22).
Guaranteeing a common base of knowledge and skills for everyone
Our education system must focus on the situation of lesser qualified people, who we know have experienced learning difficulties from an early age, come from underprivileged backgrounds, often from immigrant families, and whose condi-tions of access to employment will be particularly difficult. For those dropping out of their initial education with relatively few qualifications, continuing education is only partially assuming its role as the “school of the second chance”. While the Groups of Secondary Education Establishments (GRETA) mainly admit applicants aiming at obtaining a CAP, the Vali-dation of Skills Acquired Through Experience (VAE), implemented by the law on social modernisation of January 2002, is designed for more qualified employees, nearly half of them aiming at obtaining a BTS (indicator 30).
The education system must, first and foremost, guarantee that everyone acquires a “common base” of knowledge and skills.
This principle was established by the orientation Law for the future of Education of 23 April 2005, defining this common base as being “crucial acquisitions to successfully complete an education, continue training, build a future and suc-ceed in life in general”. The decree of 11 July 2006 specified the content, structured around 7 sectors.This ambition requires the implementation of measures to prevent the difficulties experienced by certain pupils in their early education years, that they rarely manage to overcome. Among these measures, the reform on learning how to read (as per the instructions of the memo of 3 January 2006) should provide young pupils with the basic knowledge necessary for the command of the written word. Personalised educational success programmes (PPRE), which will be developed first of all at the crucial stages of schooling (last year in cycle 2 - CE1 – and sixième), should enable these pupils to overcome their difficulties before continuing their studies in optimal conditions. Finally, the revival of priority education, based on the notion that “the priority education map had to be reviewed, by focusing resources on a number of urgent situations”, aims at providing much more to those who really need it.
The revival of priority education, announced on 8 February 2006, distinguishes three levels: EP1, EP2 and EP3. EP1 level includes 249 ambition réussite (objective success) networks, in which additional and personalised help will be provided to pupils experiencing difficulties: support within the framework of personalised educational success

programmes (PPRE), organisation of courses and smaller groups for difficult pupils etc. To accomplish these tasks, 1,000 additional experienced teachers will be provided at the start of the 2006 school year as well as 3,000 educational assistants in charge of helping with homework and school support. In addition to the command of fundamental knowl-edge (including the command of a foreign language, certified by reaching pre-defined levels within a common European frame of reference), the education system must also prepare young people to enter the labour market, by enabling them to gradually build a professional project and acquire the necessary skills. To this end, the implementation of adapted education courses, notably junior apprenticeship, aims at further reducing the annual number of dropouts without a qualification.
Improving the guidance and integration of young people into higher education
In addition to young people with severe difficulties and the least qualifications, there is another important issue relating to the quality and efficiency of our education system, regarding those who enter higher education, both in terms of quantity (what resources for higher education, how many graduates do we need and should their proportion be raised to 50% for the upcoming generations?) and quality (improving the current conditions for guidance, curriculum and therefore success in the different courses, as well as conditions of entry onto the labour market).
Regarding the quantity aspect, the fact that 70% of young people reach baccalauréat level, 62% obtaining the baccalauréat, nearly half entering higher education and a little over 40% obtaining a qualification, illustrates the different possibilities of increasing the proportion of young people completing their initial education by obtaining a higher education qualification.
At international level, the OECD publishes success rates in obtaining “tertiary” qualifications, i.e. higher education, by distinguishing level 5A (bachelor’s degree, master’s degree, engineer qualification etc.) and 5B (DUT, BTS, paramedical or social qualification etc.). This data presents a serious compatibility issue, due to “double counts” between accessing and obtaining tertiary A and tertiary B qualifications: graduates from tertiary B can, for instance, continue on a type A course and graduate. On average among OECD countries, one third of the population old enough to graduate successfully completes a type A tertiary education: this proportion varies to over 40% in Denmark, Australia, Finland or Poland, 20% in Germany, Austria and the Czech Republic. With a success rate of 26%, France is below the average of OECD countries. However, France has a higher proportion (19.3%), like Spain, Ireland, Japan and the UK, of short higher education quali-fications (5B: DUT, BTS, etc.), than the average of OECD countries (9.2%). If both rates are added, the total proportion of French graduates reaches 45.3%, greater than the national calculation due to the “double counts”, for example for stu-dents having obtained a DUT and continuing to obtain a licence. This proportion also positions France slightly above the OECD average (44%).
Consequently, France has largely bridged the gap with other developed countries. Its progress is obvious in light of the comparison of the proportion of higher education graduates among younger and older generations: 38% among 25-34 year-olds compared with 14% among 55-64 year-olds, which however leaves us trailing behind Canada, which has 53% graduates among 25-34 year-olds (indicator 08).
Nevertheless, many baccalauréat holders do not continue onto higher education, or do so unsuccessfully. This failure and
10 I 11 The state of Education no. 16 [2006 issue]

dropping out phenomenon affect vocational and technological baccalauréat holders much more than general baccalauréat holders, those in scientific (S) section achieving high success rates in all the courses in which they can enrol (indicator 27).This observation is particularly relevant in general university courses, where most of the technological and vocational bac-calauréat holders fail to obtain the first qualification, i.e. the licence, often as a result of a misguided orientation, having failed to enrol in an STS or IUT course. However, failure rates are also high in STS. The issue of access to and success in higher education also has a socio-economic aspect. The most selective and sought after courses should be made more accessible to the best pupils, regardless of their social origin: this is the idea behind the implementation of the tutorship of priority edu-cation pupils by Grandes écoles students or pupils and the increase in the number of scholarships in preparatory classes for Grandes écoles.
The question also remains, for many students, whether their studies will enable them to integrate into the labour market in the right conditions. While pursuing higher education is an advantage with regard to the risk of unemployment, it no longer prevents it altogether and is no longer a guarantee a job corresponding with the level of education achieved. Data from the CEREQ (generation 2001) or INSEE’s Employment survey demonstrates how unemployment periods or downgrading situ-ations (for office employee and blue-collar worker positions) affect students in certain education sectors and specialties (indicator 29). Improving the guidance and support for students in their selection of studies and access to the labour market are among the themes of the University-Employment national debate launched in April 2006 and of the “Hetzel committee” projects.

En blanc : thèmes nouveaux.
Contents
01 p. 14 Education expenditure
02 p. 16 Personnel in the national Education system
03 p. 18 Personnel expenditure
04 p. 20 Length of schooling
05 p. 22 Priority education: “ambition réussite” collèges
06 p. 24 Welfare assistance for pupils and students
07 p. 26 The reading skills of young people
08 p. 28 Education level and qualifications of young people having completed their initial education
09 p. 30 Students leaving with a low level of qualification
10 p. 32 Education level according to the socio-economic background
11 p. 34 Qualifications and the risk of unemployment
12 p. 36 Qualifications, socio-economic status and salary
13 p. 38 Schooling for girls and boys
14 p. 40 Lisbon’s European objectives
15 p. 42 Expenditure on primary education
16 p. 44 Schooling and education conditions in the primary sector
Summary Primary education
Costs
Activities
Results
12 I 13 The state of Education no. 16 [2006 issue]

17 p. 46 Expenditure on secondary education
18 p. 48 Secondary education schooling
19 p. 50 Education conditions in the secondary sector
20 p. 52 Access to level IV and V education
21 p. 54 Pupils’ attitudes to life in society
22 p. 56 Employment and career of pupils leaving secondary education
23 p. 58 Expenditure on higher education
24 p. 60 Access to higher education
25 p. 62 Enrolment in the principal sectors of higher education
26 p. 64 Higher education schooling
27 p. 66 Success rate in the licence curriculum
28 p. 68 Success rate in the master-doctorat curriculum
29 p. 70 Employment and career of higher education graduates
30 p. 72 Expenditure on continuing education
Secondary education Higher education Continuing education

01 [ overview ]
Increased 1.� times since 19�0, domestic education expenditure represented �.9 % of the GDP in 2005, or:– 117.9 billion Euro,– �,970 Euro per pupil or student,– 1,��0 Euro per inhabitant.
In 2005, domestic education expenditure (DEE) reached 117.9 billion Euro, 6.9 % of the gross
domestic product (GDP). Taking into account all sources of funding, national efforts concerning education are considerable, reaching 1,880 Euro per inhabitant, or 6,970 Euro per pupil or student (table 01).
Between 1980 and 2005, education expenditure’s share of the gross domestic product fluctuated. From 6.4% of the GDP in 1980, it reached 6.8% in 1982 and then decreased to 6.4% in 1989. These years correspond with the implementation of the laws on decentralisation: the State’s investment credits were transferred to the départements and regions, which only initiated major recon-struction and renovation works on lycées (higher secondary schools) and collèges (lower second-ary schools) in 1989. From 1990 to 1993, the DEE share of the GDP rose sharply to reach 7.6%; this increase was notably due to the considerable ef-fort of regional authorities as well as upgrading of teaching staff salaries.
Between 1980 and 2005, spending on education saw an average annual growth rate of 2.4%, higher than that of the GDP, which rose by 2.1% a year over the same period. Conversely, from 1998 to 2005, GDP went up by 15.7% while DEE only progressed by 6.3%, which explains the reg-ular decrease in the DEE share of the GDP, down to 6.9% in 2005 (table 02).
The growth in DEE could be explained not so much by an increase in the number of pupils as a rise in the cost of each pupil.Taking all levels of education together, the average expenditure per pupil or student rose over the 1980-2005 period by 2.1% per year at constant prices, because of in-creasing numbers of teachers in secondary and higher education, improvements in the manage-ment of primary education and the upgrading of teacher salaries.
Although expenditure per pupil in the primary and secondary sectors rose significantly (respec-tively by 76% and 62%), expenditure per higher education student only rose by 29%, because the considerable increase in student numbers until 1996, and then again since 2000, absorbed most of the additional funds allocated to higher educa-tion (diagram 03).
The French State, which employs more than 1.3 million people (see indicator 02), plays a preponderant role in the funding of education expenditure, contributing 62.7% of costs, 55.5% of which is covered by the Ministry of national Education alone. Regional government bodies contribute 21.3% of the total initial funding: their share has increased in the secondary, higher and continuing education sectors, following the trans-fer of power from State bodies, while households contribute up to 7.6%.
International comparisons, although somewhat difficult for methodological reasons, compare the percentage of GDP devoted to expenditure on initial learning only (not including continuing education). In 2003, France, with a percentage of 6.3%, was still positioned above the average of OECD countries (5.9%), significantly ahead of Spain, Japan or Holland, but behind the USA or Sweden.
Domestic Education Expenditure represents all the expenditure made by all the economic agents, centralised and local public administrations, businesses and households, on educational activities: all types of curricular and extra-curricular activities, activities aiming at organising the education system (general administration, guidance counselling, educational literature and research on education), activities aimed at promoting school attendance (canteen and boarding schools, healthcare in school, transport) and expenditure requested by institutions (school supplies, books, clothes). This expenditure is assessed each year by the Education account, part of the National Income Accounting, which was the subject of a reorganisation, bringing about three major changes.– integration of Overseas Départements (DOM)– new evaluation of Social Security charges related to wages and salaries– re-evaluation of household expenditure.This reorganisation initially affected the 1999-2005 period, then was backdated to 1975 for the domestic expenditure on education only.Unit costs (for which there is a break in the statistical series in 1999) are yet to be backdated. Thus, the amount of expenditure for the last two years is provisional.Initial funding: funding before the transfers between the various economic agents are taken into consideration. Therefore it is the amount payable by each agent. Final funding: concept designed to examine the relationship between the last financier and either the producer or the educational activity.
Source: MEN-DEPP.For international comparisons: OECD CERI.Scope: mainland France + overseas départements taken together.
1� I 15 The state of Education no. 16 [2006 issue]

01
03 Evolution in average expenditure per pupil* at 2005 prices (19�0-2005)
Education expenditure
6,0
6,5
7,0
7,5
8,0
8,5 %
1980
1982
1984 19
8619
8819
9019
9219
9419
9619
9820
0020
02 2004
2005
50
75
100
125
150
DIE aux prix 2005Part de la DIE dans le PIB
en milliards d'euros
Source : MEN-DEPP
dépense moyenne/élève 1er degrésupérieur* 2nd degré*
2 000
3 000
4 000
5 000
6 000
7 000
8 000
9 000
10 000
8 940
6 740
5 290
8 650
2 650
4 810
4 000
6 970
euros 2005
* En 1999 il y a une rupture de série due à la rénovation du compte : changement de périmètre (intégration des DOM), revalorisation des charges sociales rattachées, des dépenses des ménages notamment.
Source : MEN-DEPP
1980
1982
1984
1986
1988
1990
1992
1994
1996
1998
2000
2002
2004 200
5
0% 1 2 3 4 5 6 7 8
États-UnisSuèdeFrance
FinlandeRoyaume-Uni
Moyenne des pays de l'OCDEAustralie
AllemagneItalie
Pays-BasJapon
Espagne
Source : édition 2006 de « Regards sur l'éducation », OCDE
01 Education expenditure métropole + DOM
19�0 1990 2000 200� 2005Dépense Intérieure d’Education*aux prix courants (en milliards d’euros) 28,5 68,0 105,4 115,6 117,9aux prix 2005 (en milliards d’euros) 64,6 86,1 116,1 117,8 117,9DIE/PIB 6,4 % 6,6 % 7,3 % 7,0 % �,9 %DIE/habitant aux prix 2005 (en euros) 1 200 1 480 1 910 1 890 1 ��0Dépense moyenne par élève* aux prix courants (en euros) 1 760 4 030 6 230 6 840 � 970aux prix 2005 (en euros) 4 000 5 090 6 870 6 970 � 970Structure du financement initial (en %)**État 69,1 63,6 64,6 63,6 �2,7
dont MEN 60,9 56,5 57,1 56,2 55,5Collectivités territoriales 14,2 18,5 19,9 20,5 21,3Autres administrations publiques et CAF 0,4 0,7 2,1 2,1 2,1Entreprises 5,5 5,9 5,4 6,2 �,3Ménages 10,8 11,2 8,0 7,6 7,�
(*) La réévaluation de la DIE (voir méthodologie ci-contre) s’applique à l’ensemble de la période 1980-2005. Les dépenses moyennes par élève n’ont été recalculées qu’à partir de 1999. (**) Financement initial : voir méthodologie ci-contre.Source : MEN-DEPP
02 Evolution in domestic education expenditure (DEE) and its share of the GDP (19�0-2005)
Education expenditure (initial education) as a proportion of the GDP (2003)

[ overview ]02The French Ministry of national Education is paying the salaries of 1,279,701 people as of 31 January 200�, of whom 1,13�,792 are working in the public sector and 1��,909 in the private sector under contract. 77.7% of these people are teachers.
As of 31 January 2006, 1,279,701 people are being paid by the French Ministry of Educa-
tion: 993,744 are teachers in the public sector or private sector under contract, and 285,957 as-sume administrative, technical, management, education, guidance and surveillance functions. 58,197 teaching assistants and school assistants also work in education institutions*. Added to this total should be those who are paid by other min-istries (Agriculture, Defence, Health) or private organisations that participate in the education of some 15 million pupils or students.
Two out of three people working in the national Education system are women. There are more women in private institutions than in the public sector (73.7% versus 67.2%). They still have a markedly stronger presence in primary teach-ing (91% in the private sector, 80.1% in the public sector) than in secondary education (66.4% com-pared with 59.1%). In higher education and train-ing institutions, 47% of teachers are women.
Among these personnel, the proportion of teach-ers is close to 78% as of January 2006, of which 4% are not under contract. However, their number drops by 1.1% compared with the previous year, due to the drop in the recruitment of teachers un-der contract, down 9,500 in the public and private sectors.
Alongside teachers in education establishments, regional academy offices or central administra-
tion, other staff fulfil a variety of managerial, inspection, educational, surveillance and edu-cational assistance tasks. They are Directors of establishments, education advisers, guidance counsellors / psychologists, librarians or admin-istrative, technical, surveillance, maintenance, service and health and welfare staff**. Added to this total should be the 8,310 assistant educa-tors employed as at September 2005, more than half of whom (51.8%) are assigned to secondary education establishments. They work in part-nership with the 49,887 education assistants and 6,426 school assistants integrated into the “pupil’s life” programme.
The decrease in personnel observed in the last three years concerns almost exclusively second-ary schools. This decrease corresponds with the sharper drop in pupil enrolment (diagram 03).
*The new 2006 school year saw the creation of new “emplois vie scolaire” (school life employ-ment) contracts (50,000 recruitments planned) aiming at assisting school directors.** The law on decentralisation of 13 August 2004 provides for the transfer of technical, maintenance and service personnel (“TOS”) in secondary education establishments to the “departments” and regions. These TOS person-nel (approximately 90,000 staff) have until 2008 to join the regional public service or remain State civil servants.
The staff accounted for are those in active employment, paid by the Ministry of national Education (jobs and credits from the school education and higher education budgets). Account was not taken of staff paid by private establishments not under contract or staff belonging to certain public institutions under direct Ministry control (ONISEP, CNDP, CEREQ etc.). “Youth and Sports” and “Research” staff were also excluded from the scope.
Source: Academy’s payroll files received from the Paymaster General and central administration personnel payroll files as of January of any given year. Scope: Mainland France + overseas départements – public sector and private sector under contract for teachers, public sector for other staff (ATOSS and management personnel from the private sector under contract are paid as per a fixed price contract).
1� I 17 The state of Education no. 16 [2006 issue]

Personnel in the national Education system 02
94
97
100
103
106
109
Enseignants
Élèves
1er degré
2nd degré
2nd degré
1er degré
Source : MEN-DEPP
1995- 1996
1996- 1997
1997- 1998
1998- 1999
1999- 2000
2000-2001
2001-2002
2002-2003
2003-2004
2004-2005
2005-2006
métropole + DOM
03 Evolution in student and teacher population (1995-2005) basic index 100 in 1995 (public and private)
01 Evolution in national Education system personnel (public and private)métropole + DOM
Enseignants*Administratifs,
techniques, d’encadrement,
surveillance Total
Part des femmes
(%)
Part des enseignants
(%)
Aides-éducateurs et assistants
d’éducation**Public Privé Total
1990 756 260 126 380 882 640 288 660 1 171 300 65,2 75,4
1995 807 140 134 940 942 080 297 750 1 239 �30 64,5 76,0
2000 841 140 139 650 980 790 303 320 1 2�� 110 64,7 76,4 61 470
2003 870 515 144 169 1 014 684 311 425 1 32� 109 65,1 76,5 55 770
200� 868 342 145 394 1 013 736 303 747 1 317 ��3 65,2 76,9 50 190
2005 860 198 144 940 1 005 138 293 507 1 29� ��5 65,5 77,4 51 287
200� 848 835 144 909 993 744 285 957 1 279 701 65,7 77,7 58 197
* Enseignants dans les établissements des premier et second degrés publics et privés, dans les établissements d’enseignement supérieur et les établissements de formation.** 8 310 aides-éducateurs et 49 887 assistants d’éducation en 2006.Source : MEN-DEPP
02 Breakdown of the national Education system personnel in 2005-200� (public and private)
Type de personnel 2005-200�
Enseignement scolaire du premier degré public 320 103
Enseignement du premier degré privé 43 182
Enseignement scolaire du second degré public 419 009
Enseignement du second degré privé 101 727*
Enseignants du CNED 1er et 2nd degrés** 1 103
Formations supérieures (y compris enseignants en IUFM) 78 355
Stagiaires des établissements de formation 30 265
Enseignants titulaires, stagiaires et non-titulaires 993 7��
Personnel administratif, technique, d’encadrement et de surveillance 285 957
Aides-éducateurs et assistants d’éducation 58 197
Total 1 337 �9�
* Y compris des enseignants des corps du premier degré, affectés en remplacement, en formation initiale ou continue.**Au CNED, on recense 474 enseignants appartenant aux corps du premier degré et 629 aux corps du second degré.Source : MEN-DEPP

03 [ overview ]
In all OECD countries, personnel remuneration represents the no. 1 spending item for education establishments. France is among the average regarding primary and secondary school education, but not higher education, for which other countries devote a larger share to operations (UK and USA) or capital (Spain, Japan) expenditure.
Payment of one million teachers, �5% of whom work in the public sector, and 2��,000 administrative, technical, management, surveillance and educational assistance staff, represents the no. 1 education spending item, notably within the budget of the national Education system.
Source: Academy’s payroll files from the Paymaster General, for public and private primary and secondary school teachers, for non-teaching personnel in the public sector as well as the central administration’s payroll files, as of 31 January 2006. Apart from the remuneration corresponding with their index level, teachers can also receive other benefits (class council, form teacher etc.) and overtime/year. DPE surveys on higher education teachers in January 2006. Scope: mainland + overseas départements – Public sector and private sector under contract.
Personnel expenditure constitutes the largest part of education expenditure, particularly
for the budget of the national Education system: amounting to a total of 66 billion Euros in 2005 for primary, secondary and higher education sectors, its share of the government budget has risen from 20 to 23% in the last ten years, a pe-riod during which the number and more specifi-cally the structure of the personnel has changed dramatically.
As of 31 January 2006, the public primary sector accounted for 320,100 teachers, up 1.9% on 1995. The vast majority of them (85.8% compared with under 20% in 1995) now hold the professeurs des écoles qualification. Of the 43,200 teachers in private schools under contract, 83% now receive a salary corresponding to that of a professeur des écoles.
Public secondary sector establishments (including post-baccalauréat classes) account for 419,000 teachers, i.e. an increase of nearly 6% since 1995. More than six teachers out of ten are certified and over one in ten is agrégé (associate teacher status); 15.8% teach in pro-fessional lycées. PEGCs (general collège teach-ers), teachers and teaching assistants, for which there is no longer any recruitment, represent 4% of the teachers assigned to secondary educa-tion establishments; finally, 2.2% of them belong to primary school teaching staff. 95,621 teachers work in private education establishments under contract, and 6,106 teachers assigned to various activities (teacher training, substitutes etc.), i.e.
101,727 teachers, 52% are agrégés or certified and catered for using the relevant remuneration scale.
In higher education, 92% of the 9,300 teachers work in universities (including IUTs – Univer-sity Institute of Technology) and 8% in training institutions: IUFM (teacher training institution), ENS (école normale supérieure, teacher training school)... 40% of the teachers are lecturers and 21% university professors.
Taking into account that the vast majority of teach-ers belong to category A, 74.5% of staff in the public sector belong to this category. Their aver-age remuneration index is 562 in 2006, compared with 507 on average for the entire staff, including temporary teachers. The cost of teachers’ base pay continues to increase, due to the progressive replacement of elementary schoolteachers with professeurs des écoles. In secondary schools, the number of agrégés teachers and senior teachers (average pay index 723) increases at a quicker rate than that of certified and assimilated teachers (average index 546).
In 2006, the 286,000 administrative, technical, ed-ucational, management, guidance, surveillance and educational assistance staff come under one of the primary or secondary education and “pupil’s life” programmes (70.4%), higher educa-tion (20 %) or the “support of the policy of the na-tional education system” programme in Academy departments (8.3%) or centralised administration (1.3%). The majority of them (54.6%) belong to category C.
1� I 19 The state of Education no. 16 [2006 issue]

03Personnel expenditure0� Breakdown of inspection, management, administration, educational, guidance, surveillance and educational assistance staff (200�)
01 Teachers in public primary schools
Effectifs Part des femmes(%)
Part des professeurs des écoles (%)
1995 314 217 76,1 19,3
2000 314 729 77,8 46,0
2003 318 236 78,8 66,3
2004 318 381 79,3 72,9
2005 318 236 79,7 79,7
200� 320 103 �0,3 �5,�Source : MEN-DEPP
02 Teachers in public secondary education establishments
Effectifs Part des femmes(%)
Part des agrégés et certifiés (%)
1995 395 824 56,0 55,6
2000 420 248 56,7 68,6
2003 431 769 56,7 70,1
2004 430 263 56,7 71,6
2005 424 385 57,0 73,3
200� �19 009 57,2 7�,�Source : MEN-DEPP
03 Teachers in public higher education establishments*
Effectifs Part des femmes **(%)
Part des professeurs des universités (%)***
1995 68 054 30,0 25,3
2000 81 809 33,1 23,0
2003 86 986 34,2 22,3
2004 88 195 34,7 22,3
2005 88 800 34,9 22,4
200� �9 300 3�,9 21,0
* Universités, établissements d’enseignement supérieur, établissements de formation ** Estimation fournie à partir des fichiers de paye*** Données DGRHSource : MEN-DGRH-DEPP
70,4 %20,0 %
8,3 % 1,3 %
Source : MEN-DEPP
Enseignement scolaire et vie de l'élève
Enseignement supérieur et IUFM
En académie
En administration centrale
Programme soutien
Source : édition 2006 de « Regards sur l'éducation », OCDE
0 % 10 20 30 40 50 60 70 80 90
BelgiqueItalie
JaponAllemagne
EspagneCanada
Moyenne des pays de l'OCDEFrance
Pays-BasÉtats-Unis
Royaume-UniFinlande
enseignement supérieur enseignement scolaire
Personnel remuneration share of the overall expenditure of education establishments (2003)

0� [ overview ]
Following continued progression between the 19�0s and the mid-1990s, the expected length of schooling has now stabilised at around 19 years of study.
Schooling rates per age group observed in 2004-2005 now mean that a child entering
nursery school can expect to receive 18.8 years of initial education. After a period of sustained growth up to the mid-1990s, resulting in a gain of nearly two years, the expected duration of school-ing experienced a slight downturn between 1997 and 2001, of about 0.04 year less at the start of each academic year. It has been almost stable since 2002, while increasing slightly for the over 14 age group (table 01).
Following a downward trend in the late 90s, rates per age group are now stabilising for the 18 year-olds, and slightly up for the 19 to 22 age group. Schooling rates for 23, 24 and 25 year-olds are down over the last few years, for boys who, much more frequently than their elders, have under-taken apprenticeship studies, which are shorter on average. Conversely, the rate increase for 26 to 29 year-olds, as observed in 2000, continues: these young people belong to generations (1975 to 1978) that have massively opted for long stud-ies at the end of their lower secondary education (graph 02).
The length of schooling of a pupil depends first of all upon the type of studies. Thus, among the pupils who entered lower secondary education in 1995 (panel 95), 76% of those who were able to enter the first year of general or technological higher secondary education were still pursuing their studies 9 years later, mainly in higher educa-tion, as opposed to only 23% of pupils who were
guided towards vocational education (graph 03). However, regarding the population of pupils who started their lower secondary education in 1989 (panel 89), it should be noted that the vocational programme enabled the pupils in the 1995 panel to achieve longer schooling, with an increase in the rate of studies continued from level V to level IV, and a pursuit of higher education for vocation-al baccalauréat holders.
The length of schooling also depends on how quickly pupils complete their schooling. Because of the reduction in the number of repeated years these last few years in primary and secondary education, the pupils from the 1995 panel who followed a general and technological programme have not had the same amount of schooling, 9 years later, as their 1989 predecessors, without however affecting their education level.
Other factors, such as the economic situation, may affect the length of schooling and the choice of discontinuing or pursuing initial education. Thus, the slight recovery in schooling for 19 and 20 year-olds in 2002 and 2003 is partly due to vo-cational baccalauréat holders deciding to carry on their studies for longer, for fear of not finding a job on the employment market. In addition, since 1998, the significant increase in the number of foreign students has helped compensate for the reduction in the schooling rates of 20 to 24 year-olds, and support their growth for the over 25 age group.
International comparisons of expected length of schooling (for a 5-year-old child) must be made carefully, with a clear distinction between full-time and part-time schooling. After Germany and Nordic countries, France is one of the countries where the length of full-time schooling is the longest, while part-time schooling is more developed in English-speaking countries.
Expected length of schooling is an estimation of schooling duration for a child enrolling in nursery school that year. As with life expectancy, this indicator represents a temporary situation, a reflection of schooling on the school year considered. Mathematically, expected length of schooling equals the sum of the schooling rates as observed through various age groups, an 80% schooling rate being equal to a 0.8 year schooling duration. As the schooling rate of the 6 to 14 year-old age groups is 100%, give or take measuring errors, schooling expectancy before 6 and after 14 should be examined separately in order to have a full understanding of the changes in the length of schooling.
Source: MEN-DEPP, INSEE. Scope: mainland, all educational backgrounds.
20 I 21 The state of Education no. 16 [2006 issue]

0�
Expected length of schooling in years for a 5-year-old child (200�)
Length of schooling01 Evolution in the length of schooling
en années
19�5-19�� 1990-1991 1995-199� 2000-2001 2002-2003 200�-2005
Ensemble 17,1 1�,1 19,0 1�,9 1�,� 1�,�
Avant 6 ans 3,3 3,3 3,4 3,4 3,3 3,3
Après 14 ans 4,9 5,8 6,7 6,5 6,5 6,6
Filles 4,96 5,92 6,85 6,72 6,78 6,84
Garçons 4,78 5,69 6,47 6,35 6,28 6,32Source : MEN-DEPP (population scolaire), INSEE (effectifs d’habitants)
0
10
20
30
40
50
60
70
80
90 %
1985-1986
1987-1988
1989-1990
1991-1992
1993-1994
1995-1996
1997-1998
1999-2000
2001-2002
2003-2004
total 18 ans
filles de 19 à 20 ans
garçons de 19 à 20 ans
filles de 21 à 22 ans
garçons de 21 à 22 ans
filles de 23 et 24 ans
garçons de 23 et 24 ans
ensemble de 25 à 29 ans
Source : MEN-DEPP (population scolaire) et INSEE (effectifs d'habitants)
En proportion des habitants du même âge
Champ : « Population scolarisée » = ensemble des établissements d'enseignement et centres de formation d’apprentis.
0 10 20 30 40 50 60 70 80 90 100 %
Ensemble
Pas entrésen troisième
Seconde GTaprès la troisième
Enseignementprofessionnel
après la troisième
Non bacheliers
Baccalauréatprofessionnel
Baccalauréattechnologique
Baccalauréatgénéral
Panel 95 Panel 89
Lecture : 53 % des élèves entrés en sixième à la rentrée 1995 sont encore scolarisés en 2004-2005, soit 9 ans après. Les élèves entrés en sixième en 1995 et passés par l'enseignement professionnel sont un peu plus scolarisés 9 ans après que ceux du panel 1989 (23 % contre 19 %). Source : MEN-DEPP (panels d'élèves 1989 et 1995)
Source : édition 2006 de « Regards sur l'éducation », OCDE
0,0 3,0 6,0 9,0 12,0 15,0 18,0 21,0
FinlandeAllemagne
SuèdeItalie
FrancePays-BasBelgiqueEspagne
Royaume-UniÉtats-Unis
Temps plein Temps partiel
02 Evolution in schooling rates based on age and gender (19�5-200�)
03 Proportion of pupils still in the education system, 9 years after they started lower secondary school, as per their schooling career

05 [ overview ]
Sources : MEN-DEPP, Schooling files, AGAPE, EPP and “Structures et services” Scope: mainland and overseas départements, public sector.
The pupils of the 2�9 public “ambition réussite network leader” collèges are differentiated from the others, at the start of the lower secondary education, by their underprivileged social origin, lesser acquired knowledge and greater schooling difficulty. In these collèges, the results obtained at the written examination of the national brevet diploma are on average lower than the norm.
The 2005-2006 school year was marked by a revival in priority education, which was re-
flected in a reorganisation of the priority education map, implemented at the start of the 2006 school year. The collège becomes the “reference unit” of the network created with primary and pre-schools where its pupils come from. In place of the current priority education areas and networks, 249 ambition réussite networks are structured, as are the other so-called “schooling achievement” networks.
The 249 ambition réussite (AR) collèges were select-ed based on several criteria: proportion of sixième (first class in lower secondary schools) pupils from underprivileged social backgrounds, 2 years behind or more or with a low score in the evaluation car-ried out at the start of the sixième class, proportion of parents qualifying for the RMI (minimum welfare payment) and of non French-speaking children.
In 2005-06, 129,400 pupils, i.e. one out of twenty collège pupils, were enrolled in a collège that has since been classified as AR. In accordance with the criteria selected to determine the list of these col-lèges, the pupils come mainly from underprivileged social backgrounds: in sixième classes, 71% have working-class or unemployed parents, compared with 39% in other public collèges. They present seri-ous schooling difficulties, as 10.1% of them are two years behind or more in sixième class compared with 2.8% elsewhere. Their acquired knowledge is significantly lower than that of their schoolmates: in 2003, the average score per establishment for the evaluation carried out at the start of the sixième class was 49 out of 100 for AR collèges compared with 64 for the other ones (table 01).
Among these 249 collèges, 238 were already in pri-ority education areas and benefited from additional resources: in 2004-2005, they were granted, on aver-age, over 11% more teaching hours per pupil than other collèges. This effort, which resulted in fewer pupils per class and per educational structure than in other public establishments or the priority area as a whole, will be reinforced by the provision of addi-tional teachers and educational assistants (table 02).
Teachers in AR collèges are younger and have less seniority in the establishment: 28% of them are 30 or younger, and 39% have been working in the es-tablishment for two years or less, as opposed to 16% and 29% respectively in other public collèges. ATOS (administrative, technical, educational and surveillance) staff are much older than the teachers, whether the collège is classified as AR or not.
The national brevet diploma (DNB) includes a writ-ten three-part examination (French, mathematics and history – geography – civic education). For the 2005 session, 72.2% of the pupils in AR classified collèges obtained a mark lower than 10 out of 20 at the written examinations, compared with 58.9% of the pupils in the priority education area and 42.7% in other public collèges (graph 04).
Within the framework of the LOLF (Constitutional by-law on budget acts), the gaps between priority edu-cation pupils, notably within the ambition réussite networks, and the others, will be measured in terms of acquired skills from the common programme, schooling difficulties and supervision rates.
The objective of the revival plan for priority education is to reinforce the educational aid system implemented by distinguishing several levels of action. The collège becomes the “reference unit” of the network created with elementary and pre-schools where its pupils come from. In place of the existing priority education networks, the 249 ambition réussite networks are structured as per this model, as are the other so-called “schooling achievement” networks (memo. no. 2006-058, published in the Bulletin Officiel no. 14 of 2006). The percentage of pupils with working-class and unemployed parents (table 01) includes children of skilled and unskilled workers, farm workers, retired parents working as salaried or manual workers and persons with no professional activity. Professions left blank are accounted for separately. The average score per establishment of the evaluation carried out at the start of the sixième class in September 2003 is the average of the scores calculated out of 100 in mathematics and French, excluding SEGPAs (adapted general and vocational education classes). 2003 is the last year for which results are available for all collèges in mainland France and overseas départements. The indicator in table 02 compares all teaching hours (including those of local resources – temporary teachers, supplementary staff... – and AREs) with the total number of collège students (excluding SEGPAs). Diagram 03 illustrates the number of teachers, full-time or otherwise, including substitute teachers, whose main assignment has been in a collège for 2 years or less. Diagram 04 shows the breakdown in pupils according to the average marks out of 20 obtained at the written examinations of the 2005 DNB session.
22 I 23 The state of Education no. 16 [2006 issue]

05Priority education: ambition réussite (Objective: success) collèges
03 Percentage of staff…
a) ...aged 30 or less in 2004
01 Social background, schooling difficulty and scores obtained by pupils in the evaluations carried out at the start of the sixième classes in ambition réussite collèges
Proportion en 200�-2005 d’élèves de sixième
Score moyen par établissement
à l’évaluation de sixième
(septembre 2003)Enfants d’ouvriers
et d’inactifsEn retard de 2 ans
ou plus
Ambition réussite 71,2% 10,1% 48,8
Hors ambition réussite 39,2% 2,8% 64,1
Source : MEN - DEPP
02 Teaching resources and class sizes in collège classes as at September 200�
Ambition réussite
Hors ambition réussite Total
Nombre d’heures hebdomadaires d’enseignement par élève (H/E) 1,43 1,27 1,27
Nombre moyen d’élèves par division 21,6 24,1 24,0
Nombre moyen d’élèves par structure pédagogique (E/S) 20,7* 22,9* 22,8
*21,4 en EP et 23,4 hors EPSource : MEN-DEPP
ATOS collèges
Enseignants collèges
Total
Hors ambition réussite
Éducation prioritaire
Ambition réussite
30 25 20 15 10 5 0 % 0 % 5 10 15 20 25 30 35 40 45
Source : MEN-DEPP
0
10
20
30
40
50
60
70
80
90
100 %
Ambition réussite Hors ambition réussite
de 15 à 20
de 12 à 14
de 10 à 11
de 8 à 9
de 6 à 7
de 0 à 5
Source : MEN-DEPP
Lecture : dans les collèges « ambition réussite », 27,7 % des élèves ont eu entre 0 et 5 sur 20 en moyenne aux épreuves écrites du diplôme national du brevet (DNB) à la session de juin 2005 contre 11,2 % des élèves des collèges hors « ambition réussite ».
0� Breakdown of pupils according to their marks in the written examinations of the 2005 DNB
b) ...that have been in the same establishment for two years or less

0� [ overview ]
In September 2005, over 520,000 students, i.e. almost 30% of the population concerned, received direct financial aid in the form of a scholarship. Overall, financial and welfare aid represents over �.5 billion Euro, as opposed to 3.5 billion Euro in 1995.
D ifferent types of financial assistance allow families to ensure better conditions for the
schooling of their children. The most direct type is the allocation of scholarships, which, taking into account all the administration, represents an annual budget allocation of about 2 billion Euros.
Scholarships granted in the secondary sector concern, in 2005-06, 770,000 collège and 560,000 lycée pupils (mainland France + overseas dépar-tements), or respective percentages of 23.8% and 24.7% of scholarship holders, these figures being much higher in vocational lycées (36%) than in general or technological lycées (a little under 19%, diagram 02).
At the start of the 2005 school year, in the higher education sector, 370,000 university students (scholarships granted based on social – with an average amount of approximately 2,500 Euros – and academic criteria, or merit based), and 100,000 STS (special technical sections) and CPGE (preparatory classes for Grandes écoles) students were awarded a scholarship, i.e. nearly 29% of university students, nearly 19% of CPGE and 43% of STS students. If education allowanc-es and loans on trust are also included, a total of 522,000 students received financial support in 2005 (table 01). This number has continued to in-crease in recent years, and the proportion of sup-ported students now slightly exceeds 30% of all those in higher education, compared with barely 20% in 1990.
However, this data does not cover all types of fi-nancial and also direct and indirect welfare aid, which are available to students.
In addition to scholarships, direct aid includes the fund for the improvement of student living conditions (FSDIE), assistance with transport costs (Imagine-R season ticket for the Paris re-gion), housing allowance (ALS) or personalised housing benefit (APL), to which should be added a range of tax benefits (tax reduction for a de-pendent student, additional half-portion granted for attachment to the taxpayer). Indirect aid cov-ers all welfare efforts made by the CROUS (Re-gional Centre for Student Services): aid to charity organisations, exemption from subscription fees for scholarship-holders, medical and welfare services in universities and social security for students (covering the difference between pay-ments and contributions paid).
In 2005, the total of all types of aid for students ex-ceeded 4.5 billion Euros, compared with 3.5 billion in 1995, i.e. an increase of 30% at market prices or over 12% on a constant price basis (table 03).
The merit-based scholarship system, created in 2000 to provide better schooling conditions to general, technological and vocational lycée pupils, is significantly enhanced at the start of the 2006 school year: the number rises to 100,000 and the amount is increased.
Scholarships awarded on social grounds: awarded according to family resources and charges, for an annual amount ranging from grade 0 to grade 5. Scholarships awarded on academic grounds: public service scholarships, DEA scholarships (research-oriented advanced degree), DESS scholarships (post-master’s degree in advanced specialised studies) and agrégation scholarships (preparation for civil service competitive examination).Merit-based scholarships: awarded, since 1998 and after review of the application, to students with limited family resources, having obtained a baccalauréat with “très bien” honours and who commit themselves to preparing for the admission examination to ENA (National School of Public Administration), ENM (National School of Magistrates) or Engineering Grande Ecole, or to undertaking medical studies. Proportion of financially supported students: This concerns the relevant student population, i.e. students enrolled in a University in a course allowing for financial support (mainly national first and second level degrees, DEA, DESS and up to the 6th year of medical studies), in first year of IUFM (Institute of Teacher Training), STS, CPGE or engineering schools under the responsibility of the Ministry and State-approved Business Schools. ALS: this housing allowance was established by the Law of 16 July 1971 to support population groups other than families, with a low level of resources (older people, disabled people, younger workers). Funded by the FNAL (National Housing Aid Fund), sponsored by the State and employers contribution. APL: this personalised housing benefit was established by the Law of 3 January 1977. It concerns a specific range of housing accommodation, regardless of the marital status of the tenants. Funded by the FNH (National Housing Fund).
2� I 25 The state of Education no. 16 [2006 issue]

0�
02 Proportion of collège, lycée and higher education students receiving scholarships
Welfare assistance for pupils and students 01 Number of students benefiting from financial assistance
métropole + DOM
1990-91 1995-9� 2000-01 200�-05 2005-0�Ensemble des aides (1) 272 088 414 105 478 600 515 511 522 242% d’étudiants concernés 19,7 24,1 28,6 30,0 30,2 dont université (2) : 185 526 280 176 335 187 361 970 369 365% d’étudiants concernés 17,5 21,2 26,6 28,2 28,8 dont CPGE (2) 9 745 12 361 13 273 13 685% d’étudiants concernés 13,5 17,1 18,8 19,0 dont STS (2) 75 524 85 628 87 737 87 240% d’étudiants concernés 39,4 42,4 43,1 42,8Bourses sur critères sociaux 254 809 363 075 452 616 489 412 496 427Bourses sur critères universitaires 10 151 13 126 14 539 12 575 12 529Bourses de mérite 0 0 497 757 842Allocations d’études 0 0 8 090 10 189 10 461Total boursiers 2�� 9�0 39� �92 �75 7�2 512 933 520 259Prêts d’honneur 3 825 2 788 2 858 2 578 1 983Allocations d’IUFM 3 303 14 625 0 0 0Aide moyenne reçue par un boursier sur critères sociaux (en euros) 2 283 2 320 2 449 2501
(1) Champ : bourses sur critères sociaux (y compris AIE jusqu’en 1999), universitaires, de mérite, allocations d’études, prêts d’honneur, allocations d’IUFM (supprimées en 1998).(2) Hors allocations d’études, prêts d’honneur, allocations d’IUFM.Source : MEN-DEPP
03 Student aid (in million Euros)
métropole + DOM
Nature des aides Montant
1995Montant
2005
Évolution 1995-2005
prix courants
prix constants
AIDES DE L’ÉTAT
I - Aides budgétaires
Aides directes
- Bourses et prêts (43-71) 927,7 1 332,6 43,6 % 24,1 %
- Allocation de logement social (ALS) 672,6 995,7 48,0 % 27,9 %
- Aide personnalisée au logement (APL) 187,5 181,4 -3,3 % -16,4 %
- Aide au transport (carte Imagine R) 11,4
Total aides directes 17�7,� 2521,1 �1,0 % 21,� %
Aides indirectes
- Œuvres universitaires 253,4 302,3 19,3 % 3,1 %
- Aides aux associations et médecine universitaire 12,8 22,6 76,6 % 52,5 %
- Compensation de l’exonération des droits d’inscription dont bénéficient les étudiants boursiers 8,4 47,8 469,1 % 391,6 %
Total aides indirectes 27�,� 372,7 35,7 % 17,2 %
TOTAL aides budgétaires 2 0�2,� 2 �93,� �0,3 % 21,2 %
II - Aides fiscales (*)
- Majoration du quotient familial pour enfants étudiants rattachés au foyer fiscal de leurs parents 942,1 1 075,0 14,1 % -1,4 %
- Réduction d’impôt pour frais de scolarité des enfants poursuivant des études supérieures 125 160,0 28,0 % 10,6 %
Total aides fiscales 1 0�7,1 1 235,0 15,7 % -0,0 %
Total aides de l’État 3 129,5 � 12�,� 31,9 % 1�,0 %
AuTRES AIDES
Versements des régimes sociaux
- Contribution des différents régimes au financement des assurances sociales des étudiants 375,1 426,1 13,6 % -1,9 %
Versements des universités
- Fonds de solidarité et de développe-ment des initiatives étudiantes (FSDIE) 6,1 12,2 100,0 % 72,8 %
Total autres aides 3�1,2 �3�,3 15,0 % -0,7 %
TOTAL GÉNÉRAL 3 510,7 � 5�7,1 30,1 % 12,� %
(*) Hors avantage fiscal pour déduction des pensions alimentaires, évaluée en 1995 à 0,3 milliard d’euros.Source : MEN-DEPP, DGES, CNAF, MINEFI-DGI
10
15
20
25
30
35
40
45
50 %
1995-96 1997-98 1999-2000 2001-02 2003-04 2005-06
Collèges LEGT LPUniversité CPGE STS
Source : MEN-DEPP, DGESCO

07 [ overview ]
In 2005, among young people aged around 17 years old, 79.�% are efficient readers and 9.5% mediocre readers. Nearly 11% of these young people experience comprehension difficulties. For some of them – �.3% of the total – these difficulties are very serious.
In 2005, approximately 800,000 young French men and women aged 17 or more participated
in the National Defence Preparation Day (JAPD) and took tests aimed at assessing written com-prehension. Three specific aspects are assessed: the auto-matic reading aspect; lexical proficiency; the ability to process complex written material. For each of these aspects, a command level was set, below which young people are regarded as having difficulties on the assessed skill (−), and above which the skill is deemed acquired (+). The combined results have enabled the identifi-cation of eight reader profiles (table 01). For young people most affected by these dif-ficulties (profiles 1 and 2), representing 4.3% of the total, these weaknesses are explained by a significant lack of vocabulary. Moreover, young people from profile 1 (2.3%) have no command of the basic processing mechanisms of the writ-ten language. Some of these are probably unable to read. Young people from profiles 3 and 4 (6.6%) have an acceptable lexical level but cannot handle com-plex written material. The test enables the identification of different reader profiles, efficient or just mediocre. 9.5% of the young people (profiles 5a and 5b) have man-aged to make up for their difficulties and reach a certain level of comprehension. Profile 5c re-lates to 14.3% of the young people who, despite significant deficiencies in the automatic process involved in identifying words, have managed to
process complex written material, by way of a proven lexical proficiency. Finally, profile 5d re-lates to young people having passed everything, i.e. 65.3% of the total population. According to the test criteria, these young people have everything it takes to enhance their reading skills and tackle a variety of written material.
Reading skills and educational levels are closely connected. Profile 1 is made up of many young people having undergone a short period of schooling, sometimes very short, whereas profile 5d is mainly made up of lycée students from the general course (diagram 03). Reading difficulties are more frequent for boys: in 13.8% of the cases compared with 7.7% for girls (table 01). They are less successful in com-prehension tests and there are more boys than girls in each of the profiles 1 to 4. They also show more serious deficiencies in the basic process-ing mechanisms of the written language, which explains their larger presence in profiles 1, 3, 5a and 5c (diagram 04).
The importance of the results obtained by young people at the JAPD’s reading tests led to select this indicator, within the framework of the LOLF, as a measure of one of the crucial skills of the “common base”, which is expected to be ac-quired at the end of compulsory schooling. The new instructions on learning to read are designed so that all young people manage to acquire this necessary skill.
JAPD tests are designed to identify, in weak readers, three major difficulty groups of various types: - Poor automation of the mechanisms in charge of word identification: rather than concentrating on finding the meaning, weak readers have to focus on word recognition, which should be automatic; - Insufficient language skills: this is mostly due to poor lexical proficiency; - Inefficient processing of complex material required to understand a document: a lot of young people will be inefficient in the way they handle the written language, whether they lack expertise or they find it difficult to focus…, although neither their ability to identify words nor their language skills seem to be at fault.
Four schooling levels were defined according to the courses young people said they were taking or had taken. level 1: studies taken no further than collège; level 2: short vocational studies (CAP – vocational training qualification or BEP – certificate of technical education); level 3: vocational and technical training better than BEP and up to vocational baccalauréat or technical non-university degree; level 4: general studies after lycée.
Source: JAPD-Analysis DEPP. Scope: Young French Men and Women having participated in the JAPD in 2005 in mainland France.
2� I 27 The state of Education no. 16 [2006 issue]
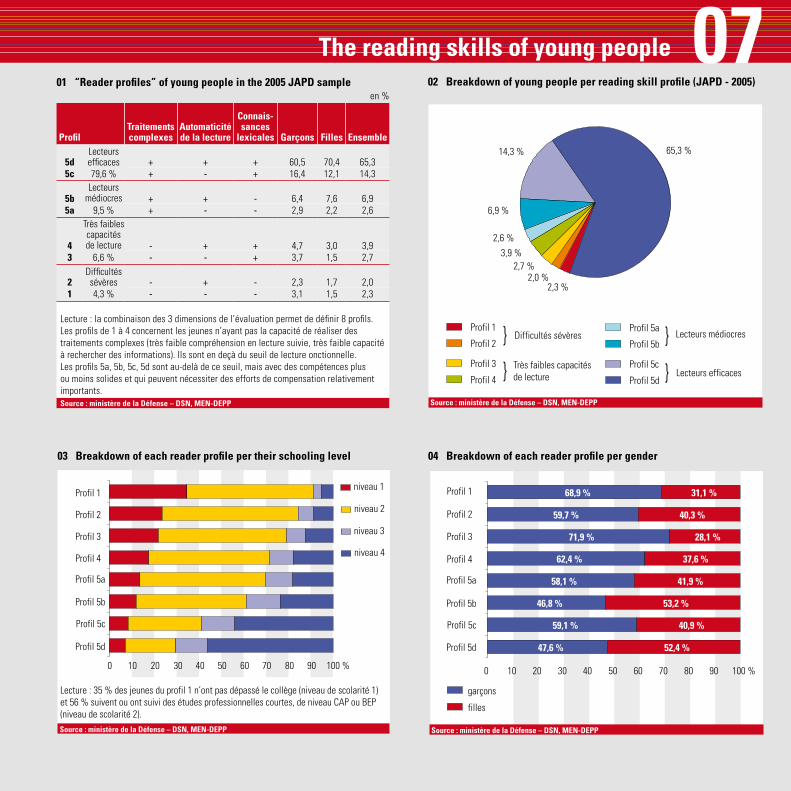
07
0� Breakdown of each reader profile per gender
The reading skills of young people 01 “Reader profiles” of young people in the 2005 JAPD sample
en %
ProfilTraitements complexes
Automaticité de la lecture
Connais-sances
lexicales Garçons Filles Ensemble
5dLecteurs efficaces + + + 60,5 70,4 65,3
5c 79,6 % + - + 16,4 12,1 14,3
5bLecteurs
médiocres + + - 6,4 7,6 6,95a 9,5 % + - - 2,9 2,2 2,6
�
Très faibles capacités de lecture - + + 4,7 3,0 3,9
3 6,6 % - - + 3,7 1,5 2,7
2Difficultés
sévères - + - 2,3 1,7 2,01 4,3 % - - - 3,1 1,5 2,3
Lecture : la combinaison des 3 dimensions de l’évaluation permet de définir 8 profils. Les profils de 1 à 4 concernent les jeunes n’ayant pas la capacité de réaliser des traitements complexes (très faible compréhension en lecture suivie, très faible capacité à rechercher des informations). Ils sont en deçà du seuil de lecture onctionnelle. Les profils 5a, 5b, 5c, 5d sont au-delà de ce seuil, mais avec des compétences plus ou moins solides et qui peuvent nécessiter des efforts de compensation relativement importants.Source : ministère de la Défense – DSN, MEN-DEPP Source : ministère de la Défense – DSN, MEN-DEPP
65,3 %
6,9 %
2,3 % 2,0 %
2,7 % 3,9 %
14,3 %
Profil 1
Profil 2
Profil 3
Profil 4
Profil 5a
Profil 5b
Profil 5c
Profil 5d
2,6 %
Difficultés sévères
Très faibles capacités de lecture
Lecteurs médiocres
Lecteurs efficaces
} }
}
}
0 10 20 30 40 50 60 70 80 90 100 %
Profil 5d
Profil 5c
Profil 5b
Profil 5a
Profil 4
Profil 3
Profil 2
Profil 1 niveau 1
niveau 2
niveau 3
niveau 4
Source : ministère de la Défense – DSN, MEN-DEPP
Lecture : 35 % des jeunes du profil 1 n’ont pas dépassé le collège (niveau de scolarité 1) et 56 % suivent ou ont suivi des études professionnelles courtes, de niveau CAP ou BEP (niveau de scolarité 2).
47,6 %
59,1 %
46,8 %
58,1 %
62,4 %
71,9 %
59,7 %
68,9 %
52,4 %
40,9 %
53,2 %
41,9 %
37,6 %
28,1 %
40,3 %
31,1 %
0 10 20 30 40 50 60 70 80 90 100 %
Profil 5d
Profil 5c
Profil 5b
Profil 5a
Profil 4
Profil 3
Profil 2
Profil 1
garçons
filles
Source : ministère de la Défense – DSN, MEN-DEPP
02 Breakdown of young people per reading skill profile (JAPD - 2005)
03 Breakdown of each reader profile per their schooling level

0� [ overview ]
Approximately �2% of the young people having completed their initial education in 200� have a higher education degree, �1% a qualification from the second level of secondary education and 17% a brevet at best.
Among the young people who interrupted their studies for the first time in 2004, 42% have a
higher education qualification, according to 2005 French surveys on the labour market. In addition, 41% have a qualification from the second level of secondary education and 17% a lower education level: they finish their studies without a CAP, BEP or baccalauréat (see indicator 09).
In generations born around 1978, there are also approximately 42% higher education graduates, up slightly on those born between 1972 and 1975. At the same time, the percentage of these gradu-ates in the 25 to 29 year-old population is now stable following a rapid increase from 1990 to 2002 (diagram 01).
Among higher education graduates, 24% of the total leaving the education system hold a quali-fication equivalent to the new “licence master doctorat” (bachelor’s degree – master – PhD) programme: 11% of the young people finish their education with a qualification at least equivalent to a licence, 12% with a qualification following a masters cycle (five years) and 1% pursue a research doctorate (table 03). Furthermore, 1% of the young people leave the education system with just a DEUG (general university diploma awarded after the completion of a 2-year cycle) and 17% with a qualification awarded after a shorter technical or vocational higher education
course (BTS – Higher Technician Certificate, DUT – University Diploma in Technology, or a diploma in paramedical and social studies).
Approximately 20% of the population going into higher education are not awarded a qualifica-tion, according to the latest surveys on the labour market (79,000 out of 372,000) and the student panel, i.e. 11% of an entire age category. Young people who are successful in their higher educa-tion can benefit from a change in their course of studies, for example from first university level to higher technician courses and therefore take ad-vantage of a more flexible education (table 02).
Nearly one out of four young people leaving the education system have at best a baccalauréat diploma, or a vocational or technician brevet. This group includes young people who failed in higher education (11%) as well as the 13% who left the education system following a terminale class (final year in higher secondary school), in a vocational lycée in most of the cases. In addi-tion, 7% and 10% respectively of those who leave the system have at best a CAP (educational train-ing qualification) or BEP (Certificate of Technical Education) diploma.
In 2004, 38% of the French 25 to 34 year-old population claimed to have a higher education qualification, i.e. a little less than the more recent generations but much more than the 55 to 64 year-old population. With this progress, France is now closing in on the group of more advanced countries (USA, Finland etc.), and ahead of Germany or Italy.
The completion of the initial education represents the first schooling break (schooling starts in pre-school). Surveys on the labour market such as the INSEE survey on Employment have collected numerous indications on the population’s level of education, due to their effect on employment and economy. The information on students who have left the education system is gathered in the most recent surveys (average of the 2005 quarterly surveys, for students who left in 2004). The breakdown per level of qualification of the last three groups (2002 to 2004) is based on a more significant sample. The movements observed by the 2005 surveys aren’t significant enough to reflect accurately the number of young people leaving the education system, as there are approximately 780,000 young people in the generations that the leavers belong to, and study pursuit rates per age are stable (indicator 04). Therefore these results are provisional. The breakdown per “licence master doctorat” curriculum is provided for information only, as the status of certain diplomas is likely to change. The panel of sixième pupils of 1989 includes a sample of ten thousand students who were questioned several times throughout their studies up until 2003. Table 02’s sample relates only to baccalauréat holders who started higher education at the start of the school year (“deferred
Source: INSEE’s Labour force surveys and MEN-DEPP-OECD. Scope: mainland France.
2� I 29 The state of Education no. 16 [2006 issue]

0�01 Proportion of higher education graduates per year and generation
Education level and qualifications of young people having completed their initial education
02 Proportion of an age group obtaining a higher education qualification
Entrée dans l’enseignement supérieur
université, classe prépa.
ou école
Enseignement sup. technique
(STS, IuT, paramédical
et social) Total entréesPremier diplôme
Licence ou diplôme d’école 64 2 38
Diplôme d’études techniques courtes (BTS, DUT, paramédical et social) 15 77 41
DEUG 4 0 2
Total diplômés �3 79 �1
Sans diplôme d’enseignement sup. 17 21 19
Ensemble 100 100 100
Lecture : Sur 100 jeunes du « panel 89 » entrés dans l’enseignement supérieur, 19 n’y ont pas obtenu de diplôme.Source : DEPP-panel 19�9
03 Breakdown of students leaving initial education according to their highest qualification
Diplôme le plus élevé200� 2002 à 200�
CITE* en milliers en % en %Doctorat (sauf santé) 6 � 1 1Diplôme de docteur en santé (médecine...) 5A 5 1 1DEA, magistère 5A 11 2 1Diplôme d’ingénieur 5A 18 2 3Autres diplômes d’écoles 5A 19 3 3DESS 5A 28 4 4Total « niveau master » 5A �1 12 12Maitrise 5A 36 5 5Licence 5A 43 6 6Total « niveau licence » 5A 79 11 11DEUG 5A 11 1 1Total cursus pouvant conduire à la recherche 5A 175 25 25BTS et équivalents 5B 78 11 12DUT, DEUST 5B 17 2,5 2Diplômes paramédicaux et sociaux (infirmières, ...) 5B 24 3,5 3Total cursus professionnels 5B 119 17 17Total enseignement supérieur 5A/6 29� �2 �2Baccalauréat ou équivalent 3A/C 168 24 24dont : ont étudié dans l’enseignement sup. 3A/B 79 11 11CAP, BEP ou équivalent 3C 121 17 17Total diplômés du 2nd cycle du secondaire 3A/C 2�9 �1 �1Brevet 2 48 7 6Sans diplôme 0/2 69 10 11Total brevet et moins 0/2 117 17 17Ensemble des sortants 700 100 100
* La classification internationale type des enseignements (CITE) de l’UNESCO permet de définir des indicateurs comparables dans les différents pays. Nota bene : Les pourcentages sont plus représentatifs que les volumes de sortants, sous-estimés en 2004 (estimations provisoires).Source : calculs DEPP à partir des enquêtes Emploi de l’ INSEE (moyenne annuelle)
Lecture : En 2005, 41% des jeunes âgés de 25 à 29 ans déclarent un diplôme d'enseignement supérieur, contre environ 30 % parmi les générations nées de 1968 à 1970.
Source : calculs DEPP à partir des enquêtes Emploi de l'INSEE (moyennes annuelles depuis 2003)
Constat (enquête)
Générations 77-79
Jeunes de 25-29 ans
74-76
71-73 68-70
65-67
62-64 59-61 56-58
0
5
10
15
20
25
30
35
40
45
50 %
1990 91 92 93 94 95 96 97 98 99 00 01 02 03 04 2005
0 10 20 30 40 50 60 %
Canada
Belgique
États-Unis
Espagne
Finlande
France
Pays-Bas
Royaume-Uni
Allemagne
Italie 55-64 ans 25-34 ans
Source : édition 2006 de « Regards sur l'éducation », OCDE
Proportion of the population with a higher education qualification (200�)

09 [ overview ]
�% of young people leave school “without qualification”, according to the definition set in the sixties. Overall, those without a CAP, BEP or baccalauréat represent 17% of young people.
Over the last 40 years, the reduction in stu-dents leaving without qualification, on lev-
els VI and Vbis of the 1969 French classification, has been spectacular (diagram 01). In 2003, 6% of young people completed their initial education after a “first cycle” class (collège) or a first year in educational training qualification or certificate of technical education (CAP and BEP), compared with over 35% in the sixties.
Pupils dropping out after a general or technologi-cal seconde or première class currently repre-sent 2% of the young population (table 02). Thus, a total of 8% of young people finish their studies before the final preparation year for a “second cycle” qualification. International norms are more demanding. The minimum level of qualification selected by the European Union and international bodies is the completion, by young generations, of a secondary education “second cycle”, validated by a certificate or a diploma. Without this qualifi-cation, it is feared that young people will experi-ence serious social and professional difficulties.
According to this definition, also selected among the reference criteria of the Lisbon Strategy, 17% of the 20 to 24 year olds are not sufficiently edu-cated in France (table 03). Apart from the above-mentioned 8% who dropped out of their studies before completing a second cycle of secondary education, this indicator includes the 9% who completed this second cycle but failed in their examinations: baccalauréat, BEP (Certificate of
Technical Education) or CAP (Vocational Training Qualification). The first 8% are on average eight-een years old when they leave the education sys-tem, the other 9% who failed their examinations are over 19. Young men fail their BEP, CAP or even baccalauréat examinations more frequently than young women. Thus, for these age groups, 19% of young men have no qualification from the second cycle of secondary education, compared with 14% of young women.
The proportion of young people leaving the system without qualification, on education levels VI and Vbis, is included in the LOLF indicators; the objec-tive is to reduce this proportion by half by 2010.
With its proportion of graduates of the second cycle of secondary education, France is now positioned close to the best-performing countries (80% among 25 to 34 year-olds). It has considerably progressed among younger generations, thereby bridging the gap common to all Mediterranean countries and reflecting a later development in secondary education.
The number of students leaving “without qualifications” (levels VI and Vbis) is estimated using several sources, giving similar results (diagram 01). The education level of the population of students leaving the system after their initial education was however slightly underestimated by the annual surveys on employment. Therefore data concerning leaving students shows a break in the statistical series between the populations of 2001 et 2002. In diagram 1, the indicator calculated from school statistics is a frequency whose denominator is the number of students leaving from levels VI and Vbis added to the number of young people reaching the next education level (V). Table 03 relates to young people aged 20 to 24 at the time of the survey. The least educated ones finished their education several years before, while the most educated ones are still studying. This indicator shows a different sequence of events from the indicators examined at the end of the initial education.
Sources: MEN-DEPP and INSEE’s Labour force surveys; Scope: mainland France.
30 I 31 The state of Education no. 16 [2006 issue]

09Students leaving with a low level of education
02 Breakdown of pupils completing secondary education by class and education level
Classe précédant la fin des études secondaires
niveaux de formation ** 199� 2000 2003 200�
en milliers en %Terminales générales et technologiques IV 431 443 427 �19 54,7Terminales professionnelles (bac professionnel et équivalents) IV 82 108 107 110 14,4Total « niveau du baccalauréat » IV 513 551 53� 529 69,1Dernière année d’un CAP ou BEP V 156 176 156 152 19,81ère année de baccalauréat ou brevet professionnel V 14 19 20 20 2,62nde ou 1ère générales et technologiques V 17 20 18 17 2,3Total « niveau du CAP » V 1�7 215 19� 1�9 24,71er cycle, 1ère année de CAP ou BEP VI-Vbis 64 58 50 �� 6,3Total élèves finissant l’enseignement secondaire * 7�� �2� 77� 7�� 100,0dont interruptions avant la dernière année d’un diplôme du 2nd cycle 81 78 68 �5 8,6
* Certains de ces élèves poursuivant leurs études dans l’enseignement supérieur. ** Classification des « niveaux de formation » utilisée en France depuis les années soixante. Diplôme le plus élevé obtenu dans l’enseignement supérieur ou classe de l’enseignement secondaire à laquelle l’élève a eu accès.Source : DEPP au moyen des statistiques scolaires
03 Qualification and education level of 20 to 2� year-olds
Diplôme et classe à laquelle l’élève a eu accès CITE * NF **
199� 2000 200� 2005en % en % en milliers
Total diplômés de l’enseignement supérieur, du baccalauréat, ou d’un BEP ou CAP 3 et + 77 82 83 83 655Total diplômés du Brevet et sans aucun diplôme, répartis comme suit 2 et - 23 1� 1� 17 133Ont étudié jusqu’en dernière année de préparation d’un diplôme de 2nd cycle mais ont échoué aux examens 2 13 10 10 9 69dont : classe terminale d’un baccalauréat ou d’un équivalent IV 6 4 5 5 35dont : dernière année de CAP ou BEP V 7 6 5 4 34Ont arrêté avant la classe terminale de préparation d’un diplôme du 2nd cycle 2 et - 10 8 8 8 64dont : 2nde ou 1ère générales ou technologiques V 1 1 1 2 12dont : 1ère année de CAP ou de BEP, 1er cycle du secondaire ou moins VI-Vbis 9 7 7 6 52Ensemble 100 100 100 100 7��
* Postes de la Classification internationale type de l’éducation (CITE) (anglais : ISCED). ** Postes de la classification française des « niveaux de formation » (1969).Lecture : en 2005, 83 % des jeunes âgés de 20 à 24 ans déclarent détenir un diplôme de l’enseignement supérieur, un baccalauréat, un BEP, ou un CAP. A contrario,17 % des jeunes n’ont pas de diplôme du second cycle du secondaire, soit 133 000 jeunes en moyenne par classe d’âge.Source : calculs DEPP à partir des enquêtes Emploi de l’INSEE (moyennes annuelles depuis 2003)
0
5
10
15
20
25
30
35
40 %
65 67 69 71 73 75 77 79 81 83 85 87 89 91 93 95 97 99 01 03
Source : calculs DEPP à partir des enquêtes Emploi de l’INSEE, des statistiques scolaires et des panels d’élèves.
Lecture : en 1965, plus de 35 % des sortants finissaient leur formation initiale « sans qualification », selon les termes d'époque. Ils arrêtaient avant l'année terminale d'un CAP ou BEP ou une seconde, autrement dit après l'enseignement primaire, le collège, ou quelques mois de formation professionnelle. Ils représentent aujourd'hui 6 % des jeunes.
Statistiques scolaires Enquêtes Emploi Panels d'élèves
0 % 10 20 30 40 50 60 70 80 90 100
Japon Canada
Finlande États-Unis Allemagne
Pays-Bas Belgique
France Italie
Espagne Royaume-Uni 55-64 ans
25-34 ans
Source : édition 2006 de « Regards sur l'éducation », OCDE
01 Proportion of young people leaving school without qualification (levels VI-Vbis) between 19�5 and 200�
Proportion of the population having at least a qualification from the second cycle of secondary education (200�)

10 [ overview ]
The baccalauréat qualification and higher education have become more easily accessible to the various socio-economic groups, but significant inequalities persist between the courses, general, technological and vocational.
The quantitative development of secondary and higher education has made it much more
accessible to a much wider population. This in-creased access and its limitations are assessed, in this document, in broad terms, by examining how children from the different socio-economic groups pass the stages of baccalauréat and get into higher education, and which qualifications are awarded to 20 to 24 year-olds.
In the 1940s generation, more than two out of three children of white-collar managers obtained the baccalauréat, compared with only 6% of the children of working class parents. Among the lat-est generations, born around 1980, nearly half of the children of working class parents obtained the baccalauréat (diagram 01). This progress was particularly rapid during a ten-year period, for the generations born between 1964 and 1968, and 1974 and 1978. In this respect, the significant quantitative development that took place in the late 1980s helped reduce schooling inequalities. The increase in the proportion of general bacca-lauréat holders among children from “underprivi-leged” backgrounds is one of the objectives es-tablished by the equal opportunities policy (Law of 31 March 2006) and is one of the indicators of the LOLF.
Thanks to the progress made in secondary edu-cation, access to higher education has consid-erably increased in the 1990s. Approximately
53% of 20 and 21 year-olds state that they have studied in higher education since 2000. In the last two decades, the opportunity to pursue higher education has more than trebled for the children of working class parents (diagram 02). However, socio-economic differences remain significant, as access to higher education has increased as much, over the last twenty years, for each of the three main socio-economic groups (by just under 30 points).
In 2005, over half of 20 to 24 year-olds claim they have had access to higher education; 9% claim their highest qualification is a technological or vocational baccalauréat and 17% an educational training qualification or certificate of technical education (diagram 3). Children of working-class and salaried employee parents (38%) are more frequently holders of technological and voca-tional secondary education qualifications than children of managers (14%). Compared with the older generation, aged 20 to 24 ten years earlier, more young people pursued higher education in 2005. Conversely, they are less frequently holders of a CAP or BEP as highest qualification, and less frequently have any qualification from the sec-ond cycle of secondary education. Despite a par-ticularly sharp drop, this situation remains more common among the children of working class parents (23% without a qualification compared with 7% for the children of managers).
These three diagrams are based on INSEE surveys. Diagram 01 relates to generations, i.e. young people born in the same year. This data is taken from INSEE’s FQP (vocational training and qualification) and Employment surveys. Diagram 02 relates to overall populations of young people aged 20 and 21 (actual age at the beginning of the year). This data is taken from INSEE’s Employment surveys, first two quarters since 2003. These 20 and 21 year-olds started their studies about two years ago. Annual results have been evened out (average of the last three assessments) for a better representation.
Diagram 03 relates to overall populations of young people aged 20 and 24 (actual age at the time of the survey). Young people’s level of education is defined, first depending on whether or not they have pursued higher education, then on their highest qualification. This perspective makes it possible to distinguish young people who have had access to higher education and, in most cases, are still studying, from those who most often are no longer studying and whose highest qualification is mentioned. This diagram indicates the results of diagram 02. Traditionally, the “socio-economic background” is the socio-economic category of the parents, with priority given to the father. The occupation of a retired or unemployed person is normally the last occupation held. The mother’s occupation is used instead of the father’s when the father is absent or deceased.
Source: INSEE, Labour force and Vocational Training and Qualification surveys.
32 I 33 The state of Education no. 16 [2006 issue]

10
03 Qualifications obtained by 20 to 2� year-olds according to their socio-economic background (in 1995 and 2005)
Education level according to socio-economic background
Sources : calculs LASMAS et DEPP à partir des enquêtes Formation et qualification professionnelle et Emploi de l'INSEE
Enfants d'ouvriers Ensemble des générations Enfants de cadres
1929- 1938
1939- 1948
1949- 1953
1954- 1958
1959- 1963
1964- 1968
1969- 1973
1974- 1978
1979- 1982
0
10
20
30
40
50
60
70
80
90
100 %
av. 1929
Lecture : parmi les jeunes nés de 1979 à 1982, 89 % de ceux dont le père est cadre sont bacheliers, contre 48 % des jeunes de père ouvrier. C'est nettement plus que dans les générations des années 30, où 41% des enfants de cadres obtenaient le baccalauréat, contre 2% seulement des enfants d'ouvriers.
0
10
20
30
40
50
60
70
80 %
84- 86
86- 88
88- 90
90- 92
92- 94
94- 96
96- 98
98- 00
00- 02
03- 05
02- 04
Pères employeurs, cadres, professions intermédiaires
Ensemble Pères employés, agriculteurs, artisans, commerçants
Pères ouvriers
Source : calculs DEPP à partir des enquêtes Emploi de l'INSEE, 1984 à 2005 (deux premiers trimestres depuis 2003).
Lecture : 76 % des jeunes de 20 ou 21 ans dont le père est employeur ou exerce une profession supérieure ou intermédiaire suivent (ou ont suivi) des études supérieures autour de 2004. Pour plus de représentativité, les données de ce graphique sont des moyennes de données enregistrées trois années consécutives.
0
10
20
30
40
50
60
70
80
90
100 %
1995 2005 1995 2005 1995 2005 1995 2005 1995 2005
Ouvriers Employés Ensemble Agriculteurs, artisans, commerçants
Cadres, techniciens, chefs d'entreprise
Brevet ou aucun diplôme
CAP BEP
Bac techno professionnel équivalents
Bac général
Études supérieures
Source : calculs DEPP à partir des enquêtes Emploi de l'INSEE de 1995 et 2005 (moyenne annuelle)
Lecture : en 2005, sur 100 enfants d'ouvriers âgés de 20 à 24 ans, 37 ont eu accès à l'enseignement supérieur. Parmi les autres, 26 indiquent comme diplôme le plus élevé un certificat d'aptitude ou un brevet d'études professionnels, 12 un baccalauréat technologique, professionnel ou assimilé et 2 un baccalauréat général. Au total, 77% de ces jeunes ont au minimum un diplôme du second cycle de l'enseignement secondaire, contre 93 % des enfants de cadres.
01 Baccalauréat obtained by generation and by socio-economic background
02 Access to higher education of 20 to 21 year-olds according to their socio-economic background, between 19�� and 2005

11 [ overview ]
Youth unemployment rate was stable in 2005. The risk of unemployment for those less qualified is particularly worrying.
The unemployment rate of young people available for work aged between 15 and 24
reached on average 21% in 2005 (diagram 01); however, the unemployed represent only 9% of the overall population in these age categories, as a large part of them aren’t economically “active” because they are still in the education system (table 02).
Following an increase in 2003 and 2004, the un-employment rate of young 15 to 24 year-old pro-fessionals stabilised in the first half of 2005. This stabilisation is also observed one to four years after the completion of initial education. The un-employment rate remains very high in the year following the end of the studies: for students who left the education system in 2004, it reaches 35% in the first quarter of 2005, approximately seven months after the end of their studies, and 25% in the following quarters.
Youth unemployment is “oversensitive” to trends in the labour market. The stabilisation of youth unemployment rates in 2005 is the reflection of the slight increase (0.3%), in the number of em-ployees in the private sector (excluding the agri-cultural sector), the number of employees in the service and construction sectors being greater than the continued decrease in the number of employees in the industrial sector1.
The risk of unemployment for young people without a qualification remains particularly high in 2005. The Céreq’s “generation 2001” survey
highlights the differences in terms of exposure to unemployment experienced by young people from different levels of education in the last few years. The shortest unemployment periods con-cern graduates in paramedical and social stud-ies. Young people holding BTS (Higher Techni-cian Certificate) and DUT (University Diploma in Technology) diplomas, as well as technological and vocational baccalauréats, are also less af-fected than graduates of a general second cycle (table 03). Conversely, young people who left the system without a qualification spent most of the three years following the end of their studies looking for a job. A large proportion of them has never even held a job, and the situation of those who left after the first cycle or after the first year of an educational training qualification or certifi-cate of technical education is particularly worry-ing in this respect.
All things being equal, women are more affected by unemployment, compared with men, when their qualifications are lower. However, as they are more protected than their male counterparts by their higher qualifications, their unemploy-ment rate is currently significantly lower than that of young men, at the same stage at the end of their studies.
1. For further information, see Premières informations et
premières synthèses no. 12.1, DARES, March 2006.
In most countries, young people without a qualification from the second cycle of secondary education are much more frequently unemployed than others. In certain Southern countries, however, large proportions of young people hold an unpaid job, which doesn’t depend much on the level of qualification.
The unemployment “rate” denominator is all people economically active seeking or in a job or fulfilling their military obligations (until 2001) (diagram 01, tables 02 and 03). Conversely, the denominator of the proportion of 15 to 24 year-old unemployed people is the entire population of that age (table 02). Diagram 01, table 02 and comparisons between countries are based on surveys on the labour market (INSEE’s Labour force surveys). Diagram 01 relates to young people available for work aged 15 to 24 (actual age at the beginning of the year) who do not continue their studies. The particularity of this 15 to 24 year-old active population who do not continue with their studies is that it does not include many higher education graduates, as they complete their studies, on average, at 24. Comparisons between countries relate to the entire 25 to 29 year-old population who do not continue their studies. Table 03 is from the “Generation 2001” Céreq survey. It relates to students finishing their initial education in 2001, and reflects their situation between the time when they finished their studies and the survey, which took place in 2004.
Source: INSEE, Labour force surveys; Céreq, Generation 2001. Scope: mainland France.
3� I 35 The state of Education no. 16 [2006 issue]

1101 unemployment rates amongst young people available for work and aged 15 to 2�, according to their level of qualification (1971-2005)
Qualifications and the risk of unemployment 03 unemployment and lack of employment between 2001 and 200�, based on the level of qualification
en %de 2001 à 200� En 200�
Part du temps passé
au chômage
% de jeunes n’ayant
jamais connu d’emploi
Taux de chômage
Doctorat, DEA, DESS 13 3 11Écoles 12 1 8Maitrise, licence, DEUG 11 4 12Formations paramédicales et sociales 1 0 2DUT, BTS 10 1 9Total diplômés du supérieur 10 2 9Baccalauréat et études supérieures* 13 5 18Total enseignement supérieur 11 3 11Bac technologique ou professionnel (sans études supérieures) 10 2 13CAP ou BEP 13 3 14Terminale bac sans diplôme 15 3 20Terminale CAP ou BEP sans diplôme** 25 8 311er cycle de l’enseignement secondaire, 1ère année de CAP ou BEP 34 22 40TOTAL 1� 5 1�
* Avec les quelques bacheliers généraux qui n’ont pas étudié dans l’enseignement supérieur ** Avec les quelques jeunes arrêtant en fin de seconde ou première générales ou technologiquesSource : Génération 2001, CEREQ
02 Youth unemployment and general unemployment en %
Jeunes de 15 à 2� ansEnsemble des actifs
Taux de chômage
Taux de chômage
Proportion de chômeurs Ensemble
Diplômés du supérieur
Mars 1980 13,9 7,7 6,1 3,6
Mars 1985 23,7 12,3 10,2 3,8
Janvier 1990 18,1 8,0 9,2 3,5
Mars 1995 24,0 9,2 11,6 6,7
Mars 2000 19,3 7,2 10,0 5,2
Année 2003 20,1 8,4 9,7 6,9
Année 2004 21,3 8,9 9,9 6,9
Année 2005 21,� �,9 9,� �,�Source : calculs DEPP à partir des enquêtes Emploi de l’INSEE (moyenne annuelle à partir de 2003)
0
5
10
15
20
25
30
35
40
45
50 %
3-71
3-73
1-75
3-77
3-79
3-81
3-83
3-85
3-87
3-89
3-91
3-93
3-95
3-97
1-99
3-01
S1-03
S1-05
Année
Aucun diplôme
Brevet seul
CAP BEP
Baccalauréat
Supérieur
Lecture : depuis le milieu des années soixante-dix, les jeunes actifs ont été durement confrontés au chômage, en particulier les moins diplômés (ces « jeunes actifs » sont âgés de 15 à 24 ans en début d'année ; ceux de 2005 sont nés de 1980 à 1989).
Source : calculs DEPP à partir des enquêtes Emploi de l'INSEE (moyenne des deux premiers trimestres à partir de 2003)
Pays-
Bas
États-
Unis
Royaum
e-Uni
Finlan
de
Grèce
Italie
Canad
a
Suède
France
Allemag
ne
Belgiqu
e
Polog
ne
Source : édition 2006 de « Regards sur l'éducation », OCDE
0
5
10
15
20
25
30
35 %
Sans diplôme du second cycle du secondaire (CITE 0-2) Diplômés du second cycle du secondaire (CITE 3-4) Diplôme d'enseignement supérieur (CITE 5-6)
Proportion of 25 to 29 year-olds who are no longer studying and unemployed, based on their level of qualification (200�)

12 [ overview ]
When starting a career, socio-economic status depends on the qualification obtained. As they have higher qualifications, young working women generally have more qualified positions than men. A higher education qualification significantly enhances the salary and career, but this time more substantially for men.
Becoming an executive manager, teacher, doctor, lawyer, nurse, technician or com-
mercial representative, depends above all on the level of qualification and not so much on socio-economic background. Therefore, by the start of their career, 79% of graduates from a long higher education curriculum in or seeking a job, hold a higher or intermediate occupation in 2005, compared with 56 % of graduates from a shorter curriculum and 24% of baccalauréat holders (dia-gram 01). The children of teachers, managers or intermediate professionals have a more moder-ate advantage of 7 points over the children of working class parents, salaried workers and self-employed workers, with a similar level of qualifi-cation obtained from a longer higher education curriculum.
Since 2002, the women on the employment market have held a higher or intermediate position at the start of their careers more often than men. This is mostly due to their higher qualifications as, with a similar level of qualification, their access to these positions is more limited than men’s. Based on comparable socio-economic categories, women work in the public sector more often than men and, notably, make up a higher proportion of teachers.
With regard to the occupation and responsi-bilities held, the salary level also depends on the level of qualifications, more markedly for men. Between the ages of 30 and 34, higher education
graduates from a longer curriculum, both men and women, receive a median salary 1.7 times greater than that of people without a qualifica-tion (diagram 02). This difference in remuneration increases with age and as careers develop, more so for men than women (2.4 compared with 2.1 between 50 and 54 years old).
In all countries, higher education graduates receive higher salaries than the majority of the adult population with a job. The income brackets of these graduates make it possible to compare the profitability of their studies. Income differences observed in various countries are more or less significant and also reflect different socio-economic conditions, more or less hierarchical.
Diagram 01 illustrates young people having completed their initial education in the last 2 to 9 years and economically “active” (in or seeking a job). Occupation groups include: entrepreneurs and higher and intermediate occupations; manual workers; salaried workers, farmers, tradesmen and shopkeepers. The public sector covers State, regional and healthcare public service positions but not public corporations. Diagram 02 illustrates the “median” salary of full-time workers, including bonus pay. The salary is the key factor splitting the population into two equal groups, the better paid on one hand and the lesser paid on the other. Higher education qualifications from a “long” curriculum are degrees from Grandes Ecoles and second and third University cycles. Higher education qualifications from a “short” curriculum are DUT (University Diploma in Technology), BTS (Higher Technician Certificate), DEUG (General University Diploma awarded after a two-year cycle) diplomas and qualifications from paramedical and social studies. Diagram 03 offers a breakdown of higher education graduates (items 5A and 6 of the ISCED) based on their remuneration (annual income from employment before taxes). This remuneration is evaluated, in France, based on monthly salaries as declared in Employment surveys. Remuneration brackets are defined comparatively with the median remuneration of the population aged 25 to 64 and holding a job, all levels of education considered.
Source: OECD and INSEE, 2005 Labour force surveys. Scope: mainland France.
3� I 37 The state of Education no. 16 [2006 issue]

12
02 Monthly salaries claimed in 2005, based on age and qualifications, median salary of full-time workers
Qualifications, socio-economic status and salary
0
10
20
30
40
50
60
70
80
90 %
Diplômésupérieur long
Diplômésupérieur court
Bachelier Non bachelier Tous diplômes
Homme Père enseignant, cadre ou technicien
Père employé ou indépendant Père ouvrier Femme
Lecture : sur l'ensemble de l'année 2005, parmi les diplômés de l'enseignement supérieur long (histogrammes de gauche), 81 % des hommes exercent une profession supérieure ou intermédiaire (dont chef d'entreprise), pour 77 % des femmes, 76 % des jeunes dont le père est ouvrier et 83 % de ceux dont le père est cadre. Ces mêmes proportions fluctuent entre 52 % et 63 % pour les diplômés du supérieur court, entre 21 % et 33 % pour les bacheliers et entre 5 % et 13 % en deçà du baccalauréat. Champ : personnes sorties de formation initiale depuis 2 à 9 ans (entre 1996 et 2003) et occupant ou recherchant un emploi. Source : calculs DEPP à partir des enquêtes Emploi de l'INSEE (quatre trimestres 2005)
0
500
1 000
1 500
2 000
2 500
3 000
3 500
4 000 €
0
500
1 000
1 500
2 000
2 500
3 000
3 500
4 000 €
15-19 20-24 25-29 30-34 35-39 40-44 45-49 50-54 55-59 ans
Supérieur long
Supérieur court
Bachelier
CAP/BEP
Brevet
Certificat d'études
Aucun diplôme
15-19 20-24 25-29 30-34 35-39 40-44 45-49 50-54 55-59 ans
Source : calculs DEPP à partir des enquêtes Emploi 2005 de l'INSEE (moyenne annuelle)
Hommes Femmes
Lecture : âgés de 50 à 54 ans et diplômés de l'enseignement supérieur long, la moitié des hommes déclare au cours de l'année 2005 percevoir un salaire net mensuel d'au moins 3 200 € (primes incluses) et la moitié des femmes un salaire d'au moins 2 500 €. Seuls sont pris en compte les salariés, exerçant à temps plein, suffisamment représentés dans l'enquête (300 observations). Les salaires sont formulés en euros de 2005.
Source : édition 2006 de « Regards sur l'éducation », OCDE
0
10
20
30
40
50
60
70
80
90
100 %
Rep. Tc
hèque
Pologn
eFra
nce
Royaum
e Uni
Espagn
e
Finlan
deIta
lieSuèd
e
États-
Unis
Allemagn
e
Canada
Norvège
plus de 2 fois le gain médian de 1,5 à 2 fois le gain médian
du gain médian à 1,5 fois plus de la moitié au gain médian moins de la moitié du gain médian
Lecture : 89 % des diplômés de l'enseignement supérieur de « haut niveau » (CITE 5A ou 6) de République Tchèque déclarent une rémunération supérieure à celle perçue par la moitié de la population âgée de 25 à 64 ans occupant un emploi, tous niveaux d'études confondus.Champ : diplômés de l'enseignement supérieur (CITE 5A ou 6) âgés de 25 à 64 ans et occupant un emploi.
01 Access to a higher or intermediate occupation based on qualifications, gender and socio-economic background (2005)
Breakdown in the remuneration of higher education graduates in various countries

13 [ overview ]
Because of their greater skills in French, girls are more successful educationally than boys and reach higher levels of qualifications. They represent the majority of baccalauréat holders and higher education students but hesitate in following scientific and industrial training programmes.
C lose to boys in terms of mathematical or scientific ability, girls are significantly ahead
of them in French or written comprehension during national and international assessments of academic knowledge.
Therefore girls have an easier or smoother educa-tion than boys. Among the pupils of the 1989 panel, whose education was pursued until completion of higher education, there are far more boys who did not obtain the baccalauréat (14 points’ differ-ence), whereas more girls graduate from higher education, notably a “baccalauréat + 3 years” level or more (11 points’ difference, diagram 01).
Girls reach the baccalauréat level more fre-quently and at an earlier age than boys, and their success rate at this examination is also higher in practically all types of baccalauréat; girls are in a majority among those obtaining the baccalauréat (54% at the 2005 session), notably of a general type (59%). However, the presence of girls in dif-ferent types of baccalauréat seems highly vari-able. Thus, in the general baccalauréat, girls are massively over-represented in literary sections (82% of graduates at the 2005 session, i.e. 1 point down on the highest level of 2002), very much the majority in the economic and social section (64%), whereas they remain the minority in the science section despite recent progress (46.5% at the 2005 session, up 4 points in ten years). With respect to the technological baccalauréat, tertiary specialisation remain favourites among girls (62% of baccalauréat graduates in STT
- Technological and Tertiary Science, although this proportion has gone down in the last few years, and 96% in SMS - Medical and Social Sci-ence), while industrial specialisation is favoured by boys (92% in STI – Industrial Science and Tech-nology). Among vocational baccalauréat hold-ers, girls remain largely underrepresented (42%) (diagram 02). Increasing the proportion of girls in scientific terminale classes (S, STI and STL sec-tions) is one of the objectives of the LOLF.
The same applies to vocational courses lead-ing to a CAP (Educational Training Qualifica-tion) or BEP (Certificate of Technical Education): Generally fewer in number than boys, girls are over-represented in tertiary specialisation (71%) and largely absent from the manufacturing field (13%) despite slight changes observed in the last 5 years (table 03).
These differences are confirmed or even ampli-fied in higher education (table 04). Over-repre-sented on general university courses in humani-ties (three quarters of new enrolments) and in the areas of healthcare and law (two thirds), girls are less likely than boys to enrol in the most selective or competitive areas (CPGE - preparatory classes for Grandes écoles or IUT - University Institutes of Technology). Similarly, in universities, girls are largely in the majority among new students (58% of new students), but their advance declines during the licence-mastère-doctorat (bachelor’s degree – master – phD) curriculum.
In most OECD countries, the number of higher education female graduates is now greater than that of male graduates. Thus, among 25 to 34 year-olds, and with the exception of Germany and the UK, the proportion of higher education female graduates exceeds that of males, by 5 to 6 points in the USA, France, Japan or Italy, and even more significantly in Belgium or Finland.
Sources: MEN-DEPP (notably the data from the panel of pupils who started their sixième class in 1989). For international comparisons: OECD-CERI.
3� I 39 The state of Education no. 16 [2006 issue]

13
02 Percentage of female baccalauréat holders by type of examination between 1970 and 2005
Schooling for girls and boys03 Girls and boys in the final year of CAP or BEP according to training specialty
métropole + DOM
Groupe de spécialités2000 2005
Effectif % filles Effectif % fillesTransformations 11 174 24,1 12 794 26,8Génie civil, construction, bois 18 244 6,2 20 756 7,9Matériaux souples 9 142 95,3 8 015 94,0Mécanique, électricité, électronique 73 165 2,1 66 829 2,5Production 113 0�1 12,� 109 �9� 13,2Commerce, vente 24 275 65,6 32 093 59,5Comptabilité, gestion 35 144 58,4 27 724 54,8Secrétariat, bureautique 29 615 95,6 25 579 94,2Sanitaire et social 18 764 96,2 21 665 94,3Hôtellerie, tourisme 13 784 51,3 13 499 50,2Coiffure, esthétique, services aux personnes 8 115 96,5 11 431 97,0Services aux collectivités 6 136 78,4 5 293 75,7Services 1�� 2�� 73,3 1�� �01 71,0Ensemble des formations 257 307 ��,7 25� 297 ��,3Source : MEN-DEPP
0� Proportion of girls among baccalauréat holders entering the principal sectors of higher education
métropole + DOM 2000 2005
Droit 68,8 67,5Économie 54,8 51,9Lettres 76,4 75,0Sciences 39,0 40,1Santé 66,3 64,4IUT 39,3 37,4Ensemble université (1) 57,� 57,�CPGE (2) 43,3 44,1STS (2) 50,5 48,8Ensemble 5�,7 5�,3
Source : MEN-DEPP
0
10
20
30
40
50
60
70
80
90
100 %
garçons filles
diplôme bac + 3
diplôme bac + 2
sortie du supérieur sans diplôme
bac sans poursuite d'études
diplôme < bac ou pas de diplôme
Source : MEN-DEPP
Source : MEN-DEPP
0
10
20
30
40
50
60
70
80
90
100 %
1970
19
74
1978
19
82
1986
19
90
1994
19
98
1972
19
76
1980
19
84
1988
19
92
1996
20
00 20
02 20
04
métropole SMS
STT
L
ES général tous bacs
techno. S
prof.
STI
0 % 10 20 30 40 50 60 Japon
Belgique États-Unis
France Espagne
Pays-Bas Royaume-Uni
Finlande Allemagne
Italie Hommes Femmes
Source : édition 2006 de « Regards sur l'éducation », OCDE
Proportion of higher education graduates among 25 to 3� year-old men and women (200�)
01 Level of qualification reached by boys and girls from the 19�9 panel
(1) Champ SISE soit 81 universités et les 2 centres universitaires de formation et de recherche.(2) Informations disponibles pour les CPGE et STS sous tutelle du ministère de l’Éducation nationale, soit tous les élèves du public, et 86 % des élèves des STS privées et 99 % des élèves des CPGE privées en 2005.

1� [ overview ]
The situation and progress of European countries in the context of a dynamic, knowledge-based economy.
A t the 2000 Lisbon summit, European govern-ments decided on the common perspective
of a dynamic, knowledge-based economy. To this end, statistical analysis and shared evaluation should enable the progression and identification of successful policies. In 2003, five objectives were established on priority education and voca-tional training issues: widespread development of the second cycle in secondary education, reduction in the number of early dropouts from the education system, development of adult “training”, improvement in basic reading skills and increase in the number of science and tech-nology graduates.
In order for younger generations to acquire aca-demic knowledge in line with the notion of knowl-edge-based economy, the objective is to reach 85% of graduates from the second cycle of sec-ondary education by 2010, throughout the Euro-pean Union. This is only the case, in 2005, for 77% of young people of approximately 22 years old (83% in France). Expected progress is therefore 8 points in five years, following a 1 point improve-ment since 2000. Scientific ability is crucial. The target of a 15% increase in the number of higher education graduates in science and technology in ten years was met in 2003.
At the same time, fighting school failure and early dropouts is an important issue in order to improve social cohesion. A 20% drop in the proportion of weaker readers is expected by 2010, i.e. 15.5% of 15 year-olds at the lowest performance levels of
the PISA survey tests in the OECD. There were as many in 2003 as in 2000, according to an estima-tion relating to all participants from the European Union. In addition, the proportion of early drop-outs among young people should be under 10% in 2010, compared with 15% in 2005 (13% in France), and approximately 18% in 2000.
International comparisons show that the differ-ences in “level of education” between countries are generally traditional. Thus, in all countries with less than 10% early dropouts among young people, a very large proportion of their parents, born around 1950, had already successfully com-pleted a second cycle in secondary education (diagram 01). In these countries, access to sec-ondary education has been widely accessible for a long time.
Furthermore, in order for the entire population to enhance and update their knowledge, the ob-jective is to increase to 12.5% the percentage of 25 to 64 year-old adults having taken courses or training programmes in the last month by 2010, compared with 10.8% in 2005 (7.6% in France). Scandinavian countries, Great Britain and Hol-land show the largest proportions of adults, par-ticularly with low education levels, who benefited from this training (diagram 03).
Diagrams 01 and 03 are based on European surveys on the labour market (such as the French Employment survey), processed by Eurostat. Diagram 02 is based on the programme for international student assessment (PISA), processed by the OECD. These reference criteria have been defined by the conclusions of the Council of 5 and 6 May 2003. The reference for early dropouts is the proportion of 18 to 24 year-olds who no longer continue studying and have an ISCED level of 2 or less. The reference for widespread development of secondary education is the proportion, among the entire 20 to 24 year-old population, of young people with an ISCED level of 3 and above. Stage 3 of the international standard classification of education (ISCED) is the second cycle of the secondary sector (programme of at least two years according to recent specifications). Regarding the “results” of the education system, the only studies taken into consideration are the ones successfully completed, i.e. validated by the qualification sought after. In diagram 01, the higher age at which second cycle qualifications were obtained (ISCED 3) is the cause of the differences between the percentage of 20 to 24 year-olds of level 2 and below and the percentage of early dropouts which, upon analysis, is most reliable. Young people hereby considered “bad readers” are, at best, capable of relating a simple text to everyday knowledge. Participation in a course or training programme is envisaged based on questions, similar in the different countries, on the different forms of institutional education.
Source: Eurostat, OECD
�0 I �1 The state of Education no. 16 [2006 issue]

1�03 Adults having undergone education or training in the last month, based on their level of qualification (2003)
Lisbon’s European objectives
0
10
20
30
40
50
60
70
80
90 %
Portu
gal
Espag
neIta
lie
Union e
uropé
enne
Royaum
e-Uni
Allemag
ne
Pays-
BasGrèc
e
Belgiqu
eFra
nce
Hongri
eIrla
nde
Litua
nie
Autrich
e
Finlan
deSuè
de
Danem
ark
Rép. Tc
hèqu
e
Polog
ne
Jeunes de 20-24 ans sans CAP, BEP ou bacSortants précoces Personnes de 45-54 ans sans CAP, BEP ni bac
Source : calculs Eurostat à partir des enquêtes européennes sur les forces de travail.
Lecture : en France, 13 % de l’ensemble des jeunes de 18 à 24 ans ne poursuivent pas d'études et n'ont ni CAP, ni BEP, ni baccalauréat et sont « sortants précoces », en 2005. Poursuivant ou non des études, 17 % des jeunes âgés de 20 à 24 ans, n'ont, de même, ni CAP, ni BEP, ni baccalauréat (c'est le complément à 100 de 83 % de diplômés du second cycle du secondaire en France). Dans les générations de leurs parents (nées de 1947 à 1956), 4 personnes sur 10 sont dans ce cas.
Source : calculs Eurostat à partir des enquêtes européennes sur les forces de travail.
0
5
10
15
20
25
30
35
40 %
Grèce
Hongri
e
Portu
gal
Polog
ne
Rép. Tc
hèqu
e Ita
lie
Litua
nie
France
Irland
e
Allemag
ne
Belgiqu
e
Union e
uropé
enne
Espag
ne
Autrich
e
Pays-
Bas
Finlan
de
Danem
ark
Royaum
e-Uni
Suède
Adultes peu diplômés
Ensemble des adultes (25-64 ans)
Lecture : en France, 7,6 % des personnes âgées de 25 à 64 ans ont en 2005 suivi des cours ou une formation au cours du dernier mois, tous niveaux d'études confondus, et 3,3 % des personnes peu diplômées (sans CAP, BEP ni baccalauréat).
30 25 20 15 10 5 0 % 0 % 5 10 15 20 25 30GrèceItalie
AllemagnePortugalEspagneAutricheHongrie
Union européenne*Rép. Tchèque
LettonieBelgique
FrancePologne
DanemarkSuède
Pays-BasIrlande
FinlandePISA 2000
PISA 2003
b) comparaison 2000-2003 a) situation en 2003
* estimation de la commission européenne à partir des résultats de 16 pays Lecture : selon les tests de littéracie de l'enquête de 2003, les enfants de 15 ans sont, en France, pour 6 % de très mauvais lecteurs (moins de 358 points) et pour 11 % de mauvais lecteurs (entre 358 et 420 points), soit un total de 17 % (moins de 420 points), contre 15 % en 2000.
Très mauvais lecteurs (- de 358 points)
Mauvais lecteurs (358 à 420 points)
Source : calculs OCDE à partir des données du programme international pour l'évaluation des élèves (PISA)
01 Early dropouts and populations without a qualification from the second cycle of secondary education (2005)
02 Proportion of 15 year-olds with poor reading skills (PISA)

15 [ primary Education ]
Source: MEN-DEPP. For international comparisons: OECD-CERI. Scope: mainland France + overseas départements taken together.
In 2005, more than a quarter of the domestic expenditure on education, or 32.1 billion Euros, was devoted to primary education. Between 19�0 and 2005, the average expenditure per pupil in the primary sector rose by 7�% at constant prices, and today reaches �,�10 Euros.
In 2005, expenditure on primary education (primary and pre-school education, special
teaching and integration into the primary sector and related activities) represented 32.1 billion Euros, a 0.5% increase on the previous year (at constant prices). Approximately 40% of this sum came from regional government bodies, mainly local communes, which cover the costs of non-teaching staff (territorial agents at the service of pre-school education – ATSEM) as well as the operating investment costs in primary schools.
Between 1980 and 1992, the share of expendi-ture devoted to the primary sector form the total domestic expenditure on education saw a sus-tained decrease from 28.9% to 26.4%, followed by a slight increase to 27% in 1999; it has been mod-erately fluctuating since, and reached 27.2% in 2005. Although the domestic expenditure on edu-cation, at constant prices, has increased overall by 82% in 25 years, the rise over this period was limited to 72% for the primary sector.
In a general context of fewer pupils in primary education and the upgrading of teaching careers (creation of the primary school teacher qualifica-tion of professeur des écoles), there has been a sharp increase in the average expenditure per pupil: Between 1980 and 2005, this expenditure rose from 2,650 to 4,810 Euros, or a 76% increase at constant prices (taking account of the change in calculation in 1999: see methodology).
The average annual expenditure per pupil in pre-schools and primary schools has started to balance out since 1980, reaching approximately 4,060 Euros in 1997, thanks to improvements in the average number of teachers per pupil, and the major rise in expenditure on pre-school staff-ing by local authorities. Since 1998, the cost of a primary school pupil has exceeded that of the pre-school pupil.
Between 1990 and 2005, the cost of education per pupil in the primary sector, calculated to take account at each date of the average number of years spent in pre-school and primary education, grew by 40%. The share of primary education fell slightly (from 65.8% to 61.1%) because of the re-duction in the number of repeated years in prima-ry schools (thus returning the average duration of studies to the theoretical value of 5 years) and the relatively stronger increase in the average cost per pre-school pupil.
International comparisons of average costs per pupil are difficult, because the costs taken into account by the different countries are not always homogeneous (they sometimes only relate to the public education sector). With respect to primary education, in 2003, France is below the OECD countries average, and significantly behind the United States. Amongst European countries, only Spain and Germany present lower costs.
The amount of expenditure for the last four years is provisional. Primary education expenditure includes all the expenditure on public and private establishments in mainland France, related to education and associated activities: canteens and boarding schools, administration, guidance counselling, healthcare at school, school supplies, school transport, remuneration of education personnel undergoing training courses etc., for the portion relating to primary schools. The renovation of the education account results in an alteration of the amount of the average expenditure per pupil, which was only recalculated for the 1999-2005 period. The 1980 to 2005 trend is therefore the result of two separate trends: 1980 to 1999, “former basis”, and 1999 to 2005, “new basis”. The international indicator is presented in the dollar equivalent converted using purchasing power parities, which are currency conversion rates enabling the specification of the purchasing power of various currencies in a common unit.
�2 I �3 The state of Education no. 16 [2006 issue]

15Expenditure on primary education 01 Expenditure on primary education
métropole + DOM
19�0 1990 2000 200� 2005
DIE pour le 1er degré*aux prix courants (en milliards d’euros) 8,3 18,3 28,4 31,3 32,1 aux prix de 2005 (en milliards d’euros) 18,7 23,1 31,3 31,9 32,1 Part dans la DIE 28,9 % 26,9 % 26,9 % 27,1 % 27,2 % Dépense moyenne par élève*aux prix de 2005 (en euros) 2 650 3 380 4 720 4 810 � �10 Structure du financement initial (en %)**État 53,3 52,�
dont MEN 53,1 52,4Collectivités territoriales 39,7 �0,�Autres administrations publiques et CAF 1,9 1,9Entreprises 0,0 0,0Ménages 5,1 5,1
(*) La réévaluation de la DIE (voir méthodologie indicateur 01) s’applique à l’ensemble de la période 1980-2005. Les dépenses moyennes par élève n’ont été recalculées qu’à partir de 1999. (**) La structure du financement initial du premier degré fait l’objet d’une nouvelle estimation à partir de 2003.Source : MEN-DEPP
03 Cost of primary education (at 2005 prices) taking account of the average duration of attendance in pre-school and primary schools in 1990 and 2005
1990 2005
en euros en % en euros en %
Préélémentaire 9 700 34,2 15 430 38,9
Élémentaire 18 650 65,8 24 260 61,1
Total 2� 350 100,0 39 �90 100,0
Source : MEN-DEPP
2 000
2 500
3 000
3 500
4 000
4 500
5 000 €
1980 1983 1986 1989 1992 1995 1998 2001 2004
3 150
4 760
2 650
1er degré, y compris AIS
2 630
4 680
* En 1999 il y a une rupture de série due à la rénovation du compte : changement de périmètre (intégration des DOM), revalorisation des charges sociales rattachées, des dépenses des ménages notamment (cf note).
Source : MEN-DEPP
4 810
élémentaire préélémentaire
0 1 2 3 4 5 6 7 8 9
États-Unis Italie
SuèdeJapon
Royaume-UniPays-BasAustralie
Moyenne des pays de l'OCDEFinlande
FranceEspagne
Allemagne
Source : édition 2006 de « Regards sur l'éducation », OCDE
Average expenditure per pupil In public and private primary schools, in thousands of dollar-equivalent (2003)
02 Evolution in the average expenditure per pupil in primary education* at 2005 prices (19�0-2005)

1� [ primary Education ]
Enrolment rates per age group compares school populations, according to birth years, with the populations of the matching generations as per INSEE Census or assessment. Thus, the enrolment rate of 2 year-old children is estimated at 24.5% in 2005. Only the children who are 2 by the time school starts are allowed to enrol, therefore nearly 40% of the children born between 01/01/2003 and 31/08/2003 were in fact enrolled in 2005. Due to the administrative strike of a number of school directors, the data published hasn’t been accurately updated since the start of the 2000 school year. The data concerning class sizes and schooling rates may not be very accurate. However, thanks to the help of departmental inspectors, a set of departmental data has been collected for the 2005-2006 school year.
Due to the demographic decrease, the primary sector has been able to improve education conditions in pre-school and primary schools. However, it is now facing a recovery in birth rates observed since 2000.
During the past few decades, school enrol-ments in the primary sector have seen three
major trends: the development of school enrol-ment before the age of 6, a drop in the number of pupils due to the demographic decrease and the decrease in academic deficiency, and general improvement in pupils’ education conditions.
In pre-school, the entry of 5 year-olds and later 4 year-olds, became increasingly widespread in the 1960s and 1970s. Nowadays, almost all 3 year-olds are enrolled in school, not the case for 2 year-old children, as their enrolment often depends on the number of places available and thus the evolution of the 2 to 5-year-old popula-tion. Having remained close to one-third since the 1980s, the level of schooling of 2 year-old children tends to decrease in the last few years (diagram 01), due to the significant demographic upturn since 2000 (over 760,000 annual births).
In all primary and pre-schools, in both public and private establishments, pupils have benefited from a marked reduction in class sizes. In pre-schools, the average class size remained high, at around 40 pupils, until the early 1970s. From that time, pupil numbers progressively decreased to approximately 26 pupils. In primary schools, this trend is not so pronounced. The average class size, of approximately 30 pupils in the 1960s and 26 in the early 1970s, is a little higher in the pri-vate sector than the public sector, and is now inferior to 23 pupils.
This evolution is however accompanied by a decrease in the number of schools, from 68,000 in 1980 down to 64,000 in 1990, 59,000 in 1999 and 56,000 at the start of the 2005 school year, due to the disappearance of rural single-class schools (less than 5,000 schools nowadays compared with 11,000 in 1980) and the grouping or merger of pre-schools and primary schools. School break-down according to the number of classes there-fore tends to change, with a regular “upward” trend (diagram 02).
The maintenance, or even reinforcement of teaching staff, while the number of pupils was on the decrease, had led to a continuous improve-ment, until 2003, of the teacher/pupil ratio (P/E) (diagram 03).
The teacher/pupil ratio in primary education can double depending on the OECD country. In 2004, the UK average was 21.1 pupils per teacher, compared with 19.4 in France and 10.7 in Italy.
Source: MEN-DEPP, DGESCO. Scope: mainland France and mainland + overseas départements, public and public + private, MEN.
�� I �5 The state of Education no. 16 [2006 issue]

1�Schooling and education conditions in the primary sector
Average number of pupils per teacher in primary education (200�)
0
10
20
30
40
50
60
70
80
90
100 %
1970 72 74 76 78 80 82 84 86 88 90 92 94 96 98 2000 0502 04
5 ans
4 ans
2 ans
3 ans
Source : MEN-DEPP
0
2 000
4 000
6 000
8 000
10 000
12 000
14 000
16 000
1 2 3 4 5 6 à 10 11 à 15 15 et +
1999-00 2005-06Nombre d'écoles
Nombre de classes
Source : MEN-DEPP
5,00
5,10
5,20
5,30
5,40
5,50
1996 1997 1998 1999 2000 2001 2002 2003 2004 2005
métropole + DOM
Source : MEN-DGESCO
10,7
12,1
12,9
14,3
15,0
15,9
16,3
Royaume-Uni
Japon
France
Allemagne
Finlande
Pays-Bas
États-Unis
Espagne
Belgique
Suède
Italie
Source : édition 2006 de « Regards sur l'éducation », OCDE
18,8
19,4
19,6
21,1
01 Schooling rates of 2, 3, � and 5-year-old children (1970-2005)
02 School breakdown according to the number of classes
03 Number of teachers per pupil in the public primary sector (199�-2005)
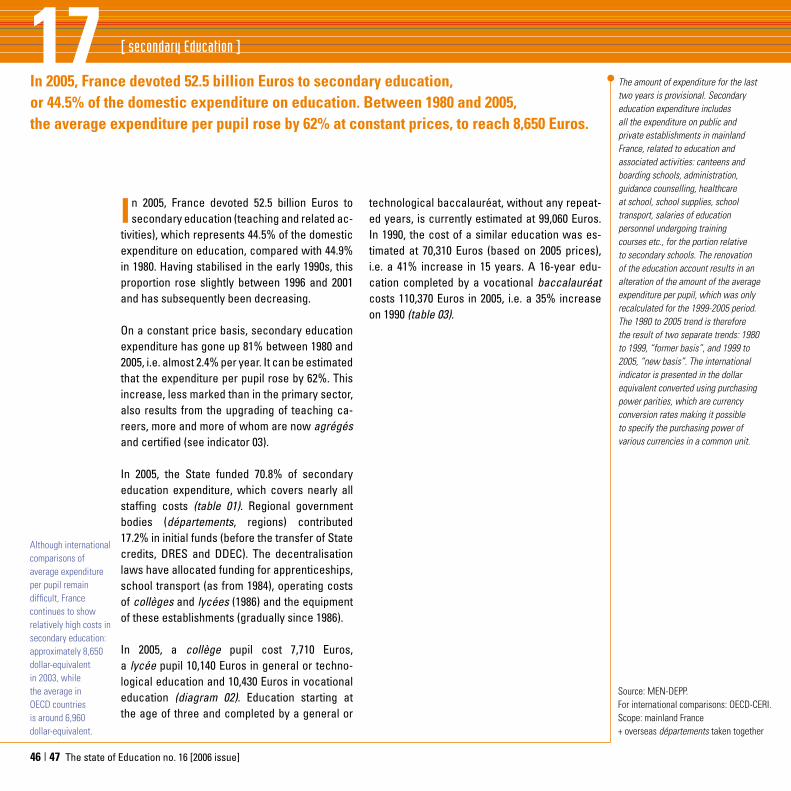
17 [ secondary Education ]
The amount of expenditure for the last two years is provisional. Secondary education expenditure includes all the expenditure on public and private establishments in mainland France, related to education and associated activities: canteens and boarding schools, administration, guidance counselling, healthcare at school, school supplies, school transport, salaries of education personnel undergoing training courses etc., for the portion relative to secondary schools. The renovation of the education account results in an alteration of the amount of the average expenditure per pupil, which was only recalculated for the 1999-2005 period. The 1980 to 2005 trend is therefore the result of two separate trends: 1980 to 1999, “former basis”, and 1999 to 2005, “new basis”. The international indicator is presented in the dollar equivalent converted using purchasing power parities, which are currency conversion rates making it possible to specify the purchasing power of various currencies in a common unit.
In 2005, France devoted 52.5 billion Euros to secondary education, or ��.5% of the domestic expenditure on education. Between 19�0 and 2005, the average expenditure per pupil rose by �2% at constant prices, to reach �,�50 Euros.
In 2005, France devoted 52.5 billion Euros to secondary education (teaching and related ac-
tivities), which represents 44.5% of the domestic expenditure on education, compared with 44.9% in 1980. Having stabilised in the early 1990s, this proportion rose slightly between 1996 and 2001 and has subsequently been decreasing.
On a constant price basis, secondary education expenditure has gone up 81% between 1980 and 2005, i.e. almost 2.4% per year. It can be estimated that the expenditure per pupil rose by 62%. This increase, less marked than in the primary sector, also results from the upgrading of teaching ca-reers, more and more of whom are now agrégés and certified (see indicator 03).
In 2005, the State funded 70.8% of secondary education expenditure, which covers nearly all staffing costs (table 01). Regional government bodies (départements, regions) contributed 17.2% in initial funds (before the transfer of State credits, DRES and DDEC). The decentralisation laws have allocated funding for apprenticeships, school transport (as from 1984), operating costs of collèges and lycées (1986) and the equipment of these establishments (gradually since 1986).
In 2005, a collège pupil cost 7,710 Euros, a lycée pupil 10,140 Euros in general or techno-logical education and 10,430 Euros in vocational education (diagram 02). Education starting at the age of three and completed by a general or
technological baccalauréat, without any repeat-ed years, is currently estimated at 99,060 Euros. In 1990, the cost of a similar education was es-timated at 70,310 Euros (based on 2005 prices), i.e. a 41% increase in 15 years. A 16-year edu-cation completed by a vocational baccalauréat costs 110,370 Euros in 2005, i.e. a 35% increase on 1990 (table 03).
Although international comparisons of average expenditure per pupil remain difficult, France continues to show relatively high costs in secondary education: approximately 8,650 dollar-equivalent in 2003, while the average in OECD countries is around 6,960 dollar-equivalent.
Source: MEN-DEPP. For international comparisons: OECD-CERI. Scope: mainland France + overseas départements taken together
�� I �7 The state of Education no. 16 [2006 issue]

17Expenditure on secondary education01 Expenditure on secondary education
métropole + DOM
19�0 1990 2000 200� 2005DIE pour le second degré*aux prix courants (en milliards d’euros) 12,8 30,7 47,9 51,7 52,5 aux prix de 2005 (en milliards d’euros) 29,0 38,9 52,7 52,7 52,5 Part dans la DIE 44,9 % 45,2 % 45,5 % 44,8 % ��,5 % Dépense moyenne par élève*aux prix de 2005( (en euros) 5 290 6 480 8 480 8 620 � �50 Structure du financement initial (en %) **État 71,9 70,�
dont MEN 66,7 65,7Collectivités territoriales 16,3 17,2Autres administrations publiques et CAF 2,2 2,2Entreprises 1,8 1,9Ménages 7,8 7,9
(*) La réévaluation de la DIE (voir méthodologie indicateur 01) s’applique à l’ensemble de la période 1980-2005. La DIE inclut l’apprentissage de niveau secondaire.Les dépenses moyennes par élève n’ont été recalculées qu’à partir de 1999. (**) La structure du financement initial du second degré a fait l’objet d’une nouvelle estimation à partir de 2003.Source : MEN-DEPP
03 Theoretical expenditure on various, typical education without any repeated years (at 2005 prices, in Euros)
Scolarités-typesDuréetotale
Dépense totale (aux prix de 2005)
1990 2005
BEP 2 ans 14 ans 65 540 89 510
Baccalauréat général et technologique 15 ans 70 310 99 060
Baccalauréat professionnel 16 ans 81 640 110 370
Source : MEN-DEPP
4 000
5 000
6 000
7 000
8 000
9 000
10 000
11 000 €
1980 82 84 86 88 90 92 94 96 98 2000 02 04 05
10 430
7 000
10 130
5 290
8 650
6 495
7 710
* En 1999 il y a une rupture de série due à la rénovation du compte : changement de périmètre (intégration des DOM), revalorisation des charges sociales rattachées, des dépenses des ménages notamment.
5 030
Source : MEN-DEPP
second cycle professionnel second cycle général technologique
second degré premier cycle
0 2 4 6 8 10États-Unis
FranceItalie
AustralieSuède
Finlande
Royaume-UniJapon
AllemagneMoyenne des pays de l'OCDE
Pays-BasEspagne
Source : édition 2006 de « Regards sur l'éducation », OCDE
Average expenditure per pupil In public and private secondary schools, in thousands of dollar-equivalent (2003)
02 Evolution in average expenditure per pupil* in secondary education at 2005 prices (19�0-2005) in Euros

1� [ secondary Education ]
Since 199�, secondary education as a whole has lost over 200,000 pupils, due to a reduction in the number of repeated years or generation sizes. Half of the pupils enrolled in terminale classes are preparing for a general baccalauréat.
Between 1994 and 2004, secondary educa-tion as a whole lost over 200,000 pupils and
apprentices (i.e. a drop of over 3%). This trend was particularly marked at the start of the 2000 school year, when the population fell by more than 50,000 pupils. Following less significant de-creases in the next few years, the drop became more substantial at the start of the 2004 and 2005 school years, for demographic reasons affecting primarily collèges (diagram 01).
The reduction in the number of secondary educa-tion pupils is also due to the sharp drop in repeat-ed years, observed at all levels: pupils who start their secondary education younger complete this education sooner. This trend does not, how-ever, mean that fewer pupils continue studying in collège and then lycée, as nearly all those who entered a sixième class reach a troisième class and 70% of those have reached baccalauréat level in the last few years (indicator 20).
After the last year in collège, young people’s educational orientation has remained practically unchanged since 1996. Approximately 750,000 of them complete their last year of collège each year: six out of ten continuing the year after in the general or technological second cycle, and four out of ten in a vocational second cycle. Most of those continuing to study in general or techno-logical second cycle enrol in a public lycée. Just over half of those continuing in a vocational sec-ond cycle enrol in a public vocational lycée, the others following a course under school status
in a private vocational lycée or agricultural lycée, or as apprentices (table 02).
Educational orientation in the final year of a CAP (Vocational Training Qualification) or BEP (Certifi-cate of Technical Education) has changed more. Approximately half of the 320,000 young people who complete their final CAP or BEP year con-tinue their studies, which has not changed much since 1996. However, they opt more frequently for a vocational baccalauréat or brevet, rather than the adapted première class, to prepare for a technological baccalauréat (table 03). The pro-portion of BEP pupils continuing their studies and obtaining a vocational baccalauréat is one of the indicators of the LOLF.
Half of the young people reaching the end of their secondary education, in terminale classes, pre-pare for a general baccalauréat, 30% for a tech-nological baccalauréat and 18% for a vocational baccalauréat. Since 1996, the proportion of gen-eral courses, notably literary, tends to decrease (by 5 points), to the benefit of vocational courses, with a growing number of young people enroll-ing in agricultural lycées and apprentice training centres, notably specialising in the manufactur-ing industry (table 04).
The data for this indicator relates to the entire secondary education sector and takes into account the education provided in establishments under the responsibility of the national education ministry, agricultural lycées and apprentice training centres. The latest detailed data available for this entire sector relates to the 2004-05 school year.
Source: MEN-DEPP. Scope: mainland France, all initial education courses.
�� I �9 The state of Education no. 16 [2006 issue]
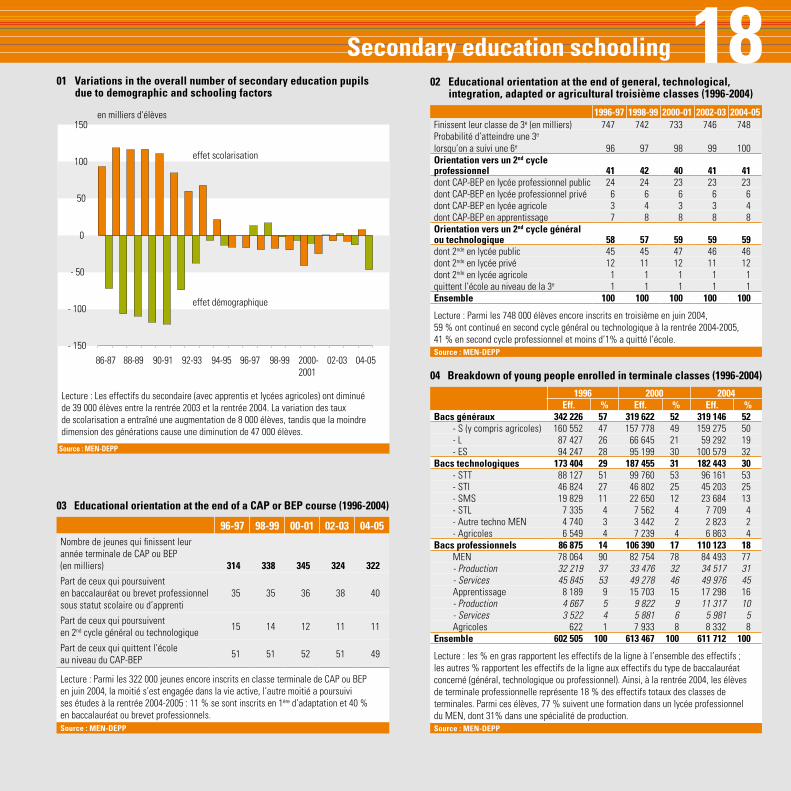
1�Secondary education schooling 02 Educational orientation at the end of general, technological, integration, adapted or agricultural troisième classes (199�-200�)
199�-97 199�-99 2000-01 2002-03 200�-05Finissent leur classe de 3e (en milliers) 747 742 733 746 748Probabilité d’atteindre une 3e lorsqu’on a suivi une 6e 96 97 98 99 100Orientation vers un 2nd cycle professionnel �1 �2 �0 �1 �1dont CAP-BEP en lycée professionnel public 24 24 23 23 23dont CAP-BEP en lycée professionnel privé 6 6 6 6 6dont CAP-BEP en lycée agricole 3 4 3 3 4dont CAP-BEP en apprentissage 7 8 8 8 8Orientation vers un 2nd cycle général ou technologique 5� 57 59 59 59dont 2nde en lycée public 45 45 47 46 46dont 2nde en lycée privé 12 11 12 11 12dont 2nde en lycée agricole 1 1 1 1 1quittent l’école au niveau de la 3e 1 1 1 1 1Ensemble 100 100 100 100 100
Lecture : Parmi les 748 000 élèves encore inscrits en troisième en juin 2004, 59 % ont continué en second cycle général ou technologique à la rentrée 2004-2005, 41 % en second cycle professionnel et moins d’1% a quitté l’école.Source : MEN-DEPP
03 Educational orientation at the end of a CAP or BEP course (199�-200�)
9�-97 9�-99 00-01 02-03 0�-05Nombre de jeunes qui finissent leur année terminale de CAP ou BEP (en milliers) 31� 33� 3�5 32� 322
Part de ceux qui poursuivent en baccalauréat ou brevet professionnel sous statut scolaire ou d’apprenti
35 35 36 38 40
Part de ceux qui poursuivent en 2nd cycle général ou technologique 15 14 12 11 11
Part de ceux qui quittent l’école au niveau du CAP-BEP 51 51 52 51 49
Lecture : Parmi les 322 000 jeunes encore inscrits en classe terminale de CAP ou BEP en juin 2004, la moitié s’est engagée dans la vie active, l’autre moitié a poursuivi ses études à la rentrée 2004-2005 : 11 % se sont inscrits en 1ère d’adaptation et 40 % en baccalauréat ou brevet professionnels.Source : MEN-DEPP
0� Breakdown of young people enrolled in terminale classes (199�-200�)
199� 2000 200�Eff. % Eff. % Eff. %
Bacs généraux 3�2 22� 57 319 �22 52 319 1�� 52- S (y compris agricoles) 160 552 47 157 778 49 159 275 50- L 87 427 26 66 645 21 59 292 19- ES 94 247 28 95 199 30 100 579 32
Bacs technologiques 173 �0� 29 1�7 �55 31 1�2 ��3 30- STT 88 127 51 99 760 53 96 161 53- STI 46 824 27 46 802 25 45 203 25- SMS 19 829 11 22 650 12 23 684 13- STL 7 335 4 7 562 4 7 709 4- Autre techno MEN 4 740 3 3 442 2 2 823 2- Agricoles 6 549 4 7 239 4 6 863 4
Bacs professionnels �� �75 1� 10� 390 17 110 123 1�MEN 78 064 90 82 754 78 84 493 77- Production 32 219 37 33 476 32 34 517 31- Services 45 845 53 49 278 46 49 976 45Apprentissage 8 189 9 15 703 15 17 298 16- Production 4 667 5 9 822 9 11 317 10- Services 3 522 4 5 881 6 5 981 5Agricoles 622 1 7 933 8 8 332 8
Ensemble �02 505 100 �13 ��7 100 �11 712 100
Lecture : les % en gras rapportent les effectifs de la ligne à l’ensemble des effectifs ; les autres % rapportent les effectifs de la ligne aux effectifs du type de baccalauréat concerné (général, technologique ou professionnel). Ainsi, à la rentrée 2004, les élèves de terminale professionnelle représente 18 % des effectifs totaux des classes de terminales. Parmi ces élèves, 77 % suivent une formation dans un lycée professionnel du MEN, dont 31% dans une spécialité de production.Source : MEN-DEPP
- 150
- 100
- 50
0
50
100
150en milliers d'élèves
effet démographique
effet scolarisation
Lecture : Les effectifs du secondaire (avec apprentis et lycées agricoles) ont diminué de 39 000 élèves entre la rentrée 2003 et la rentrée 2004. La variation des taux de scolarisation a entraîné une augmentation de 8 000 élèves, tandis que la moindre dimension des générations cause une diminution de 47 000 élèves.
Source : MEN-DEPP
86-87 88-89 90-91 92-93 94-95 96-97 98-99 2000-2001
02-03 04-05
01 Variations in the overall number of secondary education pupils due to demographic and schooling factors

19 [ secondary Education ]
Secondary education in France benefits from good pupil-teacher ratios, which have tended to improve with the current demographic downturn. The average class size in collèges is 2� pupils. In lycées, where general education classes are larger, half of the teaching hours are provided to a reduced number of pupils.
Pupils enrolled in secondary education estab-lishments in France benefit from education
conditions somewhat better than those of other, comparable countries. The global ratio between the number of pupils and the number of teach-ers is currently 12.1 in France; it has decreased because of the demographic downturn in popula-tions entering collèges and lycées. However, this indicator only constitutes a rudimentary over-view of the true education conditions for pupils, which in secondary education are traditionally evaluated by the average number of pupils per division (E/D).
Average class sizes vary widely, depending on the education level or cycle, and over the past twenty years have undergone relatively contrast-ed evolutions, less favourably so than in primary education. The large influx of pupils from larger generations had resulted, in the late 1980s, in big-ger first cycle classes (collèges), but especially larger general and technological second cycle classes (lycées): by 1990, lycée classes had about 30 pupils on average, compared with a little over 24 for collèges, and a little under 23 for vocation-al lycées. While the situation remained stable in collège in the following years, it has considerably improved in second cycle education thanks to the demographic downturn. In general and tech-nological second cycle education, the average class size is now approximately 28 pupils, and 20 pupils in vocational lycées (diagram 01).
However, this data only provides a partial view of the true education conditions, insofar as one-third of all teaching hours are now provided in groups and not in entire divisions. a little less than 20% in public collèges, and nearly half in lycées, includ-ing post-baccalauréat classes (table 02).
The E/S indicator, or the “average number of pu-pils for whom a teacher is responsible in a class for an average of one hour”, takes account of all types of education, whether provided in divi-sions or groups: in 2005, it was equal to 21 pupils throughout the entire public secondary cycle, 22.7 in collège, 16.1 in vocational lycées and 22.9 in general or technological second cycle. These figures are substantially lower than the size of the divisions, especially in lycées, and notably in vocational education where almost 20% of the working hours are spent with groups of 10 pupils or less (diagram 03).
In France, pupils in secondary education benefit from pupil-teacher ratios that are generally better than those of comparable countries. Thus, in 2004, the pupils/teacher ratio in France is only 12.1, compared with over 15 in Holland, the USA and Germany, but under 10 in Belgium and around 11 in Spain and Italy.
Sources: data concerning student populations in divisions and the number of divisions come from the “schooling” information system. The other data presented is a result of work carried out on files from “relay basis” comparing student and teacher information and available to public secondary education establishments (situation observed at the beginning of the 2005 school year). Regional establishments for adapted education (EREA) have been excluded.
Scope: mainland France + overseas départements, public and private, public only.
50 I 51 The state of Education no. 16 [2006 issue]

19
03 Breakdown of teaching hours according to the size of the establishment and type of education provided (2005)
Education conditions in the secondary sector 02 Size of education establishments by type of education provided in 2005
métropole + DOM / Public
Type de formation
Nombre d’élèves
par division (E/D)
Taille moyenne
des structures
(E/S)
% heures dans les
structures <= 10
élèves
% heures dans les
structures > 35 élèves
% heures en groupes
Collège 24,0 22,7 2,5 0,1 19,3
SEGPA 13,5 12,4 33,2 0,0 29,6
Lycée professionnel 20,1 16,1 17,7 0,1 49,4
Lycée pré-bac* 28,7 22,9 6,3 1,5 47,2
CPGE 34,8 26,5 10,1 29,7 46,9
STS 22,8 18,1 13,7 1,3 47,5
Total 2�,1 21,0 �,1 0,9 33,�
(*) Second cycle général et technologique.Source : Scolarité et bases relais – Rentrée 2005
18
20
22
24
26
28
30
32
1980 82 84 86 88 90 92 94 96 98 2000 02 04 2005
Premier cycleSecond cycle professionnel
Second cycle général et technologique
métropole + DOM / Public + privé
Source : MEN-DEPP
01 Evolution in the average number of pupils per class (19�0-2005)
0
5
10
15
20
25
30
35
40
45
50
<= 5 6 à 10 11 à 15 16 à 20 21 à 25 26 à 30 31 à 35 > 35
Collège Lycée pré-bac LP Total
Taille des structures
métropole + DOM / Public
Lecture : 44,9 % des heures en lycée professionnel sont assurées devant des structures de taille comprise entre 11 et 15 élèves.Source : MEN-DEPP
15,8
15,5
15,1
14,4
14,1
13,1
12,9
12,1
11,0
10,8
9,6
Pays-Bas
États-Unis
Allemagne
Royaume-Uni
Japon
Finlande
Suède
France
Italie
Espagne
Belgique
Source : édition 2006 de « Regards sur l'éducation », OCDE
Average number of pupils per teacher in secondary education (200�)

20 [ secondary Education ]
The levels of education include courses deemed to be of a comparable level of qualification. A pupil enrolled at least once in such a course is deemed to have reached the corresponding level. For access to level V, the pupils considered are those enrolled at the beginning of the school year in a general or technological seconde class or in the final year of a CAP or BEP course. For access to level IV, the pupils taken into consideration are those starting a general, technological (including preparatory classes for the technician’s degree) or vocational terminale class, as well as apprentices in the final preparatory year for vocational baccalauréat or brevet. Annual access rates to level V and IV education compare the number of pupils reaching the corresponding level for the first time, according to their birth year, with the populations of the generations they belong to. The indicator hereby presented, called annual or cross-sectional, is the sum of these elementary rates per age for the same school year. Therefore it differs from the ratio of a generation reaching the level considered, which is the sum of the same elementary rates for all school years and for this generation. Access rate to baccalauréat level must not be confused with the success rate for this qualification, or rate of baccalauréat holders, which is presented in indicator 24.
After peaking at 71% in 199�, the percentage of young people attaining a level IV education stabilised at around �9 to 70%. Access to level V education has fluctuated since the 1990s at around 92% to 9�%, including 9% via apprenticeships.
W ith a rise of over 4% a year in the late 1980s, the access rate to baccalauréat
level increased from 34% in 1980 to 71% in 1994 (all types of education combined). The following years, this rate initially dropped a little, then sta-bilised at around 69 to 70% (70.0% at the start of the 2005 school year, mainland France + overseas départements).
For school establishments under the responsibil-ity of the Ministry of Education only, the access rate peaked at 68% in 1994, before losing 5% between 1994 and 1997, fluctuating thereafter between 62% and 64% (63.8% in 2004). Until 1998, the increase in other means of access to level IV (agricultural education and apprenticeship) had made up for this fall. Access rates then stabilised, at a little under 4% for apprenticeship and under 3% for academic courses under the responsibility of the Ministry of Agriculture.
The drop observed between 1994 and 1998 in na-tional Education establishments broadly reflects the arrested development of general studies. Having peaked at 41% in 1994, the access rate to general baccalauréat fell by 7%, and then sta-bilised at around 34% until 2003; in the last two years it has improved slightly (34.6% in 2004 and 35.1% in 2005). At the same time, the technologi-cal courses, whose importance increased up to 2000 to nearly 22%, has subsequently continually declined (19.9% in 2005). Finally, the progress of vocational courses, substantial until 1998, has since reduced: nowadays, they cater for a little
over 14% of young people (14.7% in 2004 and 15.0% in 2005, according to the provisional es-timate) compared with only 5% in 1990, notably thanks to the development of the preparation for the vocational baccalauréat and brevet through apprenticeship.
Girls reach baccalauréat level more often than boys. Their are 13 points ahead in general ter-minale classes and less than 3 points in tech-nological courses. This difference is reversed in vocational courses, exceeding 4 points in favour of boys.
Having risen above 90% in the late 1980s, the ac-cess rate to level V education then stabilised at around 92%. After a brief upturn in 1997 and 1998, following reforms in collèges, it now fluctuates at around 93% (93.4% in 2004 and 92.7% in 2005, according to the provisional estimate, mainland France + overseas départements).
Source: MEN-DEPP. Scope: mainland France, mainland France + overseas départements.
52 I 53 The state of Education no. 16 [2006 issue]

20Access to level IV and V education 01 Access rate to level V education(all initial education courses combined)
Métropole Métropole + DOM
19�0-�1 1990-91 2000-01 2003-0� 200�-05 2005-0�
Seconde générale et technologique 39,5 56,0 56,5 56,8 56,6 56,8
CAP-BEP 40,9 36,5 36,6 36,9 36,8 35,9*
Ensemble �0,� 92,5 93,1 93,7 93,� 92,7*
MEN 67,0 80,4 80,7 80,8 80,5 80,5
Agriculture 3,4 3,1 3,4 3,9 3,9 3,9
Apprentissage 10,0 9,0 9,1 9,0 9,0 8,2*
* Chiffres basés sur une estimation concernant la formation par apprentissageSource : MEN-DEPP
02 Access rate to level IV education (all initial education courses combined)
Métropole Métropole + DOM
19�0-�1 1990-91 2000-01 2003-0� 200�-05 2005-0�
Bac général 22,1 33,4 34,2 33,9 34,6 35,1
Bac technologique 11,9 17,6 21,7 20,7 20,4 19,9
Bac professionnel 0,0 5,0 14,0 14,5 14,7 15,0*
Ensemble 3�,0 5�,0 �9,9 �9,1 �9,7 70,0*
MEN 33,0 54,0 63,4 62,9 63,5 63,8
Agriculture 1,0 1,4 2,8 2,5 2,5 2,5
Apprentissage 0,0 0,6 3,7 3,7 3,7 3,7*
* Chiffres basés sur une estimation concernant la formation par apprentissageSource : MEN-DEPP
03 Access rate to level IV, based on course and gender (2005 school year)
Filles Garçons Ensemble
Général 41,8 % 28,7 % 35,1 %
Technologique 21,3 % 18,6 % 19,9 %
Professionnel* 12,7 % 17,1 % 15,0 %
Ensemble* 75,9 % ��,5 % 70,0 %
* Chiffres basés sur une estimation concernant la formation par apprentissage Source : MEN-DEPP
Source : MEN-DEPP
1980 82 84 86 88 90 92 94 96 98 2000 02 04 05
Accès au niveau IV : baccalauréat technologique Accès au niveau IV : baccalauréat général Accès au niveau V : seconde générale et technologique
0
10
20
30
40
50
60
70 %
0
5
10
15
20
25
30
35
40
45 %
1980 82 84 86 88 90 92 94 96 98 2000 02 04 05*
Source : MEN-DEPP
Accès au niveau V : diplômes professionnels Accès au niveau IV : baccalauréat professionnel
* Chiffres basés sur une estimation concernant la formation par apprentissage
05 Evolution of the access rate to level V and IV education, vocational course (19�0-2005)
0� Evolution of the access rate to level V and IV education, general and technological courses (19�0-2005)

21 [ secondary Education ]
In 2005, troisième pupils claim to be more opposed to discriminations but less respectful of laws and rules than CM2 pupils (final year in primary school). This observation is also valid for 2005 pupils compared with those of 1995, at the end of primary school or collège.
In 2005, pupils at the end of collège education claim to be more attached to public liberties
than those at the end of primary school, who seem less familiar with these notions (right to strike, right to vote, freedom of speech). Primary school pupils are much more respectful of laws and rules. They believe that any trans-gression is “serious”: from “illegal downloading on the Internet”, deemed very serious by 32.3% of primary school pupils and 10.2% of collège pupils, to “driving without a licence”, condemned by 90.6% of CM2 pupils and 75% of troisième pupils. This is also reflected in school life, where col-lège pupils claim they are more likely to tolerate bending of the rule. Thus, 46.3% of the pupils at the end of collège consider “lying to avoid being punished” unacceptable, compared with 79.8% of the pupils at the end of primary school.A vast majority of pupils deem all sorts of dis-crimination unacceptable, even more signifi-cantly so at the end of collège. Girls claim to be more respectful of laws and rules, whether school-related or not, and also more tolerant than boys, notably in collège, where they reject sexual discrimination more. Boys state they care more about public liberties.
The comparison of pupils’ answers at the end of CM2 class in 2005 with those of pupils at the start of sixième class in 1994 (pupils who did not repeat, on which collège had had no influ-ence thus far) reveals that the 2005 pupils claim to be a little less sensitive to public liberties and take more liberties with laws and rules, notably
when it comes to school life. A lot fewer consider “lying to avoid being punished” or “copying from a classmate during a tough exam” unacceptable. Nevertheless, they claim to be more tolerant than 10 years before but tend to doubt the willingness of unemployed people to find a job more than be-fore: only 59.7% of the 2005 pupils deem it unac-ceptable to say that most unemployed people do not want to work as opposed to 71.2% in 1994.
At the end of the troisième class, current ob-servations are very similar to those of 10 years ago. Pupils are still very much attached to public liberties, very tolerant and reject, even more so in 2005, all forms of discrimination. As in primary school, they seem to be more critical of unem-ployed people. Regarding their attitude towards laws and rules, the 2005 collège pupils seem to have a better understanding of the role and use-fulness of school rules but take more liberties regarding the law. A larger percentage of them claim “you should only obey the laws that you agree with”: only 43.3% of troisième pupils in 2005 do not agree at all with this statement, compared with 51.9% in 1995.
Social and civic skills have been selected as one of the elements of the “common base of knowl-edge”: a school life mark is instituted in collège and will be taken into account from the 2007 ses-sion of the national brevet diploma.
The results presented here are not based on observations but on pupils’ statements. Despite precautionary measures (anonymous and confidential statements), the answers to the items relative to attitudes or opinions can be tinged with “desirability” or a desire to provoke. However, the same type of questions was asked to other pupil populations, and the similarity of the answers validate these results. The items break down in various sectors at the end of primary school and collège. For each item, a summarised approval indicator has been designed. In order to calculate them, an evaluation scale has been created, taking into consideration the fact that, depending on the item, three or four types of answers were offered. The evaluation scale selected is as follows: 1 point for the socially acceptable answer, 0 point for the socially unacceptable answer, 0.5 point or 0.1/3 and 0.2/3 point for intermediate answers depending on the number of answers to the question. Indicators are figures out of 100 but the format of the items and evaluation mode used do not allow the assimilation with success percentages. They act more like a position on a scale. Comparisons between CM2/troisième and 1994-1995-2005 are carried out on the same items. 15,346 primary school pupils and 14,918 collège pupils from respectively 500 primary schools and 50 collèges were surveyed for this evaluation.
Source: MEN-DEPP. Scope: public establishments and private establishments under contract in mainland France.
5� I 55 The state of Education no. 16 [2006 issue]

21
02 Comparison of acceptance indicators at the end of primary school between 199� and 2005
Pupils’ attitudes to life in society 01 Comparison of acceptance indicators at the end of primary school and collège in 2005
Indicateurs d’adhésion fin école – fin collège 2005
Nombre d’items
Moyenne école
Moyenne collège
Différence de moyennes 3e/CM2
Écart-type école
Écart-type collège
Libertés publiques 3 63,1 80,0 16,9 22,7 17,6
Loi et règle 23 76,7 65,2 -11,5 10,7 14,8
Tolérance 15 82,6 85,9 3,3 12,6 11,8
Vie scolaire 7 77,0 59,5 -17,5 16,2 16,7
Lecture : les élèves de fin de troisième de 2005 obtiennent en moyenne un indicateur d’adhésion dans le domaine Loi et règle inférieur de 11,5 points à celui des élèves de fin de CM2.Source : MEN-DEPP
Source : MEN-DEPP Source : MEN-DEPP
80,079,272,6
67,6 65,570,9
77,182,0
0
20
40
60
80
100
Libertés publiques Loi et règle Tolérance Vie scolaire
1994 2005 1995 2005
58,5
86,2
66,4
78,1
57,5
85,5
65,3
77,3
0
20
40
60
80
100
Libertés publiques Loi et règle Tolérance Vie scolaire
Source : MEN-DEPP Source : MEN-DEPP
61,8
78,3 84,3
79,1
64,4
75,1 81,0
75,0
0
20
40
60
80
100
Libertés publiques Loi et règle Tolérance Vie scolaire
filles garçons filles garçons
76,2 68,0
87,8
64,3
78,5
63,6
81,2
59,0
0
20
40
60
80
100
Libertés publiques Loi et règle Tolérance Vie scolaire
05 Comparison girl/boy indicators at the end of collège in 2005
0� Comparison of girl/boy indicators at the end of primary school in 2005
03 Comparison of acceptance indicators at the end of collège between 1995 and 2005

22 [ secondary Education ]
Diagram 01 relates to the integration into the labour market of students having completed their lycée education (IVA); lycée students were surveyed in February, approximately 7 months after the end of their studies. Table 03 and diagram 02 are based on INSEE’s 2005 Labour force surveys and relate to young people having completed their initial education in the last 3 to 7 years (1998 to 2002) – table 03 also provides information on all types of jobs held. Salaried employment populations are estimated by DARES, INSEE and UNEDIC (Central Unemployment Benefits Agency) over the entire private sector with the exception of agriculture, administration, education, healthcare and social work. The results are regularly updated by the research unit (DARES) of the Ministry of Employment, Social Cohesion and Housing, in the “Premières informations et Premières synthèses” collection, available on its website. The indicators provided by the survey on students leaving the lycée are the proportion of young people in a job, subsidised or otherwise. The qualification obtained by lycée students is taken into consideration. Intermediate occupations include technicians, foremen, sales representatives and B-category civil servants. Unqualified workers are conventionally semiskilled workers, labourers and farm workers. Unqualified office workers are defined as sales employees, employees working in the personal service sector, Public service civil servants and emergency medical technicians and security guards.
Approximately five years after the end of their initial education, 7�% of baccalauréat holders are employed, as are 75% of CAP and BEP holders and only �7% of young people without a qualification.
Young people leaving the education system ar-rived onto a less favourable labour market at
the beginning of 2005. In 2004 the industrial sector lost over 2% of its private sector employment for the third consecutive year. Job reductions have been particularly significant in the sector of con-sumer and intermediate goods.
The ease of professional integration depends largely on the dynamics of the labour market, in France and in the Mediterranean regions of Eu-rope. Industrial employment trends have affected the employment rates of young people specifical-ly trained for these industrial jobs, which dropped substantially at the beginning of 2003 and 2004 but stabilised at the beginning of 2005 (diagram 01).
Private employment in the service sector has continued to increase, but at a moderate pace. In this sector, the competition with higher educa-tion graduates makes it difficult for CAP and BEP holders, or even vocational baccalauréat hold-ers, to position themselves, and consequently their employment rate seems to have worsened of late.
Initial difficulties tend to decrease with time. Thus, 75% of CAP and BEP holders and 80% of technological and vocational baccalauréat holders belonging to the older populations who completed their initial education in the last five years approximately, were employed in 2005 (diagram 03). Five years after the completion of their initial education, vocational baccalauréat
holders benefit from the most favourable oppor-tunities for employment among higher secondary qualifications, compared with the overall propor-tion of jobs held. Five years on, over one bacca-lauréat holder out of four holds an intermediate occupation or is an independent worker, and one out of three is a skilled office or manual worker. CAP and BEP holders have more qualified jobs than those with lower qualifications, they are not as affected by unemployment and, above all, nearly all of them have had work experience (see indicator 11). Former apprentices have better ac-cess to skilled jobs than those who prepared for this qualification in lycée.
Source: MEN-DEPP and INSEE’s Labour force surveys; Scope: mainland France.
5� I 57 The state of Education no. 16 [2006 issue]

22Employment and career of pupils leaving secondary education 01 Employment rate as of early February of students leaving the lycée, based on the qualification obtained
03 Percentage of senior and intermediate professionals on the employment market (2005)
en %
DiplômeEnviron 5 ans après
la fin des étudesEnsemble population occupant un emploi
Diplômés du supérieur 74 78
Baccalauréat général 38 48
Baccalauréat technologique 26 41
Baccalauréat professionnel 21 26
CAP/BEP scolaires 11 22
CAP/BEP apprentis 6 15
Total bacheliers et titulaires des CAP/BEP 19 27
Brevet 13 28
Aucun diplôme 9 29
Tous (y compris diplômes supérieurs) �5 3�Source : calculs DEPP à partir des enquêtes Emploi 2005 de l’INSEE (moyenne annuelle)
2002 2005*
* L'enquête de février 2005 a été effectuée sur un sous-ensemble de spécialités de formation, semblable à celui considéré, ici, en février 2002. Lecture : dans les spécialités enquêtées en février 2005, 69 % des sortants de 2004 diplômés d'un baccalauréat professionnel orienté vers la production occupent alors un emploi (« aidé » ou non), contre 43 % des sortants diplômés des CAP/BEP de services.
Sources: enquêtes IVA de février 2002 et 2005, MEN-DEPP.
Bac pro.Production
Bac techno.Production
Bac pro. Services
Bac techno.Services
CAP/BEPProduction
CAP/BEP Services
0
10
20
30
40
50
60
70
80
90 %
0
10
20
30
40
50
60
70
80
90
100 %
Baccalauréat général
Baccalauréat technologique
Baccalauréat professionnel
CAP/BEP apprentissage
CAP/BEP scolaire
Brevet Sans diplôme Tous diplômés du secondaire
Sans activité
Chômeurs n'ayant jamais travaillé
Chômeurs ayant déjà travaillé
Employés, ouvriers non qualifiés
Employés, ouvriers qualifiés
Agriculteurs, artisans, commerçants
Cadres, professions intermédiaires
Lecture : sur l'ensemble de l'année 2005, cinq ans environ après la fin de leur formation initiale, 75 % des diplômés des brevets, CAP, BEP et baccalauréats ont un emploi, pour 48 % des jeunes n'ayant aucun diplôme.
Source : calculs DEPP à partir des enquêtes Emploi de l‘INSEE
02 Professional situation of young people having completed their initial education approximately 5 years ago, based on their qualification (2005)

23 [ higher Education ]
National authorities spent 20.� billion Euros on higher education in 2005. This expenditure has been increased 2.2 times since 19�0 (at constant prices). In 2005, the average expenditure per student reached �,9�0 Euros, or 29% more than in 19�0.
In 2005, national authorities devoted 20.6 billion Euros to higher education or, at constant
prices, a 0.6% increase on 2004.
Since 1980, expenditure on higher education has grown substantially, at an average annual rate of 3.2% (at constant prices). Its share of domestic expenditure on education rose from 14.6% in 1980 to 17.5% in 2005 (table 01). Over the entire period, the amount increased 2.2 times. However, in the context of an almost doubling in the population concerned, average expenditure per student only increased by 29%, reaching 8,940 Euros in 2005. At the same time, the average expenditure per secondary school pupil rose by 62%.
The average costs per student vary considerably, depending on the area of higher education con-sidered: they are twice as high in CPGE (prepara-tory classes for Grandes écoles) and STS (Higher Technician Sections) than in universities. In 2005, a student completing a year at a public univer-sity cost the nation an average of 7,210 Euros, a year in a IUT (University Institute of Technology) cost 10,890 Euros, a year in STS 13,360 Euros and a year in CPGE 13,560 Euros (diagram 02). The in-crease in the average cost of a IUT or BTS (High-er Technician Certificate) student in recent years is partly explained by the drop in the number of students enrolling in these courses. The opposite applies to CPGE students, whose numbers con-tinue to grow.
The theoretical cost of an 18-year education, without any repeated years, from pre-school to a licence (bachelor’s degree), was estimated at 120,700 Euros in 2005 (table 03). It is equivalent to the cost of a 17-year education career leading to a DUT – University Institute of Technology Diplo-ma – (120,850 Euros) and inferior to that leading to a BTS (125,780 Euros).
The share of the State in the funding of higher education is predominant: approximately 77%. The share of families amounts to 9%. Some direct or indirect aids, funded by the State to help stu-dents or their families, are not included in the DEE for higher education, because they are either of a fiscal nature (increase in the family quotient) or not directly linked to student status (welfare accommodation allowance). If they were taken into account (excluding contributions from social security), the average cost of a student in 2005 would rise from 8,940 to 10,010 Euros.
International statistics on higher education expenditure are not homogeneous. In 2003, the annual average expenditure per student in France, including research and development activities, was below the average of OECD countries (10,700 dollar equivalent compared with 11,250). The OECD also estimates the average cumulated cost of a student throughout their higher education career. With this indicator, in which a number of countries such as the USA are not included, France is exactly among the average (43,000 dollar equivalent).
The amount of expenditure for the last two years is provisional. Higher education expenditure includes all the expenditure on public and private establishments of mainland France related to education and associated activities: university services, administration, supplies, university libraries, remuneration of education personnel undergoing training courses etc. It does not include continuing education or research activities in universities (but includes all the salaries of teacher-researchers). The reorganisation of the education account results in an alteration of the amount of the average expenditure per student, which was only recalculated for the 1999-2005 period. The 1980 to 2005 trend is therefore the result of two separate trends: 1980 to 1999, “former basis”, and 1999 to 2005, “new basis”. The international indicator is presented in the dollar equivalent converted using purchasing power parities, which are currency conversion rates enabling the specification of the purchasing power of various currencies in a common unit.
Source: MEN-DEPP. For international comparisons: OECD-CERI. Scope: mainland France + overseas départements taken together.
5� I 59 The state of Education no. 16 [2006 issue]

23
Cumulated expenditure per student during the average duration of studies (including research)
In thousands of dollar-equivalent 2003
Expenditure on higher education 01 Expenditure on higher education
métropole + DOM
19�0 1990 2000 200� 2005DIE pour le supérieur*aux prix courants (en milliards d’euros) 4,2 11,2 17,7 20,1 20,�aux prix de 2005 (en milliards d’euros) 9,5 14,1 19,5 20,5 20,�Part dans la DIE (en %) 14,6 16,4 16,8 17,4 17,5Dépense moyenne par étudiant*aux prix de 2005 (en euros) 6 740 7 570 8 890 8 900 � 9�0Structure du financement initial (en %)**État 77,2 7�,9
dont MEN 66,2 65,9Collectivités territoriales 5,8 �,1Autres administrations publiques*** 1,9 2,0Entreprises 5,9 5,9Ménages 9,2 9,1
(*) La DIE a été réévaluée (voir méthodologie indicateur 01) pour l’ensemble de la période 1980-2005. Les dépenses moyennes par étudiant n’ont été recalculées qu’à partir de 1999. (**) La structure du financement initial de l’enseignement supérieur a fait l’objet d’une nouvelle estimation à partir de 2003.(***) y compris chambres consulaires (CCI, CM, CA, etc.).Source : MEN-DEPP Source : MEN-DEPP
5 000
6 000
7 000
8 000
9 000
10 000
11 000
12 000
13 000
14 000
15 000
16 000 €
1980 82 84 86 88 90 92 94 96 98 2000 04 0502
6 740
Ensemble
CPGE 13 560
STS 13 360
IUT 10 890
Université 7 210
8 940
0 5 10 15 20 25États-Unis
Suède
Pays-Bas AustralieFinlande
Royaume-UniBelgique
AllemagneMoyenne des pays de l'OCDE
FranceIrlande
Espagne
0 10 20 30 40 50 60 70 80Suède
Allemagne
Finlande
Royaume-Uni
Japon
Italie
France
Moyenne des pays de l'OCDE
Espagne
Belgique
Irlande
Source : édition 2006 de « Regards sur l'éducation », OCDE Source : édition 2006 de « Regards sur l'éducation », OCDE
02 Evolution of average expenditure per student at 2005 prices in Euros (19�0-2005)
Average annual expenditure per student, including research and development activities
In thousands of dollar-equivalent 2003

2� [ higher Education ]
As one student can enrol in more than one course, basic enrolment rates per course do not add up. However, assuming that multiple enrolments are marginal for technological baccalauréat holders, an access rate can be calculated for them: 78.6% in 2005. Based on a 100% access rate for general baccalauréat holders, the overall access rate of general and technological baccalauréat holders is estimated at 92.7% in 2005 (92.3% in 2004). A similar calculation, including vocational baccalauréat holders, gives a 79.9% estimate of the rate of access to higher education of all 2005 baccalauréat graduates, 79.2% in 2004. “Other courses” correspond with new baccalauréat holders enrolling in non-university engineering schools, higher education establishments that are not affiliated with universities (business, management, sales, accountancy, notary studies, architecture, various specialisations), art and cultural schools, private faculties, paramedical and social science courses. The data used for paramedical and social science schools are 2004-2005 figures. Scientific courses include: science (excl. STAPS – Science and Technology for Physical Activities and Sports) and healthcare courses at university, scientific CPGE classes (including agriculture), secondary IUT, tertiary IUT with IT specialty, STS – production specialty (including agriculture), STS services – IT specialty, engineer schools, engineer training courses in partnership. The years appearing on the tables represent entry dates: 2005 means the start of the 2005 university year or university year 2005-2006.
In 2005, �2% of young people obtained the baccalauréat qualification. �0% of baccalauréat holders immediately enrol in higher education. General baccalauréat holders are less attracted by general university courses, while technological and vocational baccalauréat holders mostly enrol in STS courses (Higher Technician Sections). Thus, half of a generation has access to higher education.
In 2005, 633,900 applicants sat the general, technological and vocational baccalauréat
examinations in mainland France and overseas départements, and 506,600 obtained the quali-fication. With an overall success rate of 79.9%, the 2005 session sees a very slight 0.2% increase on 2004 (which will be enhanced by the results of the 2006 session, still provisional). The success rate is up 1.6 points for the general baccalauréat (84.1%), down 0.7 point for the technological bac-calauréat (76.2%) and down 2.2 points for the vo-cational baccalauréat (74.7%).
In this context, the proportion of baccalauréat holders within a generation increased slightly in 2005: 62.1% of young people obtained the bac-calauréat, 33.4% following a general curriculum, 17.2% following a technological curriculum and 11.5% following a vocational curriculum (diagram 01). Out of 100 graduates, 54 obtained a general baccalauréat, 28 a technological baccalauréat and 18 a vocational baccalauréat.
Out of all 2005 baccalauréat graduates, 79.9% enrolled the next year in higher education (see methodology), i.e. 0.7 point more than in 2004. This increase is due to the rise in the number of general baccalauréat holders compared with technological baccalauréat holders, who tend not to continue with higher education as much. Indeed, almost all those with a general bacca-lauréat entered higher education immediately, which is not the case for those with a technologi-cal baccalauréat, whose rate of access however
increases to 78.6% compared with 78.2% in 2004. Regarding vocational baccalauréat holders, this rate is stable compared with the previous year, at 23% (but it does not take into consideration enrol-ments in STS – Higher Technician Sections within the framework of apprenticeship, or continued studies under qualification contract).
At the start of the 2005 school year, 39.6% of general and technological baccalauréat holders chose selective courses (CPGE – Preparatory classes for Grandes écoles, IUT – University In-stitute of Technology, STS), i.e. a 0.7 point drop on 2004. University remains the favourite course for general baccalauréat holders, but a little less each year: only 61.3% enrolled in university (ex-cluding IUTs) in 2005 compared with 66.7% in 1997 (table 02).
The access rate of a generation to higher educa-tion was at 49.2% in 2005. It can be broken down by baccalauréat section: one third of a genera-tion enters higher education with a general bac-calauréat compared with 13.5% with a techno-logical baccalauréat and 2.6% with a vocational baccalauréat. At the start of the 2005 school year, enrolment of scientific and economic baccalau-réat holders is up and, conversely, literary, tech-nological and vocational baccalauréat holders are down. Regarding the choice of higher edu-cation curriculum, 27% of a generation entered university (including IUTs) in 2005, compared with 12% in STS – Higher Technician Sections (diagram 03).
Source: MEN-DEPP. Scope: mainland France + overseas départements.
�0 I �1 The state of Education no. 16 [2006 issue]

2�Access to higher education 01 Percentage of baccalauréat holders within a generation (19�0-2005) 02 Rate of immediate enrolment of baccalauréat holders
for different higher education coursesmétropole + DOM
1997 2000 2003 200� 2005Baccalauréat généralUniversité hors IUT 66,7 61,8 62,8 62,1 61,3IUT 9,8 11,2 10,7 10,7 10,4CPGE 13,0 12,6 13,0 13,6 13,3STS 9,0 9,0 8,0 7,8 7,7Autres formations 7,7 9,1 9,7 10,8 11,1Baccalauréat technologiqueUniversité hors IUT 22,0 19,1 18,1 18,1 18,1IUT 10,2 9,1 10,0 10,2 10,4CPGE 0,9 1,0 1,0 1,1 1,1STS 46,1 44,5 45,1 44,1 44,0Autres formations 3,0 3,9 4,2 4,7 5,0Ensemble général et technologiqueUniversité hors IUT 51,7 46,4 47,3 46,5 46,5IUT 9,9 10,5 10,4 10,5 10,4CPGE 8,9 8,4 8,9 9,2 9,1STS 21,5 21,8 20,9 20,6 20,1Autres formations 6,1 7,2 7,8 8,6 9,0Baccalauréat professionnelUniversité hors IUT 6,8 6,4 6,3 6,4 5,9IUT 0,8 0,5 0,7 0,7 0,8CPGE 0,0 0,0 0,0 0,0 0,0STS 8,9 9,7 14,4 15,2 15,7Autres formations 0,8 0,5 0,6 0,6 0,6Ensemble tous baccalauréatsUniversité hors IUT 44,5 39,2 39,8 38,9 39,1IUT 8,5 8,7 8,7 8,7 8,7CPGE 7,5 6,9 7,3 7,4 7,4STS 19,5 19,6 19,7 19,6 19,3Autres formations 5,3 6,0 6,5 7,1 7,5Source : MEN-DEPP
0
10
20
30
40
50
60
70 %générauxtechnologiquesprofessionnels
Source : MEN-DEPP
1980 82 84 86 88 90 92 94 96 98 2000 02 04 05
métropole
b) selon le type de formation
0 5 10 15 20 25 30 35 40 45 50 % 0 5 10 15 20 25 30 35 40 45 50 %
Autres
Paramédical et social (4)
Comm., gestion, vente et compta.
Formations d'ingénieurs (3)CPGE
STS et assimilés (2)
Université et assimilés (1)
Total
a) selon la série de baccalauréat
Bac professionnel dont bac STI dont bac STT
Bac technologique dont bac L
dont bac ES dont bac SBac général
Total
Source : MEN-DEPP
(1) Y compris les grands établissements, les IUT, INP hors formations d'ingénieurs(2) Y compris les formations comptables, DSAA, DNTS(3) Y compris NFI(4) Données 2004-2005 en 2005-2006
03 Access rate of a generation to higher education

25 [ higher Education ]
At the start of the 2005 school year, general baccalauréat holders represented over ��% of new baccalauréat holders enrolled at university (excluding IuT – university Institute of Technology). After reaching two thirds, their share of new IuT enrolments is back down to �5%. STS – Higher Technician Sections – mostly recruit technological baccalauréat holders, but more and more vocational baccalauréat holders.
More than eight out of ten new baccalauréat holders entering university (excluding IUT)
hold a general baccalauréat. Following a de-crease between 1995 and 2000, this proportion has since slightly increased, up to approximately 84%. At the start of IUT education, the propor-tion of general baccalauréat holders went up by 5 points between 1995 and 2001, then stabilised just above 67%. Following a substantial drop in 2003 and 2004, it is up 0.6 point at the start of the 2005 school year: 65.2%.
In STS – higher technician courses, technologi-cal baccalauréat holders are still in a majority among new entrants, but their share has been regularly decreasing in the last few years, down 1.5 points at the start of the 2005 school year. This decrease is offset by the progress in the enrol-ment of general and especially vocational bac-calauréat holders, currently accounting for 15% of new enrolments.
In “other courses” (non-university engineer-ing schools, business schools, paramedical and social study schools etc.), general baccalauréat holders remain largely predominant (nearly 80% of new entries).
There are far more scientific baccalauréat graduates (S section), representing a little over one quarter of all baccalauréat holders, among new baccalauréat holders enrolled in CPGE – preparatory classes for Grandes écoles (nearly three quarters), IUT (41.1%) and “other higher
education courses” (41.4%), as in general uni-versity courses where they represent almost four new enrolments out of ten.
Access to higher education and the choice of a curriculum remain closely linked to the socio-economic background. Regardless of the cur-riculum, with the exception of STS, the parents of more than one out of four new students are sen-ior managers, teachers or self-employed profes-sionals. This proportion goes as high as one third for new baccalauréat holders enrolled in univer-sity law and science courses. This trend is even more pronounced in CPGE classes and health-care courses, where the proportion of children whose parents are senior managers, teachers or self-employed professionals is, respectively, 51.8% and 42%, without any noticeable change in the last few years.
In contrast, short technological courses recruit more children of working class parents and office workers: they represent one third of new bacca-lauréat holders enrolled in IUT and 40% in STS, compared with less than 14% in CPGE classes.
Access to top higher education courses for stu-dents from all social backgrounds is an element of the equal opportunity policy, the objective be-ing to stimulate young people’s ambition, in par-ticular those coming from priority education, and raising the proportion of scholarship students enrolled in CPGE classes.
As one student can enrol in more than one course, the data presented hereby is not related (as in the previous indicator) to individuals but to the enrolment of new baccalauréat holders in higher education (principal enrolment only for university). This multiple enrolment, more frequent in the first cycle, represents at least 5% of total university enrolment.
Source: MEN-DEPP. Scope: mainland + overseas départements; for STS and CPGE, classes affiliated to the national Education Ministry, i.e. 100% of public sector students, 86.6% of private STS students and 99.5% of private CPGE students.
�2 I �3 The state of Education no. 16 [2006 issue]

25Enrolment in the principal sectors of higher education 02 Share of the different types of baccalauréat holders in higher education sectors in 2005
en %
université hors IuT IuT CPGE STS Autres
formations
Bac ES 25,7 22,1 13,5 8,7 26,2
Bac L 18,7 2,0 9,8 4,6 11,9
Bac S 39,9 41,1 72,5 8,3 41,4
Bac général ��,3 �5,2 95,� 21,� 79,5
Bac STI 1,4 14,6 2,0 21,2 2,3
Bac STT 8,4 16,0 1,7 32,9 7,0
Bac autres techno. 3,1 2,6 0,5 9,3 9,7
Bac technologique 12,9 33,2 �,2 �3,� 19,0
Bac professionnel 2,� 1,� 0,0 15,0 1,5
Total 100,0 100,0 100,0 100,0 100,0Source : MEN-DEPP
03 Social background of new baccalauréat holders enrolling in the principal higher education sectors in 2005en %
Droit Économie Lettres Sciences et STAPS Santé IuT Ensemble
université CPGE* STS
Agriculteurs 1,4 1,6 1,9 2,2 2,2 3,2 2,1 2,0 2,5
Artisans, commerçants, chefs d’entreprise 8,6 8,6 6,9 6,4 7,6 8,3 7,5 8,4 8,4
Professions libérales, cadres, enseignants 33,4 27,3 25,9 33,3 42,0 25,9 30,2 51,8 13,9
Professions intermédiaires 12,7 11,9 17,5 17,1 14,8 19,0 16,3 14,1 16,2
Employés 16,0 15,7 18,1 14,7 11,7 16,6 16,0 8,6 17,3
Ouvriers 11,2 15,0 14,3 11,6 9,5 16,3 13,3 4,9 22,7
Retraités, inactifs 10,4 14,2 10,3 7,2 6,3 7,3 9,1 7,4 13,7
Indéterminé 6,4 5,7 5,3 7,6 5,9 3,4 5,6 2,9 5,2
Ensemble 100,0 100,0 100,0 100,0 100,0 100,0 100,0 100,0 100,0
* pour les CPGE et STS sous tutelle du MEN, soit tous les élèves du public, 86,6 % des élèves des STS privées et 99,5 % des élèves des CPGE privées.Source : MEN-DEPP
0 10 20 30 40 50 60 70 80 90
100 2000 2005
% bacheliers généraux
0 10 20 30 40 50 60 70 % bacheliers technologiques
0 5
10 15 20
Université hors IUT
IUT CPGE STS Autres formations
Université hors IUT
IUT CPGE STS Autres formations
% bacheliers professionnels
Source : MEN-DEPP
01 Share of the different types of baccalauréat sections in the principal higher education sectors (2000-2005)

2� [ higher Education ]
At the beginning of the 2005 academic year, the number of higher education students continued to rise, albeit at a slower pace: + 5,000 students. This increase is the result of favourable demographics and the growing number of foreign students.
Having risen at a sustained rate (close to 7% per year) between 1988 and 1993, then less
significantly so (under 2%) in the next two years, the population in higher education decreased by 52,000 students between 1995 and 1998. The slight upturn observed in 1999 (+0.4%) and 2000 (+1%), gained momentum at the start of the 2002 and 2003 school years (+2% and +2.2%). The number of students increased more moderately at the start of the 2004 (0.5%) and 2005 (+0.2%, i.e. 5,000 additional registrations) academic years. With 2,275,000 students in mainland France and French Overseas Départements, higher educa-tion establishments register the highest ever to-tal, the overall numbers exceeding those of 1995 by nearly 100,000.
The increase observed at the start of the 2005 ac-ademic year is mostly explained by demograph-ics, accounting for an increase of 5,000 students (table 01). It is also supported by the growing number of foreign students each year since 1998, especially between 2001 and 2003 (+ 11.7% an-nual average), the rate having slowed down in 2004 (+ 4.6%) and 2005 (+ 3.7%). With 68,000 more foreign students in 2005 than in 2001, this factor accounts for 62% of the increase observed over the last four years.
The total number of students in general and healthcare university courses (excluding IUT), up by 56,000 students between 2001 and 2003, stabi-lised at the start of the 2004 school year. Despite a more substantial offer in terms of curriculum in
healthcare sectors (lower limitations for access to medical studies and more places in paramedi-cal competitive examinations) and the implemen-tation of the Licence-Master-Doctorat (Bach-elor’s degree-Master-PhD) system, encouraging students to continue their studies at least until the “baccalauréat + 3 years” level, this number dropped slightly at the start of the 2005 academic year. These sectors cater for 58% of the students in higher education. Regarding selective courses, the number of IUT and STS students stabilised in 2005 following a decrease in the previous years, while that of CPGE students kept growing.
The length of schooling for a higher education student depends on the type of baccalauréat ob-tained (table 02). Thus, among pupils who started a sixième class in 1989 and carried on with their education studies, more than 6 out of 10 general baccalauréat holders remain in higher education for over five years, while 7 out of 10 technological baccalauréat holders remain 3 years at the most and 7 out of 10 vocational baccalauréat holders 2 years at most.
At the beginning of the 2005 academic year, the rise in the higher education schooling rates of 19 and 21 year-olds (respectively + 0.3 point and + 0.6 point) compensated for the slight decreases in 23 and 25 year-olds (respectively – 0.1 point and – 0.3 point ; diagram 03).
The organisation of education systems varies considerably between countries, particularly in the higher education sector, with high rates of part-time students in Nordic or English-speaking countries. The average expected length of schooling in higher education for the entire young population (students or otherwise) in France is around the average of OECD countries, ahead of Germany but well behind the USA and Finland.
The data published covers the higher education scope as thoroughly as possible, excluding courses alternating work and study and apprenticeship except at university (for further details, see RERS 6.1 and 6.2). Table 1 is designed along the same lines as indicator 18. Schooling rates are the ratio of the number of young people of a given age enrolled in higher education compared with the estimated population of the same age. This estimate does not factor in short-term variations of migration flow. The influx of foreign students has an effect on the numerator of the ratio but not on its denominator. This is why one refers to “apparent schooling rate”, whose increase is not only the result of a greater tendency for young people living in France to continue their education.
Sources: MEN-DEPP. For international comparisons: OECD-CERI. Scope: mainland France, mainland France + overseas départements
�� I �5 The state of Education no. 16 [2006 issue]

2�
Average expected length of schooling in higher education (200�) (full-time and part-time)
Higher education schooling 01 Differences in populations in higher education due to demographics and schooling
métropole + DOM
2001-2002 2002-2003 2003-200� 200�-2005 2005-200�
Nombre d’inscrits (*) milliers 21�� 220� 225� 2270 2275dontUniversité (hors IUT) 1256 1277 1312 1 312 1 309IUT 118 115 114 112 113STS 237 235 234 230 230CPGE 71 72 72 73 75Variation 44 48 14 5Effet démographique -2 -1 6 5Effet scolarisation 46 49 8 0
Lecture : à la rentrée 2005, les effectifs totaux de l’enseignement supérieur augmentent de 5 000 étudiants.L’évolution de la taille des générations (effet démographique) aurait entrainé, si elle avait agi seule, une augmentation de 5 000 étudiants. À démographie constante, les progrès de la scolarisation aux différents âges n’entraînent pas d’évolution significative du nombre d’inscriptions à la rentrée 2005.(*) Champs définis dans RERS 6.1 et 6.2Source : MEN-DEPP
02 Length of higher education schooling* based on the type of baccalauréat obtained
en %
Baccalauréat général
Baccalauréat technologique
Baccalauréat professionnel Ensemble
1 an 3,9 11,6 21,8 6,7
2 ans 10,8 43,0 53,8 21,3
3 ans 10,3 20,3 16,0 13,3
4 ans 10,5 8,9 5,8 9,9
5 ans 22,1 8,2 2,6 17,5
6 ans et plus 42,3 8,0 - 31,2
Ensemble 100,0 100,0 100,0 100,0
Lecture : 3,9 % des bacheliers généraux du « panel 1989 » ayant poursuivi leurs études dans l’enseignement supérieur n’y sont restés qu’une année, contre 6,7 % pour l’ensemble des bacheliers.*Il s’agit du nombre d’années d’inscription dans l’enseignement supérieur sans interruption après le baccalauréat. Source : MEN-DEPP (panel 19�9)
0
5
10
15
20
25
30
35
40
45
50 %
1985-1986
1987-1988
1989-1990
1991-1992
1993-1994
1995-1996
1997-1998
1999-2000
2001-2002
2003-2004
20 ans
21 ans
19 ans
18 ans
23 ans
25 ans
Source : MEN-DEPP
4,50
4,11
3,79
3,02
3,00
2,99
2,90
2,79
2,77
2,70
2,32
Finlande
États-Unis
Suède
Espagne
Belgique
Moyenne OCDE
Italie
Royaume-Uni
France
Pays-Bas
Allemagne
Source : édition 2006 de « Regards sur l'éducation », OCDE
en années
03 Evolution in higher education schooling rates (19�5-200�).

27 [ higher Education ]
Success rates in the first years of higher education vary depending on schooling background and the curriculum selected by the different categories of baccalauréat holders. The success rate of general baccalauréat holders is significantly higher than that of technological or particularly vocational baccalauréat holders.
General baccalauréat holders distinguish themselves by a more frequent pursuit
in higher education studies, but above all by a greater success rate. The monitoring of the “1989 panel” reveals that nearly 87% of general baccalauréat holders achieve a higher educa-tion qualification, compared with only 60% of technological and 10% of vocational baccalau-réat holders. Baccalauréat graduates from sci-entific sections show the highest success rate, as only 6% do not achieve any higher education qualification.
Conversely, failure is predominant for vocational baccalauréat holders: among the minority of those who enter higher education, two thirds fail to obtain a qualification (20.7% of baccalauréat holders among the 31.1% who enrol in higher education). This failure rate is 11% for general baccalauréat holders who continue onto higher education and one third for technological bacca-lauréat holders (table 01). In total, out of 100 baccalauréat holders from the 1989 panel, 14 have not gone onto higher education, 17 have but failed and 69 obtained a qualification.
Education careers in general university cours-es reflect these differences in achievements. Access to third year (licence) depends on the sub-ject and, most of all, on the baccalauréat section (see 2005 edition, indicator 27). It should be noted that this access is not limited to students coming directly from general university courses, as they
only represented 60% of new licence recruits in 2005. Over 30% of the students come from other courses: 10.2% from IUT, 8.4% from STS and 3.2% from foreign education establishments. Students who take up studies after a break represent 8.3% of the total (diagram 02). Among the students registered in licence cours-es, the chances of obtaining their degree are unequal. Two thirds of those enrolled in licence course for the first time in 2001 obtained it in the first year, and 78% after a three year period: the success rate of general baccalauréat holders largely exceeds that of vocational baccalauréat holders and even more than that of non baccalau-réat holders (table 03).
The success rate of students enrolled in IUT for the first time at the start of the 2001 academic year can be assessed along the same lines. Two thirds of them obtained their DUT (University Diploma in Technology) in two years, the proportion reaching 76% after one additional study year (as with uni-versity, very few students obtain the qualification after a reorientation). The differences in the suc-cess rates of general (especially the ES section), technological and vocation baccalauréat holders appear even more pronounced than in the licence curriculum (table 04).
The launch of the “student portal” in May 2006 aims at helping in the guidance and achievement in the various higher education sectors.
Probable success rate in the licence course is a longitudinal indicator: a population of students entering a licence course for the first time at the beginning of the 2001 academic year is monitored for three consecutive years. Success is assessed by calculating the likelihood of obtaining the licence qualification of the population in one, two and three years. Reorientation, in terms of subjects or establishments, is accounted for. The likelihood of success in a DUT course is also a longitudinal indicator. A population of students entering a DUT course for the first time is monitored for three consecutive years. Success is assessed by calculating the likelihood of obtaining the DUT qualification of the population in two and three years and changes in orientation, whether related to the specialty of establishment, are also accounted for. The origin of students enrolled in a licence course, vocational or otherwise, indicates the course followed the previous year or, if the student wasn’t enrolled in the university, the course they claim they followed the previous year.
�� I �7 The state of Education no. 16 [2006 issue]

27Success rates in the licence curriculum 01 Assessment of the education career of baccalauréat holders among the 19�9 panel based on the principal baccalauréat sections
Accès au supérieur*
Obtention d’un diplôme de l’enseignement supérieur Études
supérieures non diplôméesEnsemble
dont bac + 2
dont bac + 3 ou +
ES 97,5 84,1 23,3 60,8 13,4L 96,2 78,3 18,3 60,0 17,9S 98,5 92,5 19,9 72,5 6,1Bacheliers généraux 97,7 ��,� 20,� ��,5 10,�STT 89,0 55,9 44,6 11,3 33,1STI 94,3 74,8 62,0 12,8 19,5Autres technologiques 81,9 52,6 23,6 29,0 29,3Bacheliers technologiques �9,1 �0,2 �5,3 1�,9 2�,9Bacheliers professionnels 31,1 10,� 9,5 0,9 20,7Ensemble des bacheliers ��,2 �9,1 25,� �3,5 17,1
Source : panel 19�9 MEN-DEPP
0� Likelihood of success in a IuT course for a population of students based on schooling background
métropole + DOM, en %
Filières de baccalauréat
Probabilité de réussite en...... 2 ans ... 3 ans
Ensemble
Sans réorien-
tationRéorien-
tation
Sans réorien-
tationRéorien-
tationLittéraire 71,3 0,5 4,7 0,5 77,1Économique 75,9 0,7 4,8 1,3 82,7Scientifique 71,2 0,7 8,0 1,9 81,7Bacheliers généraux 72,7 0,7 �,� 1,� �1,7Technologique STT 59,5 0,5 7,7 1,1 68,8Autres technologiques 48,9 0,4 13,4 1,8 64,4Bacheliers technologiques 5�,3 0,5 10,5 1,� ��,7Bacheliers professionnels 3�,3 0,1 9,3 0,1 �7,�Ensemble des bacheliers �7,0 0,� 7,9 1,5 77,0Dispensés 35,0 0,8 11,5 1,0 48,3Ensemble des étudiants ��,0 0,� �,0 1,5 7�,1
Lecture : 71,3 % des titulaires d’un baccalauréat littéraire inscrits pour la première fois en IUT en 2001 obtiennent le DUT en deux ans, sans réorientation, et 0,5 % après réorientation. À l’issue d’une année supplémentaire, les taux sont respectivement de 4,7 % et 0,5 %. Cumulées sur trois ans, leurs chances de réussite sont de 77,0 %.Source : MEN-DEPP
0 10 20 30 40 50 60 70 %
Reprise d'études
Formations à l'étranger
Autres cursus
Formations de 2e et 3e cycle (ou cursus master et doctorat)
Autres formations de 1er cycle (ou cursus licence)
BTS et assimilés
DUT
DEUG (ou niveau 2 licence)
2002 2005
Source : MEN-DEPP
02 Background of the students entering the third year of a licence course at university
03 Likelihood of success in a licence course for a population of students based on schooling background
France entière, en %
Filières de baccalauréat
Probabilité de réussite en ...
1 an
... 2 ans ... 3 ans
Ensemble
Sans réorien-
tationRéorien-
tation
Sans réorien-
tationRéorien-
tationLittéraire 69,8 8,4 1,0 1,2 0,7 81,1Économique 74,9 7,8 0,7 1,1 0,4 84,8Scientifique 70,4 10,0 0,9 1,3 0,5 83,2Bacheliers généraux 71,5 �,� 0,9 1,2 0,5 �2,9Techno STT 54,5 11,8 0,7 1,9 0,6 69,5Autres technologiques 55,2 13,3 0,7 1,7 0,4 71,3Bacheliers technologiques 5�,� 12,� 0,7 1,� 0,5 70,3Bacheliers professionnels �9,2 13,5 0,� 1,7 0,� �5,1Ensemble des bacheliers �9,� 9,2 0,9 1,3 0,5 �1,7Dispensés 32,1 10,2 0,6 3,0 0,7 46,5Ensemble des étudiants ��,1 9,3 0,� 1,� 0,5 7�,2
Source : MEN-DEPP
Lecture : 69,8 % des titulaires d’un baccalauréat littéraire inscrits pour la première fois en licence en 2001 obtiennent leur diplôme en un an ; 8,4 % l’obtiennent à l’issue d’une année supplémentaire, sans réorientation, et 1,0 % après réorientation. Après deux années supplémentaires, les taux sont respectivement de 1,2 % et 0,7 %. Cumulées sur trois ans, leurs chances de succès sont de 81,1%.
*À la rentrée suivant l’obtention de leur baccalauréat ou à la rentrée suivante.Lecture : 97,5 % des bacheliers ES poursuivent leurs études dans l’enseignement supérieur, et 84,1% y obtiendront un diplôme.

2� [ higher Education ]
DEA/master’s degree ratio: DEA qualifications awarded in the year “n” compared with master’s degrees (excluding vocational master’s degrees except MSG and excluding AES subjects – Social and Economic Administration) awarded in the year “n-1”. DESS/master’s degree ratio: DEA qualifications awarded in the year “n” compared with all master’s degrees awarded in the year “n-1”. These indicators are calculated for the principal general subjects. These indicators are incomplete as access to DEA or DESS courses is not necessarily directly and exclusively after a master’s degree. Doctorat/DEA ratio: all types of doctorats (including doctor in engineering degrees) awarded in the year “n” compared with DEA qualifications awarded in the year “n-3” for scientific doctorats and “n-4” for other subjects. Engineering degrees. All graduates from public and private establishments, affiliated to all ministries authorised to award an engineering degree recognised by the Commission des titres d’ingénieurs (CTI). Excluded are qualifications awarded through continuing education, with the exception of the CESI (Centre for higher industrial studies) and INPSA (National institute for higher agricultural promotion). Qualifications obtained by students of CNAM (National Conservatory of Arts and Crafts) are not accounted for. Business School degrees. All degrees recognised by the minister in charge of higher education. Degrees from non-recognised schools are not included (Mastère degrees, MBA etc.). These degrees correspond with various levels of qualification: mainly 5-year courses after the baccalauréat but also 4-year and 3-year courses.
In 200� the number of DEA (Advanced Studies Degree), DESS (Higher Specialised Studies Degree) and doctorats (PhD) awarded increased. The success of the DESS continued. Following the reform of the “L-M-D” (Bachelor’s degree-Master-PhD) the first master’s degrees (approximately 5,000) were granted in 200�.
In 2004, nearly 28,900 students obtained DEA de-grees or master’s degree in research. Between
1986 and 1995, the number of DEA degrees award-ed had grown from 15,400 to 27,000. Following this successful period, the number of DEA graduates dropped by 10% between 1996 and 2000. It picked up again in 2001 and 2002 (+ 8.4%). The annual growth, slowing down in 2003 with an increase of only 1.1%, picked up in 2004, at + 7.3%.
In addition, the number of students obtaining a DESS or professional master qualification has seen continual and sustained growth for the last twenty years: an average of +9.9% a year since 1982. As with DEAs, the annual increase in the number of DESS, which reached 16.5% in 2002, subsequently slowed down: +9.1% in 2003 and +5.5% in 2004, with nearly 49,500 graduates com-pared with less than 7,000 in 1982. The increase concerns in particular science, literary studies and humanities.
Since 1997, universities and related establish-ments have awarded more DESS than DEA quali-fications. As with other professionally-oriented education courses, such as vocational licences and DUT, the DESS qualification continues to at-tract increasing numbers of students.
Although a DESS or DEA is pursued more and more after an engineering or business school, 30.1% of Master’s degree holders continue with a DEA course and 47.5 % a DESS, in all subjects in 2004.
The change in the collection procedure in 2001 may explain the drop in the number of doctorats awarded that year, although this drop continued in 2002 and 2003, but less significantly. In 2004, the number of theses presented increased by 10.5% and the doctorat rate of achievement, calculated using the doctorats/DEA ratio, which was stable in 2002 and 2003 (respectively 30.8% and 30.6%), rose by 1.4 points. In literature and humanities, the proportion of DEAs leading, four years later, to a doctorat, reached 23.1% while 47.1% of sci-entific DEAs were followed, three years later, by a doctorat.
At the 2004 session, 26,800 engineering degrees were awarded, compared with 23,700 in 1999, i.e. a 13.4% increase in five years. This progress, sus-tained up to 2001, has since been much slower (+ 1.4% in 2004). In 2004, 12,000 degrees from business schools recognised by the Minister in charge of higher education were awarded. The number, up 1.2% on 2003, has more than doubled since 1990.
Source: MEN-DEPP. Scope: mainland France (universities) and mainland France + overseas départements (engineering and business schools)
�� I �9 The state of Education no. 16 [2006 issue]

2�Success rate in the master-doctorat curriculum
05 Evolution in the number of DESSs awarded (19�2-200�)
Source : MEN-DEPP
5 000
10 000
15 000
20 000
25 000
30 000
35 000
1982 1984 1986 1988 1990 1992 1994 1996 1998 2000 2002 2004
sciences lettres, sciences humaines autres disciplines
2 000
0
4 000
6 000
8 000
10 000
12 000
1982 1984 1986 1988 1990 1992 1994 1996 1998 2000 2002 2004
0
5 000
10 000
15 000
20 000
25 000
30 000
35 000
40 000
45 000
50 000
1982 1984 1986 1988 1990 1992 1994 1996 1998 2000 2002 2004
Source : MEN-DEPP
Source : MEN-DEPP
0
*En 2001, changement de mode de collecte.
métropole
métropole
métropole
01 DESS/master’s degree ratio, DEA/master’s degree ratio and doctorat/DEA ratio*
DESS/maîtrises 1990 1995 2000 2003 200�
Disciplines générales dont 27,2 28,1 33,9 46,0 47,5
Droit 29,6 31,8 35,2 47,3 46,4
Sciences économiques 53,7 47,3 55,8 70,0 72,6
Lettres et sciences humaines 17,5 21,1 25,5 32,6 33,8
Sciences 18,7 20,2 28,6 42,7 44
DEA/maîtrises 1990 1995 2000 2003 200�
Disciplines générales dont 41,0 37,5 26,9 30,5 30,1
Droit 29,0 29,9 26,6 25,3 25,5
Sciences économiques 25,2 23,7 17,1 18,3 19,5
Lettres et sciences humaines 31,9 28,6 21,1 24,0 24,8
Sciences 70,7 61,2 39,4 51,4 49,0
Doctorats**/DEA 1990 1995 2000 2003 200�
Disciplines générales dont 42,2 35,1 37,0 30,6 32,0
Lettres et sciences humaines 33,8 27,4 32,6 23,9 23,1
Sciences 54,8 49,5 51,0 45,0 47,1
* Étudiants français et métropole uniquement ** Changement de mode de collecte à partir de 2001 Source : MEN-DEPP
02 Number of degrees awarded in engineering and business schools
Diplômes 1990 1995 2000 2003 200�
Écoles d’ingénieurs 16 080 21 851 24 624 26 437 26 817
Écoles de commerce* 5 580 7 414 8 825 11 923 12 062
*Diplômes visés par le ministre chargé de l’Enseignement supérieur Source : MEN-DEPP
03 Evolution in the number of DEAs awarded (19�2-200�)
0� Evolution in the number of doctorats awarded (19�2-200�)*

29 [ higher Education ]
In 2005, eight out of ten Grandes Ecoles or third cycle university graduates had a higher or intermediate occupation approximately five years after completing their studies, compared with two thirds of the licence (Bachelor’s degree) or maîtrise (Master’s degree) holders and over four out of ten BTS (Higher Technician Certificate) holders.
A higher education qualification is a decisive advantage in finding employment. Thus,
according to Employment surveys, nearly two years after completing their studies, 83% of higher education graduates were employed in the first half of 2005, compared with 64% of other young people.
Nevertheless, more than 4 out of 10 higher edu-cation graduates have been unemployed in the three years following the completion of their studies (table 01). These unemployment periods are generally short, particularly for DUT (Univer-sity Diploma in Technology) and BTS graduates. Conversely, third cycle literature, humanities and social science graduates are sometimes unem-ployed for longer periods, of a year or more.
When careers start, professional status depends largely on the level of qualification. Therefore higher education graduates are four times (64%) more likely to hold a higher (manager, teacher, company director) or intermediate (technician etc.) occupation than graduates from the second cycle of secondary education (15%). Conversely, graduates from the second cycle of secondary education are three times more likely to be blue-collar workers or office employees (60% com-pared with 20%).
In 2005, the majority of Grandes écoles and third cycle university graduates were managers, self-employed professionals or company directors (diagram 02).
Licence and maîtrise graduates are more likely to be teachers.
Nearly all graduates from the paramedical and social sector are nurses or social workers, and have hardly ever been affected by unemployment (table 01).
Higher technological courses completed over two years lead graduates towards more diverse situations. The majority of DUT graduates hold an intermediate or higher position, five years after the completion of their studies, as do more than four BTS graduates out of ten. Those holding a DUT or BTS with an industrial specialty are more likely to have access to intermediate positions than their service-specialty counterparts (69% as opposed to 51% in 2005). The general situation, however, has taken a downturn since 2003, as a smaller proportion of these young people hold an intermediate position, being more likely to be of-fice employees or blue-collar workers (approxi-mately + 5 points since 2003).
In order to better prepare students for their pro-fessional integration, information has been made available on the “student portal” on the integra-tion rate of higher education graduates, and a na-tional debate on university and employment has been organised.
Table 03 and diagram 02 of this indicator are based on INSEE Labour force surveys. Young people “having left approximately five years ago” completed their initial education in the last 3 to 7 years (between 1998 and 2002). These two figures relate to young higher education graduates. In addition, young people having undertaken a higher education course without obtaining a qualification are registered under baccalauréat holders (see indicator 22). Table 01 is based on the “generation 2001” Céreq survey and relates to the first three career years of young people having completed their education in 2001 The traditional classification of occupations and socio-economic categories, used in table 03, defines the following as “higher” occupation category: senior managers, teachers, journalists, engineers and self-employed professionals and includes company directors. Primary school teachers, although in category A, are in the intermediate occupation category (like teachers).
Sources: INSEE, Céreq Labour force Surveys Scope: mainland France.
70 I 71 The state of Education no. 16 [2006 issue]

29
02 Professional situation of young people who have been out of initial education for an average of 5 years, based on their qualification (2005)
Employment and career of higher education graduates
0
10
20
30
40
50
60
70
80
90
100 %
Doctorat, DEA, DESS
Écoles supérieures
Maîtrise Licence DUT BTS Paramédical et social
Tous diplômésdu supérieur
Tous diplômésCAP, BEP, baccalauréat
Sans activité
Chômeurs
Employés et ouvriers
Agriculteurs, artisans,commerçants
Professions intermédiaires
Enseignants
Cadres
Professions libérales,chefs d'entreprise
Lecture : 5 ans environ après la fin de leur formation initiale, 21 % des diplômés du supérieur sont employés ou ouvriers en 2005, pour 60 % des titulaires de CAP, BEP et des baccalauréats. À l'inverse, 64 % des diplômés de l'enseignement supérieur exercent une profession supérieure ou intermédiaire (en incluant les chefs d'entreprise), pour 15 % des diplômés du second cycle de l'enseignement secondaire. Source : calculs DEPP à partir des enquêtes emploi de 2005 de l'INSEE (moyenne annuelle)
01 Length of unemployment, between 2001 and 200�, of higher education graduates who completed their studied in 2001 (in the first three career years)
en %
Nombre de mois passés au chômage
0 moisDe 1 à 5
moisDe � à 12
moisPlus
d’1 anDoctorat, DESS, DEA, grandes écolesSciences humaines, économie, droit, commerce … 48 23 16 13Sciences et techniques, ingénieur, santé … 57 20 15 8Maîtrise, licence et DEuGSciences humaines, économie, droit … 58 19 13 10Sciences exactes et naturelles 58 18 13 11BTS – DuT«Tertiaires » (orientés vers la communication, le commerce ...) 46 30 17 7« Industriels » (orientés vers la production) 52 27 15 6Diplôme paramédicaux et sociaux (bac + 3, bac + �) 88 10 2 0Total diplômés de l’enseignement supérieur 5� 21 13 �Ensemble Génération 2001 53 19 13 15
DESS : diplômes d’études supérieures spécialisées ; DEA : diplômes d’études approfondies ; BTS : brevets de techniciens supérieurs ; DUT : diplômes universitaires de technologie.Source : Génération 2001, Céreq
03 Percentage of higher professions and company directors of the total number of jobs (2005)
en %
Environ 5 ans après
la fin des études
Ensemble population occupant un emploi
Doctorat, DEA, DESS 72 79
Écoles supérieures 76 76
Maîtrise 43 52
Licence 19 35
Sous-total enseignement supérieur long 53 62
DUT 10 29
BTS 7 18
Paramédical et social 1 4
Sous-total enseignement supérieur court 7 18
Diplômés du supérieur 31 41
Diplômés du secondaire 2 6
Aucun diplôme 2 2
Ensemble 1�,0 15,2Source : calculs DEPP à partir des enquêtes emploi de 2005 de l’INSEE (moyenne annuelle)

30 [ continuing Education ]
In 2005, 10.� billion Euros were devoted to continuing education activities, i.e. 9.1% of the domestic expenditure on education, and 1.9 billion Euros on extra-curricular education. The principal sources of funding are the State and private companies. There are more and more people applying for VAE (validation of skills acquired through experience) with a view to obtaining a secondary or higher education qualification.
Continuing education expenditure amounted to 10.8 billion Euros in 2005 (according to the
education Accounts, which adopt a different ap-proach from that of vocational training Accounts – see methodology). From 1980 to 2005, this ex-penditure increased from 6.7 to 10.8 billion Euros on a constant price basis, i.e. a 61% rise, and its share of the Domestic Education Expenditure (DEE) decreased from 10.4 to 9.1% (table 01).
Extra-curricular education expenditure doubled between 1980 and 2005, notably following the transfer of artistic education expenditure in 2003 (municipal conservatories), which had been thus far the responsibility of the secondary sector.
In terms of initial funding, i.e. prior to transfer, this expenditure is mainly financed by private compa-nies (41.3%) and the State (31.9%). In particular, the State funds the training of its agents and that of people seeking employment: thus the Ministry for Employment, Social Cohesion and Housing is the leading source of public funds. The Ministry of Education also makes a major contribution to continuing education, and covers nearly 15% of the State funding.
While continuing education has often been perceived as the “school of the second chance”, it continues to more often benefit better qualified employees.
Nevertheless, Groups of Secondary Education Establishments (GRETA) carried out the training
of more than 500,000 people in 2004, slightly down on the previous year. Over half of them were un-employed or off the labour market and nearly half of them undertook a level V education course, more often to prepare for a CAP – Educational Training Qualification (diagram 02).
There are more and more people applying for VAE (validation of skills acquired through experi-ence). Those applying to the national Education system for a national vocational or technological education qualification most often apply for a lev-el equivalent to or higher than the baccalauréat (diagram 04). In 2005, 21,000 people saw their ap-plication reviewed by the jury, with 12,600 obtain-ing a fully-fledged qualification (diagram 03).
VAE also tends to develop in higher education (universities and CNAM – National Conservatory of Arts and Crafts), in addition to the VAP (Valida-tion of Acquired Vocational Skills – 1985 decree), which makes it possible to access a course with-out the qualification normally require to enrol. In 2005, over 3,800 VAE applications were exam-ined and over 1,600 qualifications awarded.
Continuing education expenditure is comprised of all the expenditure made by all the economic agents (State, regional administrations and otherwise, businesses, households) on the organisation of continuing education activities, including training courses organised internally by companies or administrations. The major differences between the education account used herewith and the continuing education account established by the Ministry for Employment, Social Cohesion and Housing and amounting to 22.9 billion Euros in 2003, are as follows: the latter includes apprenticeship, trainees salaries and exemption of social security charges related to alternating work and study contracts and apprenticeship contracts. Extra-curricular activities include night classes, CNAM activities etc. They are included in the education expenditure, whose overall amount (117.9 billion Euros) is thereby evenly distributed between primary education (32.1 billion), secondary education (52.5), higher education (20.6) and this indicator (10.8 and 1.9).
Scope: mainland France and mainland France + overseas départements Source: MEN-DEPP, MECSL (DARES).
72 I 73 The state of Education no. 16 [2006 issue]

30Expenditure on continuing education 01 Expenditure on continuing education and extracurricular education*
métropole + DOM19�0 1990 2000 200� 2005
DIE pour la formation continue aux prix courants (en milliards d’euros) 2,9 7,0 10,1 10,5 10,�aux prix de 2005 (en milliards d’euros) 6,7 8,9 11,1 10,7 10,�DIE pour l’enseignement extra-scolaireaux prix courants (en milliards d’euros) 0,3 0,8 1,2 1,9 1,9aux prix de 2005 (en milliards d’euros) 0,8 1,0 1,4 1,9 1,9Part dans la DIE 11,� % 11,5 % 10,� % 10,� % 11,� %Structure du financement initial (en %) (**)État 32,9 31,9
dont MEN 4,4 4,2Collectivités territoriales 13,4 1�,2Autres administrations publiques et CAF 2,1 2,1Entreprises 41,0 �1,3Ménages 10,6 10,5
* L’enseignement « extra-scolaire » correspond aux formations CNAM, formations artistiques (transfert de crédits depuis 2003 de l’enseignement du second degré).** Cette ventilation n’est possible qu’à partir de 1999. De plus, depuis 2003, une part des dépenses de l’État en IUFM n’est plus comptabilisée au titre de la formation continue mais est réaffectée aux activités d’enseignement initial des premier et second degrés scolaires. Source : MEN-DEPP
0
10
20
30
40
50
60 %
Niveaux I et II
BTS Brevet et bac
professionnels
CAP/BEP Niveau Vbis
Niveau VI
Formationaccessible à
tous niveaux
Source : MEN-DEPP Source : MEN-DEPP
0
10
20
30
40
50
60 %
CAP BEP BP Bac professionnel
BTS Autresdiplômes EN*
2002 2003 2004 2005
* mention complémentaire ou BMA ou DEES.
0
5 000
10 000
15 000
20 000
25 000
2002 2003 2004 2005
dossier examiné par le jury ayant obtenu le diplôme complet
0
1 000
2 000
3 000
4 000
5 000
2002 2003 2004 2005
Candidats à un diplôme de l'enseignement professionnel et technologique du MEN
Candidats à un diplôme universitaire (ou du CNAM)
Source : MEN-DEPP
0� Breakdown of VAE applicants in vocational and technological education
03 Validation of skills acquired through experience (VAE)
02 Breakdown of GRETA (Group of Secondary Education Establishments) trainees based on the level of the course undertaken in 200�

Increased pupil and student population since the beginning of the 2002 school year
In 2005-2006, the total number of pupils, apprentices and students in the public and private sectors in mainland France and overseas départements slightly exceeds 15 million, of which 600,000 are from overseas départements. Although inferior to the highest ever level of the mid 1990s, a new trend has been observed since the beginning of the 2002 school year: the pu-pil and student population as a whole stopped decreasing and rose by over 100,000 between 2001 and 2005, i.e. + 0.8%.
In primary education, due to the current demographic recovery and rise in the number of births since 2000, the downward trend ended at the start of the 2003 school year, and the sector has seen three consecutive increases of 23,000, 33,000 and 41,000 pupils.
In secondary education, however, the total number of pupils in establishments under the responsibility of the Ministry of national Education continues to decrease, down by another 55,000 pupils at the start of the 2005 school year, this number exceeding that of the previous year. This decrease concerns the first cycle of secondary education, with numbers drop-ping for the last ten years due to the schooling of “smaller” generations (-1.7% at the start of the 2005 school year). While the general and technological second cycle of secondary education remain relatively stable, vocational education is up again (+ 2.9% in 3 years).
The increase in the number of apprentices, which had been sustained throughout the 1990s but had stopped at the begin-ning of the 2000s, seemed to pick up again in 2004 and in particular in 2005, with a substantial development of courses preparing for a higher education qualification. The same applies to agricultural establishments in secondary education, with the number of pupils, which had stabilised around 150,000 in the early 2000s, slightly up in the last two years.
Since 1980, the overall student population has doubled. Following a plateau, or even a slight downturn in the late 90s, higher education (all courses included) is also up again, with over 100,000 additional students in 4 years. While the number of students in engineering and business schools and paramedical and social study schools has been rising in the last few years, those in IUT and STS have been slightly dropping.
Definition: Pupil and student population includes all pupils in primary and secondary education (including adapted educa-tion), apprentices, students in universities or elsewhere, in the public and private sectors in mainland France and French Overseas Départements (including pupils and students under the responsibility of the Ministry of Agriculture). It should be noted that surveys on higher education take into account the number of enrolments and not students.
Appendix
7� I 75 The state of Education no. 16 [2006 issue]

Total number of pupils and students
métropole + DOM, public et privé
Effectifs en milliers 19�0-19�1 1990-1991 2000-2001 2002-2003 2003-200� 200�-2005 2005-200�
Premier degré (1)
Préélémentaire 2 456,5 2 644,1 2 540,3 2 566,0 2 598,7 2 609,5 2 613,1
CP-CM2 4 810,0 4 218,0 3 953,0 3 908,9 3 900,0 3 924,6 3 962,6
AIS 129,8 91,2 58,7 54,2 53,3 51,4 50,7
Total premier degré 7 39�,3 � 953,� � 552,0 � 529,1 � 552,0 � 5�5,5 � �2�,5
Second degré
Premier cycle 3 257,6 3 249,4 3 289,5 3 269,1 3 244,6 3 193,3 3 138,0
Second cycle professionnel (2) 800,6 742,2 701,4 699,8 708,4 715,4 720,2
Second cycle général et technologique 1 124,4 1 607,4 1 501,4 1 509,6 1 511,0 1 515,3 1 512,8
Enseignements adaptés 126,5 126,7 122,2 119,0 117,1 116,2 114,5
Total second degré MEN 5 309,2 5 725,7 5 �1�,� 5 597,� 5 5�1,1 5 5�0,3 5 ��5,�
Second degré agriculture 117,1 116,2 151,3 149,4 151,1 152,5 154,9
CFA (3) 244,1 226,7 376,1 373,5 371,2 378,8 401,5
Spécial santé « scolarisés » 96,2 88,2 81,4 82,7 81,9 77,1 76,3
Enseignement supérieur
Universités (sans IUT ni form. d’ingénieurs) 796,1 1 075,1 1 254,3 1 251,8 1 287,1 1 286,4 1 283,5
CPGE et prépas intégrées 42,9 68,4 73,8 75,3 75,3 76,5 77,8
STS 67,9 199,3 238,9 235,5 234,2 230,3 230,4
IUT 53,7 74,3 119,2 115,5 113,7 112,4 112,6
Écoles d’ingénieurs (4) 40,0 57,7 96,5 102,4 105,0 107,2 108,1
Écoles de commerce, gestion, compta. et vente 15,8 46,1 63,4 74,7 80,6 83,2 87,7
Écoles paramédicales et sociales 91,7 74,4 93,4 111,2 119,5 124,2 124,2
Autres établissements (5) 76,0 128,5 232,4 255,4 254,7 263,7 265,1
Total supérieur (�) 1 1��,1 1 717,1 2 1�0,3 2 20�,� 2 25�,2 2 2�9,� 2 275,0
Total général 1� 3�7,0 1� �27,� 1� 935,� 1� 9�0,� 1� 993,� 15 00�,0 15 019,7
(1) De 2000 à 2005, estimations pour l’ensemble du premier degré.(2) Y compris préparations diverses et formations complémentaires.(3) Y compris les CFA sous tutelle du ministère de l’Agriculture.(4) Y compris les NFI (nouvelles formations d’ingénieurs).(5) Groupe rassemblant les écoles vétérinaires, juridiques et administratives, artistiques et culturelles, EHESS, autres écoles dépendant d’autres ministères, INP, UT (universités de technologie), et les IUFM à partir de 1991.(6) Sans double-compte des formations d’ingénieurs en UT et INP.

National nomenclature for levels of education established by the National Statistical Commission on Continuing Education and Social Promotion.
Level VI: those leaving during the first cycle of secondary education (sixième, cinquième or quatrième classes at collège) and one-year pre-vocational courses (CEP – Vocational Education Certificate, CPPN – Pre-vocational course and CPA – Preparatory Class for Apprenticeship).
Level Vbis: those leaving at the end of general troisième class or technological quatrième and troisième classes or short-term training courses before the final year.
Level V: those leaving at the end of the final year of short vocational courses, or those dropping out of long-term general secondary education before the final year at lycée.
Level IV: those leaving at the end of the final year of long-term general secondary education in a lycée or dropping out of post-baccalauréat higher education before reaching level III
Level III: those leaving higher education with a qualification equivalent to 2 years after the baccalauréat (DUT, BTS, DEUG, healthcare or social care training schools, etc.).
Levels I and II: those leaving higher education with a qualification after the second or third cycle of university education or a degree from a Grande école.
Levels of education
7� I 77 The state of Education no. 16 [2006 issue]

AR: [network] ambition réussite (Objective: success)AES: Social and Economic Administration studiesAIS: School adaptation and integration.ATOSS: Administrative, technical, maintenance and service, welfare and health personnelBEP: Certificate of Technical EducationBEPA: Agricultural Vocational Studies CertificateBIT: (ILO) - International Labour Organisation.BTS: Higher Technician CertificateCAP: Educational Training QualificationCAPA: Agricultural Vocational Aptitude CertificateCAPES: Certificate of Aptitude for Teaching in Secondary EducationCEREQ: Centre for Study and Research into QualificationsCERI: Centre for Research and Innovation in TeachingCOP: Careers advisor - psychologistCPA: Preparatory Class for ApprenticeshipCPGE: Preparatory Class for Grandes écolesCPPN: Pre-vocational courseDEA: Advanced Studies DegreeDEPP : Evaluation and Forecasting DepartmentDESS: Higher Specialised Studies DegreeDEuG: General University Diploma awarded after completion of the first 2-year cycleDEuST: Scientific and Technical University DiplomaDGES: Higher Education General ServicesDGESCO: School education general servicesDGRH: Human Resources General ServicesDIE: (DEE) - Domestic Education Expenditure.DOM: French Overseas DépartementDSN: National Service DepartmentDuT: University Diploma in TechnologyENSI: National School for Advanced EngineeringES: Economic and SocialGRETA: Group of Secondary Education Establishments (Ministry of Education)
IEA: International Association for the Evaluation of Educational AchievementINSEE: French National Institute for Statistics and Economic StudiesITRF: Engineers and technicians in research and trainingIuFM: University Institute for Teacher TrainingIuP: University Institute for Professional StudiesIuT: University Institute of TechnologyJAPD: National Defence Preparation DayL: Literary sectionLOLF: Constitutional bylaw on budget actsMI-SE: House director and non-resident pupil supervisorMEN: Ministry of Education, Higher Education and ResearchMSG: Master’s degree in management sciencesMST: Master’s degree in science and techniqueOECD: Organisation for Economic Co-operation and DevelopmentPEGC: General Secondary School TeacherPIB: (GDP) - Gross Domestic Product.RASED: Specialised aid network for children with learning problemsREP: Priority Education Network.S: Science section.STAPS: Science and Technology for Physical Activities and SportsSEGPA: Special general and vocational education classesSTI: Industrial Science and TechnologySTS: Higher Technician SectionTOM: French Overseas TerritoryuNEDIC: Central Unemployment Benefits AgencyVAE: Validation of Skills Acquired Through ExperienceZEP: Priority Education Zone
Table of abbreviations

les résultats
l’environnement économique et social
les parcours scolaires
les moyens et les ressources humaines
les conditions de scolarisation
Géographie
n° mai 20059 ( )
effectifs d'étudiants en 2005-2006
atlas régional Alsace
Aquitaine
Auvergne
Bourgogne
Bretagne
Centre
Champagne-Ardenne
Corse
Franche-Comté
Languedoc-Roussillon
Limousin
Lorraine
Midi-Pyrénées
Nord-Pas-de-Calais
Basse-Normandie
Haute-Normandie
Pays de la Loire
Picardie
Poitou-Charentes
Provence-Alpes-Côte-d‘Azur
Rhône-Alpes
Ile-de-France
Antilles-Guyane
La Réunion
Territoires d'Outre-mer
STATISTIQUESsur les enseignements,la formation et la recherche
&REPÈRES
RÉFÉRENCES
2006
RERS
Ministry publications by Depp
Publications by the Ministry of national Education, Higher Education and Research made by the DEPP (Evaluation and Forecasting Department) present comprehensive statistical data resulting from systematic surveys, but also series of analytical indicators, methodology or summary articles, surveys or research outcome. Beyond the data contained in this document, they should enable the reader to understand more comprehensively the French education system.
> Géographie de l’Ecole (school geography)The principal data of the education system presented in relation to geographical differences. Analysis of the characteristics of the French education system, by school academy, geographical region or département, from pre-school to higher education.
20 euros,issue no. 9, May 2005.
> Repères et références statistiquessur les enseignements,la formation et la recherche(Indicators and statistical references on education, training and research)Detailed statistical information on all sectors of the national Education system with clear and concise texts, definitions, document references and an index.
2� euros,September 200�.
> Atlas régionaleffectifs d’étudiants en 2005-2006(Regional Atlas related to student numbers, 2005-200�)This publication is a pre-requisite for any territorial, national and regional approach to the higher education system. This tool enables the various partners and stakeholders of the higher education system to gain comprehensive knowledge of the situation as well as recent developments.
15 euros, 200� issue [to be published soon]

L’internat au cours des étudessecondaires
Améliorer les compétencesdocumentaires des élèves
n° 72 [septembre 2005]Éducationformations
Les représentations des élèvesdu panel 1995, sept ans aprèsleur entrée en sixième(enquête Jeunes 2002)
Le thème :
dossiersles
Insertion, Éducation et Société
177 [septembre 2006]
Les filières scientifiqueset l’emploi
Catherine Béduwé (coordinatrice) et Bernard Fourcade, LIRHEJean-François Giret et Stéphanie Moullet, CEREQ
> éducation & formations(Education & training) Research and information magazine with articles on the major issues in the Education system. DEPP publication available to all stakeholders of the education system.
Sale per copy only2001 and 2002: 12.20 Euros. 2003 onwards: 13 Euros.
> Les dossiersEach dossier, focused on the outcome of a survey or evaluation of a given subject, provides a comprehensive and detailed report on one of the aspects of the French education system. A significant section shows the methodology aspects required to understand the results.
Issue no. 1�1 onwards: 15 Euros.
> Regards sur le système éducatif français(French education system at a glance) CD-ROM Mac-PC. Interactive look at the French education system. With over thirty commented slide shows, this CD-ROM gives you access to survey results and studies from the Direction de l’évaluation, de la prospective et de la performance.
2� euros, 200� issue.

06.25SEPTEMBRE
i n f o r m a t i o nwww.education.gouv.fr/stateval
note d’
Les effectifs dansl’enseignement supérieurConstat 2005 et prévisionspour les rentrées 2006 et 2007
À la rentrée 2005, les sixprincipales filières del’enseignement supérieurcomptent 1 923 700 inscriptions,soit 0,2 % de moins que l’annéeprécédente. Cependant, le nombrede nouveaux inscrits en premièreannée d’université augmente,notamment du fait de la hausse deseffectifs de terminales généraleset du nombre de bacheliersgénéraux à la session 2005.Les effectifs universitaires (horsIUT) d’étudiants en cursus licenceet doctorat augmentent (+ 0,5 % et+ 1,7 %) mais diminuent en cursusmaster (- 1,5 %). Les écolesd’ingénieurs et les institutsuniversitaires de technologieprogressent légèrement (+ 0,5 %et + 0,2 %). Les effectifs desclasses préparatoires aux grandesécoles sont en hausse (+ 2,2 %).En revanche, ceux des IUFM etdes sections de technicienssupérieurs diminuent(respectivement - 2,5 % et - 0,5 %).Pour les deux prochaines années,le nombre d’étudiants dans cesfilières (hors IUFM) progresseraitlégèrement en 2006 pour sestabiliser en 2007, notamment àcause de la diminution du taux depoursuite d’études des bacheliersgénéraux et technologiques.
Le constat présenté porte sur les effectifsd’étudiants observés dans les six princi-pales filières de l’enseignement supérieur :instituts universitaires de technologie (IUT),universités et établissements assimilés(hors IUT) (le terme « université (hors IUT) »sera utilisé par la suite), classes prépara-toires aux grandes écoles (CPGE), sectionsde techniciens supérieurs (STS), institutsuniversitaires de formation des maîtres(IUFM) et écoles d’ingénieurs. À la rentrée2004, l’ensemble de ces filières avaitaccueilli près de 85 %1 des étudiants del’enseignement supérieur (hors formationsen alternance ou par apprentissage). Lesprévisions sont réalisées dans ces filièresà l’exceptiondecelledes IUFM (tableau1).
Quasi-stabilité du nombred’étudiants à la rentrée 2005
Pour la deuxième année consécutive, lenombre d’inscriptions dans les six princi-pales filières de l’enseignement supérieurest presque stable avec 3 800 étudiants demoins (- 0,2 % par rapport à la rentrée 2004).Mais les évolutions sont contrastéessuivant la filière. Les effectifs des CPGE, desécoles d’ingénieurs et des IUT augmentent(respectivement + 2,2 %, + 0,5 % et + 0,2 %).En particulier, les effectifs des écolesd’ingénieurs dépendant de l’universitéprogressent de 2,3 %. En revanche, ceux
des STS diminuent légèrement (- 0,5 %)et sont stables à l’université (hors IUT)(- 0,1 %).Pour la troisième année consécutive,les effectifs en IUFM diminuent en raisonde la baisse des recrutements (- 2,5 %,soit 2 100 étudiants de moins).L’évolution de la population étudiantedépend, pour une grande part, du flux annueld’arrivée de nouveaux bacheliers et desorientationsqu’ils choisissent. Or, le nombrede lauréats à la session 2005 du baccalau-réat (506 600 bacheliers) est en haussepar rapport à la session 2004 (+ 1,7 %)(tableau 2). Cette hausse touche uniquementle baccalauréat général. Ainsi, le nombre decandidats reçus au baccalauréat généralaugmente-t-il de 4,4 %. En revanche, lenombre de bacheliers technologiques etcelui des bacheliers professionnels dimi-nuent (respectivement - 1,7 % et - 0,7 %).La hausse du nombre de bacheliers géné-raux s’explique à la fois par l’augmentationdes effectifs de terminales générales(+ 2,4 %) et par celle du taux de réussite àla session 2005 du baccalauréat général.Le rapport moyen (nombre de bacheliersd’une série/nombre d’élèves de termi-nales de la série) a ainsi progressé,passant de 84,2 % à la session 2004 à
1. Les effectifs de l’ensemble de l’enseignementsupérieur de la rentrée 2005 ne sont pas encore tousconnus.
06.02AOÛT
é v a l u a t i o nwww.education.gouv.fr/stateval
n o t e
Les attitudes à l’égardde la vie en sociétédes élèves de fin d’écoleet de fin de collège
Àl’heureoùs’établissent ladéfinitionet le contenu du socle commun,notammentenmatièredecompétencessociales et civiques, cette Noterend compte d’une évaluation quia interrogé les élèves de 2005 en finde CM2 et en fin de troisième surleurs attitudes à l’égard de la vieen société. Les collégiens font partd’un plus grand rejet à l’égard desdiscriminations et d’une plus grandeouverture d’esprit que les écoliers.Ils s’affirment également plusnettement au sein de leur groupede camarades et attachent plusd’importance aux libertésd’expression. Mais ils respectentbeaucoup moins scrupuleusementles règles, notamment celles de lavie scolaire que les élèves de CM2.Ceux-ci ont tendance à condamnertout manquement à la règle, sansbien hiérarchiser les différentsactes contraires à la loi. Par rapportaux élèves de 1995, ceux de 2005se déclarent plus tolérants, ilsrejettent davantage tout acte dediscrimination et se montrent plussolidaires, mais, même s’ils disentreconnaître l’utilité de la règleet de la loi, ils disent aussi prendreplusdelibertésavecelles,particulièrementdans le cadrescolaire.
L’évaluation des attitudes des élèves àl’égard de la vie en société a été réaliséeen mai et juin 2005. Interrogés sur leurs atti-tudes et leurs avis face à diverses situationsrelatives à la vie en société, les élèvesdevaient exprimer leur accord ou désaccordavec des affirmations commençant par« Certains pensent que... » ou « Certains disentque... ». Sur le même mode, ils avaient àjuger chacune des déclarations soumises àleur appréciation « acceptable » ou « inaccep-table », « grave » ou pas, « normale » oupas. On leur demandait également de direcomment ils agiraient face à des situationsconcrètes. De nombreuses questions avaientaussi pour objectif de mieux connaîtrele cadre scolaire et familial dans lequel ilsétudient et vivent. Les directeurs d’école,les chefs d’établissement ainsi que lesconseillers principaux d’éducation au collègeont également répondu à des questionnairesde contexte pour éclairer les réponses desélèves et livrer leurs perceptions, en tantqu’acteurs de terrain, des attitudes desélèves au sein de leur école ou collège.Le livret « Élève » en fin d’école comprenait89 questions dont 18 de contexte ; en finde collège, il en comportait 131 dont 26 decontexte. De nombreuses questions sontcommunes aux deux niveaux mais certainesquestions de troisième n’ont pas été poséesen CM2 pour des raisons de compréhensiondes enjeux ou par manque de maturité
des élèves du primaire. Leur éviction s’estjustifiée aussi par souci de contenirraisonnablement le temps de concentrationet de réflexion d’élèves âgés en moyennede 11 ans au moment de la passation duquestionnaire.Plusieurs questions ont été reprises d’uneévaluation réalisée au cours de l’annéescolaire 1994-1995 au début et à la findu collège. Deux types de comparaisons etd’analyses des résultats ont été effectuéesentre la fin de l’école primaire et la fin ducollège en 2005 sur la base des 71 questionscommunes et sur la décennie 1995-2005 àla finde l’école primaireet à la findu collège.À des finsde comparaisons,parmi les élèvesde sixième ayant passé l’évaluation enseptembre 1994, seules les réponses desélèves non redoublants ont été retenues.Sortant juste de l’école primaire au momentde la passation, on peut supposer que leursréponses sont proches de celles qu’ilsauraient apportées trois mois plus tôt.95 % des écoliers et 80 % des élèves detroisième interrogés ont déclaré avoir étéintéressés par l’objet de cette évaluation.
Sept domaines étudiésen fin d’école,huit en fin de collège
Les thèmes abordés ont porté sur le sexisme,la xénophobie, l’homophobie (au collège), le
06.03JUILLET
r e c h e r c h ewww.education.gouv.fr/statevalhttp://idep:8000/dpd/reperes/default.htm
n o t e
Dépenses de rechercheet développementen France en 2004Premières estimations pour 2005
En2004, ladépenseintérieurederechercheetdéveloppements’élèveà35,5milliardsd’euros.Aprèsuneannéedebaisseen2003, laDIRDprogresseainsidemanièresensibleavecunehaussede1,1%envolume.LaDIRDdevraitatteindre36,4milliardsd’eurosen2005,cequicorrespondàunehausseenvolumede0,5%.Enbaissedepuis2002,lapartdelaDIRDdanslePIBs’établità2,14%en2004.Lesentrepriseset lesecteurpubliccontribuentdemanièreéquivalenteàl’augmentationdelaDIRD,maislaprogressiondel’exécutiondetravauxderechercheestcependantplusimportantedanslesadministrationsquedanslesentreprises.En2004, leseffectifsdeR&D(352000ETP)progressentaumêmerythmequecesdernièresannées(environ2%paran).L’emploidechercheurscontinueàprogresseralorsquel’effectifdesautrespersonnelsdeR&Ddiminue.L’activitéderecherchedesentreprisesresteconcentréedansquelquesbranchesd’activités.L’automobileest toujourslapremièrebranchederecherche; lesdépensesenconstructionaéronautiqueetspatiale,quatrièmebranche,progressent leplus.L’activitépubliquederecherche, financéeà79%pardesdotationsbudgétaires,estmarquéeparuneprogressiondesdépensesdesEPIC.
Pour mesurer les dépenses globales de R&D,on se réfère soit au financement des activitésde R&D, soit à leur exécution par deux grandsacteurs économiques : les administrations etles entreprises. Les administrations désignentici les services ministériels, les organismespublics de recherche (établissements àcaractère scientifique et technique (EPST),établissements publics à caractère industrielet commercial (EPIC) et autres établissementspublics), l’enseignement supérieur (univer-sités, grandes écoles, centres hospitaliersuniversitaires (CHU) et centres de lutte contrele cancer (CLCC) et les institutions sans but
lucratif (associations, fondations). Ce regrou-pement est celui adopté par les organisationsen charge des comparaisons internationales.Deux grands indicateurs sont ainsi utilisés :– la dépense nationale de rechercheet développement (DNRD) qui correspondau financement par des entreprises ou desadministrations françaises nationales (y comprisles administrations régionales ou locales) destravaux de recherche réalisés en France ou àl’étranger ;– la dépense intérieure de recherche etdéveloppement (DIRD) qui correspond auxtravaux de R&D exécutés sur le territoire
0,27 Md€
Fondscommunau-
taires
0,47 Md€
2,2 Md€
Fondscommunau-
taires
0,16 Md€
Étranger Étranger
Graphique 1 – Le financement et l'exécution de la recherche en 2004
Source : MEN-DEPP-C2
> Les notes de la Depp : Information, évaluation, Recherche (Information, Evaluation, Research) are published continually throughout the year to ensure rapid communication of statistical information..
The Information note assesses one aspect of the education system and offers, in a summarised and clear fashion, the main elements of the latest survey and study results.200� subscription rates:France - �5 EurosAbroad - �� Euros.Price per copy: 1 Euro for 1999 to 200� notes[minimum invoice � Euros].
The Evaluation note presents the outcome of evaluation work carried out on the education system, its operating conditions and factors contributing to its efficiency.
The Research note summarises the results of statistical surveys or studies carried out or monitored by the Office of Statistical Surveys on French Research and Innovation.