
DDM Monitoring David Cameron Pedro Salgado Ricardo Rocha.
43
DDM Monitoring David Cameron Pedro Salgado Ricardo Rocha
-
Upload
norman-austin-watson -
Category
Documents
-
view
220 -
download
5
Transcript of DDM Monitoring David Cameron Pedro Salgado Ricardo Rocha.

DDM Monitoring
David Cameron
Pedro Salgado
Ricardo Rocha

How it works DDM Monitoring (today) Dashboard Monitoring (near future)

How It Works

How It Works
How It Works
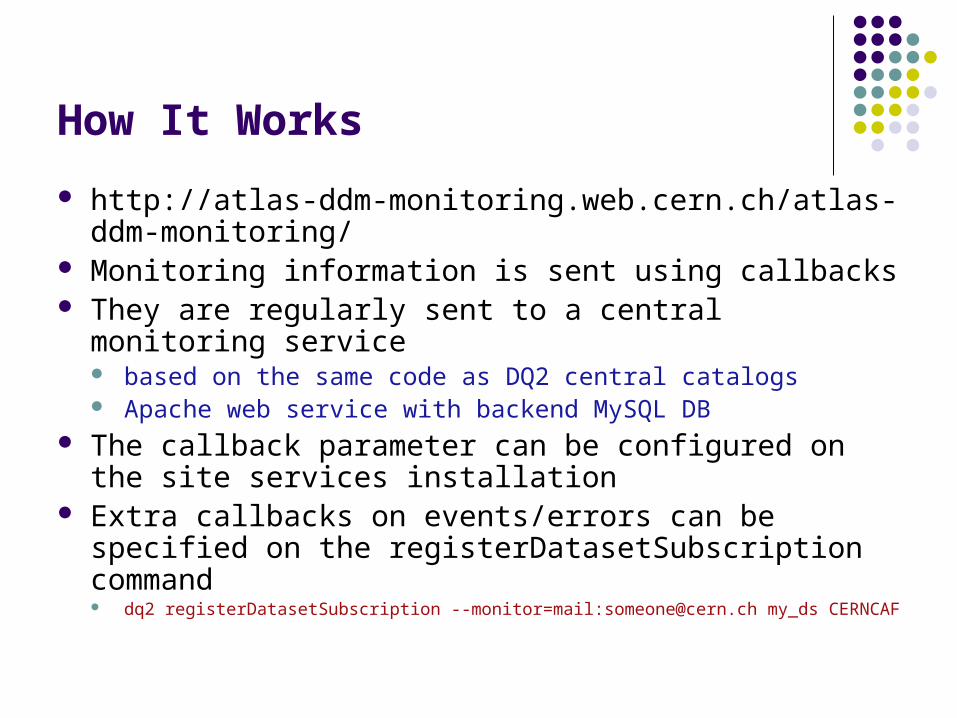
http://atlas-ddm-monitoring.web.cern.ch/atlas-ddm-monitoring/
Monitoring information is sent using callbacks They are regularly sent to a central monitoring service
based on the same code as DQ2 central catalogs Apache web service with backend MySQL DB
The callback parameter can be configured on the site services installation
Extra callbacks on events/errors can be specified on the registerDatasetSubscription command dq2 registerDatasetSubscription --monitor=mail:[email protected] my_ds
CERNCAF

How It Works
Types of callbacks --monitor
executed each time there is a state transition on the site services agent
--callbacks-file-done executed each time a file on that subscription is successfully
transferred --callbacks-vuid-complete
executed when all dataset subscription files are copied --callbacks-error
in case an error occurs while processing the subscription sends error type and description
Examples --monitor=mail:some.email@domain --callbacks-file-done=http://some.url/

How It Works
Database is composed by three tables file states errors summary information per hour (just throughput, no of files copied and no
of errors) Data is deleted from the first two tables after a week
only file DONE states from the file table - we keep HOLD states For the web pages..
on the ‘current transfers’ pages, data is read directly from the DB cron jobs run every
10 minutes to produce the plots on the main page and fill thesummary table

DDM Monitoring

DDM Monitoring
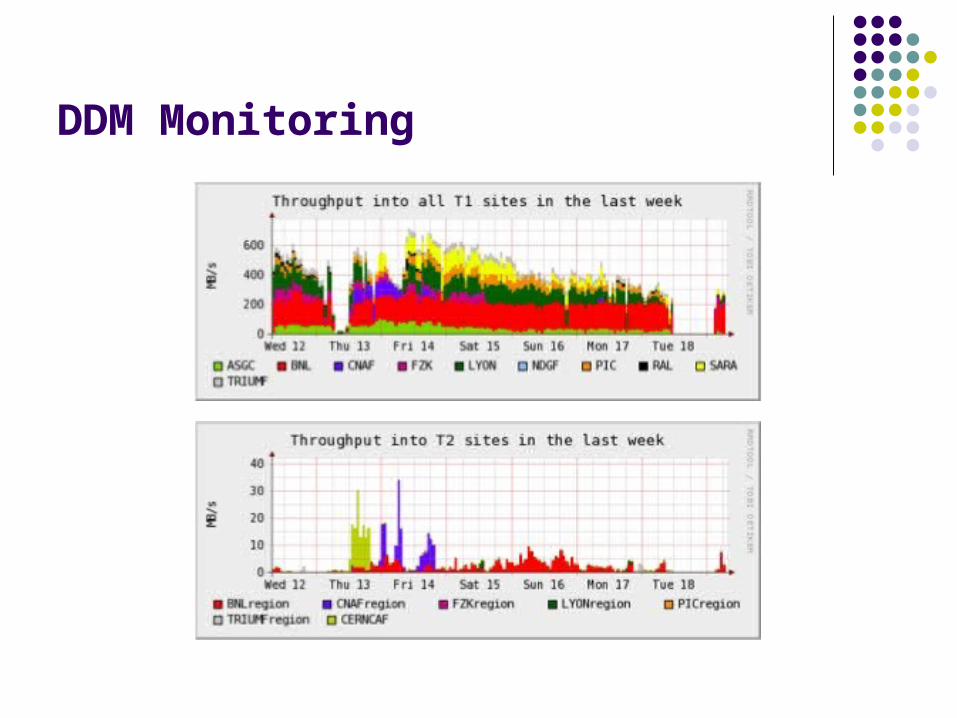
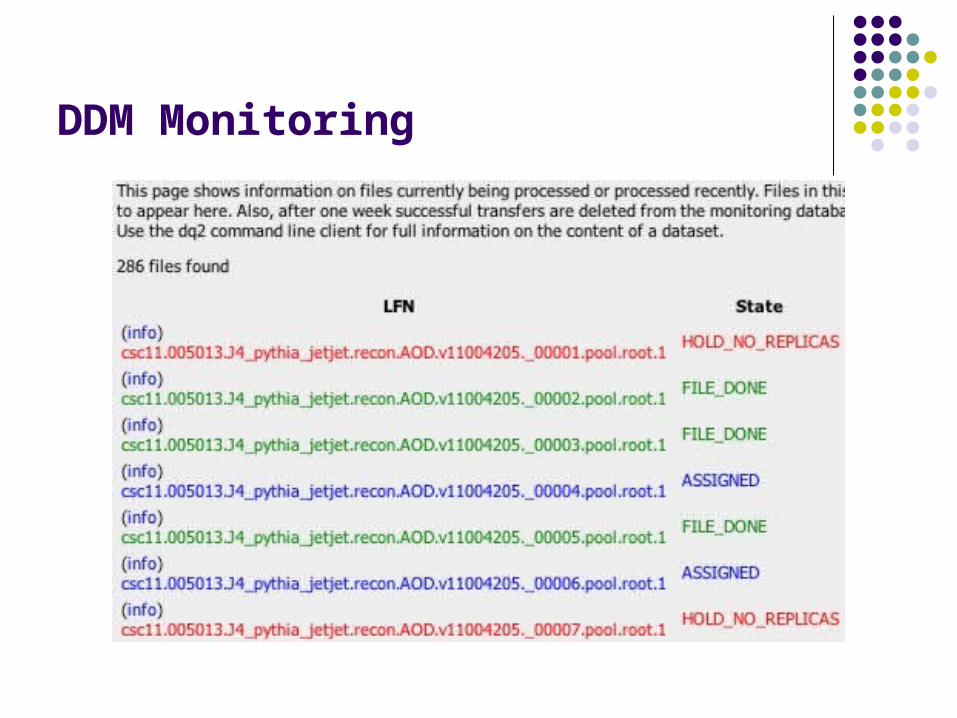
The main page shows what is going on overall, with throughput plots to each site for the last 4 hours, last day and last week
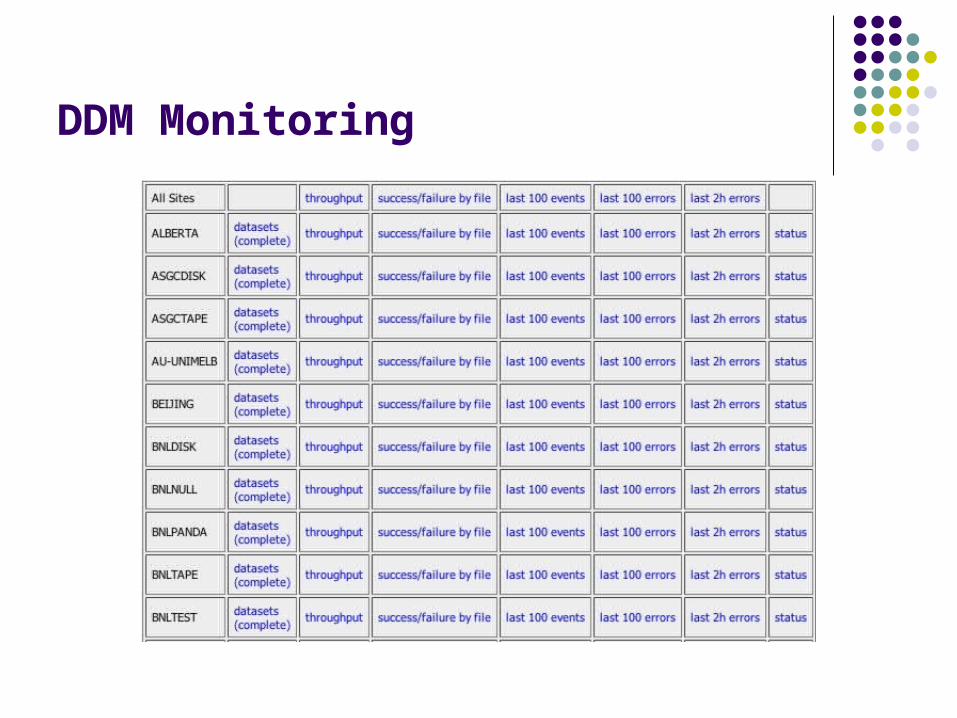
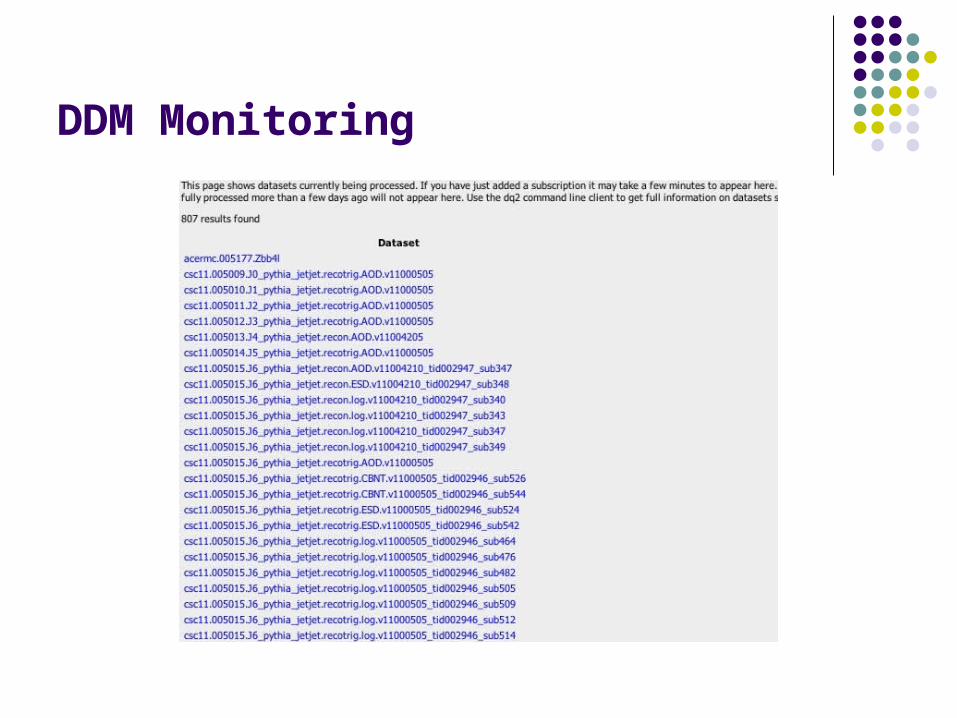
On the current transfers page for each site we can see summary of the status of the files subscribed to the site the datasets currently being processed and datasets completed
recently the recent throughput in numbers and the ratio of successful
transfers to errors the last events and errors that occurred for each dataset, the state of each file for each file, all its attributes and errors

DDM Monitoring
DDM Monitoring
DDM Monitoring
DDM Monitoring

DDM Monitoring
DDM Monitoring

DDM Monitoring

DDM Monitoring

DDM Monitoring

DDM Monitoring
There were about 220,000 accesses to the webpage in the last 2 months ~180,000 from googlebot.com… but the rest quite distributed around the world
Dataset overview with different colours Last 100/2h errors page but should be variable It’s fast
apart from when errors table gets very full - see next slide
DDM Monitoring
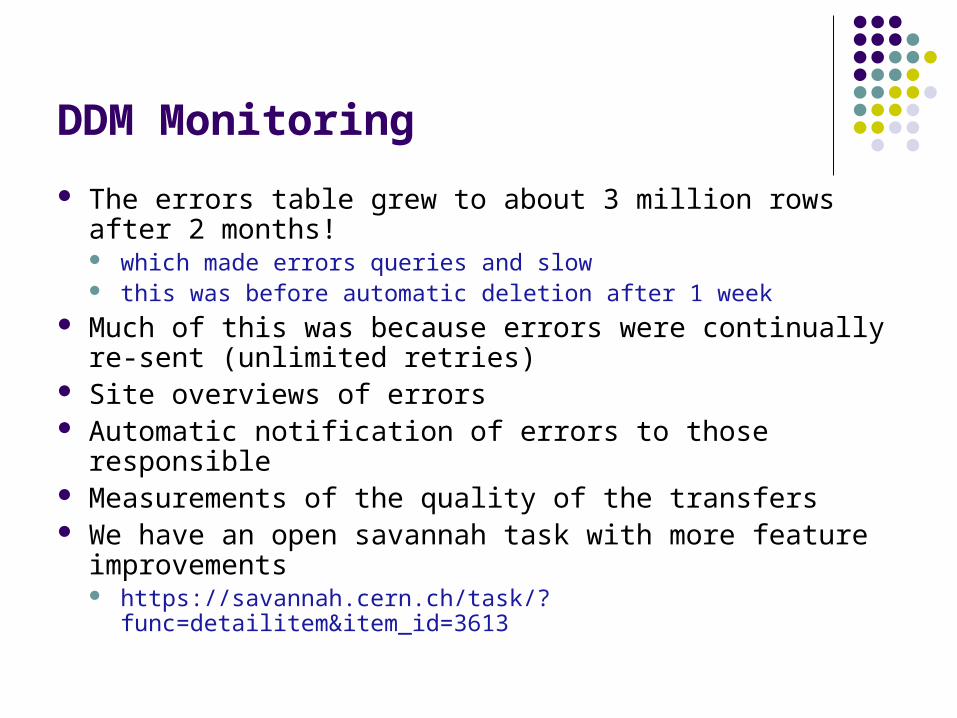
The errors table grew to about 3 million rows after 2 months! which made errors queries and slow this was before automatic deletion after 1 week
Much of this was because errors were continually re-sent (unlimited retries)
Site overviews of errors Automatic notification of errors to those responsible Measurements of the quality of the transfers We have an open savannah task with more feature
improvements https://savannah.cern.ch/task/?func=detailitem&item_id=3613

DDM Monitoring
We need to get the feeling of how a site is doing overall rather than looking at individual file error messages i.e. the equivalent of site functional tests but for DQ2 but this is difficult, e.g. how to tell the difference between no data
subscribed to a site and a problem at the site? How to synchronise monitoring with site when site DB is recreated Success/error ratio is not realistic
‘File exists’ error on file registration in LRC can be repeated 1000’s of times
The callbacks put quite a heavy load on the site services (A wider issue) the coordination of downtimes/blacklisting sites
Dashboard monitoring
Dashboard Monitoring
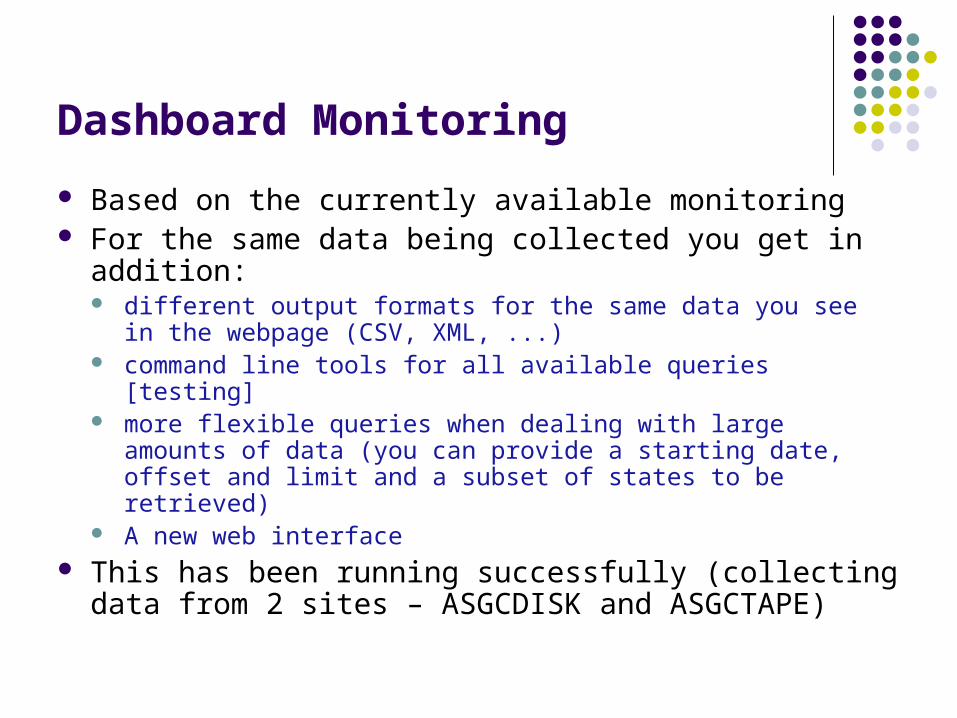
Based on the currently available monitoring For the same data being collected you get in addition:
different output formats for the same data you see in the webpage (CSV, XML, ...)
command line tools for all available queries [testing] more flexible queries when dealing with large amounts of data
(you can provide a starting date, offset and limit and a subset of states to be retrieved)
A new web interface This has been running successfully (collecting data from
2 sites – ASGCDISK and ASGCTAPE)
Dashboard Monitoring
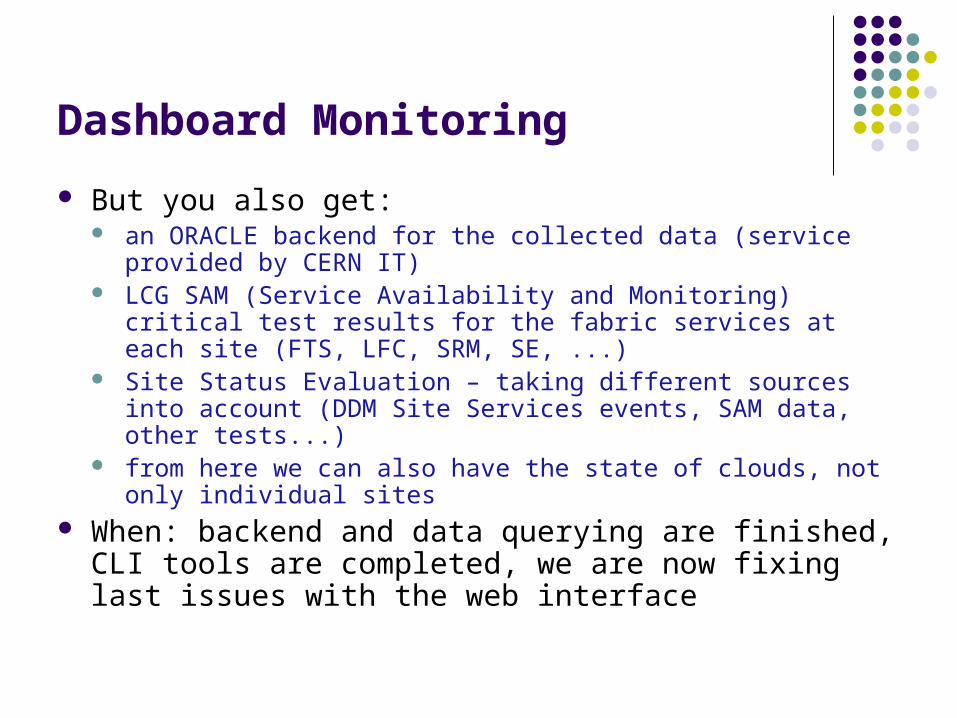
But you also get: an ORACLE backend for the collected data (service provided by
CERN IT) LCG SAM (Service Availability and Monitoring) critical test results
for the fabric services at each site (FTS, LFC, SRM, SE, ...) Site Status Evaluation – taking different sources into account
(DDM Site Services events, SAM data, other tests...) from here we can also have the state of clouds, not only
individual sites When: backend and data querying are finished, CLI tools
are completed, we are now fixing last issues with the web interface

Dashboard Monitoring - Plans
Immediate: provide historical information on site behavior/performance – like in the current monitoring, but allow also dynamic queries
Immediate: deploy the different CLI tools on AFS (will be done by the end of the week)
Monitor fabric services individually – especially interesting in the case of the FTS
Implement the missing features listed in the Savannah task (most of them are already available)
Add dataset browsing (especially dataset location) capabilities to the interface


Dashboard Command Line
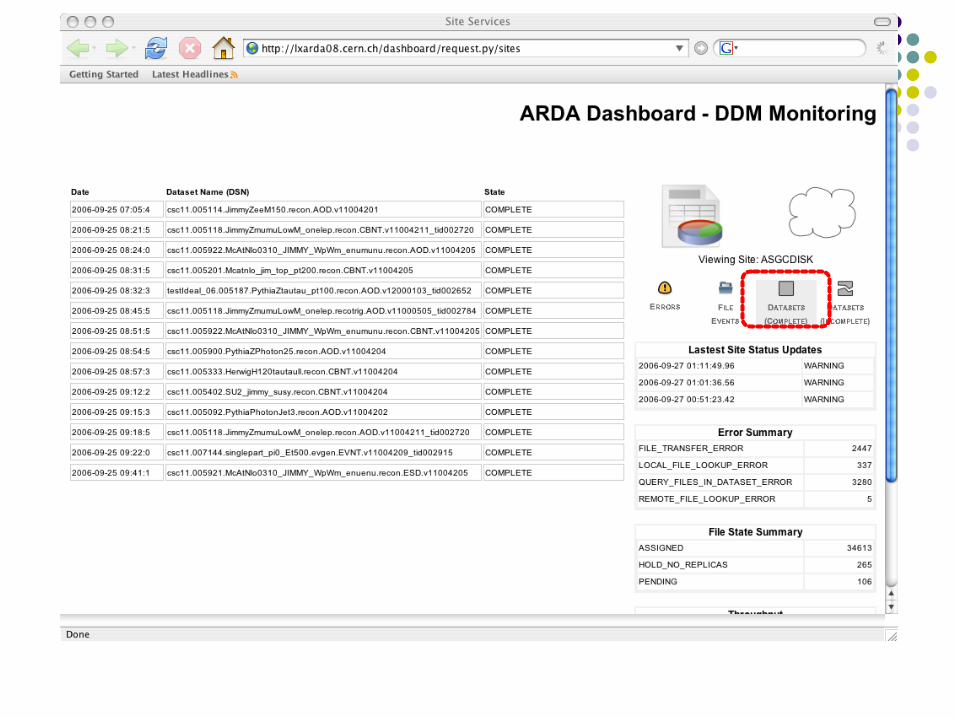
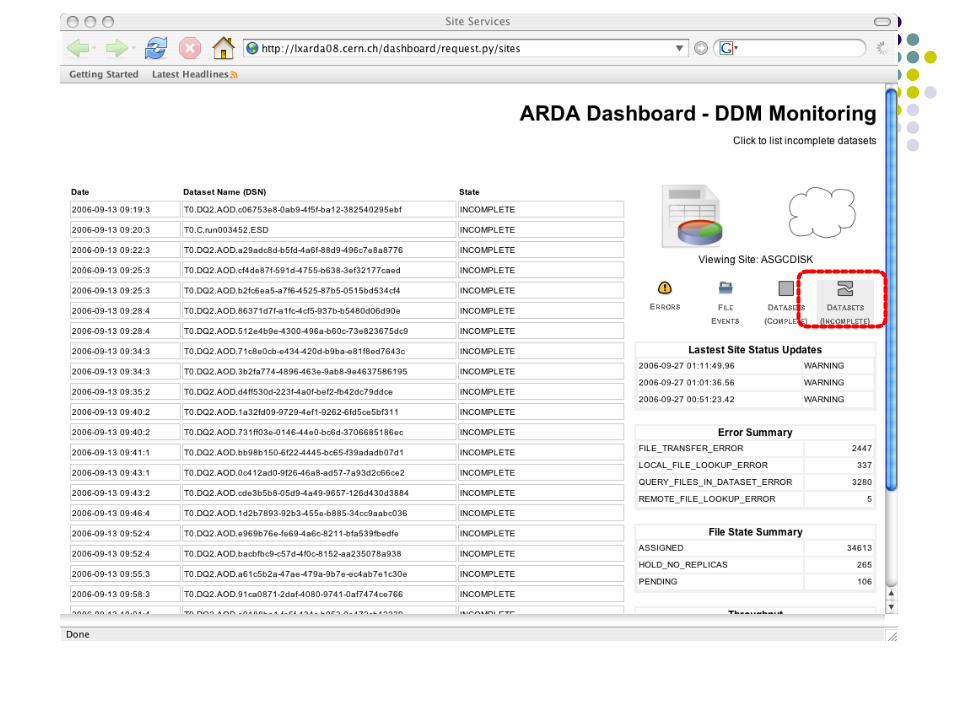
list complete datasets in ASGCDISK dashb-dataset-list -S COMPLETE ASGCDISK retrieve dataset and dataset location information
Dashboard Command Line
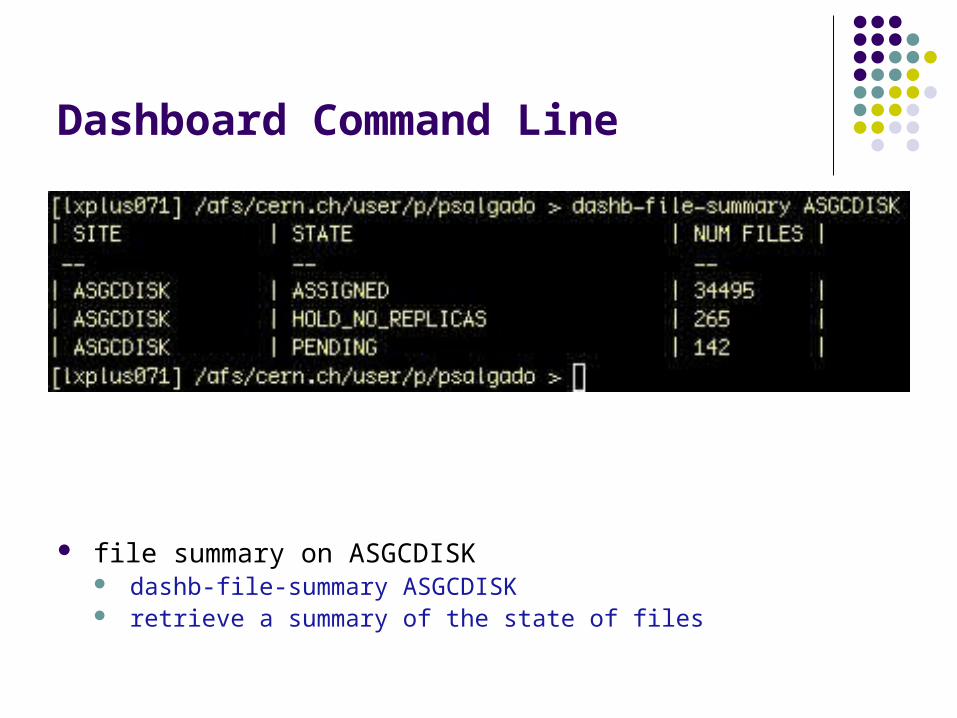
file summary on ASGCDISK dashb-file-summary ASGCDISK retrieve a summary of the state of files

Dashboard Command Line
list files with state HOLD_NO_REPLICAS in ASGCDISK dashb-file-list -L 6 -S HOLD_NO_REPLICAS ASGCDISK retrieve file and file location information

Dashboard Command Line
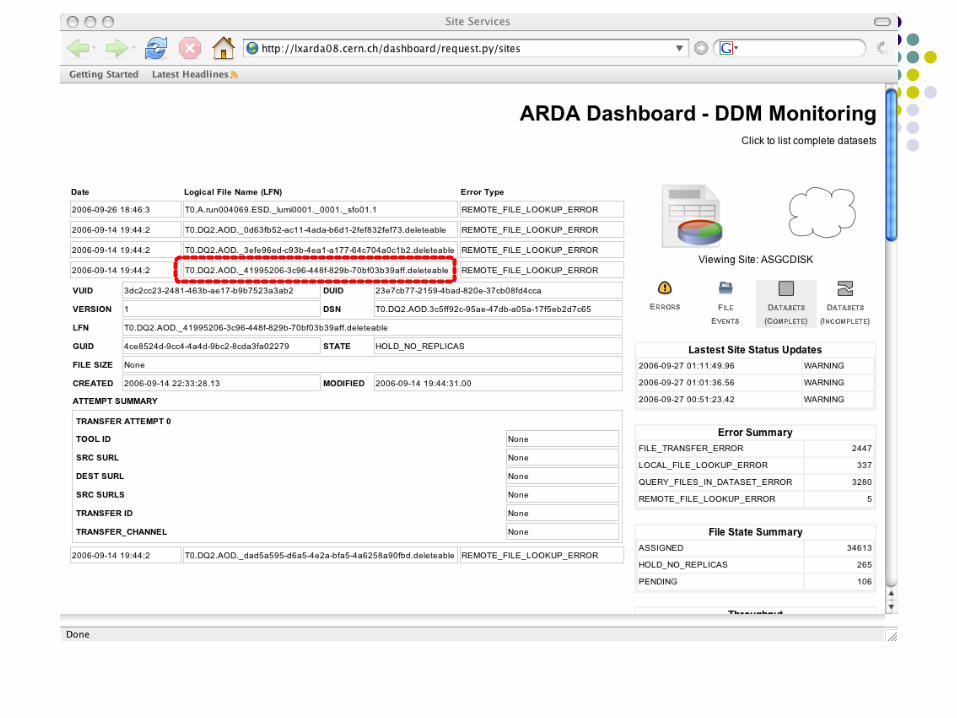
list errors in ASGCDISK dashb-site-errors ASGCDISK retrieve the errors collected
Dashboard Command Line
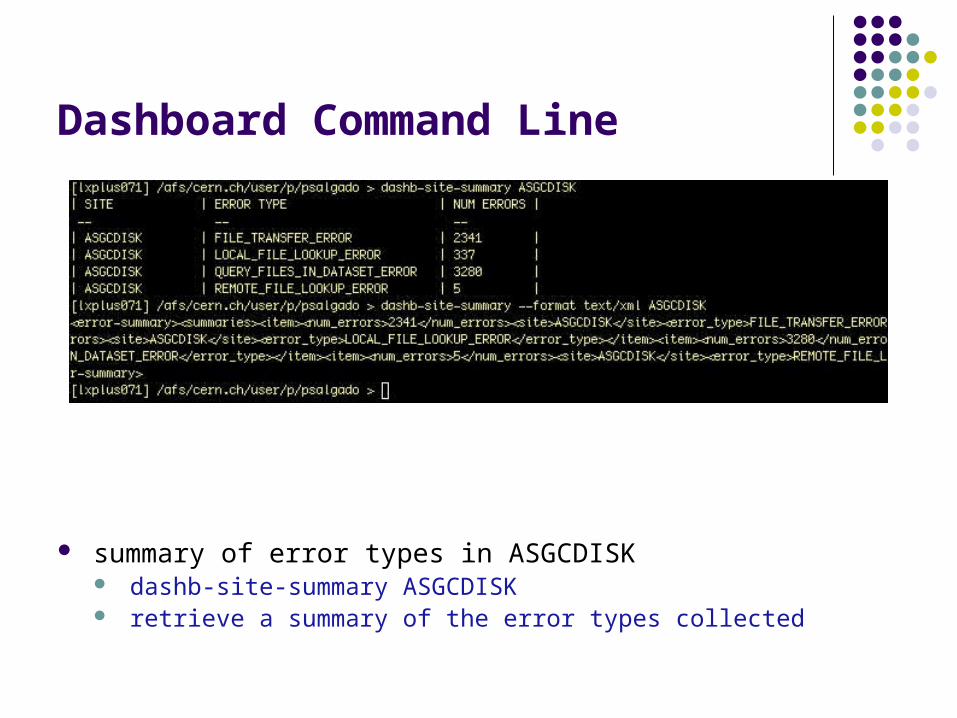
summary of error types in ASGCDISK dashb-site-summary ASGCDISK retrieve a summary of the error types collected

Dashboard Command Line
retrieve status of each site dashb-site-status
Dashboard Command Line
all monitoring information on a command line tool user can page results multiple output formats
text/xml, application/xhtml+xml, text/csv
filtering of results by file state, date of the last event