D.C. - ERIC · The Kuder has scales on occupations and college majors with both male and female...
24
DOCUMENT RESUME ED 110 646 CE 004 433 AUTHOR Stepp, Ermel; And Others TITLE An Investigation of Students' Scores on the Kuder Occupational Interest Survey as an Indicator of Program Outcomes; Employer-Based Career Education. Technical Report No. 40. INSTITUTION Appalachia Educational Lab., Charleston, V. Va. SPONS AGENCY National Inst. of Education (DREW), Washington, D.C. REPORT NO TR-40 PUB DATE Sep 73 CONTRACT NE-C-00-4-0008 NOTE 24p..; For related documents, see CE 004 429-432 and CE 004 434-438 EDRS PRICE MF-$0.76 HC-$1.58 Plus Postage DESCRIPTORS *Career Education; Demonstration Programs; Educational Interest; Educational Programs; Evaluation; Individualized Programs; *Interest Tests; Personal Interests; Pilot Projects; Secondary Education; Secondary School Students; Sex Differences; Standardized Tests; Student Characteristics; *Student Interests; Tables (Data); Testing; *Test Results; Vocational Interests; *Work Experience Programs IDENTIFIERS Appalachia Educational Laboratory; EBCE; Employer Based Career Education; KOIS; *Kuder Occupational Interest Survey ABSTRACT The report investigates the pattern of interests among the 44 students at the Appalachia Educational Laboratory's Employer-Based Career Education (AEL/EBCE) program during the fall, winter, and spring of the 1972-73 program year as measured by the Kuder Occupational Interest Survey (KOIS). Group One students (those matriculating in September 1972) took the test on all three occasions; Group Two students (those matriculating in January 1973) took it on only the latter two occasions. Thirteen significant correlations were found, indicating that the number of significant occupational and college major interests of the first group of male students (17 students) was rather stable. These correlations show that students with higher numbers of interests retained higher numbers of interests. The number of occupational interests of the second group of"females (13 students) was stable. Verification scores were stable, except for the second group of 10 male students. No significant differences were found in the number of significant interests in occupations or college majors for males or females in either the first or second groups between any two occasions. An appendix provides lists of scales on the KOIS arranged according to female norms, male norms, and specific college major interests. (Author/JR) ti
Transcript of D.C. - ERIC · The Kuder has scales on occupations and college majors with both male and female...

DOCUMENT RESUME
ED 110 646 CE 004 433
AUTHOR Stepp, Ermel; And OthersTITLE An Investigation of Students' Scores on the Kuder
Occupational Interest Survey as an Indicator ofProgram Outcomes; Employer-Based Career Education.Technical Report No. 40.
INSTITUTION Appalachia Educational Lab., Charleston, V. Va.SPONS AGENCY National Inst. of Education (DREW), Washington,
D.C.REPORT NO TR-40PUB DATE Sep 73CONTRACT NE-C-00-4-0008NOTE 24p..; For related documents, see CE 004 429-432 and
CE 004 434-438
EDRS PRICE MF-$0.76 HC-$1.58 Plus PostageDESCRIPTORS *Career Education; Demonstration Programs;
Educational Interest; Educational Programs;Evaluation; Individualized Programs; *Interest Tests;Personal Interests; Pilot Projects; SecondaryEducation; Secondary School Students; SexDifferences; Standardized Tests; StudentCharacteristics; *Student Interests; Tables (Data);Testing; *Test Results; Vocational Interests; *WorkExperience Programs
IDENTIFIERS Appalachia Educational Laboratory; EBCE; EmployerBased Career Education; KOIS; *Kuder OccupationalInterest Survey
ABSTRACTThe report investigates the pattern of interests
among the 44 students at the Appalachia Educational Laboratory'sEmployer-Based Career Education (AEL/EBCE) program during the fall,winter, and spring of the 1972-73 program year as measured by theKuder Occupational Interest Survey (KOIS). Group One students (thosematriculating in September 1972) took the test on all threeoccasions; Group Two students (those matriculating in January 1973)took it on only the latter two occasions. Thirteen significantcorrelations were found, indicating that the number of significantoccupational and college major interests of the first group of malestudents (17 students) was rather stable. These correlations showthat students with higher numbers of interests retained highernumbers of interests. The number of occupational interests of thesecond group of"females (13 students) was stable. Verification scoreswere stable, except for the second group of 10 male students. Nosignificant differences were found in the number of significantinterests in occupations or college majors for males or females ineither the first or second groups between any two occasions. Anappendix provides lists of scales on the KOIS arranged according tofemale norms, male norms, and specific college major interests.(Author/JR)
ti

'7,74M7:97'"Irre;.7,-,^4c.h.
4 5
.
5'
4mr1. " Zr `r,girr44",
S.
3417,
gz-
:'":+", ;
:".s. " .."1.1.01;.% 144t0111, 44*4'
4,5
'5,
1C' ...11,,'AvirrA.///a1111:1",k47'
,4,4
. -.:1,,,s4 ",1
gst,
j'z?'
.46,` 4 41;4*-0104,6P SAIW,ititatft.' .


Employer-Based Career Education
An Investigation of Students' Scoreson the Kuder Occupational Interest.Survey as an Indicator ofProgram Outcomes
Dr. Ermel Stepp
Dr. James H. Sanders
Dr. Charles L. Bertram
TECHNICAL REPORT NO. 40
RESEARCH AND EVALUATION DIVISIONAPPALACHIA EDUCATIONAL LABORATORY, INC.
CHARLESTON, WEST VIRGINIA 25325

Preface
This report is one of a series completed as part of the evaluation of the
Employer-Based Career Education (EBCE) program during the 1972-73 academic year.
The focus of this report is an investigation of the pattern of student inter-
ests at different times during the program year. Do students' expressed
career interests change in number as they explore several careers in which
they were originally interested? The evaluators found few significant changes
in the number of interests.
The report was written and the data were analyzed by Dr. Ermel Stepp,
Evaluation Specialist with the Appalachia Educational Laboratory, Inc. The
EBCE evaluation was conducted and supervised by Dr. James H. Sanders, Evalua-
tion Specialist with the Laboratory, and under the general direction of Dr.
Charles L. Bertram, Director of Research and Evaluation for the Laboratory.
Critical reviews of early drafts of the report were provided by Mr.
Charles G. Merger, Associate Educational Development Specialist for the EBCE
program, in order to obtain technical advice and insure that interpretations
of outcomes were compatible with observed student behavior.
5

Preface
Table of Contents
ii
Introduction 1
Design 1
Treatment Groups 1
Instrumentation 1
Analysis 2
Results 2
Male Performance 3
Female Performance 5
Occupational Interests 5
College Major Interests 7
Verification Scores and Intercorrelations 8
Summary and Conclusions 11
Appendix13
List of Tables
Table No.Page
1 Means and Standard Deviations of the Number of
Occupational Interests, Male Students (Male Norms) 3
2 Means and Standard Deviations of the Number of
College Major Interests, Male Students (Male Norms) 4
3 Intercorrelations and t-Tests of Differences in Means
on Occupational Interests (Male Nome) and College
Majors (Male Norms) for Male Students 4
4 Means and Standard Deviations of the Number of
Occupational Interests, Female Students (Female Norms) . 5
5 Means and Standard Deviations of Numb, _ of Occupational
Interests, Female Students (Male Norms) 6
6 Intercorrelations and t -Tests Differences in Means
on Occupational Scales for Female Students 6

7Majors, Female Students (Female Norms) 7
8 Means and Standard Deviations of the Number of College
Majors, Female Students (Male Norms) 7
List of Tables (Continued)
Means and Standard Deviations of the Number of College
iv
9 Intercorrelations and t-Tests of Differences in Means
on College Major Scales for Female Students 8
10 Means and Standard Deviations for Verification Scoreson All Occasions for Male and Female Students 9
11 Intercorrelations and t-Tests of Differences in Means
of Verification Scores 10
7

Introduction
Under contract with the National Institute of Education, the Appalachia
Educational Laboratory, Inc. (AEL) is developing an alternative program to
traditional options available to the contemporary high school student. The
alternative program under development integrates experiences with employers
with information processing to achieve a potentially effective learning
system for some students.
This Employer-Based Career Education (EBCE) program may have an effect
on the interests of the students. This study is on the interests of EBCE
students in the EBCE program which was conducted by AEL with the cooperation
of the Kanawha County Schools in Charleston, West Virginia, during the
academic year 1972-1973. The principal hypothetical issue raised was: the
EBCE experience would not change the numbers of significant interests of the
students.
Design
A basic pre-post design was used in a naturalistic situation without a
control group and at a naive, exploratory level.
Treatment Groups
The treatment groups were two self-selecting classes of EBCE students.
The first class, identified as Group I in this report, was composed of 17
males and 4 females, and they completed a full year from fall through spring.
The second group, identified as Group II, was constituted by 10 boys and 13
girls, and they completed only the second semester.
Instrumentation
The Kuder Occupational Interest Survey was chosen and administered to
the two groups. Three occasions of administration were in the fall (F),

winter (W), and spring (S). Group I responded to the Kuder on each occasior,
and Group II responded to the Kuder only on the winter and spring occasions.
The occasions were the beginning and ending of semesters.
The Kuder has scales on occupations and college majors with both male
and female norms (Appendix). Thirty-seven occupational scales and 19 college
majors are included with female norms. Seventy-seven occupational scales
and 29 college majors are included with male norms. The computerized print-
out of Cleman's lambda correlation scores for each student on a given occupa-
tion or college major represents the resemblance of the subject's pattern of
interest with a criterion group for such occupation or college major.1
Print-
outs were given for girls on male norms, but not for boys on female norms.
Significant interests are designated as those occupations and college majors
for which the Cleman's lambda correlation was within .07 of the highest
correlation on that particular scale.
Analysis
Multiple t-tests were made to determine the difference in means between
occasions for boys and girls separately within the sane group on the number
of significantly similar occupations or college majors and, also, on the
verification scores. This constitutes an a priori comparison of repeated
measures on a single group.2
Results
The results of the analysis are reported subsequently for male and
female performances.
1G. Frederick Kuder. Kuder Occupational Interest Survey (DD) General
Manual. (Chicago: Science Research Associates, 1971), p. 21.
2Henry E. Garrett and R. S. Woodworth. Statistics in Psychology and
Education. (New York: Longmans, Green and Co., 1958), pp. 226-228.

3
Male Performance
The significant number of males' interests on occupational scales and
college majors are represented in Tables 1 and 2, respectively, which gives
means and standard deviations. Differences in the means on occupational
interests and college majors are analyzed in Table 3. The t-tests for the
males in the first group show no significant differences in means. An
increase in mean occupational interests is evident. Significant correlations
in tha number of expressed interests occurred in the first group on occupa-
tions and college majors. This represents stable size of interest set, not
interests themselves.
Table 1
Means and Standard Deviations of the Number of OccupationalInterests, Male Students (Male Norms)
Group Occasion Mean Standard Deviations
I
II
F 9.3529 6.0092
W 12.3529 8.7038
S 12.6470 0.1163
W 15.6000 8.8566
S 18.0000 9.9699
10

4
Table 2
Means and Standard Deviations of the Number of College Major Interests,Male Students (Male Norms)
Grou. Occasion Mean Standard Deviations
I
II
F 5.7058 4.3218
W 6.1176 4.5617
S 5.8823 3.9835
W 7.0000 3.4058
S 7.0000 2.6076
Table 3
Intercorrelations and t-Tests of Differences in Mearson Occupational Interests (Male Norms) and College
Majors (Male Norms) for Male Students
Group Scale Occasions
I Occupational (M) F-W .5666* 1.3640
F-S .2606 1.4374
W-S .8227** .1326
II W-S -.2910 .5319
I College Majors (M) F-W .8401** .3546
F-S .8077** .1601
W-S .9071** .2158
II W-S .0675 .0000
*p<.05
**p<.01

5
Female Performance
The number of interests of the EBCE females were analyzed in a similar
fashion for occupations and college majors.
Occupational Interests. Means and standard deviations of the number of
interests for EBCE females on occupational scales with female norms and male
norms are given in Tables 4 and 5. Differences in means on occupational
interests are given in Table 6. A t-test of the means for the fall and
spring occasions shows no significant differences. However, the second grcup
had a significant correlition of numbers of significant interests on the first
and second occasions for occupations. Therefore, the same students in Group
II tended to have a greater number of interests when they entered and when
they completed the EBCE program.
Table 4
Means and Standard Deviations of the Number of Occupational Interests,Female Students (Female Norms)
Group Occasion Mean Standard Deviations
. I F 10.5000 4.3874
W 11.7500 4.7631
S 8.2500 4.3229
TI W 11.6153 5.9165
S 9.9230 4.59ta
12

6
Table 5
Means and Standard Deviations of Number of Occupational Interests,Female Students (Male Norms)
Group Occasion Mean Standard Deviations
I F 4.5000 1.5000
W 4.0000 2.1213
S 6.5000 3.9051
II W 6.6923 4.0073
S 7.4615 2.8986
Table 6
Intercorrelations and t-Tests Differences in Meanson Occupational Scales for Female Students
Grcup Scale Occasions
I Occupational (F) F-W .6280 .4657
F-S .4415 .8276
W-S -.3733 .9994
II W-S .8018* 1.0412
I Occupational (M) F-W .5499 .4476
F-S .2987 1.0079
W-S .9355 .2886
II W-S .3102 .6072
*p<.01
13

7
College Major Interests. The number of interests of EBCE females in
college majors are represented by the means and standard deviations on female
and male norms in Tables 7 and 8, respectively. Differences in means of
interests in college majors for EBCE females are given in Table 9. The
females showed no significant difference- in interests.
Table 7
Means and Standard Deviations of the Number of College Majors,Female Students (Female Norms)
Group Occasion Mean Standard Deviations
I
II
F 5.5000 3.2015
W 7.0000 4.3011
S 6.7500 3.2691
W 5.8461 2.8781
S 6.9230 3.0999
Table 8
Means and Standard Deviations of the Number of College Majors,Female Students (Male Norms)
Group
I
Occasion Mean Standard Deviations
F
S
II W
S
4.0000
5.0000
2.2500
2.5384
2.9230
2.1213
3.0000
2.2776
1.2779
2.2347
.11=1. 14

Table 9
Intercorrelations and t-Tests of Differences in Meanson College Major Scales for Female Students
8
Group Scale Occasions
I College Majors (F) F-W .7443 .6975
F-S .6090 .6551
W-S .6400 .1112
II W-S .0331 .9256
I College Majors(M) F-W .9114 .7207
F-S .6726 1.2686
W-S .3713 1.6113
II W-S .1761 .5604
Verification Scores and Intercorrelations
The means and standard deviations of the verification scores, which are
derived measures of the sincerity and reliability of subjects' responses, for
males and females on each occasion are presented in Table 10. No significant
differences in verification means were noted. However, correlations of
verification scores were significant between all occasions except for the
second group of male students (see Table 11).

77,e470,:
9
Table 10
Means and Standard Deviations for Verification Scoreson All Occasions for Male and Female Students
Group Occasions Mean Standard Deviations
Male
I F 50.9411 3.947i
W 50.3529 4.1151
S 51.0588 2.9199
II W 50.9000 2.3000
S 51.3000 4.0012
Female
I F 49.5000 2.6925
W 50.2500 3.5707
S 49.5000 3.9051
II W 49.6154 3.2942
S 50.7692 3.1660

.
10
Table 11
Intercorrelations and t-Tests of Differencesin Means of Verification Scores
Group Occasions
Male Students
I F-W .6385** .5153F-S .8077** .1177
W-S .7913** .12l5II W-S .1553 .2837
Female Students
I F-W .8580** .1458F-S .9034** .0000W-S .9860** .3973
II W-S .5815* 1.0810
*p<.05**p<.01
17
11
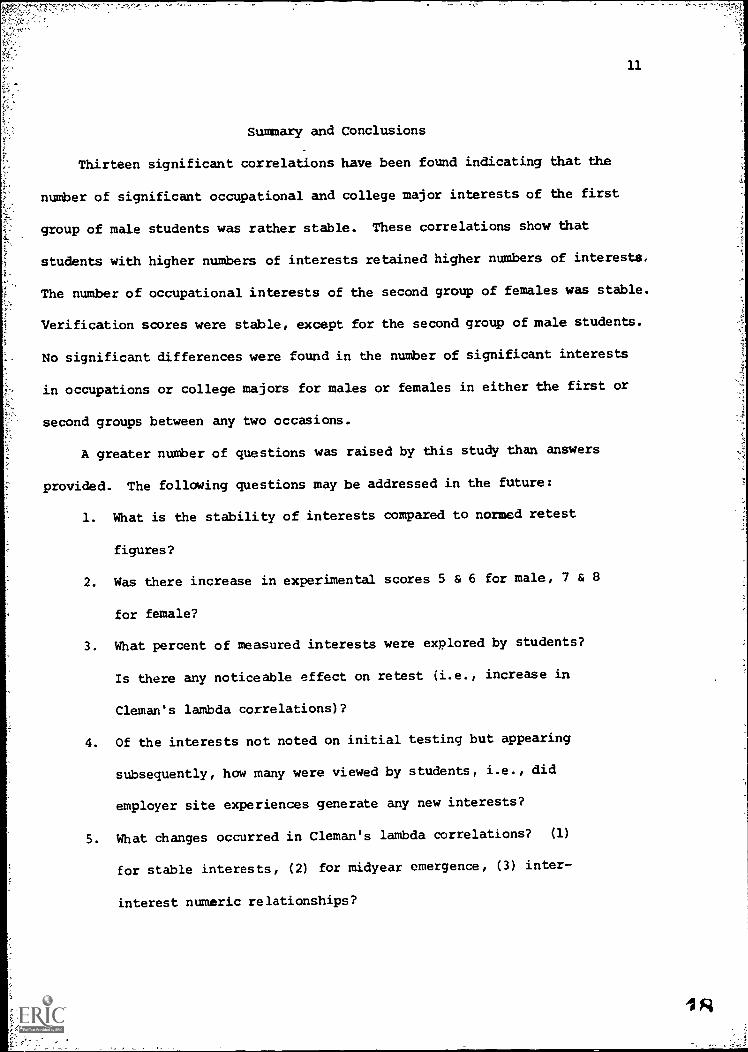
Summary and Conclusions
Thirteen significant correlations have been found indicating that the
number of significant occupational and college major interests of the first
group of male students was rather stable. These correlations show that
students with higher numbers of interests retained higher numbers of interests.
The number of occupational interests of the second group of females was stable.
Verification scores were stable, except for the second group of male students.
No significant differences were found in the number of significant interests
in occupations or college majors for males or females in either the first or
second groups between any two occasions.
A greater number of questions was raised by this study than answers
provided. The following questions may be addressed in the future:
1. What is the stability of interests compared to nonmed retest
figures?
2. Was there increase in experimental scores 5 & 6 for male, 7 & 8
for female?
3. What percent of measured interests were explored by students?
Is there any noticeable effect on retest (i.e., increase in
Cleman's lambda correlations)?
4. Of the interests not noted on initial testing but appearing
subsequently, how many were viewed by students, i.e., did
employer site experiences generate any new interests?
5. What changes occurred in Cleman's lambda correlations? (1)
for stable interests, (2) for midyear emergence, (3) inter-
interest numeric relationships?

12
6. What relationships exist between numbers of interests on the
various scales and other measures, e.g., achievement?1
1William W. Cooley and Paul R. Lohnes. Multivariate Data Analysis. (New
York: John Wiley and Sons, Inc., 1971), pp. 205-216.
19
Appendix
List of Scales on the Kuder Interest Survey According to Female Norms,Male Norms, and Specific College Major Interests
20

14
Scales of the Kuder Interest Survey
OCCUPATIONAL SCALESFEMALE NORMS
COLLEGE MAJORSCALES, FEMALE
Accountant Nurse Art & ArtEducation
Bank Clerk Nutritionist BiologicalSciences
Beautician OccupationalTherapist
Business Educationand Commerce
Bookkeeper Office Clerk Drama
BookstoreManager
PhysicalTherapist
ElementaryEducation
Computer
_Programmer
PrimarySchool Teacher
English
Counselor, HighSchool
Psychologist ForeignLan9uages
Dean of Women Psychologist,Clinical
General SocialSciences
Dental Assistant Religious EducationDirector
HealthProfessions
Department Store ^~Saleswoman
Science Teacher,High School
History
Dietitian,Administrative
Secretary Home EconomicsEducation
Dietitian,Public School
SocialCaseworker
Mathematics
Florist Social Worker,Group
Music and MusicEducation
Home DemonstrationAgent
Social Worker,Medical
Nursing
Home EconomicsTeacher, College
Social Worker,Psychiatric
PhysicalEducation
InteriorDecorator
Social Worker,School
Political
ScienceLawyer Stenographer Psychology
Librarian X-Ray Technician Sociology
Math Teacher,High School
Teaching Sister,Catholic

If
15
Scales of the Kuder Interest Survey
OCCUPATIONAL SCALESMALE NORMS
Optometrist PsychologyProfessor
Accountant,`Certified Public
Engineer,Electrical
Osteopath Radio StationManagerReal EstateA.ent
.Architect Engineer, Heating/Air Conditionin
Painter,
House`Automobile:Mechanic
Engineer,Industrial
Pediatrician Sales Engineering,Heating', Air ConditioningScience Teacher,High School
AutomobileSalesman
Engineer,Mechanical
PersonnelManager
.Banker Engineer, Miningand Metal
PharmaceuticalSalesman
SchoolSuperintendent
_Bookkeeper Farmer Pharmacist SocialCaseworker
Bookstore:Manager
Florist Photographer Social Worker,Group
Bricklayer Forester PhysicalTherapist
Social Worker,Psychiatric
`Building'Contractor
InsuranceAgent
Physician Statistician
Buyer InteriorDecorator
Plumber Supervisor/Foreman,Industrial
Carpenter Journalist PlumbingContractor
TravelAgent
Chemist Lawyer Podiatrist TruckDriver
Clothier,Retail
Librarian Policeman TelevisionRepairman
.Computer'Programmer
Machinist Postal Clerk UniversityPastor
,Counselor, HighSchool
Mathematician Printer Veterinarian
County Agricul-tural Agent
Math Teacher,High School
Psychiatrist Welder
Dentist Meteorologist Psychologist,Clinical
X-Ray Technician
Electrician Minis'-er Psychologist,
CounselingYMCA Secretary
Engineer,Civil
Nurseryman Psychologist,Industrial
22
16
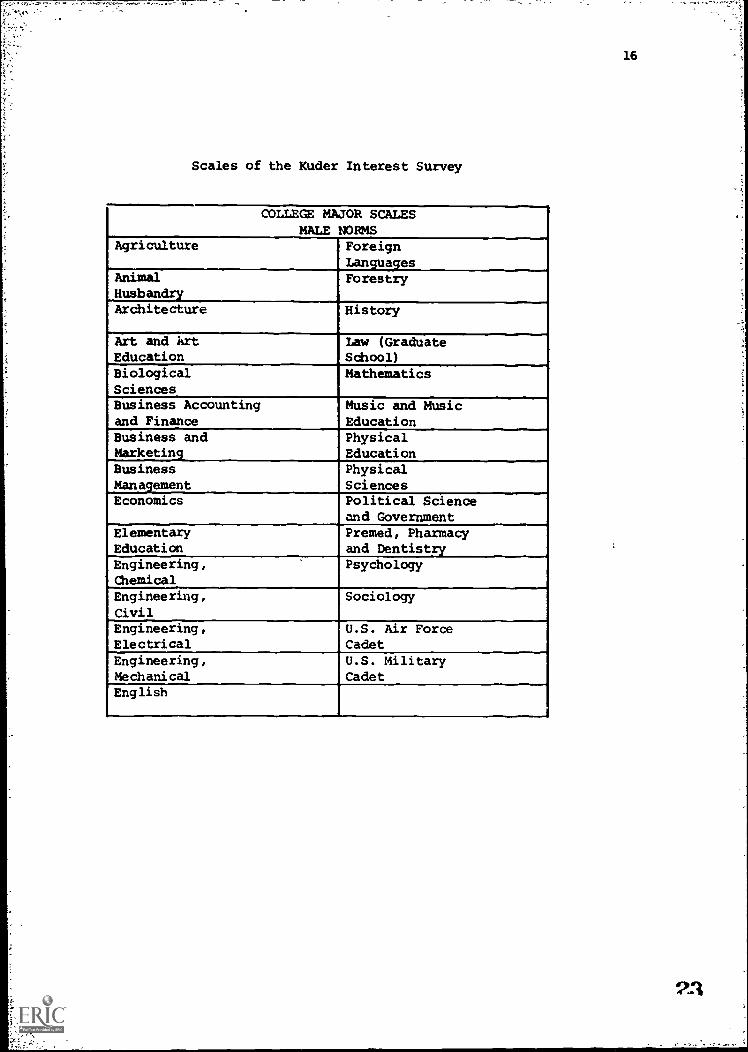
Scales of the Kuder Interest Survey
COLLEGE MAJOR SCALESMALE NORMS
Agriculture ForeignLan a es
AnimalHusbandry
Forestry
Architecture History
Art and }art
EducationLaw (GraduateSchool)
BiologicalSciences
Mathematics
Business Accountingand Finance
Music and MusicEducation
Business and
_MarketingPhysicalEducation
BusinessManagement
PhysicalSciences
Economics Political Scienceand Government
ElementaryEducation
Premed, Pharmacyand Dentistry
Engineering,Chemical
Psychology
Engineering,Civil
Sociology
Engineering,Electrical
U.S. Air ForceCadet
Engineering,Mechanical
U.S. MilitaryCadet
English
23

f
This report is published by the Appalachia Educational Laboratory,Inc., pursuant to Contract No. NE-C-00-4-0008 with the National Instituteof Education, U.S. Department of Health, Education, and Welfare. Theopinions expressed in this publication do not necessarily reflect theposition of policy of the National Institute of Education and no officialendorsement by that office should be inferred. The Appalachia Educa-tional Laboratory, Inc., is an equal opportunity employer.
24