DC Arc Flash Analysis - cmte.ieee.org · • Characteristics of an Arc • DC Short Circuit...
32
©1996-2017 ETAP/Operation Technology, Inc. – Workshop Notes: Arc Flash Analysis Slide 1 DC Arc Flash Analysis By, Raghu Veeraraghavan, ETAP Innovation Automation Collaboration
Transcript of DC Arc Flash Analysis - cmte.ieee.org · • Characteristics of an Arc • DC Short Circuit...

©1996-2017 ETAP/Operation Technology, Inc. – Workshop Notes: Arc Flash Analysis Slide 1
DC Arc Flash Analysis By,
Raghu Veeraraghavan, ETAP
Innovation Automation
Collaboration

©1996-2017 ETAP/Operation Technology, Inc. – Workshop Notes: Arc Flash Analysis Slide 2
Agenda
• Why conduct DC Arc Flash Analysis?
• Characteristics of an Arc
• DC Short Circuit calculations
• Maximum Power Method
• Stokes and Oppenlander Method
• Paukert Method
• Box / open configurations energy equations
• Discussion Items
• Changes to NFPA 70E 2015

©1996-2017 ETAP/Operation Technology, Inc. – Workshop Notes: Arc Flash Analysis Slide 3
Why conduct DC Arc Flash Analysis?
• Several papers have surfaced regarding studies being conducted dc systems
• Many industrial applications of dc power systems
• Hazards can be found:
– Large uninterruptible power supply cabinets with battery banks
– Electrical room station battery sets
– Drive cabinets with dc buses
– Special process equipment using DC buses such as a salt cell processing

©1996-2017 ETAP/Operation Technology, Inc. – Workshop Notes: Arc Flash Analysis Slide 4
Characteristics of an Arc
• An arc consists of three regions:1) Anode region2) Cathode region3) Plasma column
• The voltage gradient across the arc plasma depends on the actual arc length; the arc may deviate from the gap width between the electrodes.

©1996-2017 ETAP/Operation Technology, Inc. – Workshop Notes: Arc Flash Analysis Slide 5
V-I Characteristic Curves
As arc current increases, arc voltage decreases.

©1996-2017 ETAP/Operation Technology, Inc. – Workshop Notes: Arc Flash Analysis Slide 6
DC Short Circuit
• Battery, Charger, and UPS Sources can be modeled as:
– Constant Current
– Voltage behind an impedance
• Thevenin Equivalent of System R is found to calculated the short circuit current.

©1996-2017 ETAP/Operation Technology, Inc. – Workshop Notes: Arc Flash Analysis Slide 7
Methodology for DC Arc Flash
• DC Arc Flash Basic Concepts

©1996-2017 ETAP/Operation Technology, Inc. – Workshop Notes: Arc Flash Analysis Slide 8
3 Methods for DC Arc Flash
• Maximum Power Method
• Stokes and Oppenlander Method
• Paukert Method

©1996-2017 ETAP/Operation Technology, Inc. – Workshop Notes: Arc Flash Analysis Slide 9
Maximum Power Method
• Maximum Power Method was introduced in 2007 in the ESW by Daniel R. Doan.
• Based on the concept that the maximum power possible in a DC arc will occur when the arcing voltage is one-half of the system voltage.
bf
sourcearc
bfarc
I
V0.5R
I0.5I

©1996-2017 ETAP/Operation Technology, Inc. – Workshop Notes: Arc Flash Analysis Slide 10
Maximum Power Method
Energy equations for Arc in a box and Open Air
2
arcarcsysbox
2
arcarcsysopen
D
TIV0.013IE
D
TIV0.01IE

©1996-2017 ETAP/Operation Technology, Inc. – Workshop Notes: Arc Flash Analysis Slide 11
NFPA 70E 2015

©1996-2017 ETAP/Operation Technology, Inc. – Workshop Notes: Arc Flash Analysis Slide 12
Maximum Power Method
Pros: Always giving you arcing current results. Simplicity of calculations (no iterations or complex non linear equations). Most conservative of all methods.
Cons: Could be too conservative because of the arcing current is calculated higher than real life situations. (Ex.- If it falls off the instantaneous pick up, time might be longer.)
Calculations limitations: Cannot predict if an arc can be generated (can occur). This method applies to dc systems rated up to 1000 VDC.

©1996-2017 ETAP/Operation Technology, Inc. – Workshop Notes: Arc Flash Analysis Slide 13
Stokes and Oppenlander
• Performed a study of free-burning vertical and horizontal arcs between series electrodes in open air.
• Based on the extensive study, Stokes and Oppenlander created empirical equations based on test results.
• As a result, to maintain the minimum voltage of an arc, depends on current magnitude, gap width and orientation of electrodes.

©1996-2017 ETAP/Operation Technology, Inc. – Workshop Notes: Arc Flash Analysis Slide 14
Stokes and Oppenlander
Horizontal Arc in Open Air with Copper Electrodes
Continuous Lines – Measured Results
Dotted Lines – Calculated Results

©1996-2017 ETAP/Operation Technology, Inc. – Workshop Notes: Arc Flash Analysis Slide 15
Stokes and Oppenlander
Vertical Arc in Open Air with Aluminum Electrodes
Continuous Lines – Measured Results
Dotted Lines – Calculated Results

©1996-2017 ETAP/Operation Technology, Inc. – Workshop Notes: Arc Flash Analysis Slide 16
Zg = Gap between Electrodes (mm)
88.0
12.0
)534.020(
)534.020(
2.010
arc
g
arc
arcgarc
gt
I
zR
IzV
zI
Stokes and Oppenlander
Requires iterative solutions by first establishing initial guess and iteratively solve for Rs (fixed) and Rarc (changes).

©1996-2017 ETAP/Operation Technology, Inc. – Workshop Notes: Arc Flash Analysis Slide 17
Pros: If the gap, voltage and system impedance are within the limits of the equations, the model can predict if the arc is sustained. If the gap is too long, cannot find an solution (Iarc too low). FCT is more accurate. Energy is more accurate rather than over conservative.
Cons: It requires iterative solutions and not easy to solve.
Calculations limitations: If arcing current is below transition point, a solution cannot be solved.
Stokes and Oppenlander

©1996-2017 ETAP/Operation Technology, Inc. – Workshop Notes: Arc Flash Analysis Slide 18
Paukert
• Paukert compiled published arcing fault data from seven researches who conducted a wide of arc tests.
• Some were AC and some were DC with both vertical and horizontal configurations. Arcing currents ranged from 0.3A to 100kA with electrode gaps from 1 to 200mm.
• Based on the collected data, Paukert formulated arc voltage and arc resistance equations with electrode gap widths.

©1996-2017 ETAP/Operation Technology, Inc. – Workshop Notes: Arc Flash Analysis Slide 19
Paukert

©1996-2017 ETAP/Operation Technology, Inc. – Workshop Notes: Arc Flash Analysis Slide 20
Pros: Same as Stokes and Oppenlander. If the gap, voltage and system impedance are within the limits of the equations, the model can predict if the arc is sustained. Energy is more accurate rather than over conservative.
Cons: Requires iterative solutions not easy to solve. Its not applicable and should not be used for electrode gaps more than 200 mm.
Calculations limitations: Current cannot be more than 100kA .
Paukert

©1996-2017 ETAP/Operation Technology, Inc. – Workshop Notes: Arc Flash Analysis Slide 21
Deriving Energy Equations
arcarcarcarc
arcarcarcarcarc
dcdc
tRIE
RIIVP
IVPower
2
2

©1996-2017 ETAP/Operation Technology, Inc. – Workshop Notes: Arc Flash Analysis Slide 22
Energy Equations
Energy Equations for Open Air and Enclosed Configurations
221
24
da
EkE
d
EE
arc
arcs

©1996-2017 ETAP/Operation Technology, Inc. – Workshop Notes: Arc Flash Analysis Slide 23
Reflectivity Coefficients
Enclosed DC Arc Fault values a and k
Enclosure Width (mm)
Height (mm)
Depth (mm)
a (mm) k
Panelboard 305 356 191 100 0.127
LV Switchgear 508 508 508 400 0.312
MV Switchgear 1143 762 762 950 0.416

©1996-2017 ETAP/Operation Technology, Inc. – Workshop Notes: Arc Flash Analysis Slide 24
Comparison of the Stokes and Oppenlander vs. Paukert

©1996-2017 ETAP/Operation Technology, Inc. – Workshop Notes: Arc Flash Analysis Slide 25
Comparison of the Stokes and Oppenlander vs. Paukert

©1996-2017 ETAP/Operation Technology, Inc. – Workshop Notes: Arc Flash Analysis Slide 26
Comparison of the Stokes and Oppenlander vs. Paukert
Observations based on the Empirical Methods
1) Arc resistance is nonlinear2) Arc resistance decreases with increasing arc current3) Arc resistance approaches a constant value at high current magnitudes4) Arc resistance changes rapidly at low current magnitudes (<1kA).5) Paukert predicts larger arc resistances than Stokes and Oppenlander predict.6) For a given arc current, the arc resistance increase linearly with the electrode gap.

©1996-2017 ETAP/Operation Technology, Inc. – Workshop Notes: Arc Flash Analysis Slide 27
Discussion Items
• If only constant current sources are in the systems, cannot find Rarc, Iarc, Varc since R Thevenin is unknown.
• Energy reduction for multiple sources does not subtract current when source is cleared.
• Time constant or rise time of the current is ignored. It is assumed the current has reached its max value. (It is valid for electronic devices, not valid for batteries that have resistances)

©1996-2017 ETAP/Operation Technology, Inc. – Workshop Notes: Arc Flash Analysis Slide 28
Comparison of Incident Energy
Bus ID Voltage (Volts) MAX POWER PAUKERT STOKES
Electrochemical DC Bus 250 7.6 7.2 7
Substation Battery Rack 135 0.9 0.8 0.8
UPS Battery System Bus 350 1.7 1.4 1.2
©1996-2017 ETAP/Operation Technology, Inc. – Workshop Notes: Arc Flash Analysis Slide 29
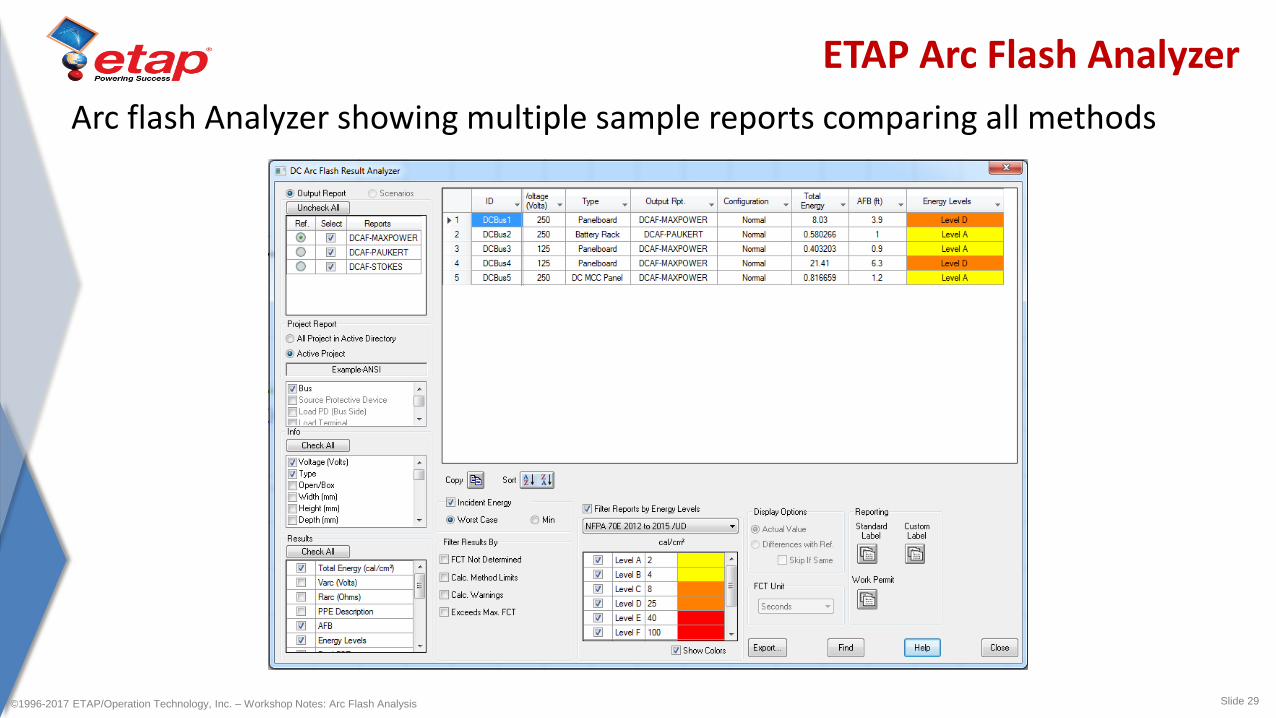
ETAP Arc Flash Analyzer
Arc flash Analyzer showing multiple sample reports comparing all methods

©1996-2017 ETAP/Operation Technology, Inc. – Workshop Notes: Arc Flash Analysis Slide 30
Updates on NFPA 70 2015
• DC Arc Flash Maximum Power Method
• Removed 125 kVA Exception (An Arc Flash Hazard Analysis may not be necessary for some three-phase systems rated less than 240 Volts
• Added DC Arc Flash Boundaries table. (Table 130.4 (C) b)
• Arc Flash Protection Boundary = Arc Flash Boundary
• Removed Prohibited Approach Boundary.

©1996-2017 ETAP/Operation Technology, Inc. – Workshop Notes: Arc Flash Analysis Slide 31
References
• NFPA 70E 2015 Standard for Electrical Safety in the Workplace
• J. Paukert, The Arc Voltage and Arc Resistance of LV Fault Arcs", Proceedings of the 7th International Symposium on Switching Arc Phenomena, 1993, pp. 49-51.
• A.D. Stokes and W.T. Oppenlander, "Electric Arcs in Open Air", J. of Physics D: Applied Physics, 1991, pp. 26-35.
• R. Ammerman, T. Gammon, P.K. Sen, J. Nelson, “Dc Arc Models and Incident Energy Calculations”, Paper No. PCIC-2009-07.
• Daniel R Doan, Arc Flash Calculations for Exposures to DC Systems, IEEE Transactions on Industry Applications, Vol. 46, NO.6, November/December 2010
• Albert Marroquin, Arc Flash Product Manager, ETAP

©1996-2017 ETAP/Operation Technology, Inc. – Workshop Notes: Arc Flash Analysis Slide 32
Thank you!