DBI313. MetricOLTPDWLog Read/Write mixMostly reads, smaller # of rows at a time Scan intensive,...
39
Performance Tuning Microsoft SQL Server in Windows Azure Virtual Machines Emil Velinov Senior Program Manager Microsoft Corporation DBI313
-
Upload
colin-alexander -
Category
Documents
-
view
213 -
download
0
Transcript of DBI313. MetricOLTPDWLog Read/Write mixMostly reads, smaller # of rows at a time Scan intensive,...

Performance Tuning Microsoft SQL Server in Windows Azure Virtual Machines
Emil VelinovSenior Program ManagerMicrosoft Corporation
DBI313

Whitepaper
Performance Guidance for SQL Server in Windows Azure Virtual Machines
Published: June 2013
Download it here:http://go.microsoft.com/fwlink/?LinkId=306266

Performance tuning
SQL Performance considerations
Platform characteristics
Best practices
Monitoring
Troubleshooting
• Analyzing performance impact• Is it a problem with my SQL application?
or• Is it a problem with how I configured the Azure IaaS platform for my
usage

SQL performance considerations
• KPIs• Throughput• Response time (aka latency)
• Dimensions
• Know what is the Platform impact vs Application impact
Metric OLTP DW Log
Read/Write mix Mostly reads, smaller # of rows at a time
Scan intensive, large portions of data at a time, bulk loading
Mostly writes, requires low latency
IO size and pattern Between 8 and 64K, mostly random
1 64KB read per 8 512KB reads, Mostly sequential MB/s a critical metric
Highly sequential
# users high low n/a

Windows Azure IaaS Characteristics

Windows Azure
Cluster1
Cluster2
Clustern
…
Datacenter network…Datacenter 1 Datacenter n
Region 1 Region 2…

Windows Azure Infrastructure Services
CLOUD SERVICE
VM1 VM2 VM3
VM4 VM5 VM…
InstancesRoles
IMPLICIT CLOUD SERVICE
VM
CLOUD SERVICE
VM VM
Cloud Service is a management, configuration, security, networking and service model boundaryStateless Roles : Web/Worker Role – requires 2 or more instancesPersistent Roles : Virtual Machine can work with single instance
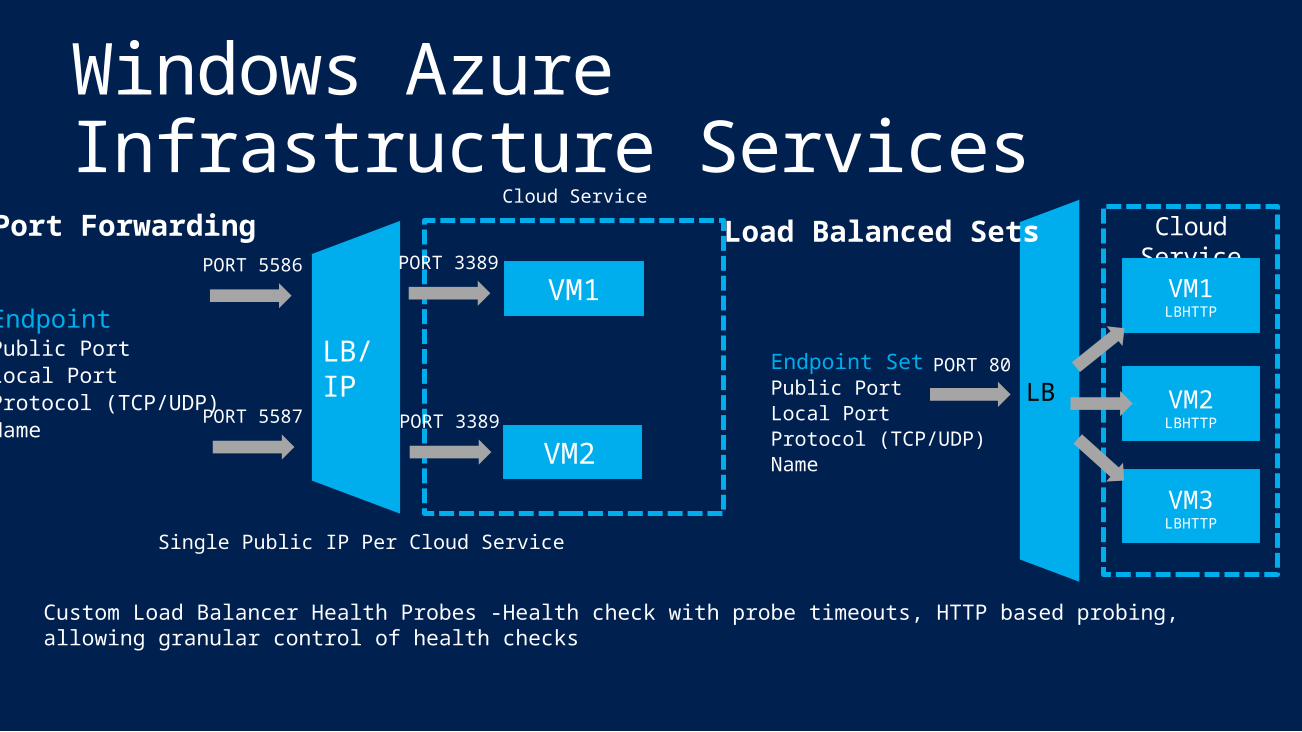
Windows Azure Infrastructure Services
Single Public IP Per Cloud Service
EndpointPublic PortLocal PortProtocol (TCP/UDP)Name
Port Forwarding
Endpoint SetPublic PortLocal PortProtocol (TCP/UDP)Name
Load Balanced Sets
Custom Load Balancer Health Probes -Health check with probe timeouts, HTTP based probing, allowing granular control of health checks

Inside the Windows Azure VM
Virtual Machine
C:\OS Disk
E:\, F:\, etc.Data Disks
D:\Temporary
Disk Dynamic
VHD
RAM Cache
Local Disk Cache
Blobs
Blob
Striped Volume

VM Disk Types & Configurations• OS disk (persistent)• Dynamic disk optimized for OS access patterns (e.g. boot up)
• Data disk (persistent)• A VHD you can attach to a VM to store app data• Up to 1TB in size• Up to 16 disks for XL VMs
• Temporary local disk (non-persistent)• Used for transient/temporary data storage & OS page files• Hosted in attached disks on physical host• Cleaned up in case of a VM failure or recycling• Physical disks shared across other VMs on same physical machine• Not recommended for user or system database files

Windows Azure VM Size & Bandwidth
Virtual Machine Size
CPU Cores Memory
Disk Space for Virtual Machines
Allocated Bandwidth (Mbps)
Maximum data disks (1 TB each)
Maximum IOPS (500 maximum per disk)
ExtraSmall Shared 768 MB 20 GB 5 1 1x500
Small 1 1.75 GB 70 GB 100 2 2x500
Medium 2 3.5 GB 135 GB 200 4 4x500
Large 4 7 GB 285 GB 400 8 8x500
ExtraLarge 8 14 GB 605 GB 800 16 16x500
A6 4 28 GB 285 GB 1,000 8 8x500
A7 8 56 GB 605 GB 2,000 16 16x500Source: http://msdn.microsoft.com/en-us/library/windowsazure/dn197896.aspx

VM Disk IO subsystem• Disks implemented as a
shared multi-tenant service
• Built-in triple redundancy, optional geo-redundancy
• Performance more variable than on-prem• Host machines, storage services, network
bandwidth shared between subscribers• Perf can depend on where and when VM is
provisioned• Subject to maintenance operations• Granular control & configurability vs. cost,
simplicity, out of box redundancy
Stream Layer
Partition Layer
Front-ends
LB
Stream Layer
Partition Layer
Front-ends
LB
Geo-replication
Storage Service Locations

VM Disk Caching• Caches VM data
inside physical host machine
• Can reduce disk I/O latency by reducing # transactions against Windows Azure Storage
• 2-tier cache• Recently accessed data stored in host RAM cache - space shared by all VMs on
machine • Less recently accessed data stored on local hard disks of physical machine
• Reserved cache space for VM “OS Disk” and “Data Disks” based on the VM size

Default VM cache settings
Disk type Read Only Read Write None (disabled)OS disk Supported Default mode Not supportedData disk Supported (up to 4) Supported (up to 4) Default modeTemporary disk Implemented using local attached storage
Read Only: All requests cached for future reads. All writes persisted directly to Windows Azure Storage
Read Write: Reads cached for future access. Non-write-through writes persisted to local cache first. For SQL Server, writes are persisted to WA storage because it uses Write-through- Lowest disk latency for light workloads
None (disabled): Bypasses cache. All disk transfers persisted to Windows Azure Storage- Highest I/O rate for I/O intensive workloads- Also consider TX cost

Best Practices

VM Disk cache setting recommendationsOS Disk• “Read Write” (default) reduces read
latency for IO intensive workloads with smaller DBs (<=10GB) • Working set can fit in disk cache or memory,
reducing blob storage IO
Data disks • Recommended for DBs > 10GB
• Cache setting depends on the IO pattern and workload intensity
• Use default of “None” (disable) for Higher rate of random IOs (e.g. OLTP) & higher throughput• Bypasses physical host local disks, maximizing IO
rate
• Consider enabling read cache for latency sensitive read heavy workloads

Single Data Disk Configuration• Recommended for <1TB storage • Acceptable performance• Minimal complexity, simpler recovery
Random I/O (8KB Pages)
Sequential I/O (64KB Extents)
Sequential I/O (256KB Blocks)
Reads
Writes Reads Writes Reads Writes
IOPS 500 500 500 300 300 300
Bandwidth
4 MB/s
4 MB/s 30 MB/s 20 MB/s 70 MB/s 70 MB/s
Sample SQL IO Measurement tests for single disk:
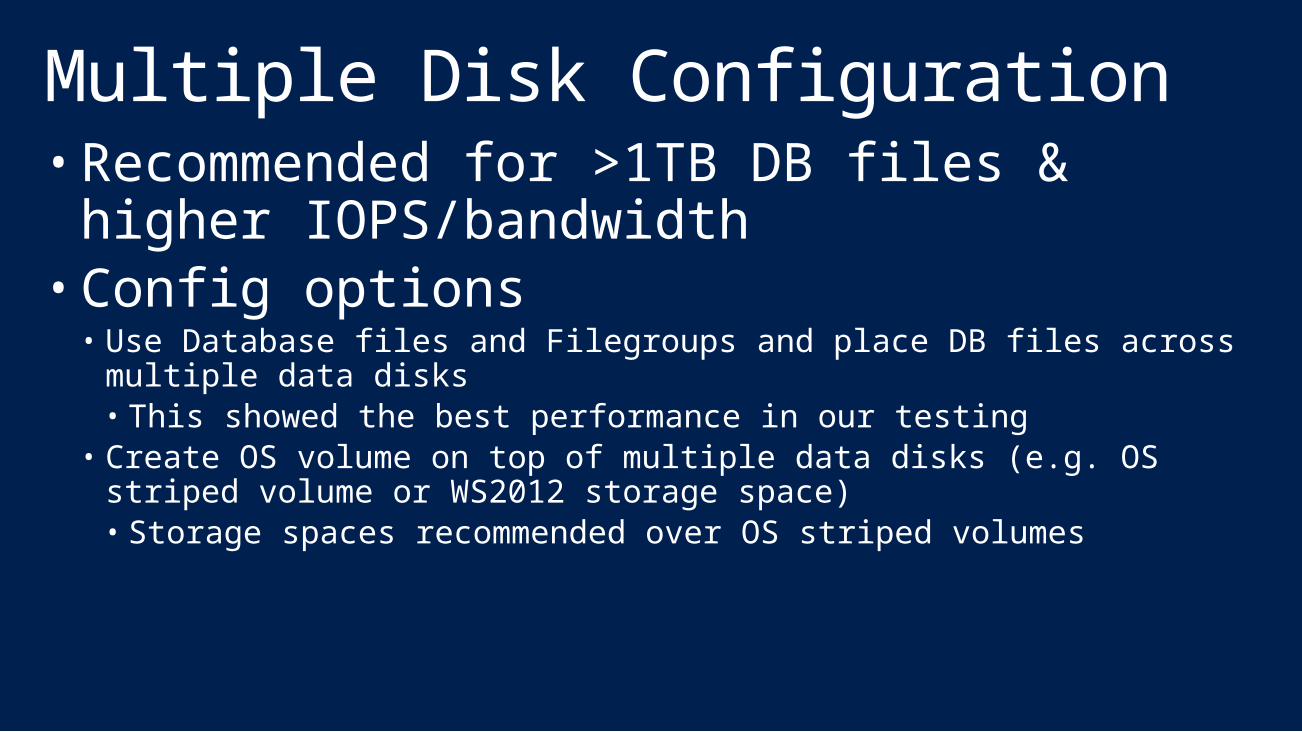
Multiple Disk Configuration• Recommended for >1TB DB files & higher
IOPS/bandwidth• Config options• Use Database files and Filegroups and place DB files across multiple
data disks• This showed the best performance in our testing
• Create OS volume on top of multiple data disks (e.g. OS striped volume or WS2012 storage space)• Storage spaces recommended over OS striped volumes

Aggregated Measurement Samples4 disks Random I/O (8KB
Pages)Sequential I/O (64KB Extents)
Sequential I/O (256KB Blocks)
Reads Writes Reads Writes Reads Writes
IOPS 2000 2000 2000 1300 700 1100
Bandwidth
20 MB/s 20 MB/s 120 MB/s 80 MB/s 170 MB/s 270 MB/s
16 disks Random I/O (8KB Pages)
Sequential I/O (64KB Extents)
Sequential I/O (256KB Blocks)
Reads Writes Reads Writes Reads Writes
IOPS 8000 8000 2500 5000 700 2400
Bandwidth
60 MB/s 60 MB/s 150 MB/s 300 MB/s 170 MB/s 600 MB/s
8 disks Random I/O (8KB Pages)
Sequential I/O (64KB Extents)
Sequential I/O (256KB Blocks)
Reads Writes Reads Writes Reads Writes
IOPS 4000 4000 2500 2600 700 2200
Bandwidth
30 MB/s 30 MB/s 150 MB/s 160 MB/s 170 MB/s 550 MB/s

Demo- 1 versus 3 data disks

What else affects VM data disk performance?• Disk warm-up• NTFS Allocation Unit Size• Single vs. multiple storage accounts with a
single VM• Spread the load across multiple VHDs first (within a single storage
account)• A storage account has a limit of 20K txns/sec• If insufficient IOPS => spread the load across multiple storage
accounts• Keep in mind that BLOBs that make up the stripe set could be out of
sync

Reduce IO with Instant File Initialization• Not default in Azure VM images• Reduces IO for• Creating a DB• Restoring a DB• Adding files to a DB • Extending file size• Autogrow, etc.
• Add SQL service account to Perform Volume Maintenance Tasks security policy
• Restart SQL Server
Create 100 GB database Restore 100 GB database0
10
20
30
40
50
60
Impact of Instant File Initialization
Without Instant File Initialization With Instant File InitializationTim
e (
min
ute
s)
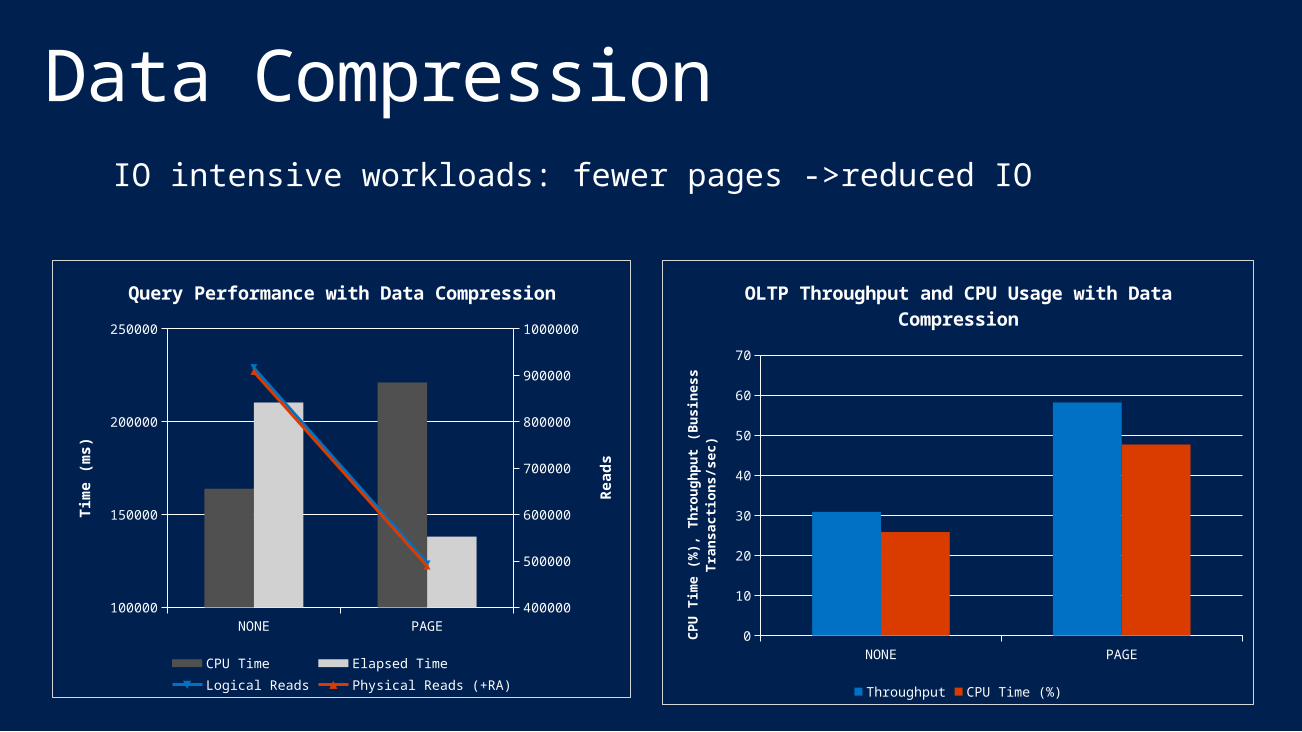
Data Compression
NONE PAGE100000
150000
200000
250000
400000
500000
600000
700000
800000
900000
1000000
Query Performance with Data Com-pression
CPU Time Elapsed TimeLogical Reads Physical Reads (+RA)
Tim
e (
ms)
Read
s
NONE PAGE0
10
20
30
40
50
60
70
OLTP Throughput and CPU Usage with Data Compression
Throughput CPU Time (%)C
PU
Tim
e (
%),
Thro
ughput
(Busin
ess T
rans-
acti
ons/s
ec)
IO intensive workloads: fewer pages ->reduced IO

Should tempdb go on D: drive?• Short answer: No• Why?• Predictable performance:
OS or data disk can provide same or better performance but D: drive can be more variable, being a physical disk sharing IO with other VMs on the host. Size and performance also depend on VM size
• Configuration overhead: SQL Server has to recreate tempDB in D: if VM goes down – SQL Server service account requires Admin privileges. If stored in a separate folder this needs to be created at startup.
• tempDB can be critical to application performance• Follow tempDB IO best practices

Demo- TempDB Contention and Resolution

Monitoring

Windows Azure Storage Analytics Metrics
• Tracks aggregated storage usage for Blobs, Tables and Queues• Capacity – e.g. #containers, total #blobs• Requests - #requests, total ingress/egress, average E2E latency and server latency, total #
failures by category, etc.• Access via storage account namespace
https://<accountname>.table.core.windows.net/Tables("$MetricsTransactionsBlob")• VM read and write to their VHDs using GetBlob and PutPage commands respectively
• Enable in portal or using Set Blob Service Properties (REST API)• Set retention policy
• See Windows Azure Storage Metrics: Using Metrics to Track Storage Usage

Performance Charts on the WA Portal• VM Dashboard• Monitor tab for storage
account• Enabled under the “Configure”
tab • VMs read and write to their
VHDs using GetBlob and PutPage API methods
Other platform monitoring tools• Tools to determine network latency impact • Psping (free download at technet )• Traceroute (tracert)

SQL tools• Tools to determine IO capacity of VM
configurations• SQLIO – Disk Subsystem Benchmark Tool• Performance metrics• DMVs

Key SQL Perf countersTypical SQL KPIs
• Max val for \Process(SQLServ)\% Processor Time
• Avg val for \Process(SQLServ)\% Processor Time
• Max val for \Processor(_Total)\% Processor Time
• Avg val for \Processor(_Total)\% Processor Time
• Max val for \SQLServer:SQL Statistics\Batch Requests/sec
• Avg val for \SQLServer:SQL Statistics\Batch Requests/sec
Typical Web App KPIs
• Max val for \ASP.NET Applications (_Total_)\Reqests/sec
• Avg val for \ASP.NET Applications (_Total_)\Reqests/sec
• Avg val for \Memory\Available Mbytes
• Max val for \Processor(_Total)\% Processor Time
• Avg val for \Processor(_Total)\% Processor Time
• Avg val for \ASP.NET\Request Wait Time
• Avg val for \ASP.NET\Request Execution Time
• Avg val for \ASP.NET\Requests Queued
• Avg val for \ASP.NET\Requests Rejected
• Avg val for \ASP.NET\Requests Current
Typical User/test characteristics• Number of concurrent users • Average/Max request execution time• Number of web servers • Ramp up period, test method • Start and end time of test

Troubleshooting

Classic SQL Server Performance Factors• Plan change/choice issues• Software/hardware configuration• Locking & latching• Multi-user operations and blocking• Checkpoint & system operations

High-level Troubleshooting Steps1. Define KPIs to monitor resource utilization2. Monitor KPIs to track utilization over time3. Examine trends and patterns as workload
increases4. Monitor DMVs to understand resource
contention/waits5. Monitor spinlock and back-off events

Troubleshooting Common VM Issues
Issue KPIs To Monitor Actions to Consider
CPU at or near 80% % Processor Time (_Total) SOS_SCHEDULER_YIELD waits
Increase instance sizeIdentify top consuming queries and tuneLoad balance (e.g. move DB to another
instance)
Near I/O capacity limits or IO Latency Increases
Average disk reads per secondAverage disk writes per second
Disk reads per secondDisk writes per second
io_virtual_file_statsPAGEIOLATCH waits
SQL Server: Buffer Manager\Page Life Expectancy
Check Page Life Expectancy counter, for mem pressure. Increase instance size Identify which DB and log files have I/O
bottleneckAdd more data disks and separate data files
if near IOPS limits per disk Tune queries to reduce reads and writes
Consider enabling row or page compression
Memory resource pressure
Memory: Available Bytes Memory: Pages per second
SQL Server: Buffer Manager\Page Life ExpectancyProcess: Working Set (for SQL Server)
RESOURCE_SEMAPHORE waits
Check max server memory setting for SQL Server.
Use high memory instanceIdentify SQL component (such as, CLR, high memory grants for app queries, et.), tune
appropriately.

Key takeaways• Evaluate SQL Server in Windows Azure
Infrastructure Services – SQL Server 2014 CTP1 available now!
• Read the Performance Guidance for SQL Server in Windows Azure Virtual Machines white paper and follow best practices described there• Identify optimal VM size for your workload • Optimize for reduced IO and network round trips• Plan and test for IO perf variability• Identify your KPIs to monitor• Revisit optimization decisions as workload grows

Further ReadingWhite paper: Performance Guidance for SQL Server in Windows Azure Virtual Machines
SQL IaaS Basics• SQL Server in Windows Azure Virtual Machines• SQL Server HA/DR on IaaS
Windows Azure Storage• Windows Azure’s Flat Network Storage and 2012
Scalability Targets• Windows Azure Storage: A Highly Available Cloud
Storage Service with Strong Consistency• Erasure Coding in Windows Azure Storage• SQL Server Backup and Restore with Windows Azu
re Blob Storage Service
SQL Server Performance• Analyzing I/O Characteristics and Sizing Storage S
ystems for SQL Server Database Applications• Compilation of SQL Server TempDB IO Best P
ractices• Windows Azure SQL Database and SQL Serv
er -- Performance and Scalability Compared and Contrasted

Evaluate this session and you could win instantly!
Head to...aka.ms/te

© 2013 Microsoft Corporation. All rights reserved.Microsoft, Windows and other product names are or may be registered trademarks and/or trademarks in the U.S. and/or other countries.MICROSOFT MAKES NO WARRANTIES, EXPRESS, IMPLIED OR STATUTORY, AS TO THE INFORMATION IN THIS PRESENTATION.


![(2d) Matrices CS101 2012.1. Chakrabarti Declaration and access int imat[rows][cols]; double dmat[rows][cols]; rows*cols cells allocated of the given.](https://static.fdocuments.us/doc/165x107/56649ea25503460f94ba68ad/2d-matrices-cs101-20121-chakrabarti-declaration-and-access-int-imatrowscols.jpg)