Daylight Savings No matter what its orientation, only half the Earth gets sunlight at any given...
17
-
Upload
jordan-clement-carpenter -
Category
Documents
-
view
214 -
download
0
Transcript of Daylight Savings No matter what its orientation, only half the Earth gets sunlight at any given...
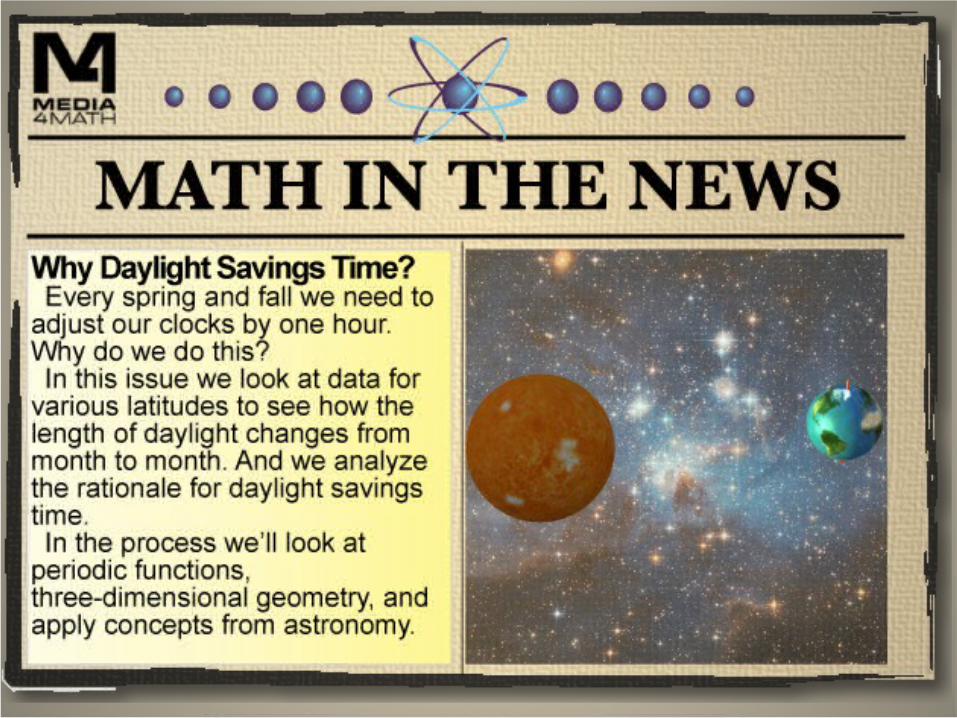
Daylight Savings
No matter what its orientation, only half the Earth gets sunlight at any given time. But the amount of sunlight, in terms of the length of the day, depends on your latitude.
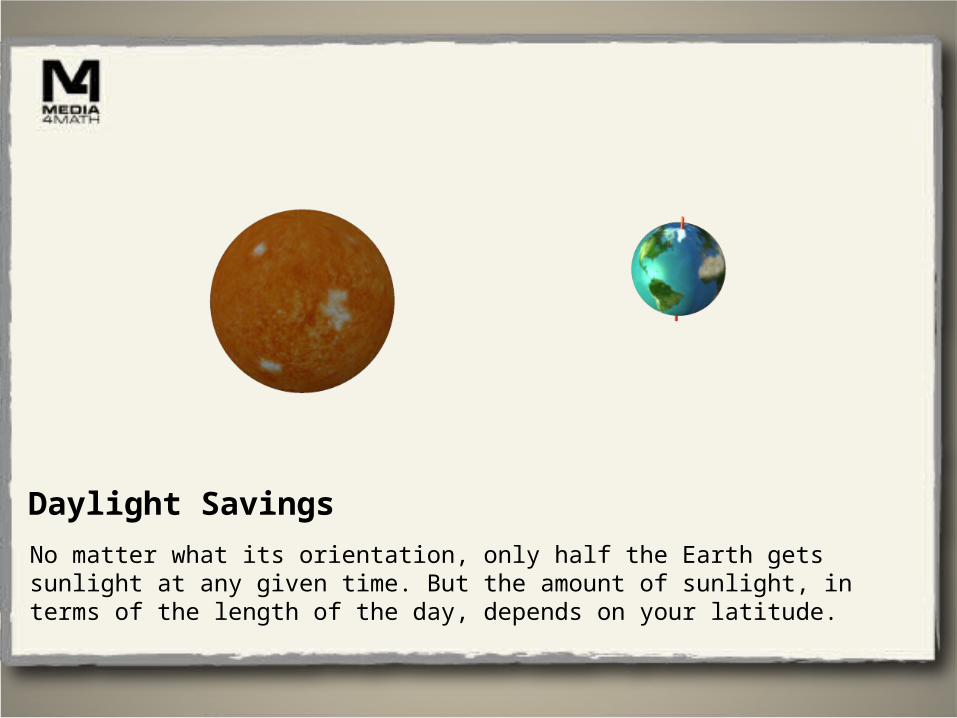
Daylight Savings
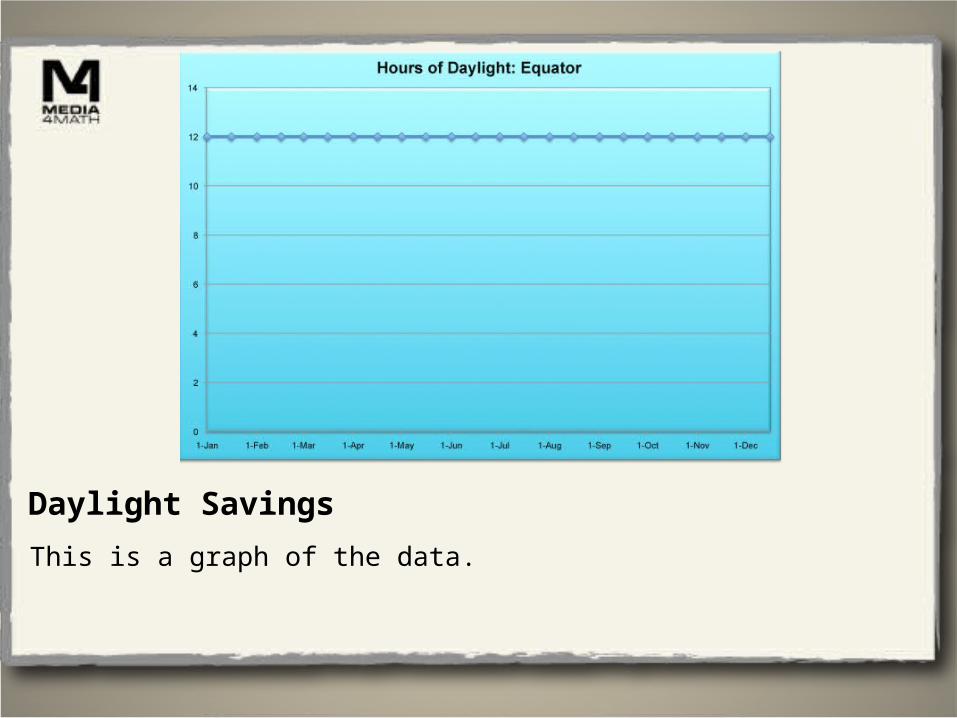
The equator, which is along the great circle relative to the sun, has a constant amount of sunlight throughout the year.

Daylight Savings
This table shows the number of hours of daylight throughout the year.
Date Number of Hours of Daylight/Day
1-Jan 1216-Jan 121-Feb 12
16-Feb 121-Mar 12
16-Mar 121-Apr 12
16-Apr 121-May 12
16-May 121-Jun 12
16-Jun 121-Jul 12
16-Jul 121-Aug 12
16-Aug 121-Sep 12
16-Sep 121-Oct 12
16-Oct 121-Nov 12
16-Nov 121-Dec 12
16-Dec 12
Daylight Savings
This is a graph of the data.

Daylight Savings
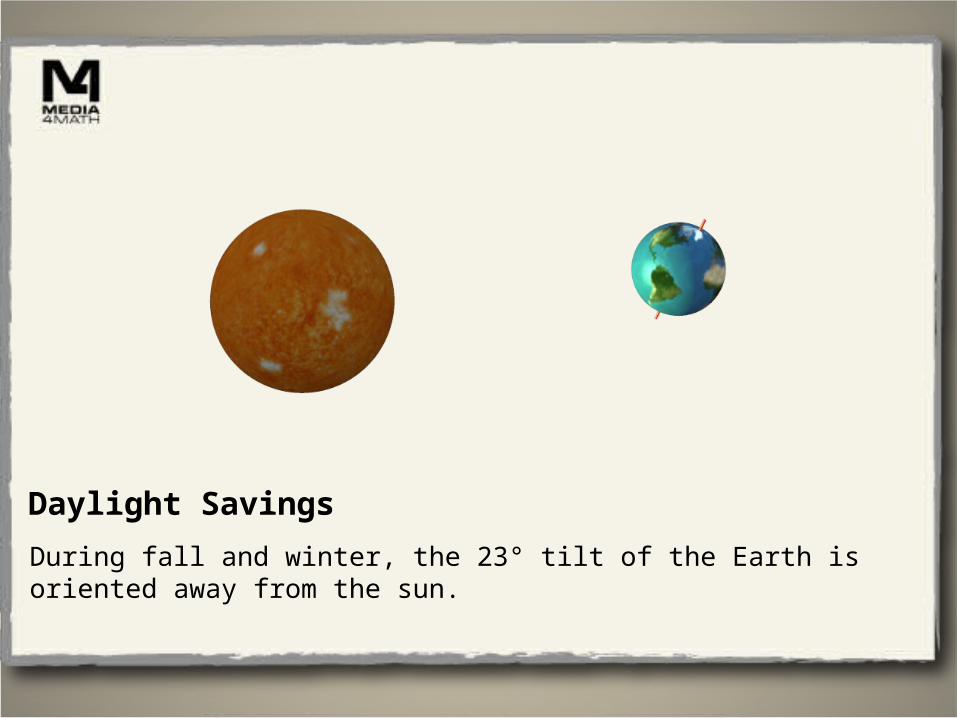
The situation is different for different latitudes. This is because the Earth’s axis is at a 23° angle relative to the plane of the ecliptic.

Daylight Savings
During spring and summer, the 23° tilt of the Earth is oriented toward the sun.
Daylight Savings
During fall and winter, the 23° tilt of the Earth is oriented away from the sun.
Daylight Savings
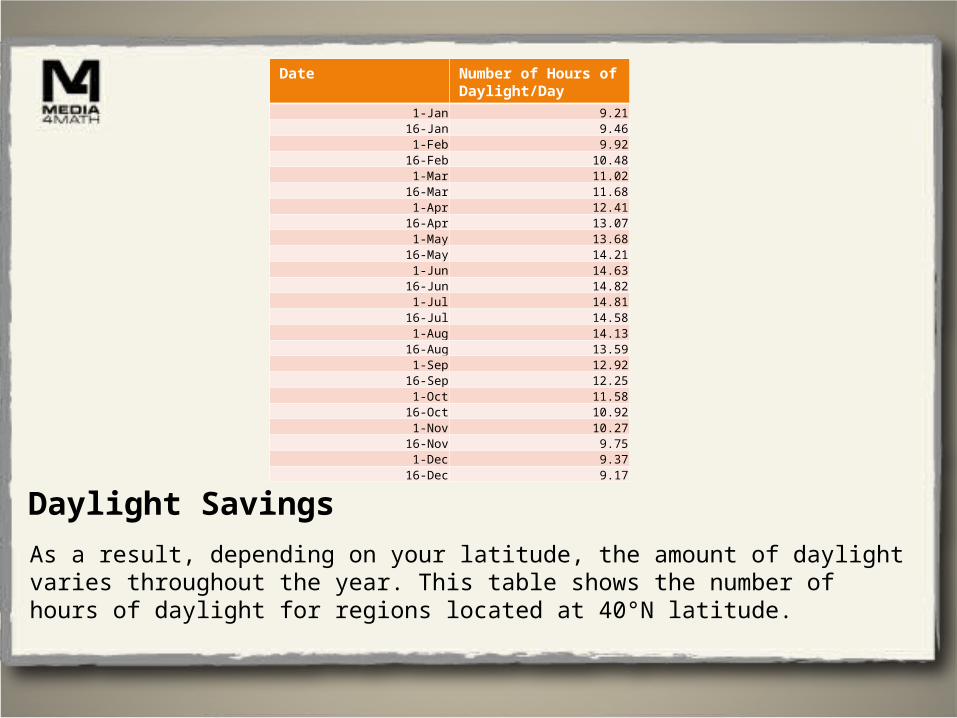
As a result, depending on your latitude, the amount of daylight varies throughout the year. This table shows the number of hours of daylight for regions located at 40°N latitude.
Date Number of Hours of Daylight/Day
1-Jan 9.2116-Jan 9.461-Feb 9.92
16-Feb 10.481-Mar 11.02
16-Mar 11.681-Apr 12.41
16-Apr 13.071-May 13.68
16-May 14.211-Jun 14.63
16-Jun 14.821-Jul 14.81
16-Jul 14.581-Aug 14.13
16-Aug 13.591-Sep 12.92
16-Sep 12.251-Oct 11.58
16-Oct 10.921-Nov 10.27
16-Nov 9.751-Dec 9.37
16-Dec 9.17

Daylight Savings
This is a graph of the data. Note that it is the graph of a periodic function. A graph of several years worth of data would also show a sine curve.

Daylight Savings
This table shows the number of hours of daylight for regions located at 60°N latitude.
Date Number of Hours of Daylight/Day
1-Jan 5.6616-Jan 6.351-Feb 7.51
16-Feb 8.781-Mar 9.96
16-Mar 11.351-Apr 12.84
16-Apr 14.221-May 15.57
16-May 16.811-Jun 17.88
16-Jun 18.431-Jul 18.38
16-Jul 17.741-Aug 16.62
16-Aug 15.361-Sep 13.91
16-Sep 12.521-Oct 11.13
16-Oct 9.741-Nov 8.31
16-Nov 7.091-Dec 6.1
16-Dec 5.56

Daylight Savings
This is a graph of the data. This is also a sine curve, but notice that it has a higher amplitude than the 40°N data.
Daylight Savings
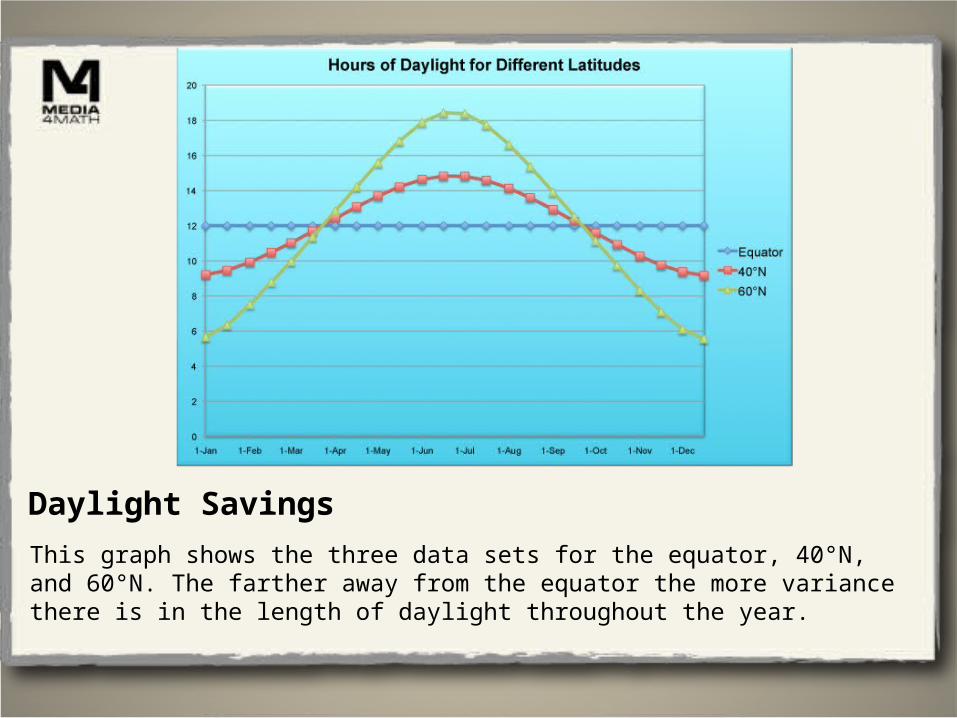
This graph shows the three data sets for the equator, 40°N, and 60°N. The farther away from the equator the more variance there is in the length of daylight throughout the year.
Daylight Savings
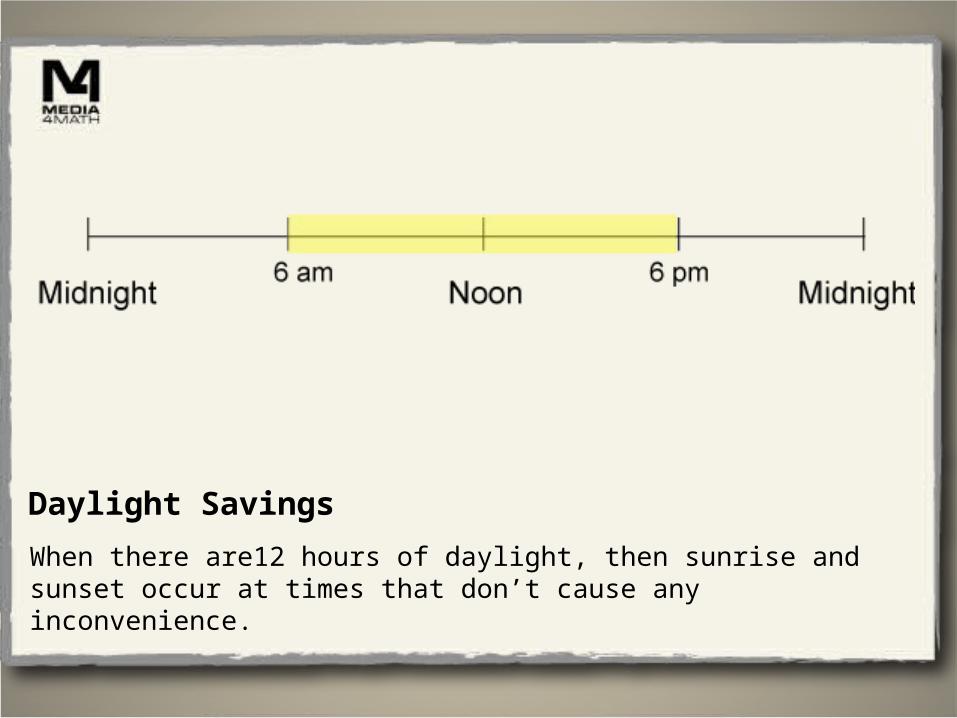
When there are12 hours of daylight, then sunrise and sunset occur at times that don’t cause any inconvenience.
Daylight Savings
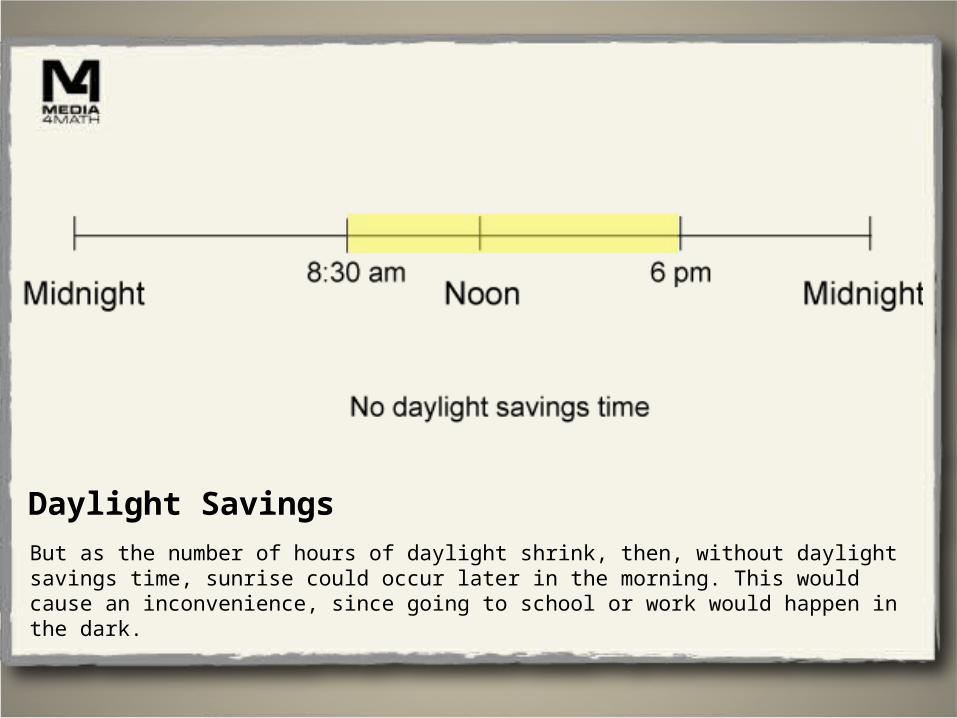
But as the number of hours of daylight shrink, then, without daylight savings time, sunrise could occur later in the morning. This would cause an inconvenience, since going to school or work would happen in the dark.
Daylight Savings
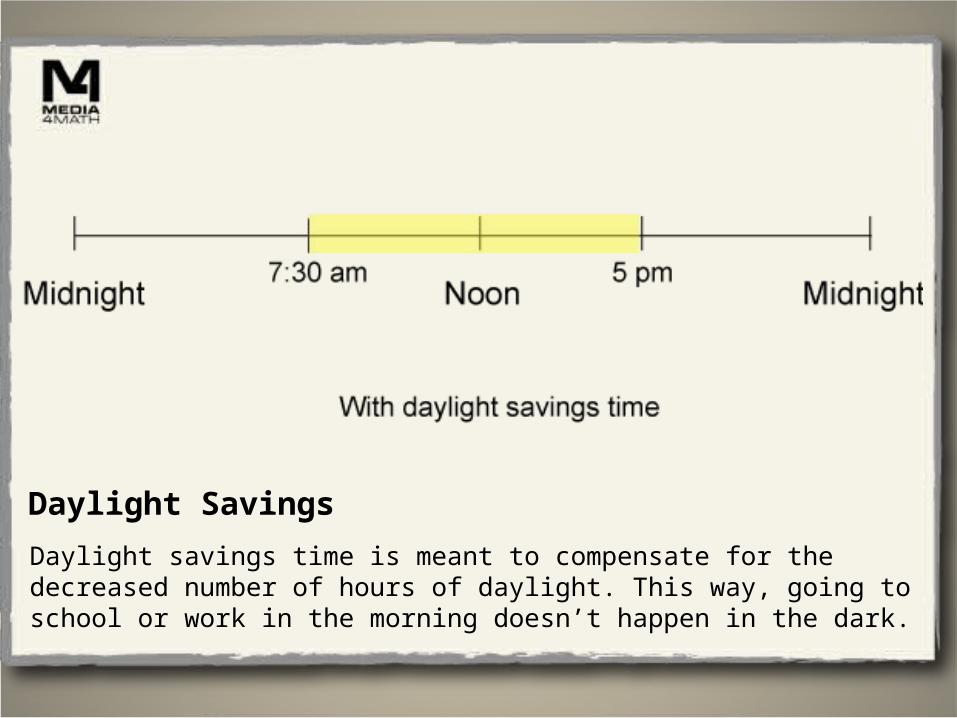
Daylight savings time is meant to compensate for the decreased number of hours of daylight. This way, going to school or work in the morning doesn’t happen in the dark.

Daylight Savings
But as spring returns and the number of hours of daylight increase, then during this period, daylight savings time isn’t necessary.


![Appendix 17B.1 BXC Phase 1B North Daylight and Sunlight ... · PDF fileDaylighting” [2] and the BR 209, “Site Layout Planning for Daylight and Sunlight” [1]. Daylight and sunlight](https://static.fdocuments.us/doc/165x107/5aa4538d7f8b9afa758bc444/appendix-17b1-bxc-phase-1b-north-daylight-and-sunlight-2-and-the-br-209.jpg)