DAWN D A - Attractive valuation to financial leverage ......D A W N Invesco India DAWN Portfolio...
36
D A W N Invesco India DAWN Portfolio DAWN: D - Demand recovery across cyclical & consumer discretionary sectors, A - Attractive valuation to provide margin of safety, W - Winning companies on the cusp of a new demand cycle leading to operating & financial leverage efficiencies, N - New credit & investment cycle to provide a boost to earnings recovery December 2017 This document is prepared by Invesco Asset Management (India) Private Ltd (‘IAM’). for informational purposes only and is not an offering. Circulation, disclosure, or dissemination of all or any part of this material to any unauthorized persons is prohibited.
Transcript of DAWN D A - Attractive valuation to financial leverage ......D A W N Invesco India DAWN Portfolio...

D A W N
Invesco India DAWN PortfolioDAWN: D - Demand recovery across cyclical & consumer discretionary sectors, A - Attractive valuation to provide margin of safety, W - Winning companies on the cusp of a new demand cycle leading to operating & financial leverage efficiencies, N - New credit & investment cycle to provide a boost to earnings recovery
December 2017
This document is prepared by Invesco Asset Management (India) Private Ltd (‘IAM’). for informational purposes only and is not an offering.Circulation, disclosure, or dissemination of all or any part of this material to any unauthorized persons is prohibited.

D A W N
Demand recovery across cyclical & consumer discretionary sectors
Presenting Invesco India DAWN PortfolioDAWN: D - Demand recovery across cyclical & consumer discretionary sectors, A - Attractive valuation to provide margin of safety, W - Winning companies on the cusp of a new demand cycle leading to operating & financial leverage efficiencies, N - New credit & investment cycle to provide a boost to earnings recovery
Every sunset brings the promise of a new dawn
2
Invesco India DAWN Portfolio (DAWN: D - Demand recovery across cyclical & consumer discretionary sectors, A - Attractive valuation to provide margin of safety, W - Winning companies on the cusp of a new demand cycle leading to operating & financial leverage efficiencies, N - New credit & investment cycle to provide a boost to earnings recovery) henceforth will be referred as “DAWN”
Attractive valuation to provide margin of safety
Winning companies on the cusp of a new demand cycle leading to operating & financial leverage efficiencies
New credit & investment cycle to provide a boost to earnings recovery

D A W N
Investment philosophyValue strategy investing at the cusp of recovery
3
Disclaimer: The sector referred above should not be construed as recommendations from Invesco Asset Management (India) Private Ltd. The Portfolio may or may not have any present or future positions in these sectors or in any other portfolios offered by Invesco Asset Management (India) Private Ltd.
Catalyst for investing
Cyclical recovery Financials Industrials Consumer DiscretionaryLevers for recovery Operating Leverage Financial LeverageUnder owned to Value style Pharma IT
Benefit to investors
Focused strategy on earnings recovery
Mean Reversion – key driver of returns
Exposure to under owned companies
Complement to existing growth oriented strategies
Portfolio of 20 – 25 companies Focus on mean reversion & value style High impetus on quality business models & management Bottom up stock picking approach without bias towards market
cap or sector
Investment style

D A W N
Invesco India DAWN Portfolio
4
Portfolio Name
Invesco India DAWN Portfolio(DAWN: D - Demand recovery across cyclical & consumer discretionary sectors, A - Attractive valuation to provide margin of safety, W - Winning companies on the cusp of a new demand cycle leading to operating & financial leverage efficiencies, N - New credit & investment cycle to provide a boost to earnings recovery)
Portfolio Objective
To generate capital appreciation by investing in companies available at reasonable valuations.
PortfolioDescription
The focus of this portfolio would be on identifying sectors and stocks which are expected to benefit from revival in cyclicalrecovery. The portfolio will also favour companies that will benefit from operating /financial leverage and are available at a discount to their fair/intrinsic value.
Indicative AssetAllocation Pattern
Under normal circumstances, the asset allocation of the portfolio shall be as follows:
Instrument Indicative Allocations (% of portfolio value)
Equity & Equity Related Instruments 65% to 100%
Cash & Cash Equivalent 0% to 35%
The portfolio will not have any capitalization bias. The asset allocation pattern indicated above may change from time to time, keeping in view market conditions. It must be clearly understood that the percentages stated above are only indicative and not absolute and that they can vary substantially depending upon the perception of market conditions of the Portfolio Manager, the intention being at all times to seek to protect the interests of the Client. Such changes in the asset allocation pattern will be for defensive considerations.
Benchmark S&P BSE 500

D A W N
23.30X
0
5
10
15
20
25
30
Jan-
95
Jan-
96
Dec
-96
Dec
-97
Nov
-98
Nov
-99
Oct
-00
Oct
-01
Sep
-02
Aug
-03
Aug
-04
Jul-
05
Jul-
06
Jun-
07
Jun-
08
May
-09
Apr
-10
Apr
-11
Mar
-12
Mar
-13
Feb-
14
Feb-
15
Jan-
16
Dec
-16
Dec
-17
Sensex PE Ratio (trailing twelve months)
Sensex now trades at a 38% premium to its long-term trailing 12 months average P/E multiple
Equity Market Outlook: Valuations – Premium to long-term average
5
Source: MOSL, Invesco Asset Management (India) Research, Bloomberg, Data as on December 29, 2017. Past performance may or may not be sustained in future.
Average since Jan ‘95 : 16.7x

D A W N
0%
1%
2%
3%
4%
5%
6%
7%
8%
FY01
FY02
FY03
FY04
FY05
FY06
FY07
FY08
FY09
FY10
FY11
FY12
FY13
FY14
FY15
FY16
FY17
PAT (% of GDP) Average
Corporate profit as a percentage of GDP still significantly below average
Equity Market Outlook: Profitability - Below long term average
6
Source: CMIE, IIFL Research. Based on a standalone financials of more than 15,000 companies. PAT: Profit After Tax. Disclaimer: Past performance may or may not be sustained in future.

D A W N
Where do we see opportunity

D A W N
0%
5%
10%
15%
20%
25%
30%
Apr
-10
Aug
-10
Dec
-10
Apr
-11
Aug
-11
Dec
-11
Apr
-12
Aug
-12
Dec
-12
Apr
-13
Aug
-13
Dec
-13
Apr
-14
Aug
-14
Dec
-14
Apr
-15
Aug
-15
Dec
-15
Apr
-16
Aug
-16
Dec
-16
Apr
-17
Aug
-17
Dec
-17
Cyclical Recovery: FinancialsCurrent Trends
8
Source: IAM. Credit Cost = Provisions for NPA’s/Average total assets. The sector referred above should not be construed as recommendations from Invesco Asset Management (India) Private Ltd. The Portfolio may or may not have any present or future positions in the above sector or in any other portfolios offered by Invesco Asset Management (India) Private Ltd.
Credit growth – on path of recovery
0.22
% 0.33
% 0.49
%
0.55
% 0.67
%
0.66
%
0.66
%
0.68
%
0.71
% 0.82
%
1.39
%
1.49
%
0.88
%
0.57
%
0.0%
0.2%
0.4%
0.6%
0.8%
1.0%
1.2%
1.4%
1.6%
FY06
FY07
FY08
FY09
FY10
FY11
FY12
FY13
FY14
FY15
FY16
FY17
FY18
E
FY19
E
Credit cost at cyclical high, expected to come down
Average: 13.01%Average: 0.72%
9.80%

D A W N
Trends in median Interest Cover (times)
Cyclical Recovery: FinancialsImprovement in credit ratio & interest coverage ratio
9
Source: CRISIL, Rating Round Up, First Half, Fiscal 2018 – Improving financial profiles sustain credit quality recovery. The interest coverage ratio is used to determine how easily a company can pay their interest expenses on outstanding debt. The sector referred above should not be construed as recommendations from Invesco Asset Management (India) Private Ltd. The Portfolio may or may not have any present or future positions in the above sector or in any other portfolios offered by Invesco Asset Management (India) Private Ltd.
12 months rolling credit ratio & debt-weighted credit ratio (times)

D A W N
303
275
193 189
52 28
5 0
50
100
150
200
250
300
350
Power Cement Roads Ports Land Airports Metro
Cyclical Recovery: FinancialsCatalyst: Significant De-leveraging underway across corporate India
10
Source: IDFC, De-leveraging data as on December 31, 2017. The sector referred above should not be construed as recommendations from Invesco Asset Management (India) Private Ltd. The Portfolio may or may not have any present or future positions in the above sector or in any other portfolios offered by Invesco Asset Management (India) Private Ltd.
Deleveraging (Rs. bn)
Stressed assets belonging to Steel sector being addressed through resolutions under the bankruptcy code

D A W N
9.20%
-40.00%
56.50%
-13.60%
7.30%2.40%
-60%
-40%
-20%
0%
20%
40%
60%
80%
SMA-0 SMA-1 SMA-2 RestructuredStandard Advance
GNPAs Total StressedAdvances
Cyclical Recovery: FinancialsCatalyst: Stressed assets coming down across various stress buckets
11
Source: Reserve Bank of India, Financial Stability Report Issue No. 16. December 2017. SMA-0: Principal or interest payment not overdue for more than 30 days but account showing signs of incipient stress, SMA-1: Principal or interest payment overdue between 31-60 days, SMA-2: Principal or interest payment overdue between 61-90 days, GNPA: Gross Non-Performing Advances. The sector referred above should not be construed as recommendations from Invesco Asset Management (India) Private Ltd. The Portfolio may or may not have any present or future positions in the above sector or in any other portfolios offered by Invesco Asset Management (India) Private Ltd.
% change in the asset quality of large borrowers between March 2017 and September 2017: Based on Exposure

D A W N
-20
-10
0
10
20
30
40
Jun-
12
Sep
-12
Dec
-12
Mar
-13
Jun-
13
Sep
-13
Dec
-13
Mar
-14
Jun-
14
Sep
-14
Dec
-14
Mar
-15
Jun-
15
Sep
-15
Dec
-15
Mar
-16
Jun-
16
Sep
-16
Dec
-16
Mar
-17
Jun-
17
Sep
-17
FY13 FY14 FY15 FY16 FY17 FY18
Private consumption Government consumption Gross capital formation
Cyclical Recovery: IndustrialsCurrent Trends: Mixed Bag: Need to spot the right opportunity
12
Source: Morgan Stanley Research, CMIE. Includes all government and private projects that were either announced/proposed or were under various stages of implementation. The sector referred above should not be construed as recommendations from Invesco Asset Management (India) Private Ltd. The Portfolio may or may not have any present or future positions in the above sector or in any other portfolios offered by Invesco Asset Management (India) Private Ltd.
8.66.54.1

D A W N
Cyclical Recovery: IndustrialsCurrent Trends: Public Spending more focussed on Road & Rail Network
13
Source: Company data, Credit Suisse. NHAI: National Highways Authority of India. MoRTH: Ministry of Road Transport and Highways RE – Revised Estimate. BE – Budget estimate. The sector referred above should not be construed as recommendations from Invesco Asset Management (India) Private Ltd. The Portfolio may or may not have any present or future positions in these sectors or in any other portfolios offered by Invesco Asset Management (India) Private Ltd.
332 239 327 287
737
1,114 1,238
470 493 520 565
935
1,210 1,310
2012 2013 2014 2015 2016 2017RE 2018BERoads Railways
(Rs bn)Public spending in roads and rail now almost at 3x the FY15 level
10,200
5,1261,916
3,169
7,98010,098
16,031
FY11 FY12 FY13 FY14 FY15 FY16 FY17
NHAI MoRTH
(km)Road awarding remains strong
4,500
5,013 5,732
4,260 4,410
6,061
8,142
FY11 FY12 FY13 FY14 FY15 FY16 FY17NHAI MoRTH
(km)Construction has picked up as well
D A W N
-4
-2
0
2
4
6
8
10
12
14
16
Jan-16 Apr-16 Jul-16 Oct-16 Jan-17 Apr-17 Jul-17 Oct-17
Index of activity Growth (%) Index of activity Growth (%) - 3m m.a.
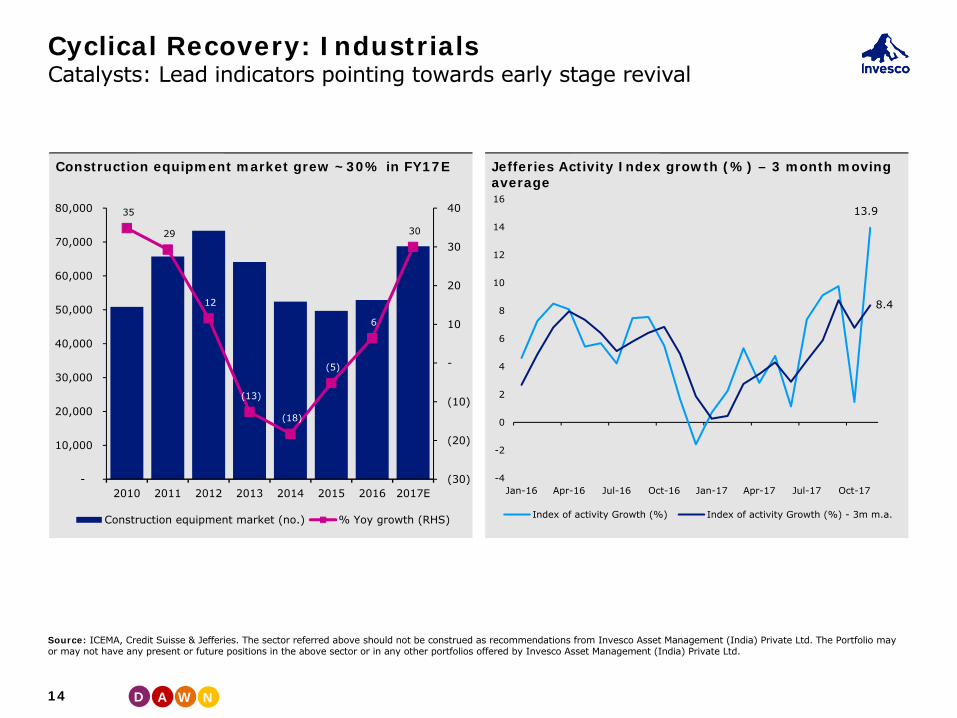
Cyclical Recovery: IndustrialsCatalysts: Lead indicators pointing towards early stage revival
14
Source: ICEMA, Credit Suisse & Jefferies. The sector referred above should not be construed as recommendations from Invesco Asset Management (India) Private Ltd. The Portfolio may or may not have any present or future positions in the above sector or in any other portfolios offered by Invesco Asset Management (India) Private Ltd.
35
29
12
(13)
(18)
(5)
6
30
(30)
(20)
(10)
-
10
20
30
40
-
10,000
20,000
30,000
40,000
50,000
60,000
70,000
80,000
2010 2011 2012 2013 2014 2015 2016 2017E
Construction equipment market (no.) % Yoy growth (RHS)
Construction equipment market grew ~30% in FY17E Jefferies Activity Index growth (%) – 3 month moving average
13.9
8.4

D A W N
Cyclical Recovery: Consumer Discretionary Current Trends: Consumption demand a key driver of GDP, still below long term average
15
Source: Kotak. IAM. Past performance may or may not be sustained in future. The sector referred above should not be construed as recommendations from Invesco Asset Management (India) Private Ltd. The Portfolio may or may not have any present or future positions in the above sector or in any other portfolios offered by Invesco Asset Management (India) Private Ltd.
20.70
12.30
0.22
25.6728.21
5.101.35
-6.05
3.89
7.23 9.23
-10
-5
0
5
10
15
20
25
30
FY07 FY08 FY09 FY10 FY11 FY12 FY13 FY14 FY15 FY16 FY17
11.31
-7.65
2.23
26.41 25.36
14.18
2.897.31 8.11
2.776.92
-10
-5
0
5
10
15
20
25
30
FY07 FY08 FY09 FY10 FY11 FY12 FY13 FY14 FY15 FY16 FY17
Two Wheelers Y-O-Y Growth (%)
Passenger Vehicles Y-O-Y Growth (%)
12.50
3.58
16.24
13.03
8.9610.86
14.21 14.71
11.18
0.00
2.00
4.00
6.00
8.00
10.00
12.00
14.00
16.00
18.00
2008 2009 2010 2011 2012 2013 2014 2015 2016
Advertising Revenue Growth (Y-O-Y)
Average:9.08
Average:9.80
Average:11.70
12.10 12.09
9.76
6.655.82 5.78
2.69
0
2
4
6
8
10
12
14
FY2011 FY2012 FY2013 FY2014 FY2015 FY2016 FY2017
FMCG Average Y-O-Y Volume Growth (%)
Average:7.84

D A W N
0%
1%
2%
3%
4%
5%
6%
7%
8%
9%
10%
May
-15
Jun-
15
Jul-
15
Aug
-15
Sep
-15
Oct
-15
Nov
-15
Dec
-15
Jan-
16
Feb-
16
Mar
-16
Apr
-16
May
-16
Jun-
16
Jul-
16
Aug
-16
Sep
-16
Oct
-16
Nov
-16
Dec
-16
Jan-
17
Feb-
17
Mar
-17
Apr
-17
May
-17
Jun-
17
Jul-
17
Aug
-17
Sep
-17
Nominal Rural wages (YoY) Rural CPI Inflation (YoY)
Cyclical Recovery: Consumer DiscretionaryCatalyst: Gap between rural inflation and wages, leading to higher disposable income for rural economy
16
Source: Spark Capital. Data as at September 30, 2017. The sector referred above should not be construed as recommendations from Invesco Asset Management (India) Private Ltd. The Portfolio may or may not have any present or future positions in the above sector or in any other portfolios offered by Invesco Asset Management (India) Private Ltd.
Rural inflation and Wage growth rate
3.1%
6.6%

D A W N
Cyclical Recovery: Consumer DiscretionaryCatalyst: Unorganised to Organised
17
Source: Antique Stock Broking Limited. The Force Awakens: GST implementation to drive large scale benefits. The sector referred above should not be construed as recommendations from Invesco Asset Management (India) Private Ltd. The Portfolio may or may not have any present or future positions in the above sector or in any other portfolios offered by Invesco Asset Management (India) Private Ltd.
80% 80%
70%
60%
50%45%
35% 35%30% 30%
0%
10%
20%
30%
40%
50%
60%
70%
80%
90%
Jewellery Apparel Plywood Tiles Pipes Footwear Fans Wires Paint Lighting
Share of Unorganised Business with in each sector

D A W N
15.28
16.10 14.11 13.21 14.28 13.68 14.8416.09
4343
39 39 4042
46 48
7878 77
75 74
72 72 72
65
68
71
74
77
80
0
10
20
30
40
50
FY10 FY11 FY12 FY13 FY14 FY15 FY 16 FY 17
%%
EBITDA Margins (LHS) Gross Profit Margin (LHS) CU (RHS)
12.3%12.6%
17.2%
19.7%21.3%
24.1%
24.7%
22.1%
9.6%10.0%
10.9% 10.6%
11.5%
11.0%
11.0%
11.4%
9.0%
10.0%
11.0%
12.0%
13.0%
14.0%
15.0%
16.0%
10.0%
12.0%
14.0%
16.0%
18.0%
20.0%
22.0%
24.0%
26.0%
28.0%
2010 2011 2012 2013 2014 2015 2016 2017
Interest Exp/EBIT (LHS) Cost of Borrowing (ex CWIP) (RHS)
Capacity Utilisation vs. EBITDA Margin trends & Gross Profit Margin
Financial Leverage
Operating & Financial LeverageLevers for Recovery
18
Source: RBI, IIFL, Capitaline, Invesco Asset Management (India) Research. EBITDA: Earnings before interest, taxes, depreciation, and amortization. EBIT: Earnings before interest and tax. CU: Capacity utilization. CWIP: Capital Work in Progress. Above graphs include company data, which are constituents of S&P BSE 200 Index (excluding financials).
While current earnings cycle is weak, there are levers to earnings recovery India’s incorporation’s capacity utilization is at a 6-year low Interest expense in FY17 constitutes 22% of EBIT as compared to 12% in 2010 highlighting significant financial
leverage Any cyclical recovery in demand should result in more than proportionate uptick in earnings due to higher
degree of operating and financial leverage

D A W N
55%
0%
20%
40%
60%
80%
100%
120%
140%
Mar
-06
Aug
-06
Jan-
07
Jun-
07
Nov
-07
Apr
-08
Sep
-08
Feb-
09
Jul-
09
Dec
-09
May
-10
Oct
-10
Mar
-11
Aug
-11
Jan-
12
Jun-
12
Nov
-12
Apr
-13
Sep
-13
Feb-
14
Jul-
14
Dec
-14
May
-15
Oct
-15
Mar
-16
Aug
-16
Jan-
17
Jun-
17
Nov
-17
Average: 55%
ValueGrowth Index trading at Premium to long term average
19
Source: Invesco Asset Management (India) Research, Bloomberg, Data as on 29 December 2017Past performance may or may not be sustained in future.
MSCI India Growth Index Premium to Value Index
MSCI growth index presently trades at 55% premium to the MSCI Value index, which is in line with the long period average

D A W N
ValueInvestors are under-exposed to value style
20
Source: Morningstar/Value Research/IAM. Blend style means mix of growth and value style of investing.
Note: ^Above analysis is based on Value Research style categorization of equity funds and excludes Exchange Traded Funds (ETFs), close-ended equity funds and arbitrage funds. The time period chosen is from May 2014 (when BJP led single party government came to power and equity markets started witnessing renewed optimism on expectations of economic recovery & increased business confidence) to Nov 2017.
The above analysis is for illustration purposes only and may or may not reflect broader industry level fund categorization.
93%
7%
0%
10%
20%
30%
40%
50%
60%
70%
80%
90%
100%
Inflow in growth style of equity funds Inflows in value & blend style equity funds
% o
f to
tal f
low
s in
equ
ity f
unds
Time Period: May 2014 – Nov 2017
Total inflows in equity funds^ (May 2014 –Nov 2017):
Rs. 222,802 crs

D A W N
Crowded trades1 may not be the best performing in the long term
21
Past performance may or may not be sustained in future. 1Crowded trades - Securities or investment theme preferred by large number of market participants. Data Source: Kotak Institutional Equities/Internal. CAGR: Compound Annual Growth Rate. Data as on September 30, 2017. Methodology for Data analysis: Based on the shareholding pattern declared by the listed companies on a quarterly basis to the stock exchanges, the holding by mutual funds is populated. Then the overweight positions of mutual funds holding were calculated taking S&P BSE 200 index as a reference index. For example, aggregate holding of all mutual funds in stock A was 6.7% and the weightage of said stock in S&P BSE 200 Index was 5.8%, then the overweight position of mutual funds in stock A is 0.9% (i.e. 6.7-5.8). Overweight positions were rounded to the first decimal. Based on the overweight positions calculated as mentioned above, top 15 stocks which were also constituents of Nifty 50 and another top 15 stocks which were not constituents of Nifty 50 were selected for analysis. The above table shows the average CAGR return given by those top 15 stocks (i.e. Nifty 50 constituents and not Nifty 50 constituents) in different time periods- (i) 5 year period ending June 2010, September 2010, September 2011 and September 2017 (ii) 6 years period from June 2010-2016, September 2010-2016 and September 2011-September 2017. The analysis shows that stocks where mutual funds were overweight in June 2010, September 2010 and September 2011 delivered better returns in previous years (5 years ended respective periods), but not in subsequent periods under analysis. Disclaimer: The above analysis is for illustration purposes only and should not be construed as an investment advice. The schemes of Invesco Mutual Fund may or may not have any present or future positions in the stocks which may or may not be constituents of Nifty 50 or S&P BSE 200 index. The AMC is not guaranteeing or forecasting any returns nor confirming that any specific style of investing is superior over other style. 2Note: Since returns will be futuristic in case of next 6 years from September 2017, it cannot be calculated.
28.0% 1.7%June 2010
24.0% 0.8%Sept 2010
12.4% 7.5%Sept2011
29.0% Refer Note2
Sept 2017
30.8% 11.1%June 2010
27.3% 9.7%Sept 2010
20.0% 16.9%Sept2011
32.3% Refer Note2
Sept2017
Previous 5 Years Return
Next 6 Years CAGR
Return
Previous 5 Years Return
Next 6 Years CAGR
Return
Average CAGR return of top 15 overweight stock positions (vis-à-vis S&P BSE 200 index) held by mutual funds and which are also Nifty 50 constituents
Average CAGR return of top 15 overweight stock positions (vis-à-vis S&P BSE 200 index) held by mutual funds and which are not Nifty 50 constituents

D A W N
Portfolio Details

D A W N
Model Portfolio HoldingsDecember 31, 2017
23
The data given above is for model portfolio as on December 31, 2017. The stock & sectors referred above should not be construed as recommendations from Invesco Asset Management (India) Private Ltd. (“the Portfolio Manager”). The Portfolio Manager may or may not hold position in this stock in future. This should not be seen as an investment advice. Cyclical Recovery: Transition of a company from a period of recession to expansion as part of business cycle which is affected by ups and downs in the overall economy. Operating Leverage: Companies currently operating at low capacity utilization and have large portion of costs fixed in nature. These companies can make more money from each additional sale as demand recovers. Financial Leverage: Companies which can generate returns greater than the interest expense associated with the debt they use to fund growth. Further, could increase their profit margin from decline in interest rates and reduction in debt due to profit growth. Value: Stocks trading at discount to their intrinsic value. Securities investments are subject to market risks, please read the Disclosure Document carefully before investing.
Portfolio HoldingsTop 15 Holdings % of Net Assets
ICICI Bank Ltd. 7.96
Reliance Industries Ltd. 7.31
KNR Constructions Ltd. 6.17
Inter Globe Aviation Ltd. 5.47
Infosys Ltd. 5.07
HCL Technologies Ltd. 4.48
United Spirits Ltd. 4.37
Coromandel International Ltd. 4.34
Gujarat State Petronet Ltd. 4.19
Axis Bank Ltd. 3.93
Exide Industries Ltd. 3.86
Tata Metaliks Ltd. 3.83
L & T Finance Holdings Ltd. 3.65
Hero MotoCorp Ltd. 3.34
Apollo Hospitals Enterprises Ltd. 3.20
SectorSector % of Net AssetsFinancials 21.61
Industrials 21.06
Energy 9.79
Consumer Discretionary 9.69
Information Technology 9.54
Materials 8.17
Healthcare 5.71
Consumer Staples 4.37
Utilities 4.19
Cash & Cash Equivalent 5.87
ThemeTheme % of Net AssetsCyclical Recovery 46.88
Operating and Financial Leverage 29.55
Value 17.72
D A W N
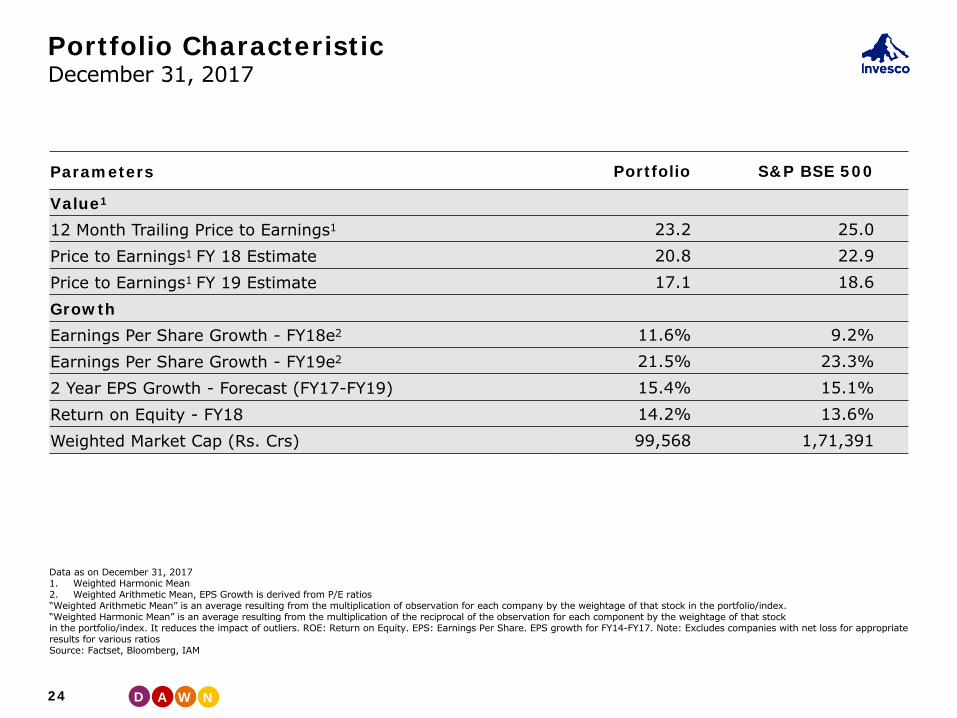
Portfolio Characteristic December 31, 2017
24
Data as on December 31, 20171. Weighted Harmonic Mean2. Weighted Arithmetic Mean, EPS Growth is derived from P/E ratios“Weighted Arithmetic Mean” is an average resulting from the multiplication of observation for each company by the weightage of that stock in the portfolio/index.“Weighted Harmonic Mean” is an average resulting from the multiplication of the reciprocal of the observation for each component by the weightage of that stockin the portfolio/index. It reduces the impact of outliers. ROE: Return on Equity. EPS: Earnings Per Share. EPS growth for FY14-FY17. Note: Excludes companies with net loss for appropriate results for various ratiosSource: Factset, Bloomberg, IAM
Parameters Portfolio S&P BSE 500
Value1
12 Month Trailing Price to Earnings1 23.2 25.0Price to Earnings1 FY 18 Estimate 20.8 22.9Price to Earnings1 FY 19 Estimate 17.1 18.6GrowthEarnings Per Share Growth - FY18e2 11.6% 9.2%Earnings Per Share Growth - FY19e2 21.5% 23.3%2 Year EPS Growth - Forecast (FY17-FY19) 15.4% 15.1%Return on Equity - FY18 14.2% 13.6%Weighted Market Cap (Rs. Crs) 99,568 1,71,391

D A W N
Cyclical RecoveryICICI Bank Ltd.
25
Source: IAM, Bloomberg. Disclaimer: Past performance may or may not be sustained in future. The above analysis is based on IAM research done by IAM. The stock/sector referred above should not be construed as recommendations from Invesco Asset Management (India) Pvt. Ltd. (“the Portfolio Manager”). The Portfolio Manager may or may not hold position in this stock/sector.
14%
17%
14%
17%
14%
12%
7%
0%
2%
4%
6%
8%
10%
12%
14%
16%
18%
20%
FY11 FY12 FY13 FY14 FY15 FY16 FY17
0.6%
0.4% 0.4%0.5%
0.6%
1.2%
1.6%
0.00%
0.20%
0.40%
0.60%
0.80%
1.00%
1.20%
1.40%
1.60%
1.80%
FY11 FY12 FY13 FY14 FY15 FY16 FY17
44,065
38,724
32,490
27,536
19,039
4Q-FY16 1Q-FY17 2Q-FY17 3Q-FY17 4Q-FY17
Stressed asset watch list has halved (Rs. Crs) Credit costs above long term averageCredit growth below long term average

D A W N
Cyclical RecoveryKNR Constructions Ltd.
26
Source: IAM, Bloomberg. EBITDA: Earnings before interest, taxes, depreciation, and amortization. ROCE: Return on Capital Employed.Disclaimer: Past performance may or may not be sustained in future. The above analysis is based on IAM research done by IAM. The stock/sector referred above should not be construed as recommendations from Invesco Asset Management (India) Pvt. Ltd. (“the Portfolio Manager”). The Portfolio Manager may or may not hold position in this stock/sector.
1,296 1,318
3,464
3,769
835 876 903
1,541
0
200
400
600
800
1,000
1,200
1,400
1,600
1,800
0
500
1,000
1,500
2,000
2,500
3,000
3,500
4,000
FY14 FY15 FY16 FY17
Order Book (LHS) Revenue (RHS)
126 126155
230
12%13%
19%20%
0%
5%
10%
15%
20%
25%
FY14 FY15 FY16 FY170
50
100
150
200
250
EBIDTA (RHS) ROCE (LHS)
Pick up in order book and revenue Growth Improvement in Margins and Return Ratios

D A W N
1.30%
1.20%
1.10%
0.90% 0.90%
1.00%
4.10%
4.40%
4.80%
5.10%
4.90%
5.20%
3.5%
4.0%
4.5%
5.0%
5.5%
0.60%
0.80%
1.00%
1.20%
1.40%
1QFY17 2QFY17 3QFY17 4QFY17 1QFY18 2QFY18
Operating expenses (LHS) Pre-provision profit (RHS)
Operating LeverageL & T Finance Holdings Ltd.
27
Source: IAM, Bloomberg.Disclaimer: Past performance may or may not be sustained in future. The above analysis is based on IAM research done by IAM. The stock/sector referred above should not be construed as recommendations from Invesco Asset Management (India) Pvt. Ltd. (“the Portfolio Manager”). The Portfolio Manager may or may not hold position in this stock/sector.
14.00%14.50%
15.50%
17.30%
15.80%16.20%
31.60%
34.10% 34.10%
41.30%42.40% 41.70%
15%
20%
25%
30%
35%
40%
45%
10%
12%
14%
16%
18%
20%
1QFY17 2QFY17 3QFY17 4QFY17 1QFY18 2QFY18
Return on Equity (LHS) Coverage Ratio (RHS)
Lower operating expenses leading to operating leverage Improvement in Return on equity along with improvement in provision ratio

D A W N
71% 72% 71%
67%
63% 64% 64% 63%
66%68%
22.4%23.0%
22.5%22.0%
20.3%
18.2%
17.5%17.9%18.1%
18.5%
15%
16%
17%
18%
19%
20%
21%
22%
23%
24%
40%
45%
50%
55%
60%
65%
70%
75%
FY1
2
FY1
3
FY1
4
FY1
5
FY1
6
FY1
7
FY1
8
FY1
9E
FY2
0E
FY2
1E
Occupancy (%) EBIT - Standalone
Operating LeverageApollo Hospitals Enterprise Ltd.
28
Source: IAM, Bloomberg.Disclaimer: Past performance may or may not be sustained in future. The above analysis is based on IAM research done by IAM. The stock/sector referred above should not be construed as recommendations from Invesco Asset Management (India) Pvt. Ltd. (“the Portfolio Manager”). The Portfolio Manager may or may not hold position in this stock/sector.
Operating Leverage: Improvement in occupancy to drive improvement in EBIT margin
2,574
2,816
3,068
2,612
2,254
-6.82%
12.88%
19.91% 20.47% 20.83%
-10%
-5%
0%
5%
10%
15%
20%
25%
30%
1,500
1,700
1,900
2,100
2,300
2,500
2,700
2,900
3,100
3,300
FY17 FY18 FY19E FY20E FY21E
Growth in EBIT -YOY (LHS) Conslidate Interest (RHS)
Growth in EBIT, fall in interest leading to financial leverage
D A W N
0
5
10
15
20
25
30
35
Jan-
08
Sep
-08
May
-09
Jan-
10
Sep
-10
May
-11
Jan-
12
Sep
-12
May
-13
Dec
-13
Aug
-14
Apr
-15
Dec
-15
Aug
-16
Apr
-17
Dec
-17
1 year forward PE Average AVG + 1 Standard Deviation AVG - 1 Standard Deviation
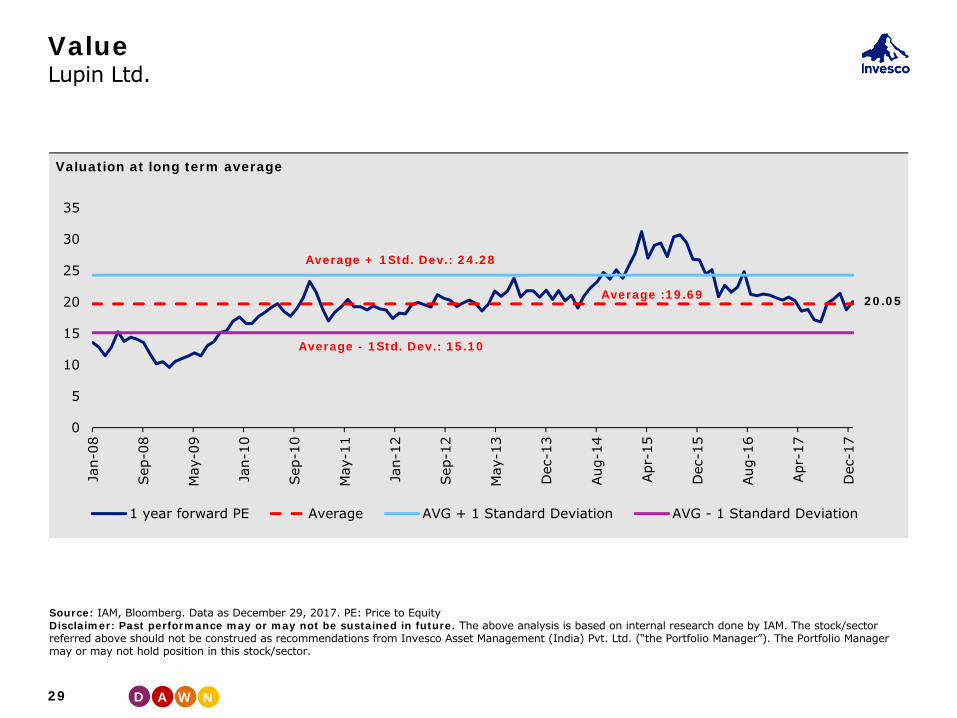
ValueLupin Ltd.
29
Source: IAM, Bloomberg. Data as December 29, 2017. PE: Price to EquityDisclaimer: Past performance may or may not be sustained in future. The above analysis is based on internal research done by IAM. The stock/sector referred above should not be construed as recommendations from Invesco Asset Management (India) Pvt. Ltd. (“the Portfolio Manager”). The Portfolio Manager may or may not hold position in this stock/sector.
Average + 1Std. Dev.: 24.28
Average - 1Std. Dev.: 15.10
Average :19.69 20.05
Valuation at long term average

D A W N
ValueInfosys Ltd.
30
Source: IAM, Bloomberg. Data as December 29, 2017. PE: Price to EquityDisclaimer: Past performance may or may not be sustained in future. The above analysis is based on internal research done by IAM. The stock/sector referred above should not be construed as recommendations from Invesco Asset Management (India) Pvt. Ltd. (“the Portfolio Manager”). The Portfolio Manager may or may not hold position in this stock/sector.
8.00
11.00
14.00
17.00
20.00
23.00
26.00
Jul-
07
May
-08
Feb-
09
Dec
-09
Oct
-10
Jul-
11
May
-12
Mar
-13
Dec
-13
Oct
-14
Aug
-15
May
-16
Mar
-17
Dec
-17
1 year forward PE Avg AVG + 1 Standard Deviation AVG - 1 Standard Deviation
Average + 1Std. Dev.: 19.93
Average + 1Std. Dev.: 14.18
Average :17.05
15.31
Valuations below long term average

D A W N
Why Us
D A W N
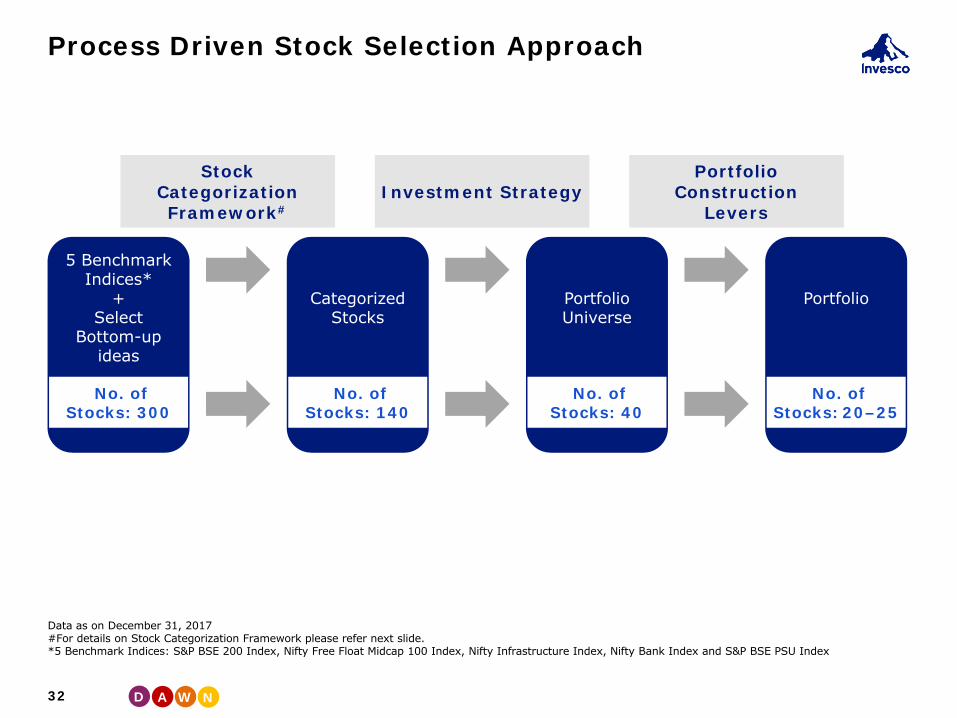
Process Driven Stock Selection Approach
32
5 Benchmark Indices*
+Select
Bottom-up ideas
No. of Stocks: 300
Categorized Stocks
No. of Stocks: 140
Portfolio Universe
No. of Stocks: 40
Portfolio
No. of Stocks: 20–25
Stock Categorization Framework#
Investment StrategyPortfolio
ConstructionLevers
Data as on December 31, 2017#For details on Stock Categorization Framework please refer next slide. *5 Benchmark Indices: S&P BSE 200 Index, Nifty Free Float Midcap 100 Index, Nifty Infrastructure Index, Nifty Bank Index and S&P BSE PSU Index

D A W N
Stock Categorization Framework
33
P2P: Path to Profit; ROE: Return on Equity.
Stock Category
Descriptions (e.g.)
Growth Prospects (e.g.)
Company Attribute (e.g.)
Financial Parameter (e.g.)
Leader Established companies In line or better than industry
Track record of leadership, globally competitive
Industry leading margin / ROE
GrowthWarrior Young / established companies Better than industry
Unique proposition and / or right place, right time
Margin & ROE expansion
Star Young companies High growth Entrepreneur vision, scalability Operating Leverage
Diamond Company with valuable assets Low growth Management intent to
unlock valueValue of asset / business
ValueFrog Prince Company in a
turnaround situation Back to growth Intrinsic strengths in core business P2P, ROE expansion
Shotgun Opportunistic investment Positive surprise
Corporate event, restructuring, earnings news
Event visibility Event
Commodities Call on the cycle is paramount Positive
Integration, cost efficiency, globally competitive
Profit leverage

D A W N
Portfolio Manager
Mr. Chetan Shah, CFASenior Portfolio Manager – Portfolio Management Services
34
Chetan has experience of 23 years in Indian equity markets; of which 11 years were spent in portfolio management and previous 11 years were in equity research. He has been with PMS division since inception. Prior to this he worked with Quantum Securities as Head of Research and at DBS Securities India as a Senior Analyst. Chetan holds an Electronics Engineering degree, a PGDM from Jamnalal Bajaj Institute of Management Studies and a CFA charter from CFA Institute, USA. He is on the Board of Indian Association of Investment Professionals (IAIP), a not-for-profit organization and member society of CFA Institute, promoting ethics and professional excellence in the industry.

D A W N
Disclaimer
Disclaimer: This presentation does not solicit any action based on the material contained herein. Invesco Asset Management (India) Private Ltd. (“the PortfolioManager / the Company”) will not treat recipients as clients by virtue of their receiving this presentation. It does not constitute a personal recommendation or takeinto account the particular investment objectives, financial situation / circumstances and the particular needs of any specific person who may receive thispresentation. The Co's/sectors referred in this presentation are only for the purpose of explaining the concept of Portfolio and should not be construed asrecommendations from Portfolio Manager. The Portfolio may or may not have any present or future positions in these stocks. The Portfolio(s) discussed in thepresentation may not be suitable for all the investors. The recipient of this material alone shall be fully responsible / liable for any decision taken on the basis ofthis material. The appropriateness of a particular investment or strategy will depend on an investor’s individual circumstances and objectives. The distribution ofthis presentation in certain jurisdictions may be restricted or totally prohibited to registration requirements and accordingly, persons who come into possession ofthis presentation are required to inform themselves about and to observe any such restrictions and/ or legal compliance requirements. Persons who may receivethis presentation should consider and independently evaluate whether it is suitable for his / her / their particular circumstances and are requested to seekprofessional / financial advice. Past performance is not a guide for future performance. Future returns are not guaranteed and a loss of principal may occur. TheCompany and its affiliates accept no liabilities for any kind of loss arising out of the use of this presentation. With respect to all information found in thispresentation the Company has obtained data from sources it considers reliable however, the Company and its directors, officers, agents, or employees and itsaffiliates make no warranty, express or implied, including the warranties of merchantability and fitness for a particular purpose, or assume any legal liability orresponsibility for the accuracy, completeness, or usefulness of any information contained therein and the Company shall not be liable for any indirect, incidental orconsequential damages sustained or incurred in connection with the use, operation, or inability to use this presentation and information contained therein. Underno circumstances will the Portfolio Manager be liable for any loss or damage caused by anyone’s reliance on information contained in this presentation.
Risk Factors: All securities investments are subject to market risks and there can be no assurance that the objectives of the portfolio(s) will be achieved. Eachportfolio will be exposed to various risks depending on the investment objective, investment strategy and the asset allocation. The performance of the portfoliomay be affected by changes in factors affecting the securities markets such as volume and volatility in the capital markets, interest rates, currency exchange rates,changes in law/policies of the Government, taxation laws, political, economic or other developments, general decline in the Indian markets, which may have anadverse impact on individual securities, a specific sector or all sectors. Further, the investments by the portfolio shall involve investment risks such as tradingvolumes, settlement risk, liquidity risk, default risk including the possible loss of capital. The portfolio with investment objective to invest in a specific sector /industry would be exposed to risk associated with such sector / industry and its performance will be dependent on performance of such sector / industry. ThePortfolio Manager in accordance with the features of respective Portfolio may use derivatives which require an understanding not only of the underlying instrumentbut of the derivative itself. Derivative products are leveraged instruments and can provide disproportionate gains as well as disproportionate losses to the investor.Execution of such strategies depends upon the ability of the Portfolio Manager to identify such opportunities. The decisions of Portfolio Manager may not always beprofitable. The portfolio, returns and expenses charged including Portfolio Management fees for each Client may differ from that of the other Client. Investors ofthe Portfolio Management Services are not being offered any guaranteed / assured returns. The Portfolio Manager may invest in shares, debt, units of mutualfunds, deposits or other financial instruments of associate/ group Co's. The name of the portfolio(s) does not in any manner indicate either the quality of theproduct or their future prospects and returns. Investors are advised to read the risk factors given in the Portfolio Management Services Agreement and DisclosureDocument before making investments.
MKTG
/PM
SPR
OD
PPT/
0817
/C00
166
35

D A W N
Get in Touch
Corporate Office:Invesco Asset Management (India) Private Limited2101-A, A Wing, 21st Floor, Marathon Futurex,N. M. Joshi Marg, Lower Parel, Mumbai – 400013T: +91-22-6731000 F: +91-22-23019422
To invest:Call 1800-209-0007 ∆ sms ‘Invest’ to 56677Invest Online www.invescomutualfund.com
Follow us on