David W. Allan
52
David W. Allan Allan’s TIME, Inc. www.allanstime.com 1 November 2011
Transcript of David W. Allan

The Gold is in the Long-term

Pioneering work of
Mandelbrot and Voss • Developed FRACTILES
• Demonstrated mathematically and
pictorially that the world can be well
modeled by self-similar and flicker-noise
like processes
• Time and frequency community had been
working, similarly, on long-term model
• This has very important implications for
metrology (non-stationary statistics)

• Classical variance or Standard deviation
does not converge for several important
noise processes in clocks, navigation, and
telecommunication systems.
• Classical variance cannot distinguish the
different important kinds of noise relevant
to clocks, oscillators, and to navigation
and telecommunication systems.
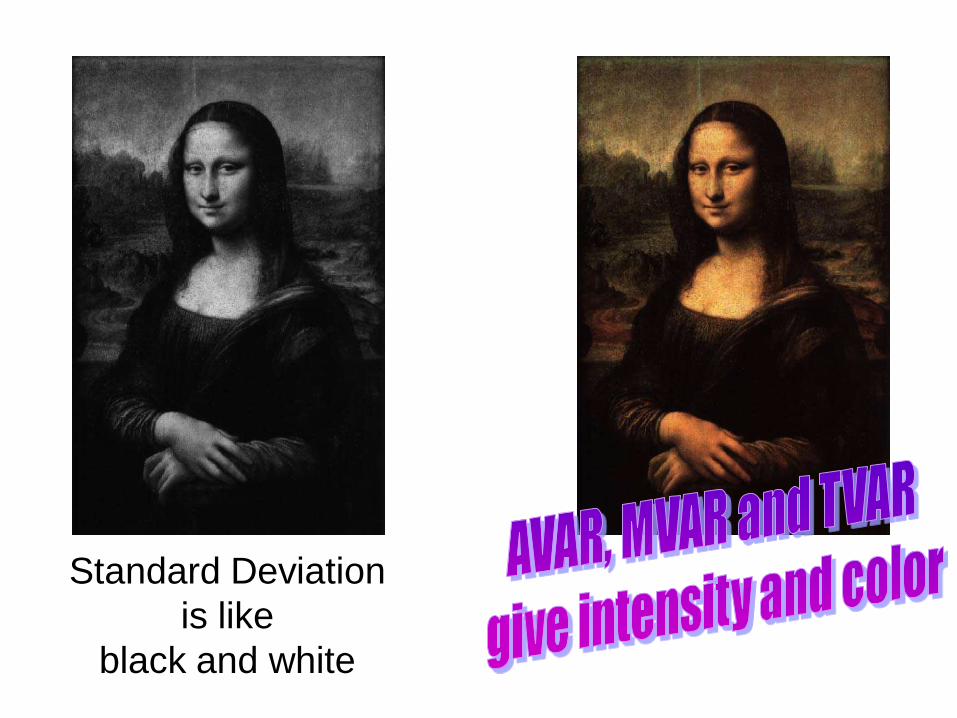
Standard Deviation
is like
black and white

Characteristics of Useful Measures
• Theoretically Sound
• Easy to use and intuitive
• Relates to real situations
• Yields useful spectral information for design
engineers
• Useful diagnostic tool
• Optimum smoothing, estimation, and prediction
• Communicates to the Manager (Decision
Makers)

HISTORICAL PERSPECTIVE • 1964 IEEE & NASA Short-term Stability Symposium
• 1966 IEEE Proceedings, Feb. Special Issue: “Frequency Stability”
• 1971 IEEE I&M, Characterization of Frequency Stability
• 1974 NBS Monograph 140
• 1981 Frequency Control Symposium: Modified “Allan Variance” with Increased Oscillator Characterization Ability
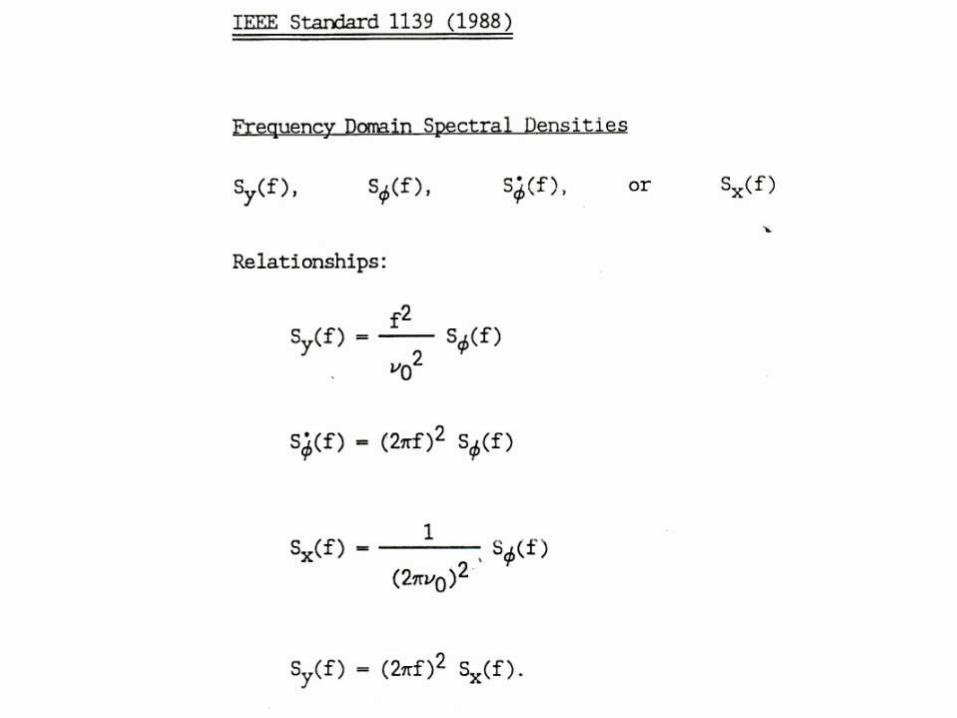
• 1988 IEEE Standard 1139-1988: Standard Terminology for Fundamental Frequency and Time Metrology
• Late 1980s: development of TVAR (Time Variance for telecom.)
• 1990 NIST Technical Note 1337, Characterization of Clocks and Oscillators
• 1997 ITU HANDBOOK: “Selection and Use of Precise Frequency and Time Systems,” Radiocommunication Bureau
• 1997 Hewlett Packard Application Note 1289, The Science of Timekeeping
• 2000-2010 Additional variance work at NIST provides efficiency & tighter confidences – http://tf.nist.gov/general/publications.htm
• Handbook of Frequency Stability Analysis, by W. J. Riley, NIST Special
Publication, SP 1065 (2007); also available at www.wriley.com

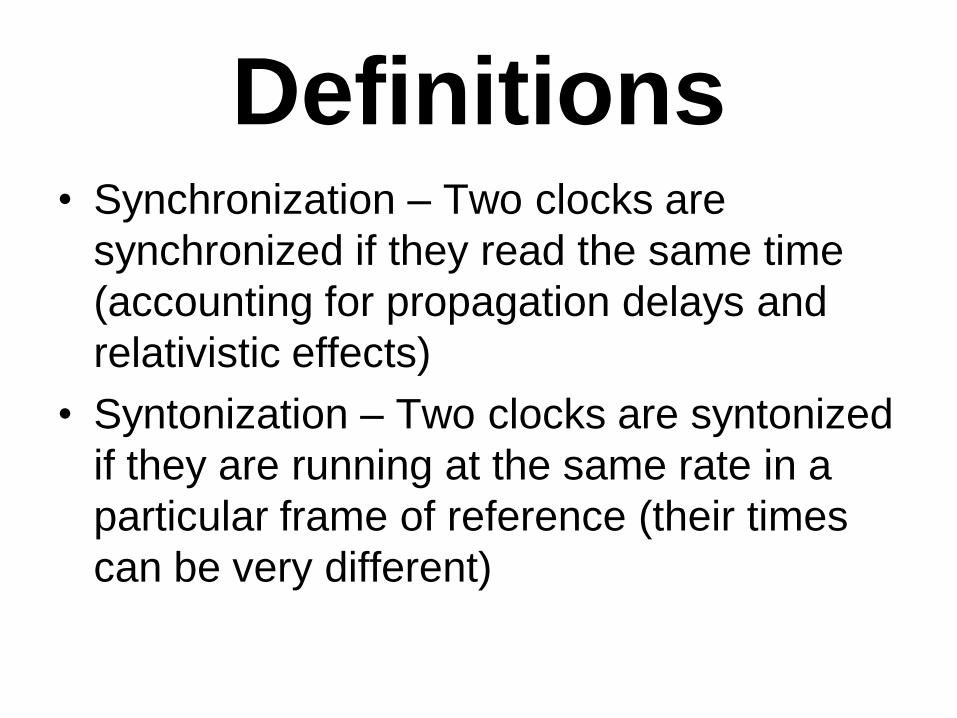
Definitions • Synchronization – Two clocks are
synchronized if they read the same time
(accounting for propagation delays and
relativistic effects)
• Syntonization – Two clocks are syntonized
if they are running at the same rate in a
particular frame of reference (their times
can be very different)


FLIP OF A COIN IS A RANDOM UNCORRELATED PROCESS:
(white noise spectrum)
0)( ffS y
INTEGRATING THESE FLIPS GENERATES A RANDOM-WALK PROCESS:
(heads = one step forward)
(tails = one step backward)
AFTER “N” FLIPS OF A COIN, WILL BE (on average) √N AWAY FROM THE ORIGIN:
2)( ffSx
Since: y = dx/dt, or
')'()(0t
dttytx
Similarly, taking a first difference is like a derivative and
turns a random-walk process into a white-noise process.
ii xxx
yi
1

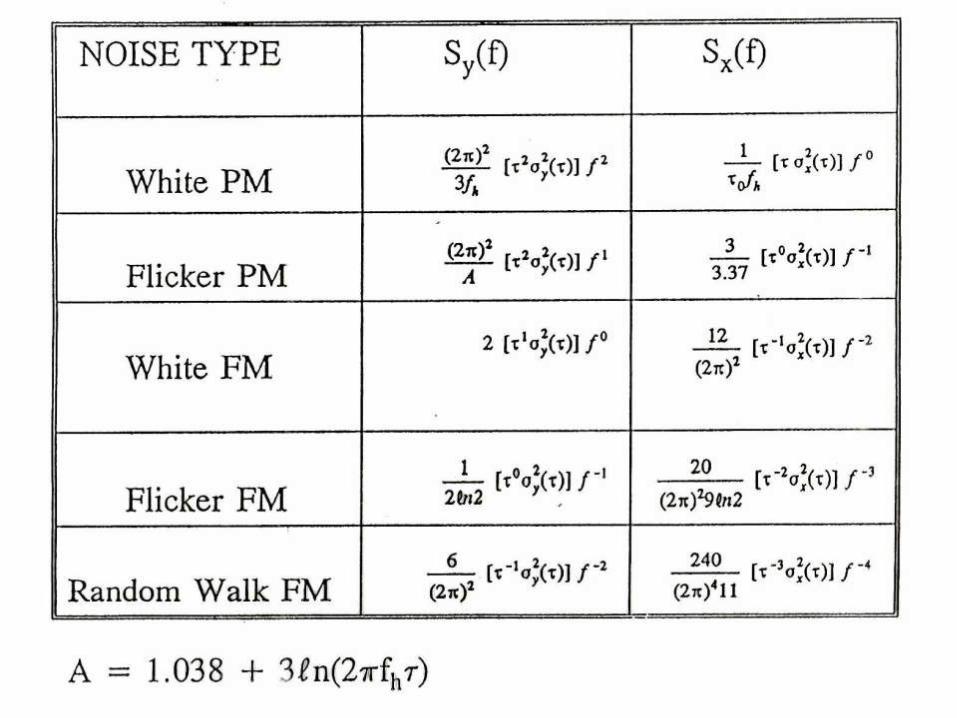
POWER-LAW SPECTRA:
ffSy )( ffSx )(

STATISTICAL THEOREM
• The optimum estimate of the mean of a process
with a white-noise spectrum is the simple mean.
• HENCE:
– For white PM, the optimum estimate of the phase or
the time is the simple mean of the independent phase
or time readings.
- For White FM, the optimum estimate of the frequency
is the simple mean of the independent frequency
readings, which is equivalent to the last time reading
minus the first time reading divided by the data
length, if there is no dead-time between the readings.


y(t)


o
sn
f
1
o
sn
f
1


Clock-time Keeping Ability
)()( yp kx
PMflicandPMwhitefork ker3/1
FMwalkrandomandFMwhitefork 1
FMflicfork ker2.12ln/1
________________________________________________________________________


10-5
10-4
10-3
10-2
10-1
100
101
0
0.5
1
1.5
2
2.5
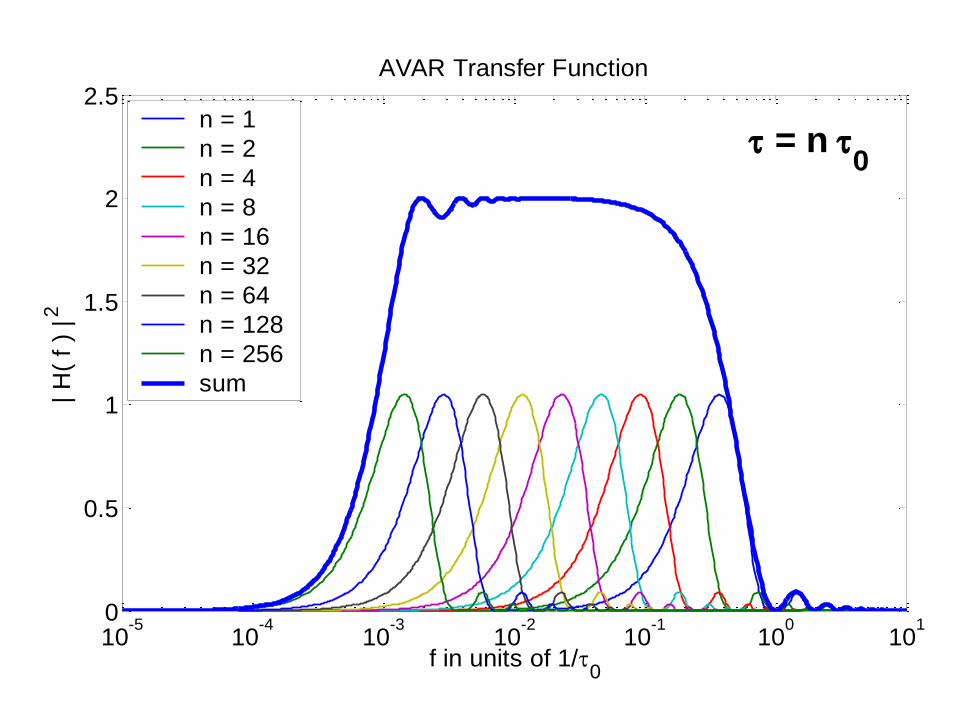
f in units of 1/0
| H
( f
) | 2
= n 0
AVAR Transfer Function
n = 1
n = 2
n = 4
n = 8
n = 16
n = 32
n = 64
n = 128
n = 256
sum

10-5
10-4
10-3
10-2
10-1
100
101
0
0.2
0.4
0.6
0.8
1
1.2
1.4
f in units of 1/0
| H
( f
) | 2
= n 0
MVAR Transfer Function
n = 1
n = 2
n = 4
n = 8
n = 16
n = 32
n = 64
n = 128
n = 256
sum
10-5
10-4
10-3
10-2
10-1
100
101
0
0.5
1
1.5
2
2.5
3
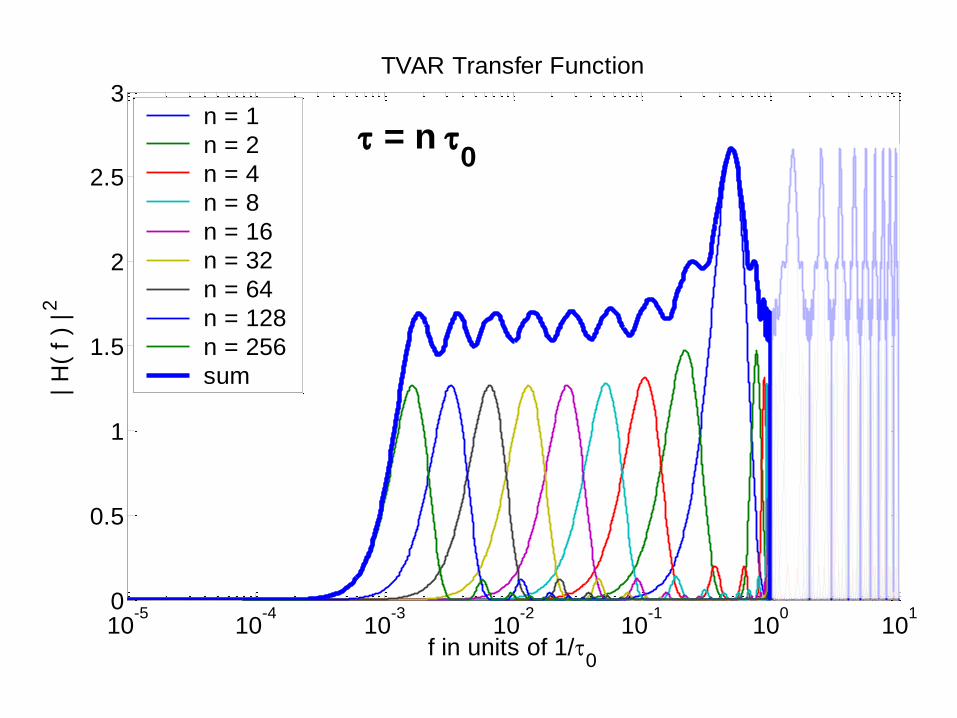
f in units of 1/0
| H
( f
) | 2
= n 0
TVAR Transfer Function
n = 1
n = 2
n = 4
n = 8
n = 16
n = 32
n = 64
n = 128
n = 256
sum


100
101
102
103
104
10-4
10-3
10-2
10-1
100
101
102
x(
)
sample time,
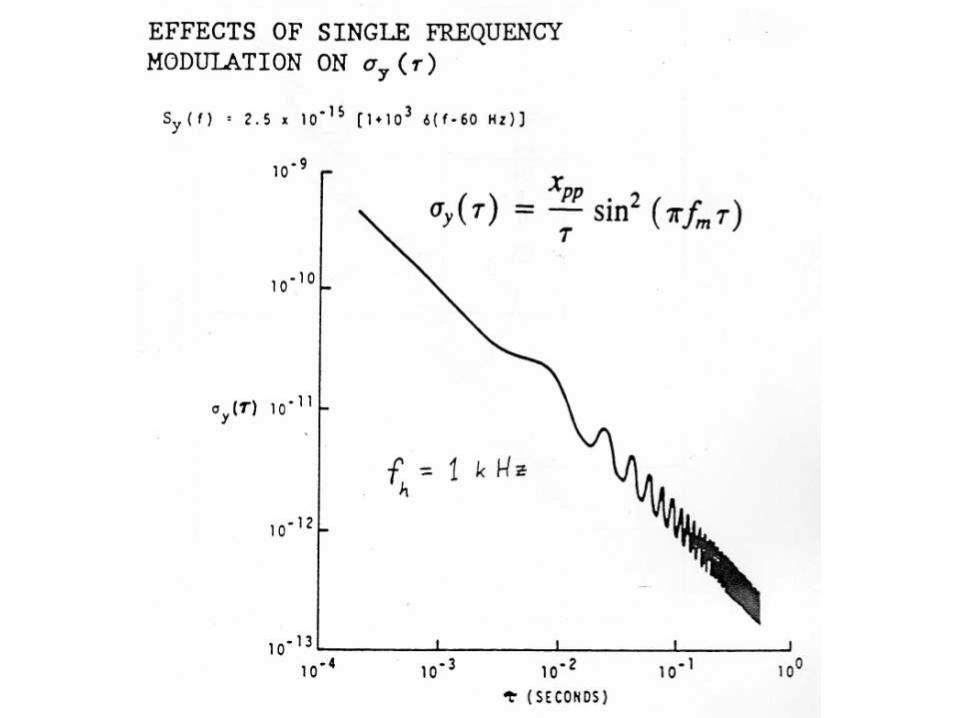
Effect of fm on TDEV
White PM + Modulation
-1
Empirical Fit
)sin(
)(sin4.1)(
3
o
oppx
fm
fmx
Effect of fm on TDEV


Time-keeping equation

Prof. Ashby and 3 watches


• Using EQUATE technology
• Ensemble of Quartz-crystal
oscillators Adapting To the
Environment
• Up to 5 g’s of acceleration
• -40 to +85 deg. C temperature


Eee
EQUATE velocity measurements
EQUATE Preliminary Results
118 118.5 119 119.5 120 120.5 121 121.5 122-6
-4
-2
0
2
4
6
t (s)
v t tangential velo
city (
m/s
)
Orientation 9
solutionmeasured
Time (seconds)
Ve
locity (
mete
rs /
se
co
nd
)

OVEN to test temperature independence of EQUATE timing package

0 10 20 30 40 50 60 70 80-0.5
0
0.5
1
1.5
2
2.5
3
3.5x 10
-3
t (Hours)
yB
123456
Example of Timing EnsembleB-mode frequency tracks Temperature
B-mode peak to peak variations of 3,240 ppm
More than double that of insulated experiments
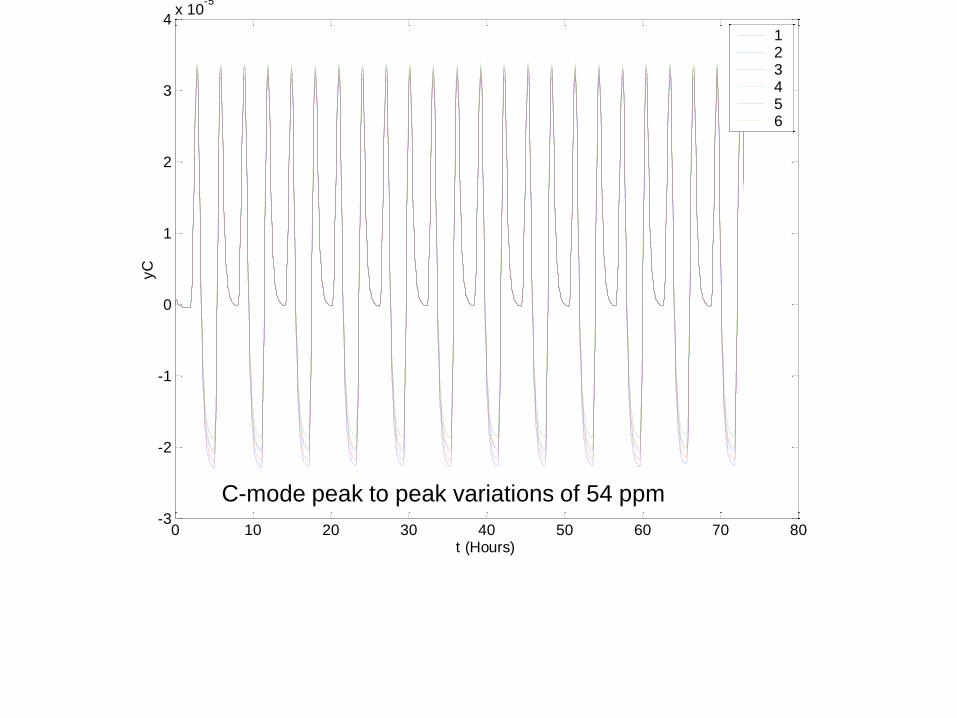
0 10 20 30 40 50 60 70 80-3
-2
-1
0
1
2
3
4x 10
-5
t (Hours)
yC
123456
Example of Timing EnsembleC-mode is dramatically impacted by Temp.
C-mode peak to peak variations of 54 ppm
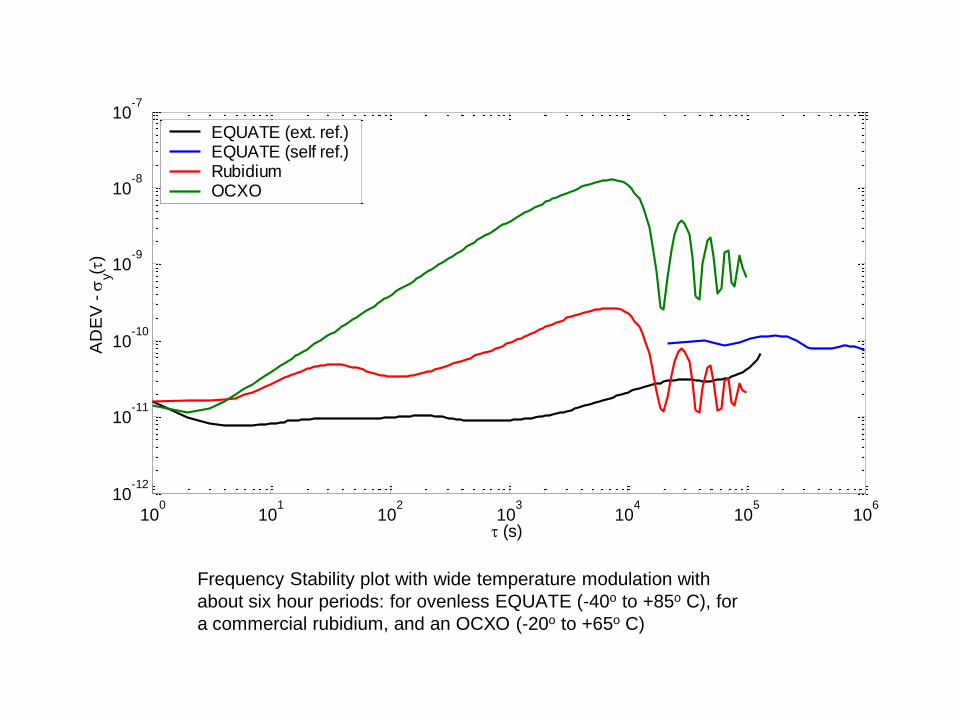
Frequency Stability plot with wide temperature modulation with
about six hour periods: for ovenless EQUATE (-40o to +85o C), for
a commercial rubidium, and an OCXO (-20o to +65o C)
100
101
102
103
104
105
106
10-12
10-11
10-10
10-9
10-8
10-7
(s)
AD
EV
-
y()
EQUATE (ext. ref.)EQUATE (self ref.)RubidiumOCXO


Time
Involves
Measurements
Extraordinaire


![David Allan (ed) Peter Ashwood-Smith Nigel Bragg (ed) Don Fedyk Paul Unbehagen]](https://static.fdocuments.us/doc/165x107/568145a2550346895db29639/david-allan-ed-peter-ashwood-smith-nigel-bragg-ed-don-fedyk-paul-unbehagen.jpg)