DAVID TAUSSIG & Associates, Inc. - StocktonDavid Taussig & Associates, Inc 2950 Buskirk Ave., Suite...
72
Associates, Inc. & Public Finance Facilities Planning Urban Economics Newport Beach Riverside San Francisco Dallas, Texas DAVID TAUSSIG PUBLIC FACILITIES FINANCING PLAN DELTA COVE August 25, 2010 Prepared By: David Taussig & Associates, Inc 5000 Birch Street, Suite 6000 Newport Beach, CA 92660 (949) 955-1500
Transcript of DAVID TAUSSIG & Associates, Inc. - StocktonDavid Taussig & Associates, Inc 2950 Buskirk Ave., Suite...

FACILITES FINANCING PLAN THE PRESERVE (DELTA COVE)
December 1, 2009
Prepared By:
David Taussig & Associates, Inc 2950 Buskirk Ave., Suite 185
Walnut Creek, CA 94597 (925) 938-2950
Associates, Inc. &
Public Finance Facilities Planning Urban Economics
Newport Beach Riverside
San Francisco Dallas, Texas
DAVID
TAUSSIG
PUBLIC FACILITIES FINANCING PLAN DELTA COVE
August 25, 2010
Prepared By:
David Taussig & Associates, Inc 5000 Birch Street, Suite 6000
Newport Beach, CA 92660 (949) 955-1500

TABLE OF CONTENTS
TOC
EXECUTIVE SUMMARY .................................................................................................... I
I. INTRODUCTION .................................................................................................... 1 A. PURPOSE OF THE REPORT ......................................................................................................... 1 B. ORGANIZATION OF REPORT ....................................................................................................... 1 C. PFFP TEMPLATE/GUIDELINES DISCUSSION ............................................................................. 1 D. PFFP PEER REVIEW DISCLAIMER .............................................................................................. 2
II. PROJECT DESCRIPTION ....................................................................................... 3
A. LOCATION, LAND USES AND RELATED ASSUMPTIONS ........................................................... 3 B. PROJECT ABSORPTION/PHASING .............................................................................................. 3
III. PROJECT SPECIFIC FACILITIES AND COST ESTIMATES ..................................... 4
A. BACKBONE INFRASTRUCTURE ................................................................................................ 4 B. FACILITIES TIMING/PHASING ................................................................................................... 5 C. LAND DEDICATION/RIGHT-OF-WAY COSTS ............................................................................. 6 D. IMPACT FEES ............................................................................................................................ 6 E. OTHER AGENCY ........................................................................................................................ 7
IV. DESCRIPTION OF PROPOSED FINANCING MECHANISMS ................................ 9
A. LAND SECURED FINANCING DISTRICTS ................................................................................. 10 1. MELLO-ROOS COMMUNITY FACILITIES ACT OF 1982 .................................................................... 10 2. 1913/1915 ACT ASSESSMENT BONDS .................................................................................... 12 3. INFRASTRUCTURE FINANCING DISTRICTS ..................................................................................... 14
B. ARRA FUNDING OPPORTUNITIES ............................................................................................ 15 1. BUILD AMERICA BONDS ............................................................................................................. 15 2. RECOVERY ZONE BONDS ........................................................................................................... 16 3. ENERGY BONDS ........................................................................................................................ 16
C. STATE PROPOSITIONS ............................................................................................................. 17 D. FEDERAL PROGRAMS .............................................................................................................. 18
V. PUBLIC FINANCING STRATEGY ......................................................................... 19 A. TOTAL COSTS AND FEES ......................................................................................................... 19 B. CFD FINANCING INTRODUCTION ............................................................................................ 19 C. CFD PROCEEDS ....................................................................................................................... 21 D. CFD VALUE TO LIEN ASSUMPTION ......................................................................................... 21 E. ANNUAL BURDEN ANALYSIS ................................................................................................... 22 F. TOTAL BURDEN ANALYSIS ...................................................................................................... 23
VI. CONCLUSIONS ................................................................................................... 25
A. CFD FEASIBILITY ...................................................................................................................... 25 B. PROJECT FEASIBILITY .............................................................................................................. 25 C. PUBLIC FACILITIES AND FINANCING MATRIX ......................................................................... 27
VII. SERVICES FINANCING ....................................................................................... 28

TABLE OF CONTENTS
TOC
ATTACHMENTS ATTACHMENT 1: PHASING MAP FOR DELTA COVE AND SALES PRICES ATTACHMENT 2: CITY OF STOCKTON PUBLIC FACILITIES FEES ATTACHMENT 3: BACKBONE FACILITIES COST ESTIMATES ATTACHMENT 4: COMMUNITY FACILITIES DISTRICT SPECIAL TAX BONDING CAPACITY ANALYSIS FOR DELTA COVE (SCENARIO 1)
ATTACHMENT 5: COMMUNITY FACILITIES DISTRICT SPECIAL TAX BONDING CAPACITY ANALYSIS FOR DELTA COVE (SCENARIO 2) ATTACHMENT 6: PFFP PRINCIPLES AND OBJECTIVES
EXECUTIVE SUMMARY
Delta Cove Page i Public Facilities Financing Plan August 25, 2010
BACKGROUND
David Taussig and Associates, Inc. (“DTA”) has been engaged by A.G. Spanos (“Spanos”) to prepare a Public Facilities Financing Plan (“PFFP”) that identifies the financing sources to be used by Spanos and/or future merchant builders, the City of Stockton (the “City”) and other local agencies to fund the construction of backbone public facilities (the “Public Facilities”), as well as development impact fees (the “Fees”) required to serve Delta Cove, also known as Atlas Tract (the “Project”).
The City lies approximately 80 miles east of San Francisco and 40 miles south of Sacramento and is bordered by Interstate 5 to the west and State Route 99 to the east. The Project is located in the Delta Secondary Zone on Delta Cove in northwest Stockton and is bound by Bear Creek to the north, Interstate 5 to the east, Mosher Slough/Shima Tract to the south and Mosher Slough/Shima Tract to the west. The proposed Project is comprised of a large scale residential community of various densities on 360 net acres of land.
PROJECT DESCRIPTION
At buildout, the Project is expected to include 1,545 dwelling units, of which 1,105 units will be single family detached homes and the remaining 440 units will be a mix of apartments, duplexes, flats and live-work homes. The non-residential component of the Project will include office, live-work office, and various retail uses, totaling approximately 31,000 square feet. Also included in the Project will be a 5.0 acre neighborhood park, a 14 acre school site and several additional smaller parks, as well as improvements to public services and infrastructure necessary to serve the Project. Based on the information provided by Spanos, construction is expected to occur in four phases commencing in 2013, and buildout for the Project is anticipated to occur in 2021. Single family home sales prices are expected to range from $304,478 to $566,846, apartments are expected to be valued at $207,179 each, and non-residential property will be valued at an average of $81 per building square foot. In addition to the base scenario described in the above paragraph (“Scenario 1”), DTA also analyzed a second scenario that utilizes more conservative sales prices and product absorption (“Scenario 2”). In this alternative scenario, buildout does not occur until 2026. With regard to home values in Scenario 2, single family homes are priced between $265,688 and $494,630, apartments are valued at $180,784 per unit, and non-residential property is valued at $70 per square foot. The PFFP text and analysis focus chiefly on Scenario 1 (Attachment 4). However, overall changes in the fiscal impacts of the Project that would result under Scenario 2 are also identified in the text, and the actual analysis of this alternate scenario may be found in Attachment 5.

EXECUTIVE SUMMARY
Delta Cove Page ii Public Facilities Financing Plan August 25, 2010
PROJECT COST ESTIMATES AND FINANCING STRATEGY
The completion of the Project will be contingent upon the construction of backbone infrastructure improvements required to support the projected development in the Project. Based on the cost estimates provided by Spanos, the cost of the Public Facilities is anticipated to be approximately $53.1 million, which would cover necessary sewer, water, storm drain and street improvements, as well as parks and other public facilities. In addition to the cost of the Public Facilities, Spanos will be required to pay approximately $97.2 million in Fees after accounting for fee credits and reimbursements. A portion of these total costs are allocated to each construction phase of the Project, as shown Figure E-1 below.
Figure E-1 Delta Cove
Estimated Project Costs and Fees Phase
Build-Out One Two Three Four
Funding Uses
Total Public Facilities Costs $22,219,495 $7,312,815 $13,160,455 $10,395,805 $53,088,570
Development Impact Fees $26,591,132 $22,763,220 $16,767,019 $15,320,603 $81,441,974
Regional Infrastructure Fees $4,290,052 $2,819,382 $2,051,764 $1,922,632 $11,083,830
Capital Replacement Fees $1,825,096 $1,199,436 $872,872 $817,936 $4,715,340
Total $54,925,775 $34,094,853 $32,852,110 $28,456,976 $150,329,714
DTA selected the formation of a Community Facilities District (“CFD”) as the most appropriate funding mechanism to finance the cost of Public Facilities and Fees. Following its formation under Scenario 1, the CFD will be expected to issue bonds in four phases that are anticipated to occur in 2011, 2014, 2016 and 2018, which correspond to the cost/construction phasing for the Project. Two CFD structuring parameters will be satisfied for each of the four bond series;(i) the value of the land, including existing improvements and bond-funded improvements, will equal no less than three times the par amount of the bonds on the date they are issued, and (ii) the annual payments associated with the amount of bonds issued, referred to in this report as the annual burden or Special Tax, will not exceed 1.8% of the lowest estimated residential property value from which the annual payments are received. Under Scenario 2, the CFD will be expected to issue bonds in 2011, 2015, 2018 and 2021. The two CFD structuring parameters listed above are also satisfied in Scenario 2.

EXECUTIVE SUMMARY
Delta Cove Page iii Public Facilities Financing Plan August 25, 2010
PUBLIC FACILITIES FINANCING PLAN CONCLUSIONS
As identified in the CFD Special Tax and Bonding Capacity Analysis (Scenario 1) included as Attachment 4, the Project will support a total of $63,255,000 in bonds, from which $48,417,485 will be available as CFD proceeds to finance Public Facilities and Fees. The CFD bonds will be issued in four phases and the proceeds associated with each bond issue are shown in Figure E-2 below.
Figure E-2 Delta Cove Scenario 1
CFD Proceeds by Phase Phase
Build-Out One Two Three Four
CFD Bonded Indebtedness $23,000,000 $13,000,000 $15,000,000 $12,255,000 $63,255,000
CFD Proceeds $16,795,834 $10,233,695 $11,771,027 $9,616,929 $48,417,485
Scenario 2 utilizes reduced sales prices and special taxes. As a result, the bonding capacity for each phase is lower than in Scenario 1. Under Scenario 2, the Project will support a total of $59,045,000 in bonds and yield $45,216,807 in construction proceeds. The CFD will levy a Special Tax on taxable property within the Project to pay principal and interest on the outstanding bonds. The Special Tax would constitute an annual burden and for residential land uses, this burden is allocated based on square footage ranges set up for each property type within the Project, while conforming to the City’s requirements for a maximum tax rate of 1.8% of the lowest estimated value of the property. For non-residential property, the annual burden is based upon the construction cost, not to exceed 1.8% of this amount. Under Scenario 1, the proposed Special Taxes for residential property will range from $1,334 per unit up to $3,842 per unit. The proposed Special Tax for non-residential property is $0.55 per square foot. The CFD will provide financing for $48,417,485 of the $150,329,714 required for the construction of Public Facilities and Fees. The remaining $101,912,229 constitutes a net one time burden that will be financed through other funding sources including State and Federal grants and loans, other bond financing programs, conventional loans and private equity. These mechanisms are discussed in greater detail in Section IV. Figure E-3 below summarizes the sources and uses of funding in the Project.

EXECUTIVE SUMMARY
Delta Cove Page iv Public Facilities Financing Plan August 25, 2010
Figure E-3 Delta Cove Scenario 1
Funding Sources and Uses
Phase
Build-Out One Two Three Four
Funding Uses Total Public Facilities Costs $22,219,495 $7,312,815 $13,160,455 $10,395,805 $53,088,570
Development Impact Fees $26,591,132 $22,763,220 $16,767,019 $15,320,603 $81,441,974
Regional Infrastructure Fees $4,290,052 $2,819,382 $2,051,764 $1,922,632 $11,083,830
Capital Replacement Fees $1,825,096 $1,199,436 $872,872 $817,936 $4,715,340
Total Costs $54,925,775 $34,094,853 $32,852,110 $28,456,976 $150,329,714
Funding Sources
CFD Proceeds $16,795,834 $10,233,695 $11,771,027 $9,616,929 $48,417,485
Other Sources $38,129,941 $23,861,158 $21,081,082 $18,840,047 $101,912,229
Under Scenario 1, the net one-time burden is expected to be between $70,170 and $71,446 per market rate unit, depending on the development type and square footage. In order for the Project to be feasible, the net one-time burden must be considered a reasonable percentage of anticipated sales prices by Spanos. Based on projected sales prices, the net one-time burden per unit will range from 12.60% to 25.70% of the minimum sales price of the for-sale residential units, with the total project-wide net burden equal to 20.04% of the value of the Project. Spanos bases project feasibility on, among other factors, the original purchase price as well as the net one-time burden. Although some of the units exceed the recommended burden to value ratio, the Project satisfies the net burden test as a whole. Due to the low purchase price of land, Spanos anticipates that the range of net one-time burden identified will be more than reasonable and the Project will be feasible. Under Scenario 2, the net one-time burden ranges from $71,909 to $74,923 per single family residential unit. The net burden is slightly higher because the lower sales prices result in a reduced CFD bonding capacity and a greater need for private equity funding. The net burden as a percentage of sales price is between 15.15% and 30.18% with an overall burden to value ratio of 23.88%. The main reason for the increase in the percentage burden is the reduced sales prices. Spanos has acknowledged that the assumptions under Scenario 2 represent market conditions under which the Project would not be feasible. If these

EXECUTIVE SUMMARY
Delta Cove Page v Public Facilities Financing Plan August 25, 2010
conditions prevailed, Spanos would not commence development of the Project until the housing market within the City of Stockton has improved. As a result, Scenario 1 represents the more realistic scenario going forward. Scenario 2 would most likely result in Spanos choosing to delay development of the Project.

I. INTRODUCTION
Delta Cove Page 1 Public Facilities Financing Plan August 25, 2010
A. PURPOSE OF THE REPORT
The Public Facilities Financing Plan (the “PFFP”) provides an analysis of the costs associated with the construction of Delta Cove (the “Project), which include costs associated with backbone infrastructure (“Public Facilities”) as well as costs associated with development impact fees (the “Fees”) imposed by the City of Stockton (the “City”) and other agencies, and the sources available to the Project to fund these costs.
DTA’s specific objectives in preparing this PFFP are to (1) identify the required public capital facilities costs and phasing for the Public Facilities and Fees, (2) select the appropriate public finance mechanism(s) to pay for Public Facilities costs and Fees, (3) compute the annual and total financing burden for the financing mechanism that will support the necessary infrastructure, (4) provide an evaluation of the overall feasibility of the public financing component of the PFFP, subject to public policy and market constraints, and (5) provide an implementation blueprint for the City.
B. ORGANIZATION OF REPORT
The PFFP text is divided into seven sections: (i) introduction, (ii) Project description, (iii) Project specific facilities and costs estimates, (iv) description of proposed financing mechanisms, (v) public financing strategy, (vi) conclusions and (vii) services financing. DTA has prepared a financing plan for two separate scenarios. The PFFP text and analysis focus chiefly on Scenario 1 (Attachment 4), which represents a likely scenario for Project development. However, a second analysis was prepared to allow the City to evaluate a worst-case scenario, including reduced sales prices and a longer absorption period. Overall changes in the fiscal impacts of the Project that would result under Scenario 2 are identified in the text, and the actual analysis of this alternate scenario may be found in Attachment 5.
C. PFFP TEMPLATE/GUIDELINES DISCUSSION
The analysis presented herein adheres to a set of templates and guidelines (the “Guidelines”) that have been approved by the City. The templates identify the contents and structure that should be incorporated into fiscal and financial studies, while the guidelines provide specific assumptions and methodologies to use in the fiscal and financial analyses. Together, the templates and guidelines were established to direct the preparation of all fiscal impact and public financing analyses in the City, promote consistency in the analyses across development projects, and facilitate the peer review process. They are the result of an exhaustive process involving City staff, Goodwin Consulting Group (“GCG”), and financial consultants for each of the major development projects proposed in the City. City staff completed a series of extensive analyses to support a variety of the assumptions and approaches contained in the guidelines. While the templates and
I. INTRODUCTION
Delta Cove Page 2 Public Facilities Financing Plan August 25, 2010
guidelines are still evolving and subject to change, the analysis presented herein is based on the set of guidelines in effect at the time this report was prepared. Note that the templates and guidelines are not meant to be a strict prescription for completing the studies; rather, they serve together as a “manual,” and the manual’s directions can be adjusted as project circumstances warrant and deviations from the manual can be justified.
D. PFFP PEER REVIEW DISCLAIMER
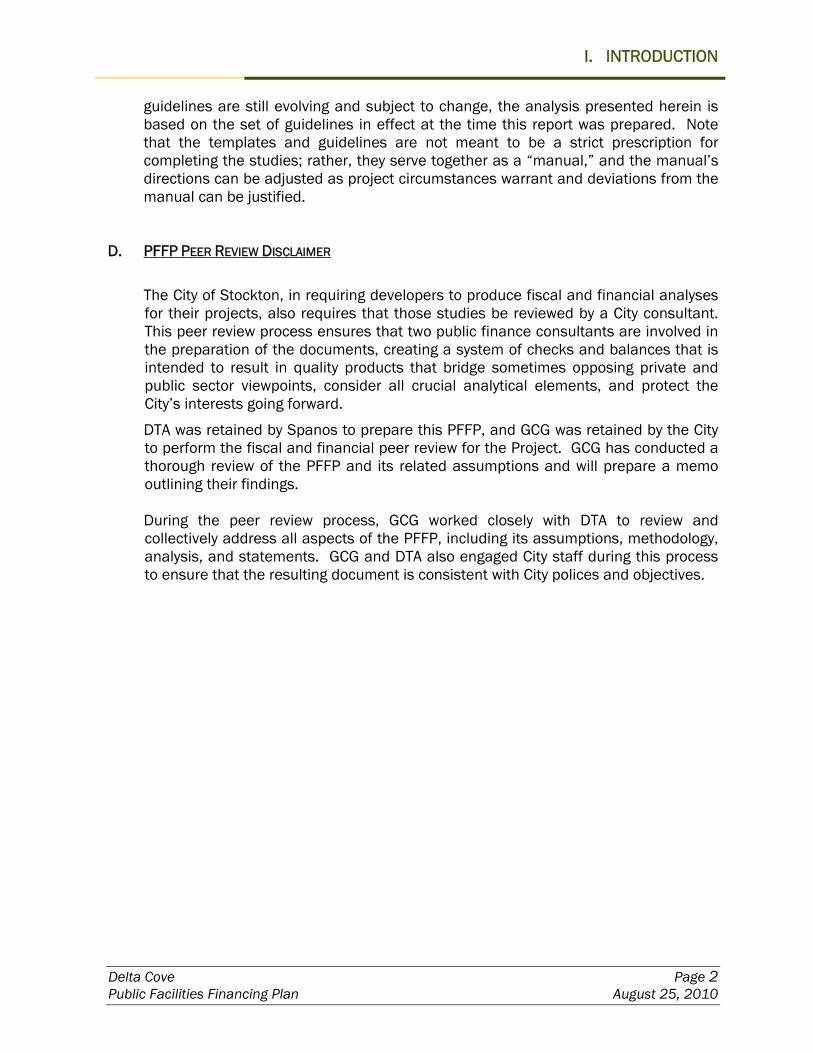
The City of Stockton, in requiring developers to produce fiscal and financial analyses for their projects, also requires that those studies be reviewed by a City consultant. This peer review process ensures that two public finance consultants are involved in the preparation of the documents, creating a system of checks and balances that is intended to result in quality products that bridge sometimes opposing private and public sector viewpoints, consider all crucial analytical elements, and protect the City’s interests going forward.
DTA was retained by Spanos to prepare this PFFP, and GCG was retained by the City to perform the fiscal and financial peer review for the Project. GCG has conducted a thorough review of the PFFP and its related assumptions and will prepare a memo outlining their findings. During the peer review process, GCG worked closely with DTA to review and collectively address all aspects of the PFFP, including its assumptions, methodology, analysis, and statements. GCG and DTA also engaged City staff during this process to ensure that the resulting document is consistent with City polices and objectives.

II. PROJECT DESCRIPTION
Delta Cove Page 3 Public Facilities Financing Plan August 25, 2010
A. LOCATION, LAND USES, AND RELATED ASSUMPTIONS The Project, which consists of 360 acres located within the City, will establish a community of 1,105 single family detached homes, 440 attached units and 31,000 square feet of non-residential development. The Project will also include several parks, a 14 acre school site, and improvements to public services and infrastructure necessary to serve the Project. See Attachment 1 for detail on the anticipated layout of the Project.
B. PROJECT ABSORPTION/PHASING
With construction expected to commence in 2013, the Project is anticipated to be built out by 2021. Figure 1 below summarizes the anticipated absorption for the development of the Project under Scenario 1, as provided by Spanos.
Figure 1
Delta Cove Scenario 1
Development Absorption

III. PROJECT SPECIFIC FACILITIES AND COST ESTIMATES
Delta Cove Page 4 Public Facilities Financing Plan August 25, 2010
A. BACKBONE INFRASTRUCTURE
In order to support the Project, Spanos will be required to construct approximately $53.1 million in backbone infrastructure, including sewer, water, drainage and street improvements, in addition to other Public Facilities. A summary of the Public Facilities costs required to support the Project is delineated in Figure 2 below.
Figure 2
Delta Cove Public Facilities Cost Summary
Facilities Total Estimated Cost
Site Preparation $3,285,000
Sanitary Sewer $1,663,950
Water System $2,928,841 Storm Drainage $5,325,550
Street Work $9,348,470
Street Lighting $259,000
Striping & Signs $379,550
School $586,779
Wetlands $5,000,000
Parks $16,180,000
Trinity Street $3,555,305
Otto Street $1,876,125
Miscellaneous $2,700,000
Total $53,088,570 Source: A.G. Spanos and David Taussig & Associates, Inc.

III. PROJECT SPECIFIC FACILITIES AND COST ESTIMATES
Delta Cove Page 5 Public Facilities Financing Plan August 25, 2010
B. FACILITIES TIMING/PHASING
Under Scenario 1, the Project is expected to be sold to a merchant builder in four takedowns. Based on the timing and the separate villages of the Project associated with these takedowns, the construction of public infrastructure can be divided into four distinct phases:
Phase One. (2012 - 2015) Backbone roads, sanitary sewer, water system, street
lighting, striping and signs, and storm drain construction commences. Trinity Drive completed.
Phase Two. (2015 - 2017) Backbone roads partially completed. Construction on the remainder of the backbone roads, sanitary sewers, water system, street lighting, striping and signs, and storm drains continues.
Phase Three. (2017 - 2019) Wetland conservation commences. Otto Drive completed.
Phase Four. (2019 - 2021) Backbone roads, sanitary sewer, water system, street lighting, striping and signs and storm drain construction completed.
The infrastructure and development associated with each phase is identical under both scenarios. However, Scenario 2 evaluates a 14-year buildout period, whereas Scenario 1 analyzes a 9-year buildout period. A detailed description of the phasing and timing associated with Scenario 2 may be found in Attachment 5. The Public Facilities summarized in Figure 2 and their costs are disaggregated into phases in Figure 3, below. See Attachment 3 for a more detailed description of Public Facilities costs and timing.

III. PROJECT SPECIFIC FACILITIES AND COST ESTIMATES
Delta Cove Page 6 Public Facilities Financing Plan August 25, 2010
Figure 3
Delta Cove Public Facilities Costs, Disaggregated by Phase
PHASE
FACILITY ONE TWO THREE FOUR TOTAL
Site Preparation $1,214,000 $680,000 $758,500 $632,500 $3,285,000
Sanitary Sewer $518,050 $384,350 $440,875 $320,675 $1,663,950
Water System $1,025,076 $562,885 $861,380 $479,500 $2,928,841
Storm Drainage $3,882,525 $477,625 $571,225 $394,175 $5,325,550
Street Work $3,034,260 $2,097,955 $2,331,850 $1,884,405 $9,348,470
Street Lighting $87,000 $51,000 $79,000 $42,000 $259,000
Striping & Signs $74,000 $64,000 $139,000 $102,550 $379,550
School $586,779 $0 $0 $0 $586,779
Wetlands $0 $0 $2,500,000 $2,500,000 $5,000,000
Parks $6,670,000 $2,495,000 $3,475,000 $3,540,000 $16,180,000
Trinity Street $2,655,305 $0 $900,000 $0 $3,555,305
Otto Street $1,272,500 $0 $603,625 $0 $1,876,125
Miscellaneous $1,200,000 $500,000 $500,000 $500,000 $2,700,000
TOTAL $22,219,495 $7,312,815 $13,160,455 $10,395,805 $53,088,570
C. LAND DEDICATION/ RIGHT-OF-WAY COSTS
Spanos is expected to dedicate land required by the Project for streets, parks, schools and open space. Consequently, right-of-way and other land acquisition costs for the Project are not included in the cost of Public Facilities, shown in Figure 3 above.
D. IMPACT FEES
To offset regional infrastructure costs that the City will incur to support the residents of the Project, Spanos will be required to pay the City’s existing impact fees as well as additional proposed fees that will be required of projects included in the City’s recent General Plan Amendment. The City’s existing impact fees, as described in the Guidelines, are listed in Figure 4, below.

III. PROJECT SPECIFIC FACILITIES AND COST ESTIMATES
Delta Cove Page 7 Public Facilities Financing Plan August 25, 2010
Figure 4
City of Stockton Development Impact Fees
Residential Land Uses
Non-Residential Use
Low/Medium High
General Office
Total Per Unit $51,391 $27,566
Total Per KSF Fees $30,174 $18,976
Total Per SF $4.13 $2.97
Total Per SF Fees $1.69 $4.16
Total Per Acre $20,741 $18,558
Total Per Acre Fees $20,584 $20,791
Subtotal Residential $78,574,942 $8,849,062 Subtotal
Non-Residential $425,012 $475,802
Per Unit $62,115 $31,604
Per SF $35.42 $25.04
Admin $1,478 $745
Admin $0.86 $0.59
Trinity Parkway Reimbursement ($2,518) ($1,133)
Trinity Parkway Reimbursement ($2.32) ($1.35)
Parkland Reimbursement ($560) ($343)
Parkland Reimbursement $0.00 $0.00
School Site Reimbursement ($3,348) ($1,360)
School Site Reimbursement ($0.20) ($0.20)
Per Unit Total $57,166 $29,513
Per SF Total $33.76 $24.08
TOTAL RES $72,315,534 $8,263,773 TOTAL NON-RES $405,068 $457,563 Notes: Agricultural Land Mitigation fee not included above pursuant to discussions with City Planning Department. Reimbursement
estimates based on discussions with City, SJCOG and School District staff. Please see Attachment 2 for further details. E. OTHER AGENCY FEES
The Guidelines specify other City-wide and regional infrastructure costs that are not part of existing City development impact fee programs. This PFFP assumes that these infrastructure needs will be added to the City’s development impact fee program before Spanos begins construction of the Project. The regional infrastructure fee was provided in the Guidelines as a special tax of $500 per unit that would be collected annually through a CFD. Spanos has elected, with the City’s approval, to pay this amount in the form of a one-time impact fee. The amount of the fee was calculated based on the amount of facilities that a CFD on the project could support based on this specified special tax level. Based on the CFD analysis for the Project (see Attachment 4), each dollar of special taxes will support approximately $14.35 in construction proceeds under Scenario 1. As a result, the regional infrastructure impact fee is estimated to be $7,174 per unit for Scenario 1. The amount of facilities supported under Scenario 2 would be slightly different. However, to keep the fees and costs consistent between the two scenarios, the regional infrastructure impact fee of $7,174 was also used for Scenario 2.

III. PROJECT SPECIFIC FACILITIES AND COST ESTIMATES
Delta Cove Page 8 Public Facilities Financing Plan August 25, 2010
The Guidelines also require a Public Works budget increase for all new development Citywide of $11 million annually to pay for deferred maintenance and replacement of City buildings and fixed assets. Spanos has again elected, with the City’s approval, to mitigate this requirement through the payment of a one-time impact fee. The Project’s fair share of the $11 million budget increase is equal to $141,482 per year. When divided among the 1,545 units in the Project and discounted by the City’s reinvestment interest rate of approximately 3%1, the proposed fee is estimated to equal $3,052 per unit.
Expected future impact fees under both scenarios, as approved by the City, are described in Figure 5.
Figure 5
Other Agencies Capital Facilities and Regional Infrastructure Fees
Other Facility Fees Average Fee/
Unit Total Fee
Regional Infrastructure $7,174 $11,083,830
Capital Replacement $3,052 $4,715,340 Total $10,226 $15,799,170
Source: City of Stockton – Community Development Department, Building Division.
1 The reinvestment interest rate earned by the City is preliminary, subject to change.

IV. DESCRIPTION OF PROPOSED FINANCING MECHANISMS
Delta Cove Page 9 Public Facilities Financing Plan August 25, 2010
In preparing the Public Facilities Financing Plan for the Project, DTA’s intent was to ensure that the goals, objectives, and policies of the City are properly implemented and that the following general objectives are addressed:
• All Public Facilities required within the Project are adequately financed and provided
in a timely manner; • Any public financing utilized is equitable, financially feasible, efficiently utilized and
consistent with City guidelines and accepted public policy; • Public financing mechanisms avoid creating a financial and administrative burden to
the City; and • Private sector financing will be required to fund all Public Facilities other than those
specifically identified by the City as backbone infrastructure. • The project will have a zero net effect on the City’s general fund on an annual basis.
A variety of financing mechanisms are available to fund public improvements in California. The advantage of most of these programs is that they provide tax-exempt financing at significantly lower interest rates than are available through the use of construction loans and other forms of conventional financing.
• General Obligation Bonds • Community Facilities Districts • Special Assessment Districts • Infrastructure Financing Districts • Certificates of Participation • Lease Revenue Bonds • Public Enterprise Revenue Bonds • Development Impact Fee Programs
Based on Spanos’ concerns regarding the imposition of additional burdens on the City’s General Fund and existing taxpayers, DTA limited its analysis to those financing mechanisms that would be solely the responsibility of the property owners located within the Project itself. This criterion eliminated a number of financing options, including General Obligation Bonds, Lease Revenue Bonds or Certificates of Participation, all of which would require backing by the City’s General Fund and/or higher ad valorem property tax rates from existing property owners in order to be sold in the conventional municipal bond market. Public Enterprise Revenue Bonds can potentially provide future financing for sewer and water improvements, but Spanos has no current plans to request that the City issue these types of bonds for facilities within the Project. DTA also eliminated project-specific Development Impact Fee Programs as an effective source of financing, as the collection of fees as development occurs will not provide a sufficient level of funding to build the Public Facilities in a timely manner. The City may decide to utilize development fees on a City-wide or local basis at some point in the future to lessen the need for bond financing or to supplement or

IV. DESCRIPTION OF PROPOSED FINANCING MECHANISMS
Delta Cove Page 10 Public Facilities Financing Plan August 25, 2010
reimburse private sources of financing, but it is unlikely that a sufficient amount of fees would be collected to cover 100% of the upfront costs required to fund any of the Public Facilities prior to their being needed to support development. Additionally, it would not be possible to sell revenue bonds backed by these future impact fees, as there would be no assurance to bondholders as to when or if the future development generating the fees to repay these bonds would actually occur. DTA has identified three types of land-secured financing districts that would rely solely on property taxes collected from new development within the Project and would not be backed by the City’s General Fund. DTA has also included public finance opportunities made available through the passage of the American Recovery and Reinvestment Act of 2009 (“ARRA”), as well as State propositions and Federal grant programs. Each of these mechanisms is summarized below.
LAND SECURED FINANCING DISTRICTS
A. Mello-Roos Community Facilities Act of 1982 1. Introduction
The Mello-Roos Community Facilities Act (the "Act") [Section 53311 et. seq. of the Government Code] was enacted by the California State Legislature in 1982 to provide an alternate means of financing public infrastructure and services subsequent to the passage of Proposition 13 in 1978. The Act complies with Proposition 13, which permits cities, counties, and special districts to create defined areas within their jurisdiction and, by a two-thirds vote within the defined area, impose special taxes to pay for the public improvements and services needed to serve that area. The Act defines the area subject to a special tax as a Community Facilities District ("CFD"). A CFD may provide for the purchase, construction, expansion, or rehabilitation of any real or other tangible property with an estimated useful life of at least five years. A CFD may also finance the costs of planning, design, engineering, and consultants involved in the construction of improvements or formation of the CFD. The facilities financed by the CFD do not have to be physically located within the CFD. Formation of a CFD authorizes a public agency to levy a special tax on all taxable property within the CFD in the manner prescribed in the formation documents. Property owned or irrevocably offered to a public agency is generally exempted from the special tax. CFD special taxes are collected at the same time and in the same manner as property taxes, unless otherwise specified by the agency. These special taxes may be used to pay debt service on bonds sold to provide funding for the construction or acquisition of public capital facilities. Additionally, these special taxes may also be used to pay directly for facilities and/or public services.

IV. DESCRIPTION OF PROPOSED FINANCING MECHANISMS
Delta Cove Page 11 Public Facilities Financing Plan August 25, 2010
CFD bonds can be short or long-term obligations. Typically, long-term bonds have either a twenty-five or thirty year maturity. Short-term notes or bonds can be issued to provide interim funding; these obligations are then retired when another source of revenue becomes available.
2. Application to the Project
Using industry standards for the amount of special taxes levied and
indebtedness incurred, the projected residential land uses and improved property values within the Project can support the use of long-term CFD bonds to fund the entire estimated Public Facilities costs allocable to this new development. Long-term bonds would be issued in the early stages of development in order to finance the acquisition and construction of the Public Facilities required in the immediate future. Furthermore, a taxing methodology would be devised identifying the tax levels required by different types of residential development at various stages throughout build out of the Project. Therefore, these long-term bonds would be retired initially by the developers within the Project, and eventually as homes and other development are constructed and sold, individual home owners and property owners within the Project would retire the remainder of the debt.
3. Advantages
There are many advantages to CFD financing. CFD bonds permit the funding
of infrastructure as needed, unlike most pay-as-you-go mechanisms such as development impact fee programs. CFD bonds are non-recourse to the issuer, so the City’s General Fund and taxing authority are not at risk. CFD bonds are tax-exempt, resulting in interest rates which are lower than conventional financing. CFDs have particularly broad powers and can finance a wide range of public facilities including libraries, parks, open space, public administration buildings, police and fire stations, and schools as well as roads, sewer, water, and storm drain improvements. CFDs can also finance certain services such as police and fire protection, recreation programs, library services, park and open space maintenance, storm drain maintenance, school facilities maintenance, etc.
CFDs also permit flexible special tax apportionment methodologies. The
special tax can be structured to adapt to changes in land use which inevitably occur with large developments.
4. Disadvantages
Since CFD bonds are land secured, the willingness of property owners to pay
their annual special taxes may be affected by reductions in land values, and the interest rates on these bonds are generally 75 to 125 basis points higher than bonds secured by the City’s General Fund. Furthermore, a CFD can only be established with the support of two-thirds of the qualified electors within the CFD. If fewer than twelve registered voters reside within the proposed

IV. DESCRIPTION OF PROPOSED FINANCING MECHANISMS
Delta Cove Page 12 Public Facilities Financing Plan August 25, 2010
district boundaries, the formation of a CFD requires an election of property owners. If more than twelve registered voters reside within the proposed district boundaries, an election of registered voters will be required. As the parcels being included within the CFD are anticipated to be undeveloped at the time of formation, it is hoped that the property owners will support the CFD formation and the levy of special taxes in return for entitlements that will let their projects proceed.
Since a CFD results in a lien that is in the form of an obligation to pay the
annual special tax rather than an allocation of the bonded indebtedness, prepayments can be cumbersome. Although the Mello-Roos Act does not provide an explicit formula for calculating a prepayment amount, a prepayment formula can be approved as part of the district formation.
B. 1913/1915 Act Assessment Bonds
1. Introduction
In 1979, the California Court of Appeals, in County of Fresno vs. Malmstrom, ruled that special benefit assessments levied pursuant to the Improvement Act of 1911 and Municipal Improvements Act of 1913 are not "special taxes" under Proposition 13's definition of such taxes. The result of this decision was a proliferation of Special Assessment Districts ("ADs") throughout the State during the 1980s, using the Municipal Improvements Act of 1913 to initiate proceedings for the formation of an AD, and the Improvement Bond Act of 1915 to issue bonds. These Acts provide mechanisms for issuers to construct or acquire public improvements, to apportion the costs through liens against the properties in a designated area which directly benefit from the improvements (the "Assessment District"), and to finance the liens through the issuance of tax-exempt bonds.
Each parcel of property within an AD is assessed a portion of the costs of the
public improvements and/or services to be financed by the AD, based on the proportion of special and direct benefit from these public improvements and/or services received by that parcel. Assessment liens are levied at the time of formation of the AD and installment payments are collected along with property taxes on a semi-annual basis. Bonds issued pursuant to the 1915 Act are land secured obligations and, in the event of non-payment of assessments, the property can be sold at a foreclosure sale to generate revenues to payoff outstanding bonds.
Pursuant to Proposition 218, which was approved by the State’s voters in
1996, formation of an AD is subject to a majority ballot protest. Landowners have the opportunity to return their ballot either in protest or in favor of the formation of an AD. If a majority protest is received, the agency must abandon formation proceedings for a minimum of one year.

IV. DESCRIPTION OF PROPOSED FINANCING MECHANISMS
Delta Cove Page 13 Public Facilities Financing Plan August 25, 2010
2. Application to the Project
Public works improvements are eligible for AD financing to the extent that parcels within the district receive a special, measurable, local, and direct benefit from such improvements. Traditionally, improvements to be financed using an AD include streets and roads, water, sewer and flood control facilities, utility lines, and landscaping. Improvements that provide regional general benefit, such as the proposed fire station, the public parks and the school site, would be ineligible for this type of financing unless a determination could be made by the City that they would provide special and direct benefit only to the new development within the Project that will comprise the AD. Under Proposition 218, the burden of proof regarding the assignment of this special benefit would be the City’s responsibility, putting it at some legal risk. Furthermore, Proposition 218 requires that assessments be placed on public properties based on their level of benefit, so that the Public Facilities themselves would have to be assessed.
3. Advantages
AD bonds permit the funding of infrastructure as needed, unlike most pay-as-you-go programs. Similar to a CFD, AD bonds are non-recourse to the issuer, so the City’s General Fund and taxing authority are not at risk. AD bonds are tax-exempt, resulting in interest rates that are below those charged by conventional financing. Liens on parcels can be paid prior to issuance of bonds, and prepayment following the issuance of bonds is simpler in an AD when compared to a CFD. As mentioned previously, formation of an AD requires a majority of the ballots returned to be in support of their assessments, rather than the two-thirds requirement under a CFD.
4. Disadvantages
As Proposition 218 requires that all improvements and services funded by an
AD provide special, measurable, local, and direct benefit to the parcels within the AD, this financing mechanism could not be used to fund all of the Public Facilities unless the City was willing to make such a finding for these facilities. As the Public Facilities will clearly provide benefits to larger areas than the Project itself, and were in fact selected by the City for public financing for this very reason, the City is unlikely to make such a finding. Even if such a finding could be made, the fact that public properties would have to be assessed would be disadvantageous compared with a CFD, which does not have either of these requirements.

IV. DESCRIPTION OF PROPOSED FINANCING MECHANISMS
Delta Cove Page 14 Public Facilities Financing Plan August 25, 2010
C. Infrastructure Financing Districts
1. Introduction
In September 1990, the Governor Wilson approved Senate Bill ("SB") 308,
which provides for the formation of Infrastructure Financing Districts ("IFDs") to finance regional infrastructure needs. SB 308 extends the use of tax increment ("TI") financing to undeveloped areas within the boundaries of an IFD. IFD financing is similar to tax increment financing within redevelopment project areas, in that it uses ad valorem property tax revenues to pay for public improvements without imposing special taxes or assessments on the land.
An IFD may finance the purchase, construction, expansion, or improvement of
any real or tangible property with an estimated useful life of fifteen years or longer. Authorized facilities must be of community-wide significance and provide significant benefits to an area larger than the area of the proposed IFD. Examples of permissible projects include the following:
• Highways, interchanges, arterial streets, and transit facilities • Sewage treatment and water reclamation plants • Water collection and treatment facilities • Flood control levees and dams, retention basins, and drainage
channels • Child care facilities and libraries • Parks and open space • Facilities for the transfer and disposal of solid waste
When forming an IFD, a "base year" is identified; the ad valorem tax revenues
paid on the assessed property value in the base year continue to be passed through to the agencies that receive ad valorem tax revenues. However, the revenues that result from an increase in assessed value above the base year assessed value are called tax increment ("TI") revenues, and a portion of these revenues are retained by the IFD. An IFD can then issue bonds secured by the TI revenue it receives, or will receive, because of the continuing increase in assessed value. In order for the TI to be available to support debt, public agencies such as the City, County and local special districts would need to give up a share of their property tax revenues for this purpose.
2. Application to the Project
It is not anticipated that the City or other public agencies will be willing to
contribute a portion of their property tax revenues to help pay for the Public Facilities. However, if the City were willing to give up a portion of its share, this would be an excellent mechanism to finance the Public Facilities without requiring that a CFD special tax or AD assessment be added to a property owner’s tax bill.

IV. DESCRIPTION OF PROPOSED FINANCING MECHANISMS
Delta Cove Page 15 Public Facilities Financing Plan August 25, 2010
3. Advantages
IFDs provide a source of funding without requiring special taxes, assessments, or user fees. To minimize subsidy issues, TI revenues can be pledged to finance specific facilities benefiting the area from which they were generated. IFD bonds would not be considered City debt. TI revenues from taxing agencies that do not wish to give up any of their revenues can be excluded from the IFD. Likewise, an agency can specify the percentage of their TI revenues to be used.
4. Disadvantages
An IFD reduces general fund revenues for participating agencies, and therefore may not be politically or economically viable. Furthermore, IFDs in which residential development will occur must set aside twenty percent of such units for low and moderate-income housing.
ARRA FUNDING OPPORTUNITIES
A. Build America Bonds
ARRA allows state and local government to issue Build America Bonds (“BABs”) provided that such bonds are (1) not private activity bonds, (2) otherwise tax-exempt under existing law, and (3) issued with no more than a de minimis amount of original issue premium. Issuers may elect to receive a direct federal cash subsidy with respect to certain BABs (“Subsidy BAB”), or provide bondholders with a tax credit. Unlike traditional tax-exempt bonds or tax-credit bonds, BABs bear taxable interest for the holder. However, the federal government provides a tax benefit to issuers of BABs through a direct cash subsidy (with a Subsidy BAB) or to holders of BABs with a credit against federal income tax (with Credit BABs).

IV. DESCRIPTION OF PROPOSED FINANCING MECHANISMS
Delta Cove Page 16 Public Facilities Financing Plan August 25, 2010
B. Recovery Zone Bonds
Recovery Zone Bonds are targeted to areas particularly affected by job loss and will help local governments obtain financing for much needed economic development projects, such as public infrastructure development. Recovery Zone Facility Bonds and Recovery Zone Economic Development Bonds, respectively, have been made available to counties and municipal governments to support projects within a Recovery Zone. Recovery Zones are defined as any area designated by the governmental bond issuer as having significant poverty, unemployment, sale of home foreclosures or general distress. Included in this definition are areas generally distressed by closure or realignment of military installations and any local governments currently located within already designated Empowerment Zones or Renewal Communities.
Recovery Zone Facility Bonds are tax-exempt private activity bonds that can be used to finance costs related to construction, reconstruction, renovation or acquisition of depreciable private use property located within a Recovery Zone. Projects eligible for finance through this bond are any type of property other than residential property, golf courses, country clubs, massage parlors, hot tub facilities, sun tan facilities, race tracks, gambling facilities or liquor stores. The City of Stockton received a Recovery Zone Facility Bond allocation of $5.3 million. Recovery Zone Economic Development Bonds can be issued to finance public infrastructure, promote development or promote other economic activity (job training, etc) within a Recovery Zone. It is important to note that any project financed through the issuance of Recovery Zone Economic Development Bonds must comply with the prevailing wage requirements of the Davis-Bacon Act. The City of Stockton received a Recovery Zone Economic Development Bond allocation of $3.5 million.
C. Energy Bonds State and local governments, as well as public utility companies, are able to issue Clean Renewable Energy Bonds (“CREBs”) to finance a number of renewable energy generating facilities. CREBs are a traditional tax-credit bond designed to provide the issuer with a 70% interest subsidy. Bondholders are provided federal tax credits equal to 70% of the interest on the bonds. The balance of any interest is paid by the issuer. In addition to CREBs, Qualified Energy Conservation Bonds (“QECBs”) can be used by state and local government to fund a wider variety of energy-related expenditures, when compared to CREBs. Projects eligible to be financed with QECBs include research facilities, expenditures providing “green” communities, projects to promote energy conservation technologies, and public education campaigns.

IV. DESCRIPTION OF PROPOSED FINANCING MECHANISMS
Delta Cove Page 17 Public Facilities Financing Plan August 25, 2010
STATE PROPOSITIONS The California Strategic Growth Plan of 2006 consisted of five bond measures totaling over $42 billion. Approximately $26 billion has been committed, which leaves $16 billion available for future funding. Below is a summary of the components of each of the bond measures, which are all funded through various state and local programs. Funds are mostly made available to municipalities, whether it be formula based, or through a competitive process. However, there are a few programs for which a private entity is able to apply.
Proposition 1B enacts the Highway Safety, Traffic Reduction, Air Quality, and Port Security Bond Act of 2006 to authorize $19.9 billion of state general obligation bonds for specified purposes, including high-priority transportation corridor improvements, State Route 99 corridor enhancements, trade infrastructure and port security projects, school bus retrofit and replacement purposes, state transportation improvement program augmentation, transit and passenger rail improvements, state-local partnership transportation projects, transit security projects, local bridge seismic retrofit projects, highway-railroad grade separation and crossing improvement projects, state highway safety and rehabilitation projects, and local street and road improvement, congestion relief, and traffic safety. Most of these funds are distributed by local Council of Governments and transit authorities. Approximately $7 billion remains to be allocated.
Proposition 1C is the $2.9 billion affordable housing bond component of the Strategic Growth Plan. It invests $2.9 billion for housing and infrastructure programs to produce an estimated 118,000 housing units, 2,350 homeless shelter spaces, and infrastructure projects that help infill housing development such as water, sewer, parks, and transportation improvements. Just over $800 million remains to be allocated.
The $10.4 billion provided through Proposition 1D is needed to help build and maintain California’s education system. Slightly more than $7 billion was earmarked for the construction of new, modernization of existing, and creation of new charter, joint-use, and small high school facilities. In addition, new funding is provided for the creation of career technical education facilities; reduction of severely overcrowded sites; incentives for the construction of high performance "green" schools; and, the seismic mitigation of the most vulnerable school facilities. Approximately $4 billion is left to be allocated to benefit K-12 schools.
The Disaster Preparedness and Flood Protection Bond Act of 2006 (Proposition 1E) authorizes $4.1 billion in general obligation bonds to rebuild and repair California’s most vulnerable flood control structures to protect homes and prevent loss of life from flood-related disasters, including levee failures, flash floods, and mudslides and to protect California’s drinking water supply system by rebuilding delta levees that are vulnerable to earthquakes and storms. Just over $2 billion remains to be allocated.
The Safe Drinking Water, Water Quality and Supply, Flood Control, River and Coastal Protection Bond Act of 2006 (Proposition 84) authorizes $5.4 billion in general obligation

IV. DESCRIPTION OF PROPOSED FINANCING MECHANISMS
Delta Cove Page 18 Public Facilities Financing Plan August 25, 2010
bonds to fund safe drinking water, water quality and supply, flood control, waterway and natural resource protection, water pollution and contamination control, state and local park improvements, public access to natural resources, and water conservation efforts. $1.7 billion remains.
FEDERAL PROGRAMS
There are numerous funding programs to which a municipality or private company applies directly to the federal government. Below is a summary of two programs.
The US Department of Commerce, through the Economic Development Administration, provides grants to fund the construction or rehabilitation of essential public infrastructure and facilities necessary to generate or retain private sector jobs and investments, attract private sector capital, and promote regional competitiveness. The current program provides up to $3 million of matching grants, per project.
The US Department of Agriculture, though the Rural Communities Program, provides both grants and low-interest loans to fund infrastructure, as well as community facilities, that benefit rural communities across the nation.
In addition to public financing techniques described above, it will be necessary for private sector financing to fund the construction of many of the Public Facilities requirements for the Project. It is the responsibility of the developer to complete each proposed improvement, irrespective of the availability of public financing.

V. PUBLIC FINANCING STRATEGY
Delta Cove Page 19 Public Facilities Financing Plan August 25, 2010
A. TOTAL COSTS AND FEES
Section III of this report describes the Public Facilities and Fees necessary to complete the Project through buildout. The amount of Public Facilities and Fees associated with each phase of the Project can be calculated based on the Public Facilities necessary to support the construction of each phase and based on the number of residential units planned for each phase of the Project. Figure 6 below is a quantitative summary of the total Public Facilities and Fees associated with the Project, categorized by phase. These costs apply to both scenarios.
Figure 6 Delta Cove
Estimated Project Costs and Fees Phase
Build-Out One Two Three Four
Funding Uses
Total Public Facilities Costs $22,219,495 $7,312,815 $13,160,455 $10,395,805 $53,088,570 Development Impact Fees $26,591,132 $22,763,220 $16,767,019 $15,320,603 $81,441,974 Regional Infrastructure Fees $4,290,052 $2,819,382 $2,051,764 $1,922,632 $11,083,830 Capital Replacement Fees $1,825,096 $1,199,436 $872,872 $817,936 $4,715,340
Total $54,925,775 $34,094,853 $32,852,110 $28,456,976 $150,329,714
B. CFD FINANCING INTRODUCTION
DTA selected the establishment of a CFD and the subsequent sale of bonds as one of the appropriate mechanisms to fund the Project’s Public Facilities.
The concept of using an IFD was eliminated because an IFD would take future property tax increment within the Project away from the City’s General Fund (as well as from other taxing agencies’ General Funds), thereby indirectly impacting existing City taxpayers by limiting future property tax revenues that would be necessary to support the services provided to new development within the Project. This loss of revenue to the General Fund might force the City to reduce service levels to existing taxpayers in order to provide services to the new development, which would be politically untenable.
The concept of an Assessment District was eliminated because many of the Public Facilities under consideration for public financing provide general benefit to a larger area than just the Project, so that it would be precarious to the City from a legal

V. PUBLIC FINANCING STRATEGY
Delta Cove Page 20 Public Facilities Financing Plan August 25, 2010
perspective to assign all of the Public Facilities’ costs to only new development within the Project.
A CFD was clearly the best choice, as it is non-recourse to the City’s General Fund and can fund any public improvement with a useful life of five years or more, regardless of who benefits from the improvement. In short, a CFD is a more flexible mechanism than an AD in terms of the types of improvements that can be funded, the method by which special taxes for the improvements can be apportioned among properties, and the ability to pay directly for construction without incurring debt and/or public services (if necessary). Furthermore, unlike an Assessment District, a CFD is not required to place a lien on publicly-owned property benefiting from improvements, so no public agency will be responsible for any debt service payments by virtue of the fact that they own property within the CFD. This analysis assumes a separate assessment for park maintenance. DTA has prepared under separate cover, a comprehensive Fiscal Impact Analysis (“FIA”), which estimates the Project to result in fiscal neutrality as it relates to the impact of the Project on the City. Figure 7 below summarizes all the assumption utilized in the CFD analysis.
Figure 7
Delta Cove CFD Bond Assumptions
Description Series 2011 Series 2014 Series 2016 Series 2018
Bonded Indebtedness $23,000,000 $13,000,000 $15,000,000 $12,255,000
Construction Proceeds $16,795,834 $10,233,695 $11,771,027 $9,616,929
Average Coupon Rate 6.25% 6.50% 6.75%
Bond Term 30 years
Cost of Issuance 3.0%
Reserve Fund 10.0%
Debt Service 2.0% escalating
Special Tax Increase prior to Building Permit 4.0%
Special Tax Increase after Building Permit 2.0%
Minimum Coverage 110%

V. PUBLIC FINANCING STRATEGY
Delta Cove Page 21 Public Facilities Financing Plan August 25, 2010
C. CFD PROCEEDS
Under an escalating debt service scenario and a maximum effective tax rate of 1.80% of the estimated value of residential properties as specified in the Guidelines and as summarized in Figure 7 above, the project would support $63,255,000 in bonded indebtedness, from which approximately $48,417,485 in construction proceeds would be generated. Proceeds from CFD bond issuances are expected to finance 91% of the total Public Facilities costs ($53,088,570). According to this analysis, the 2011 bond series will generate 76% of the needed proceeds to pay for the Public Facilities required for Phase 1 ($22,219,495). Similarly, the 2014 bond series will generate 140% of the needed proceeds to pay for the Public Facilities required for Phase 2 ($7,312,815), the 2016 bond series will fund 89% of the Public Facilities required for Phase 3 ($13,160,455) and the 2018 bond series will generate 93% of the needed proceeds to pay for the Public Facilities required for Phase 4 ($10,395,805) under Scenario 1. The lower special taxes utilized in Scenario 2 would support a total of $59,045,000 in bonded indebtedness and yield $45,216,807 in construction proceeds. Under this scenario, only 85% of the total Public Facilities costs would be paid for with CFD proceeds.
D. CFD VALUE TO LIEN ASSUMPTION
As previously stated, the construction of the Public Facilities requires that CFD bonds be issued to offset the facilities burden associated with the Project. To issue CFD bonds, the land that secures the bonds must be worth at least three times the amount of bonds issued, as determined by an independent appraiser. The projected amount for the 2011 bond series under Scenario 1, as summarized in Figure 7 above is $23,000,000. Therefore, the appraised value of the Project must be worth approximately $69,000,000 at the time of bond issuance, including any existing improvements and the Public Facilities to be financed through the bond issue, to meet the statutory requirements to sell CFD bonds. It is assumed that the subject property, with full entitlements and some vertical construction will be worth at least that amount in 2011. If the value-to-lien ratio is not fulfilled, credit enhancements may be required or the amount of bonds issued may need to be reduced.
Similarly, for the 2014, 2016 and 2018 bond series under Scenario 1, the land value, including existing improvements and the CFD-financed improvements, must be worth approximately $108,000,000, $153,000,000 and $189,765,000, respectively. It was assumed, for purposes of this analysis that the subject property will be worth at least three times the bond amounts in 2011, 2014, 2016 and 2018 under both scenarios.

V. PUBLIC FINANCING STRATEGY
Delta Cove Page 22 Public Facilities Financing Plan August 25, 2010
E. ANNUAL BURDEN ANALYSIS
Utilizing conservative interest rate assumptions for CFD bond issuances (see Figure 7), the assigned CFD special taxes for residential property under Scenario 1 would range from $1,334 to $3,842 per unit annually, with total property tax rates not exceeding 1.80% of the base home sales prices. For non-residential property, the special tax was calculated to reflect 1.80% of the estimated per square foot cost to construct, which equaled $0.55 per square foot. As permitted under California law, it was assumed that CFD special taxes will escalate by an amount of 2% per year after building permit issuance. To capture all available capacity from increasing home prices, the maximum CFD special taxes escalate by 4% per year prior to building permit issuance. In the instance that special tax levels exceed the 1.8% threshold, Spanos will initiate a special tax buydown to bring each residential unit into compliance. Figure 8 summarizes the annual burden on the development expected to occur within the Project.
Figure 8 Delta Cove Scenario 1
Developed Property Sales Prices, CFD Special Tax Rates, And Total Property Tax Percentages
(2% Escalating Debt Service)
Development Type Lowest Sales Price (2009$)
Assigned Annual Special Tax (FY
2009-10)
Estimated Assigned
Special Tax Rate *
Single Family Detached ( > 2,550 SF) $566,846 $3,842 1.80%
Single Family Detached (2,151 – 2,550 SF) $410,967 $2,755 1.80%
Single Family Detached (1,751 – 2,150 SF) $361,345 $2,409 1.80%
Single Family Detached (1,551 – 1,750 SF) $307,913 $2,036 1.80%
Single Family Detached (1,401 – 1,550 SF) $285,741 $1,882 1.80%
Single Family Detached (< = 1,400 SF) $273,074 $1,793 1.80%
Single Family Attached ( > 1,600SF) $329,539 $2,187 1.80%
Single Family Attached (< = 1,600 SF) $304,478 $2,012 1.80%
Apartment Property $207,179 $1,334 1.80%
Non-Residential Bldg. SF $81 $0.55 1.80% *Estimated assigned Special Tax Rate includes ad valorem taxes and other existing and projects overlapping special taxes and assessments.
Under Scenario 2, the assigned CFD special taxes for residential property under Scenario 1 would range from $1,150 to $3,338 per unit annually, with total property tax rates not exceeding 1.80% of the reduced base home sales prices.

V. PUBLIC FINANCING STRATEGY
Delta Cove Page 23 Public Facilities Financing Plan August 25, 2010
F. TOTAL BURDEN ANALYSIS
As shown in Figure 6 above, the total costs associated with the Project amount to $150,329,714, which is comprised of $97,241,144 in Fees and $53,088,570 in Public Facilities costs. Utilizing a 2% escalating debt service and special taxes scenario and the bond assumptions specified in Figure 7, the assigned special taxes summarized in Figure 8 would generate approximately $48,417,485 in construction proceeds to finance the costs related to the Public Facilities for the Project.
Utilizing the Special Taxes summarized in Figure 8, the CFD proceed amount per unit is calculated as the portion of the CFD Proceed amount (that corresponds to the Total Special Tax assigned to that unit) as a fraction the sum of the Special Taxes for all units in the Project.
Following similar cost allocation methodology, the Public Facilities cost per unit is calculated as follows:
Note: S.T. per Unit, denotes Assigned Annual Special Tax summarized in Figure 8.
The Total Public Facilities Cost summarized in Figure 6 and Total Fees in Figure 4 and 5 comprise the Total Gross One Time Burden. The Total Net One Time Burden is equal to that Total Gross One Time Burden less the amount of CFD proceeds per unit. Figure 9 summarizes the Total Gross One Time Burden and the Total Net One Time Burden per unit under Scenario 1.
CFD Proceeds per Unit = (S.T. per Unit) × (Total CFD Proceeds) Σ [(S.T. for ea. Development Type) × (# of units in ea. Development Type)]
Public Facilities per Unit = (S.T. per Unit) × (Total Public Facilities Cost) Σ [(S.T. for ea. Development Type) × (# of units in ea. Development Type)]

V. PUBLIC FINANCING STRATEGY
Delta Cove Page 24 Public Facilities Financing Plan August 25, 2010
Figure 9
Delta Cove Total Gross/Net One Time Burden Analysis
Per Unit for Residential Development Per Building SF for Non-Residential Development
Development Type Public Facilities CFD Proceeds
Net Facilities One Time Burden
Total Fees Gross One-Time Burden
Total Net One Time Burden
SFD ( > 2,550 SF) $59,173 $55,119 $4,053 $67,392 $126,565 $71,446
SFD (2,151 – 2,550 SF) $42,901 $39,524 $3,376 $67,392 $110,293 $70,769
SFD (1,751 – 2,150 SF) $37,721 $34,560 $3,161 $67,392 $105,113 $70,553
SFD (1,551 – 1,750 SF) $32,143 $29,214 $2,929 $67,392 $99,535 $70,321
SFD (1,401 – 1,550 SF) $29,828 $26,996 $2,832 $67,392 $97,221 $70,225
SFD (< = 1,400 SF) $28,506 $25,729 $2,777 $67,392 $95,898 $70,170
SFA ( > 1,600 SF) $34,400 $31,378 $3,023 $67,392 $101,793 $70,415
SFA (< = 1,600 SF) $31,784 $28,870 $2,914 $67,392 $99,177 $70,306
Apartment Property $21,627 $19,136 $2,491 $39,739 $61,367 $42,231
Non-Residential Bldg. SF $8.42 $7.95 $0.47 $27.83 $36.25 $28.30
TOTAL $53,088,570 $48,417,485 $4,671,085 $97,241,144 $150,329,714 $101,912,229
VI. CONCLUSIONS
Delta Cove Page 25 Public Facilities Financing Plan August 25, 2010
A. CFD FEASIBILITY
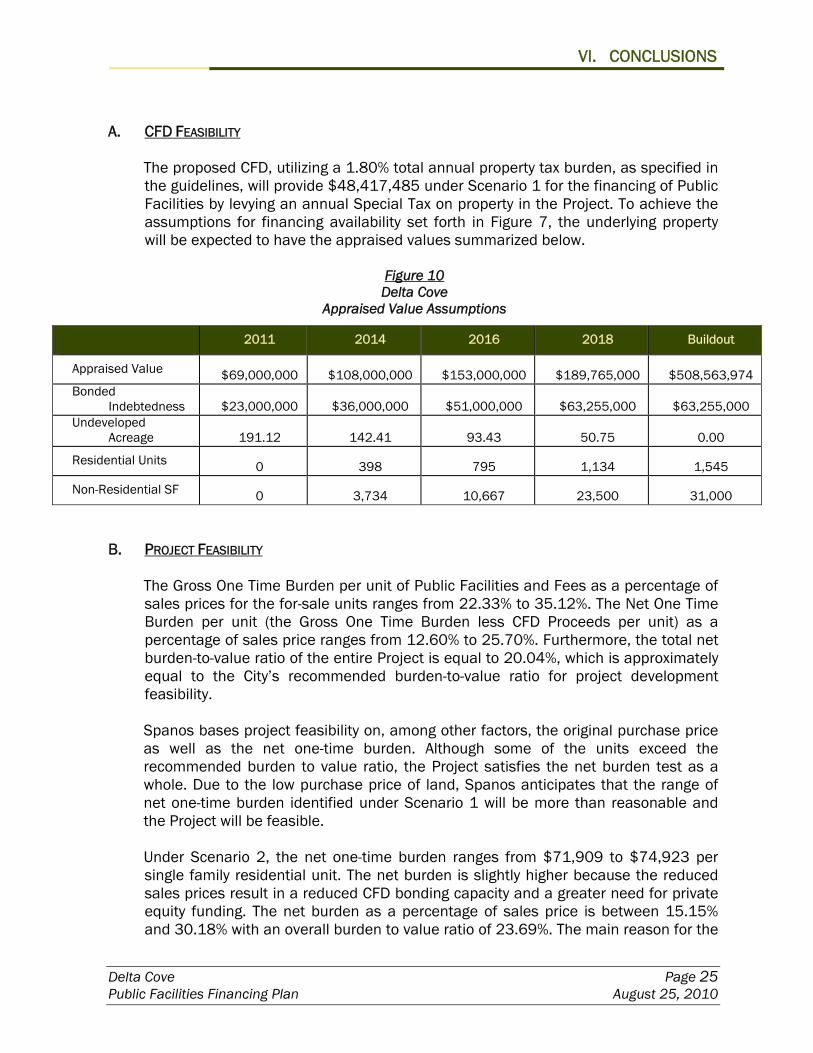
The proposed CFD, utilizing a 1.80% total annual property tax burden, as specified in the guidelines, will provide $48,417,485 under Scenario 1 for the financing of Public Facilities by levying an annual Special Tax on property in the Project. To achieve the assumptions for financing availability set forth in Figure 7, the underlying property will be expected to have the appraised values summarized below.
Figure 10 Delta Cove
Appraised Value Assumptions
2011 2014 2016 2018 Buildout
Appraised Value $69,000,000 $108,000,000 $153,000,000 $189,765,000 $508,563,974 Bonded
Indebtedness $23,000,000 $36,000,000 $51,000,000 $63,255,000 $63,255,000 Undeveloped
Acreage 191.12 142.41 93.43 50.75 0.00
Residential Units 0 398 795 1,134 1,545
Non-Residential SF 0 3,734 10,667 23,500 31,000 B. PROJECT FEASIBILITY
The Gross One Time Burden per unit of Public Facilities and Fees as a percentage of sales prices for the for-sale units ranges from 22.33% to 35.12%. The Net One Time Burden per unit (the Gross One Time Burden less CFD Proceeds per unit) as a percentage of sales price ranges from 12.60% to 25.70%. Furthermore, the total net burden-to-value ratio of the entire Project is equal to 20.04%, which is approximately equal to the City’s recommended burden-to-value ratio for project development feasibility. Spanos bases project feasibility on, among other factors, the original purchase price as well as the net one-time burden. Although some of the units exceed the recommended burden to value ratio, the Project satisfies the net burden test as a whole. Due to the low purchase price of land, Spanos anticipates that the range of net one-time burden identified under Scenario 1 will be more than reasonable and the Project will be feasible.
Under Scenario 2, the net one-time burden ranges from $71,909 to $74,923 per single family residential unit. The net burden is slightly higher because the reduced sales prices result in a reduced CFD bonding capacity and a greater need for private equity funding. The net burden as a percentage of sales price is between 15.15% and 30.18% with an overall burden to value ratio of 23.69%. The main reason for the

VI. CONCLUSIONS
Delta Cove Page 26 Public Facilities Financing Plan August 25, 2010
increased one-time burden is the reduced sales prices. Spanos has acknowledged that the assumptions in Scenario 2 represent market conditions under which the Project would not be feasible. If these conditions prevailed, Spanos would not commence development of the Project until the housing market within the City of Stockton improved. As a result, Scenario 1 represents the more realistic scenario going forward. Scenario 2 would most likely result in Spanos choosing to delay development of the Project. Figure 10 below summarizes the Project feasibility analysis for Scenario 1.
Figure 11 Delta Cove
Gross/Net One Time Burden Feasibility Analysis
Development Type Lowest Sales Price Gross One-Time Burden
Gross Burden as a % of Sales
Price
Total Net One Time Burden
Net Burden as a % of
Sales Price
SFD ( > 2,550 SF) $566,846 $126,565 22.33% $71,446 12.60%
SFD (2,151 – 2,550 SF) $410,967 $110,293 26.84% $70,769 17.22%
SFD (1,751 – 2,150 SF) $361,345 $105,113 29.09% $70,553 19.53%
SFD (1,551 – 1,750 SF) $307,913 $99,535 32.33% $70,321 22.84%
SFD (1,401 – 1,550 SF) $285,741 $97,221 34.02% $70,225 24.58%
SFD (< = 1,400 SF) $273,074 $95,898 35.12% $70,170 25.70%
Attached ( > 1,650 SF) $329,539 $101,793 30.89% $70,415 21.37%
Attached (< = 1,650 SF) $304,478 $99,177 32.57% $70,306 23.09%
Apartment Property $207,179 $61,367 29.62% $42,231 20.38%
Non-Residential Bldg. SF $80.66 $36.25 44.94% $28.30 35.08%
VI. CONCLUSIONS
Delta Cove Page 27 Public Facilities Financing Plan August 25, 2010
C. PUBLIC FACILITIES AND FINANCING MATRIX
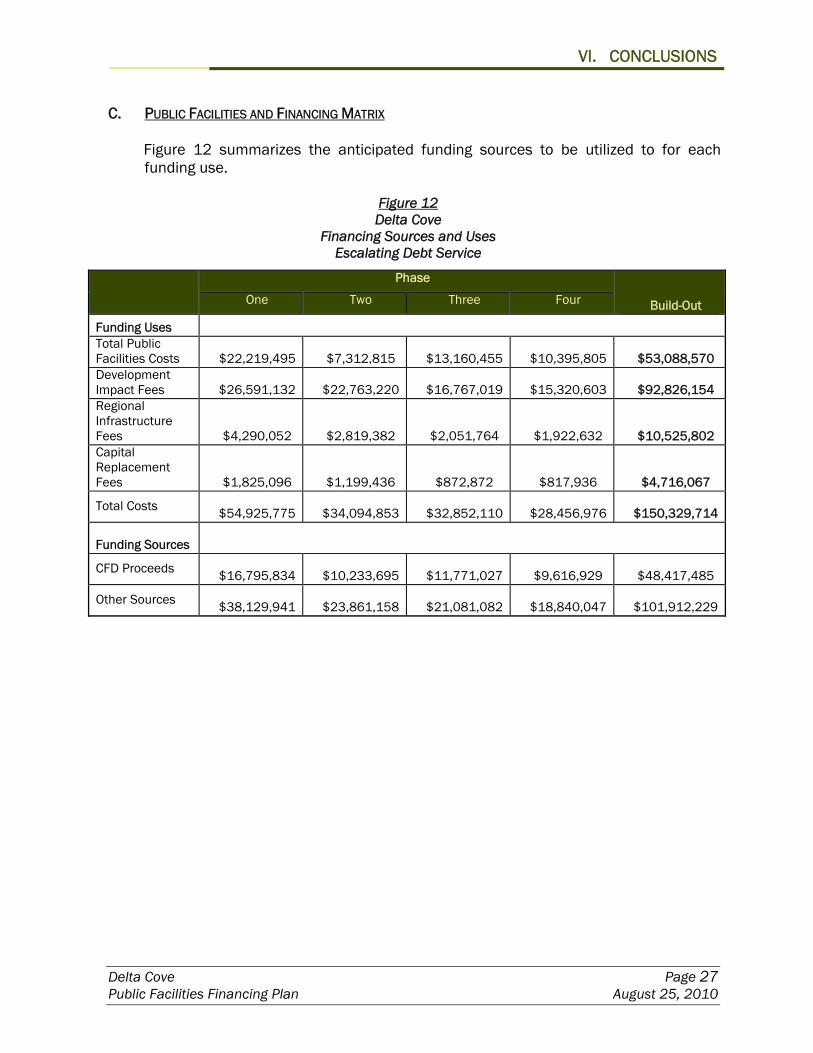
Figure 12 summarizes the anticipated funding sources to be utilized to for each funding use.
Figure 12 Delta Cove
Financing Sources and Uses Escalating Debt Service
Phase
Build-Out One Two Three Four
Funding Uses
Total Public Facilities Costs $22,219,495 $7,312,815 $13,160,455 $10,395,805 $53,088,570 Development Impact Fees $26,591,132 $22,763,220 $16,767,019 $15,320,603 $92,826,154 Regional Infrastructure Fees $4,290,052 $2,819,382 $2,051,764 $1,922,632 $10,525,802 Capital Replacement Fees $1,825,096 $1,199,436 $872,872 $817,936 $4,716,067
Total Costs $54,925,775 $34,094,853 $32,852,110 $28,456,976 $150,329,714
Funding Sources
CFD Proceeds $16,795,834 $10,233,695 $11,771,027 $9,616,929 $48,417,485
Other Sources $38,129,941 $23,861,158 $21,081,082 $18,840,047 $101,912,229

VII. SERVICES FINANCING
Delta Cove Page 28 Public Facilities Financing Plan August 25, 2010
In addition to the one-time, upfront infrastructure requirements, the Project will require annual operations and maintenance demands associated with related Public Facilities (the “Public Services”). A list of the Public Services is provided below, along with the proposed service provider(s) and proposed key annual funding sources.
SERVICES FINANCING MATRIX
Public Facility/Service Service Provider Key Annual Funding Source(s)
Sanitary Sewer Municipal Utilities Department UF
Storm Drainage Municipal Utilities Department UF
Potable Water Municipal Utilities Department UF
Streets Public Works Department/ Caltrans GF
Police Police Department GF
Fire Fire Department GF
Parks and Recreation* Parks and Recreation Department LLD
Transit SJ Regional Transit District GF
Flood Control SJ Area Flood Control Agency HOA/ GF
Schools Lodi Unified School District GF
Library Stockton-SJ County Public Library GF
Landscaping and Lighting Public Works Department GF
AD = Assessment District UF = Monthly User Fees CFD = Community Facilities District GF = City of Stockton General Fund LLD = Landscaping and Lighting District SJ = San Joaquin *The Park Maintenance Costs have been included in the Annual Burden and Tax Spread Analysis in Attachment 4. The proposed LLD assessment per unit referenced in Attachment 4 is calculated by taking total acres of Community and Regional Parks multiplying by the respective Park Maintenance cost, as per the City Guidelines, then dividing by the total residential units in the project. This proposed assessment is an estimate and is subject to change. K:\CLIENTS2\A.G. SPANOS COMPANIES\ATLAS TRACT PFFP\UPDATE 2010\REPORT\ATLAS PFFP 7-28-2010.DOC

ATTACHMENT 1
PHASING MAP FOR DELTA COVE AND SALES PRICES

42 • The Delta Cove Planned Development
EXHIBIT 4.1: CONCEPTUAL LAND PLAN
PF
OS
LEGEND
Residential Low Density (0-8.7 du/ac)
Residential Medium Density (8.8-17.4 du/ac)
Residential High Density (17.5-29.0 du/ac)
Commercial Neighborhood
Public Facility (Neighborhood Sports Park/School)
Open Space / Parks
RL
RM
RH
CN
SCHOOL
SITE
NEIGHBORHOOD
SPORTS PARK
1
2
3

The Delta Cove Planned Development • 43
ZONE GROSS AC. # UNITS DENSITY/AC
RESIDENTIAL
RL 132.73 833 6.27RM 34.84 372 9.50RH 12.75 280 22.00
CN (Parcels 2 & 3) * 100 17.50Sub-total 180.32 1,545 8.57
NON-RESIDENTIAL
CN ( Parcel A) Commercial 2.58 12,000 SF -Offi ce 3,000 SF
CN (Parcel B & C) Offi ce /Live work 5.73 16,000 SFCommercial 2,500 SF
Sub-total 8.31 - -PUBLIC FACILITIES//PARKS
Neighborhood Sports Park** 13.41School 11.06 - -
Arterial Roads (Otto Drive/Trinity Pkwy) 21.90Sub-total 46.37 - -
PARKS
Neighborhood Pocket Parks A - J 15.54 - -
Linear Levee Parks 13.96 - -Sub total 29.50 - -
OPEN SPACE
Center Park Parcels A, C, D, & E 16.52Community Garden 0.92 - -
Wetland Preserve 7.56 - -Perimeter Levee / OS 30.29 - -
Waterway Area 39.73Sub total 95.02 - -
GRAND TOTAL 359.52 1,545 8.57* CN- Parcel B/C include maximum 60 Live/Work Units and 40 townhome units on 5.73 acres, however acreage is counted under Non-residential land use. **Total acreage of Neighborhood Sports Park include 6.5 acre Sports Park parcel plus Center Park B xxx acre
TABLE 4.1 LAND USE SUMMARY

ATTACHMENT 2
CITY OF STOCKTON PUBLIC FACILITIES FEES

City of StocktonPublic Facilities FeesSource: Goodwin Consulting Group and the City of Stockton
Units Sq. Ft. AcresResidential
Low/Medium Density 1,265 2,408,001 174.56High Density 280 301,000 12.75
KSF SF AcresNon-Residential
Commercial 12 12,000 2.072Office 19 19,000 1.742
Air QualityCity Office
Space
Community Recreation
Center Fire Stations Libraries ParklandPolice Station
ExpansionStreet
Improvement
Residential per Unit per Unit per Unit per Unit per Unit per Unit per Unit per UnitLow/Medium Density $189.00 $472.00 $486.00 $790.00 $912.00 $2,829.00 $598.00 $29,870.00High Density $128.00 $395.00 $410.00 $665.00 $796.00 $1,731.00 $503.00 $13,441.00
Non-Residential per KSF per KSF per KSF per KSF per KSF per KSF per KSFCommercial $697.00 $45.50 $41.00 $123.00 $98.00 $109.00 $27,480.00Office $333.00 $88.50 $80.00 $240.00 $191.00 $213.00 $15,980.50
TOTAL FEE $289,616 $709,908 $731,602 $1,191,586 $1,381,365 $4,063,365 $902,665 $42,182,420
Habitat/Open Agricultural County Regional Sewer WaterSurface Water
Habitat/Open Space
Agricultural Land Mitigation1
County Facilities
Regional Transportation
Sewer Connection
Water Connection School Fees
Residential per Unit per Acre per Acre per Unit per Unit per Unit per Unit per SFLow/Medium Density $3,359.00 $20,741.00 $0.00 $1,678.00 $3,001.79 $5,300.00 $1,906.00 $4.13High Density $1,008.91 $18,558.00 $0.00 $1,438.00 $1,801.08 $3,710.00 $1,539.00 $2.97
Non-Residential per SF per Acre per Acre per KSF per KSF per SF per Acre per SFCommercial $0.69 $16,993.00 $0.00 $380.00 $1,200.00 $0.53 $3,591.00 $0.47Office $0.69 $17,200.00 $0.00 $340.00 $1,510.00 $3.00 $3,591.00 $0.47
TOTAL FEE $4,553,020 $3,922,335 $0 $2,536,330 $4,344,657 $7,806,660 $2,855,706 $10,853,584
ALL DEVELOPMENT IMPACT FEES $88,324,818PLUS: Administration (2.5%) $2,099,504LESS: Trinity Parkway Reimbursement2 ($3,555,305)LESS: Parkland Dedication Credit3 ($804,600)LESS: School Site Dedication Credit4 ($4,622,443)
NET DEVELOPMENT IMPACT FEES $81,441,974
NOTES1: According to the City Planning Department, Delta Cove is currently within the urban zone and will not be subject to this fee. 2: Equal to the construction cost for Trinity Parkway Improvements. See Attachment 3. 3: Reimbursement for land dedication equal to $60,000 per acre. Source: City of Stockton4: Land value estimated to equal total project development costs per gross acre.

ATTACHMENT 3
BACKBONE FACILITIES COST ESTIMATES

BACKBONE INFRASTRUCTURE COSTS BY PHASE
Facility ONE TWO THREE FOUR TOTAL
Site Prep 1,214,000.00$ 680,000.00$ 758,500.00$ 632,500.00$ 3,285,000.00$ Sanitary Sewer 518,050.00$ 384,350.00$ 440,875.00$ 320,675.00$ 1,663,950.00$ Water System 1,025,076.00$ 562,885.00$ 861,380.00$ 479,500.00$ 2,928,841.00$ Storm Drainage 3,882,525.00$ 477,625.00$ 571,225.00$ 394,175.00$ 5,325,550.00$ Street work 3,034,260.00$ 2,097,955.00$ 2,331,850.00$ 1,884,405.00$ 9,348,470.00$ Street Lighting 87,000.00$ 51,000.00$ 79,000.00$ 42,000.00$ 259,000.00$ Signs/Walls 74,000.00$ 64,000.00$ 139,000.00$ 102,550.00$ 379,550.00$ School 586,779.00$ ‐$ ‐$ ‐$ 586,779.00$ Wetlands ‐$ ‐$ 2,500,000.00$ 2,500,000.00$ 5,000,000.00$ Parks 6,670,000.00$ 2,495,000.00$ 3,475,000.00$ 3,540,000.00$ 16,180,000.00$ Trinity Parkway 2,655,305.00$ ‐$ 900,000.00$ ‐$ 3,555,305.00$ Otto Drive 1,272,500.00$ ‐$ 603,625.00$ ‐$ 1,876,125.00$ Miscellaneous 1,200,000.00$ 500,000.00$ 500,000.00$ 500,000.00$ 2,700,000.00$
22,219,495.00$ 7,312,815.00$ 13,160,455.00$ 10,395,805.00$ 53,088,570.00$
Source: AG Spanos.

ATTACHMENT 4
COMMUNITY FACILITIES DISTRICT SPECIAL TAX AND BONDING CAPACITY ANALYSIS FOR DELTA COVE
SCENARIO 1

August 4, 2010 CFD CAPACITY ANALYSIS - SCENARIO 1 DRAFT© DAVID TAUSSIG AND ASSOCIATES, INC.
$48,417,485
*4% Property Inflation Rate, 2% Escalating Debt Service, 1.80% E.T.R.*
SERIES SERIES SERIESLAND USE ASSUMPTIONS BOND ASSUMPTIONS 2011 2014 2016 + EXISTING TAX RATES [3]BUILDOUT PERIOD (YEARS FROM 2012) [1] 9 AVERAGE COUPON 6.25% 6.50% 6.75% GENERAL TAX LEVY 1.00000%
BOND TERM (YEARS) 30 30 30 LODI UNIFIED SCHOOL DISTRICT #1 0.01740% ANTICIPATED RESIDENTIAL DEVELOPMENT [2] 1,545 FIXED COSTS OF ISSUANCE 3.00% 3.00% 3.00% LODI UNIFIED SCHOOL DISTRICT #2 0.01800% CLASS 1 SINGLE FAMILY DETACHED ( > 2,550 SF) 79 UNDERWRITER'S DISCOUNT 2.00% 2.00% 2.00% LODI UNIFIED SCHOOL DISTRICT #3 0.00410% CLASS 2 SINGLE FAMILY DETACHED (2,151 - 2,550 SF) 257 RESERVE REQUIREMENT 10.00% 10.00% 10.00% LODI UNIFIED SFID 1 0.04670% CLASS 3 SINGLE FAMILY DETACHED (1,751 - 2,150 SF) 272 CAPITALIZED INTEREST 11.97% 6.28% 6.53% SAN JOAQUIN DELTA COLLEGE DISTRICT #1 0.01650% CLASS 4 SINGLE FAMILY DETACHED (1,551 - 1,750 SF) 312 CLASS 5 SINGLE FAMILY DETACHED (1,401 - 1,550 SF) 123 OTHER ASSUMPTIONS CLASS 6 SINGLE FAMILY DETACHED ( <= 1,400 SF) 62 REINVESTMENT INTEREST RATE 1.50% PROJECTED OVERLAPPING ASSESSMENTS CLASS 7 SINGLE FAMILY ATTACHED ( > 1,650 SF) 100 DISCOUNT RATE FOR NPV ANALYSIS 6.25% WATER INVESTIGATION DISTRICT $3.50 CLASS 8 SINGLE FAMILY ATTACHED ( <= 1,650 SF) 60 PROPERTY INFLATION RATE 4.00% CENTRAL DELTA WATER $2.00 CLASS 9 APARTMENT PROPERTY 280 ADMINISTRATION EXPENSE INFLATION RATE 2.00% SJ COUNTY MOSQUITO ABATEMENT $1.50
FY 2009-10 ADMINISTRATION EXPENSE (PER PHASE) $15,000 SJ COUNTY VECTOR CONTROL $7.58 ANTICIPATED NON-RESIDENTIAL DEVELOPMENT [2] RECLAMATION DISTRICT [5] NA CLASS 10 NON-RESIDENTIAL BLDG. SF 31,000 SPECIAL TAX FOR SERVICES [6] $0.00
SPECIAL TAX ASSUMPTIONS (FY 2009-10) PROPOSED PARK MAINTENANCE LLD [7] $96.34 ACREAGE SUMMARY [2] NON-RESIDENTIAL ASSIGNED SPECIAL TAX (PER BLDG. SF) $0.55 GROSS ACREAGE 359.7 UNDEVELOPED MAXIMUM SPECIAL TAX (PER ACRE) $31,163 LESS: EXEMPT PUBLIC AND HOA ACREAGE (168.6) BACKUP SPECIAL TAX (PER ACRE) $25,089 MINIMUM DEBT SERVICE COVERAGE NET TAXABLE RESIDENTIAL ACREAGE 187.3 % SPECIAL TAX INCREASE (THRU BUILDING PERMIT ISSUANCE) 4.00% GROSS DEBT SERVICE COVERAGE 110.01% NET TAXABLE NON-RESIDENTIAL ACREAGE 3.8 % SPECIAL TAX INCREASE (AFTER BUILDING PERMIT ISSUANCE) 2.00% NET DEBT SERVICE COVERAGE 111.49%
#LOWEST EST. BOND PROCEED
BASE AMOUNT AMOUNT SPECIAL TOTAL E.T.R. TOTAL E.T.R.SPECIAL TAX CLASS PRICE [2] (PER UNIT) (PER UNIT) TAX E.T.R. EXCLUDING CFD INCLUDING CFD CLASS 1 SINGLE FAMILY DETACHED ( > 2,550 SF) $566,846 $72,011 $55,119 $3,842 0.6777% 1.1223% 1.8000% CLASS 2 SINGLE FAMILY DETACHED (2,151 - 2,550 SF) $410,967 $51,637 $39,524 $2,755 0.6703% 1.1297% 1.8000% CLASS 3 SINGLE FAMILY DETACHED (1,751 - 2,150 SF) $361,345 $45,151 $34,560 $2,409 0.6666% 1.1334% 1.8000% CLASS 4 SINGLE FAMILY DETACHED (1,551 - 1,750 SF) $307,913 $38,167 $29,214 $2,036 0.6613% 1.1387% 1.8000% CLASS 5 SINGLE FAMILY DETACHED (1,401 - 1,550 SF) $285,741 $35,269 $26,996 $1,882 0.6585% 1.1415% 1.8000% CLASS 6 SINGLE FAMILY DETACHED ( <= 1,400 SF) $273,074 $33,613 $25,729 $1,793 0.6567% 1.1433% 1.8000% CLASS 7 SINGLE FAMILY ATTACHED ( > 1,650 SF) $329,539 $40,993 $31,378 $2,187 0.6636% 1.1364% 1.8000% CLASS 8 SINGLE FAMILY ATTACHED ( <= 1,650 SF) $304,478 $37,718 $28,870 $2,012 0.6609% 1.1391% 1.8000% CLASS 9 APARTMENT PROPERTY $207,179 $25,000 $19,136 $1,334 0.6438% 1.1562% 1.8000% CLASS 10 NON-RESIDENTIAL BLDG. SF $81 $10.39 $7.95 $0.55 0.6870% 1.1130% 1.8000%
NOTES:
E.T.R.--Effective Tax Rate[1] Estimate, subject to change[2] Based on information provided by A.G. Spanos. Subject to change.[3] Based on property tax bills provided by A.G. Spanos and discussions TOTAL BONDED INDEBTEDNESS [4] $63,255,000 RESIDENTIAL SPECIAL TAXES $141,604,426 with overlapping jurisdictions. Subject to change in future years. TOTAL BOND FINANCED FACILITIES $48,417,485 NON-RESIDENTIAL SPECIAL TAXES $725,532[4] Bonded Indebtedness amount assumes that a 3 to 1 value-to-lien ratio is satisfied. UNDEVELOPED SPECIAL TAXES $4,659,254[5] It is assumed for the purpose of this analysis that the City's general fund will bear the TOTAL DEBT SERVICE $158,809,445 TOTAL SPECIAL TAXES $146,989,211 cost of all public services other than park maintenance. TOTAL ADMINISTRATION $2,647,959[6] Based on companion Fiscal Impact Report. MISCELLANEOUS REVENUES ($14,471,709) NPV OF UNDEVELOPED SPECIAL TAXES $3,161,771[7] Estimated charge required to finance the maintenance of internal neighborhood parks PAY-AS-YOU-GO FACILITIES $3,517 utilizing the costs estimates contained in the guidelines provided by GCG. TOTAL NET DEBT SERVICE $146,989,211
K:\CLIENTS2\A.G. Spanos Companies\Atlas Tract PFFP\Update 2010\Taxspread\[Atlas PFFP Capacity Analysis 7-28-2010 Scenario 1.xls]Summary
ASSIGNED SPECIAL TAX (FY 2009-10)
PROJECTED SPECIAL TAXES AND BONDED INDEBTEDNESSFOR PROPOSED COMMUNITY FACILITIES DISTRICT
A.G. SPANOS (DELTA COVE PROJECT)
MAJOR CONCLUSIONS
SUMMARY OF TAX COMPUTATIONS

A. G. Spanos (Delta Cover Project): Scenario 1 Update Page 2
SPECIAL TAX CLASSLOWEST
BASE PRICE
PROPOSED ASSIGNED
SPECIAL TAX
ASSIGNED SPECIAL TAX
RATE
EXISTING AD VALOREM
TAX RATE
AD VALOREM PROPERTY
TAXESADDITIONAL
ASSESSMENTSTOTAL
TAX RATE
LOW $566,846 $3,842 0.6777% 1.1027% $6,251 $111 1.8000%HIGH $566,846 $3,842 0.6777% 1.1027% $6,251 $111 1.8000%LOW $410,967 $2,755 0.6703% 1.1027% $4,532 $111 1.8000%HIGH $475,746 $2,755 0.5790% 1.1027% $5,246 $111 1.7051%LOW $361,345 $2,409 0.6666% 1.1027% $3,985 $111 1.8000%HIGH $385,610 $2,409 0.6247% 1.1027% $4,252 $111 1.7561%LOW $307,913 $2,036 0.6613% 1.1027% $3,395 $111 1.8000%HIGH $347,049 $2,036 0.5867% 1.1027% $3,827 $111 1.7214%LOW $285,741 $1,882 0.6585% 1.1027% $3,151 $111 1.8000%HIGH $300,028 $1,882 0.6271% 1.1027% $3,308 $111 1.7668%LOW $273,074 $1,793 0.6567% 1.1027% $3,011 $111 1.8000%HIGH $273,074 $1,793 0.6567% 1.1027% $3,011 $111 1.8000%LOW $329,539 $2,187 0.6636% 1.1027% $3,634 $111 1.8000%HIGH $329,539 $2,187 0.6636% 1.1027% $3,634 $111 1.8000%LOW $304,478 $2,012 0.6609% 1.1027% $3,357 $111 1.8000%HIGH $304,478 $2,012 0.6609% 1.1027% $3,357 $111 1.8000%LOW $207,179 $1,334 0.6438% 1.1027% $2,285 $111 1.8000%HIGH $207,179 $1,334 0.6438% 1.1027% $2,285 $111 1.8000%
A.G. SPANOS (DELTA COVE PROJECT)FOR PROPOSED COMMUNITY FACILITIES DISTRICT
FISCAL YEAR 2009-2010 RESIDENTIAL SPECIAL TAXES
APARTMENT PROPERTY
SINGLE FAMILY DETACHED (1,551 - 1,750 SF)
SINGLE FAMILY DETACHED (1,751 - 2,150 SF)
SINGLE FAMILY DETACHED ( <= 1,400 SF)
SINGLE FAMILY ATTACHED ( <= 1,650 SF)
SINGLE FAMILY DETACHED ( > 2,550 SF)
SINGLE FAMILY DETACHED (1,401 - 1,550 SF)
SINGLE FAMILY DETACHED (2,151 - 2,550 SF)
SINGLE FAMILY ATTACHED ( > 1,650 SF)

A. G. Spanos (Delta Cover Project): Scenario 1 Update Page 3
FISCAL YEAR - COLLECTION OF TAXES 2009-10 2010-11 2011-12 2012-13 2013-14 2014-15 2015-16 2016-17 2017-18 2018-19CALENDAR YEAR - PAYMENTS TO BOND HOLDERS 2010 2011 2012 2013 2014 2015 2016 2017 2018 2019
63.38% 110.01%I. CFD BONDED INDEBTEDNESS *Sept 2011* *Sept 2014* *Sept 2016* *Sept 2018*TOTAL BONDED INDEBTEDNESS $0 $23,000,000 $0 $0 $13,000,000 $0 $15,000,000 $0 $12,255,000 $0LESS: COSTS OF ISSUANCE / UNDERWRITER'S DISCOUNT $0 ($1,150,000) $0 $0 ($650,000) $0 ($750,000) $0 ($612,750) $0LESS: RESERVE REQUIREMENT $0 ($2,300,000) $0 $0 ($1,300,000) $0 ($1,500,000) $0 ($1,225,500) $0LESS: CAPITALIZED INTEREST $0 ($2,754,166) $0 $0 ($816,305) $0 ($978,973) $0 ($799,821) $0--------------------------------------------------------------------------------------- ------------------ ------------------ ------------------ ------------------ ------------------ ------------------ ------------------ ------------------ ------------------ ------------------TOTAL BOND FINANCED FACILITIES $0 $16,795,834 $0 $0 $10,233,695 $0 $11,771,027 $0 $9,616,929 $0
88.367% 135.889%
II. ABSORPTION - BUILDING PERMITS (as of 3/1) UNDEVELOPED PROPERTY REMAINING UNDEVELOPED ACREAGE 191.1 191.1 191.1 166.8 142.4 118.0 93.4 69.0 50.8 32.5
DEVELOPED NON-RESIDENTIAL PROPERTY NON-RESIDENTIAL BLDG. SF 0 0 0 1,867 3,734 5,334 10,667 16,000 23,500 31,000
DEVELOPED RESIDENTIAL PROPERTY CLASS 1 SINGLE FAMILY DETACHED ( > 2,550 SF) 0 0 0 0 0 0 0 0 40 79 CLASS 2 SINGLE FAMILY DETACHED (2,151 - 2,550 SF) 0 0 0 22 44 67 67 67 110 154 CLASS 3 SINGLE FAMILY DETACHED (1,751 - 2,150 SF) 0 0 0 0 0 0 99 197 197 197 CLASS 4 SINGLE FAMILY DETACHED (1,551 - 1,750 SF) 0 0 0 34 68 102 102 102 162 222 CLASS 5 SINGLE FAMILY DETACHED (1,401 - 1,550 SF) 0 0 0 20 40 59 91 123 123 123 CLASS 6 SINGLE FAMILY DETACHED ( <= 1,400 SF) 0 0 0 0 0 0 31 62 62 62 CLASS 7 SINGLE FAMILY ATTACHED ( > 1,650 SF) 0 0 0 10 20 30 65 100 100 100 CLASS 8 SINGLE FAMILY ATTACHED ( <= 1,650 SF) 0 0 0 20 40 60 60 60 60 60 CLASS 9 APARTMENT PROPERTY 0 0 0 93 186 280 280 280 280 280--------------------------------------------------------------------------------------- ------------------ ------------------ ------------------ ------------------ ------------------ ------------------ ------------------ ------------------ ------------------ ------------------TOTAL DEVELOPED RESIDENTIAL UNITS 0 0 0 199 398 598 795 991 1,134 1,277
III. MELLO-ROOS SPECIAL TAX LEVY UNDEVELOPED PROPERTY SPECIAL TAXES $0 $0 $0 $0 $1,006,415 $593,089 $997,810 $431,078 $847,347 $278,366
NON-RESIDENTIAL PROPERTY SPECIAL TAXES $0 $0 $0 $0 $1,210 $2,493 $3,665 $7,627 $11,824 $17,976
RESIDENTIAL PROPERTY SPECIAL TAXES CLASS 1 SINGLE FAMILY DETACHED ( > 2,550 SF) $0 $0 $0 $0 $0 $0 $0 $0 $0 $218,717 CLASS 2 SINGLE FAMILY DETACHED (2,151 - 2,550 SF) $0 $0 $0 $0 $70,899 $146,051 $229,142 $233,725 $238,400 $411,765 CLASS 3 SINGLE FAMILY DETACHED (1,751 - 2,150 SF) $0 $0 $0 $0 $0 $0 $0 $313,804 $643,139 $656,002 CLASS 4 SINGLE FAMILY DETACHED (1,551 - 1,750 SF) $0 $0 $0 $0 $80,989 $166,836 $257,770 $262,926 $268,184 $447,433 CLASS 5 SINGLE FAMILY DETACHED (1,401 - 1,550 SF) $0 $0 $0 $0 $44,023 $90,687 $137,736 $219,722 $306,517 $312,648 CLASS 6 SINGLE FAMILY DETACHED ( <= 1,400 SF) $0 $0 $0 $0 $0 $0 $0 $73,153 $150,695 $153,709 CLASS 7 SINGLE FAMILY ATTACHED ( > 1,650 SF) $0 $0 $0 $0 $25,584 $52,704 $81,430 $183,784 $292,215 $298,059 CLASS 8 SINGLE FAMILY ATTACHED ( <= 1,650 SF) $0 $0 $0 $0 $47,080 $96,985 $149,846 $152,843 $155,900 $159,018 CLASS 9 APARTMENT PROPERTY $0 $0 $0 $0 $145,106 $298,919 $463,532 $472,803 $482,259 $491,904--------------------------------------------------------------------------------------- ------------------ ------------------ ------------------ ------------------ ------------------ ------------------ ------------------ ------------------ ------------------ ------------------TOTAL ANNUAL SPECIAL TAX LEVY $0 $0 $0 $0 $1,421,306 $1,447,765 $2,320,931 $2,351,465 $3,396,480 $3,445,597

A. G. Spanos (Delta Cover Project): Scenario 1 Update Page 4
FISCAL YEAR - COLLECTION OF TAXES 2009-10 2010-11 2011-12 2012-13 2013-14 2014-15 2015-16 2016-17 2017-18 2018-19CALENDAR YEAR - PAYMENTS TO BOND HOLDERS 2010 2011 2012 2013 2014 2015 2016 2017 2018 2019
63.38% 110.01%IV. CFD SPECIAL TAX REQUIREMENT NEW BONDED INDEBTEDNESS $0 $23,000,000 $0 $0 $13,000,000 $0 $15,000,000 $0 $12,255,000 $0NEW RESERVE REQUIREMENT $0 $2,300,000 $0 $0 $1,300,000 $0 $1,500,000 $0 $1,225,500 $0
ANNUAL DEBT SERVICE - SERIES 2011 $0 $0 $1,437,500 $1,437,500 $1,437,500 $1,463,634 $1,492,906 $1,522,764 $1,553,220 $1,584,284ANNUAL DEBT SERVICE - SERIES 2014 $0 $0 $0 $0 $0 $845,000 $845,000 $845,000 $849,945 $866,944ANNUAL DEBT SERVICE - SERIES 2016 $0 $0 $0 $0 $0 $0 $0 $1,012,500 $1,012,500 $1,012,500ANNUAL DEBT SERVICE - SERIES 2018 $0 $0 $0 $0 $0 $0 $0 $0 $0 $827,213--------------------------------------------------------------------------------------- ------------------ ------------------ ------------------ ------------------ ------------------ ------------------ ------------------ ------------------ ------------------ ------------------TOTAL ANNUAL DEBT SERVICE $0 $0 $1,437,500 $1,437,500 $1,437,500 $2,308,634 $2,337,906 $3,380,264 $3,415,665 $4,290,941CFD ADMINISTRATION $0 $0 $0 $0 $16,236 $16,561 $33,785 $34,461 $52,725 $53,779RESERVE FUND INTEREST (6% DELINQUENCY) $0 $0 $0 $0 ($32,430) ($32,430) ($50,760) ($50,760) ($71,910) ($71,910)CAPITALIZED INTEREST $0 $0 ($1,437,500) ($1,437,500) $0 ($845,000) $0 ($1,012,500) $0 ($827,213)PAY-AS-YOU-GO FACILITIES $0 $0 $0 $0 $0 $0 $0 $0 $0 $0--------------------------------------------------------------------------------------- ------------------ ------------------ ------------------ ------------------ ------------------ ------------------ ------------------ ------------------ ------------------ ------------------NET ANNUAL DEBT SERVICE $0 $0 $0 $0 $1,421,306 $1,447,765 $2,320,931 $2,351,465 $3,396,480 $3,445,597
ANNUAL SURPLUS/(DEFICIT) $0 $0 $0 $0 $0 $0 $0 $0 $0 $0CUMULATIVE SURPLUS/(DEFICIT) $0 $0 $0 $0 $0 $0 $0 $0 $0 $0
-- DEBT SERVICE SCHEDULE ASSUMES MARCH 1 AND SEPTEMBER 1 BOND PAYMENTS --
V. AVERAGE ANNUAL SPECIAL TAX UNDEVELOPED PROPERTY, PER ACRE $0 $0 $0 $0 $6,035 $4,165 $8,458 $4,614 $12,279 $5,485
NON-RESIDENTIAL PROPERTY, PER BLDG. SF $0.00 $0.00 $0.00 $0.00 $0.65 $0.67 $0.69 $0.72 $0.74 $0.76
RESIDENTIAL PROPERTY, PER UNIT CLASS 1 SINGLE FAMILY DETACHED ( > 2,550 SF) $0 $0 $0 $0 $0 $0 $0 $0 $0 $5,468 CLASS 2 SINGLE FAMILY DETACHED (2,151 - 2,550 SF) $0 $0 $0 $0 $3,223 $3,319 $3,420 $3,488 $3,558 $3,743 CLASS 3 SINGLE FAMILY DETACHED (1,751 - 2,150 SF) $0 $0 $0 $0 $0 $0 $0 $3,170 $3,265 $3,330 CLASS 4 SINGLE FAMILY DETACHED (1,551 - 1,750 SF) $0 $0 $0 $0 $2,382 $2,453 $2,527 $2,578 $2,629 $2,762 CLASS 5 SINGLE FAMILY DETACHED (1,401 - 1,550 SF) $0 $0 $0 $0 $2,201 $2,267 $2,335 $2,415 $2,492 $2,542 CLASS 6 SINGLE FAMILY DETACHED ( <= 1,400 SF) $0 $0 $0 $0 $0 $0 $0 $2,360 $2,431 $2,479 CLASS 7 SINGLE FAMILY ATTACHED ( > 1,650 SF) $0 $0 $0 $0 $2,558 $2,635 $2,714 $2,827 $2,922 $2,981 CLASS 8 SINGLE FAMILY ATTACHED ( <= 1,650 SF) $0 $0 $0 $0 $2,354 $2,425 $2,497 $2,547 $2,598 $2,650 CLASS 9 APARTMENT PROPERTY $0 $0 $0 $0 $1,560 $1,607 $1,655 $1,689 $1,722 $1,757
VI. MAXIMUM SPECIAL TAX LEVY UNDEVELOPED PROPERTY $5,837,143 $6,075,119 $6,196,621 $6,320,554 $5,625,402 $4,899,915 $4,140,058 $3,344,424 $2,519,736 $1,890,097
NON-RESIDENTIAL PROPERTY $0 $0 $0 $0 $1,210 $2,493 $3,665 $7,627 $11,824 $17,976
RESIDENTIAL PROPERTY CLASS 1 SINGLE FAMILY DETACHED ( > 2,550 SF) $0 $0 $0 $0 $0 $0 $0 $0 $0 $218,717 CLASS 2 SINGLE FAMILY DETACHED (2,151 - 2,550 SF) $0 $0 $0 $0 $70,899 $146,051 $229,142 $233,725 $238,400 $411,765 CLASS 3 SINGLE FAMILY DETACHED (1,751 - 2,150 SF) $0 $0 $0 $0 $0 $0 $0 $313,804 $643,139 $656,002 CLASS 4 SINGLE FAMILY DETACHED (1,551 - 1,750 SF) $0 $0 $0 $0 $80,989 $166,836 $257,770 $262,926 $268,184 $447,433 CLASS 5 SINGLE FAMILY DETACHED (1,401 - 1,550 SF) $0 $0 $0 $0 $44,023 $90,687 $137,736 $219,722 $306,517 $312,648 CLASS 6 SINGLE FAMILY DETACHED ( <= 1,400 SF) $0 $0 $0 $0 $0 $0 $0 $73,153 $150,695 $153,709 CLASS 7 SINGLE FAMILY ATTACHED ( > 1,650 SF) $0 $0 $0 $0 $25,584 $52,704 $81,430 $183,784 $292,215 $298,059 CLASS 8 SINGLE FAMILY ATTACHED ( <= 1,650 SF) $0 $0 $0 $0 $47,080 $96,985 $149,846 $152,843 $155,900 $159,018 CLASS 9 APARTMENT PROPERTY $0 $0 $0 $0 $145,106 $298,919 $463,532 $472,803 $482,259 $491,904--------------------------------------------------------------------------------------- ------------------ ------------------ ------------------ ------------------ ------------------ ------------------ ------------------ ------------------ ------------------ ------------------TOTAL MAXIMUM SPECIAL TAX LEVY $5,837,143 $6,075,119 $6,196,621 $6,320,554 $6,040,293 $5,754,591 $5,463,179 $5,264,811 $5,068,869 $5,057,329
VII. DEBT SERVICE COVERAGE GROSS DEBT SERVICE COVERAGE* NA NA 431.07% 439.69% 419.06% 248.55% 232.23% 154.73% 146.86% 116.61% NET DEBT SERVICE COVERAGE ** NA NA 431.07% 439.69% 421.32% 249.95% 234.40% 156.23% 148.96% 118.28%
* MAXIMUM SPECIAL TAXES LESS CFD ADMINISTRATION, DIVIDED BY GROSS DEBT SERVICE** MAXIMUM SPECIAL TAXES LESS CFD ADMINISTRATION PLUS RESERVE EARNINGS, DIVIDED BY GROSS DEBT SERVICE

A. G. Spanos (Delta Cover Project): Scenario 1 Update Page 5
FISCAL YEAR - COLLECTION OF TAXESCALENDAR YEAR - PAYMENTS TO BOND HOLDERS
I. CFD BONDED INDEBTEDNESS TOTAL BONDED INDEBTEDNESSLESS: COSTS OF ISSUANCE / UNDERWRITER'S DISCOUNTLESS: RESERVE REQUIREMENTLESS: CAPITALIZED INTEREST---------------------------------------------------------------------------------------TOTAL BOND FINANCED FACILITIES
II. ABSORPTION - BUILDING PERMITS (as of 3/1) UNDEVELOPED PROPERTY REMAINING UNDEVELOPED ACREAGE
DEVELOPED NON-RESIDENTIAL PROPERTY NON-RESIDENTIAL BLDG. SF
DEVELOPED RESIDENTIAL PROPERTY CLASS 1 SINGLE FAMILY DETACHED ( > 2,550 SF) CLASS 2 SINGLE FAMILY DETACHED (2,151 - 2,550 SF) CLASS 3 SINGLE FAMILY DETACHED (1,751 - 2,150 SF) CLASS 4 SINGLE FAMILY DETACHED (1,551 - 1,750 SF) CLASS 5 SINGLE FAMILY DETACHED (1,401 - 1,550 SF) CLASS 6 SINGLE FAMILY DETACHED ( <= 1,400 SF) CLASS 7 SINGLE FAMILY ATTACHED ( > 1,650 SF) CLASS 8 SINGLE FAMILY ATTACHED ( <= 1,650 SF) CLASS 9 APARTMENT PROPERTY---------------------------------------------------------------------------------------TOTAL DEVELOPED RESIDENTIAL UNITS
III. MELLO-ROOS SPECIAL TAX LEVY UNDEVELOPED PROPERTY SPECIAL TAXES
NON-RESIDENTIAL PROPERTY SPECIAL TAXES
RESIDENTIAL PROPERTY SPECIAL TAXES CLASS 1 SINGLE FAMILY DETACHED ( > 2,550 SF) CLASS 2 SINGLE FAMILY DETACHED (2,151 - 2,550 SF) CLASS 3 SINGLE FAMILY DETACHED (1,751 - 2,150 SF) CLASS 4 SINGLE FAMILY DETACHED (1,551 - 1,750 SF) CLASS 5 SINGLE FAMILY DETACHED (1,401 - 1,550 SF) CLASS 6 SINGLE FAMILY DETACHED ( <= 1,400 SF) CLASS 7 SINGLE FAMILY ATTACHED ( > 1,650 SF) CLASS 8 SINGLE FAMILY ATTACHED ( <= 1,650 SF) CLASS 9 APARTMENT PROPERTY---------------------------------------------------------------------------------------TOTAL ANNUAL SPECIAL TAX LEVY
2019-20 2020-21 2021-22 2022-23 2023-24 2024-25 2025-26 2026-27 2027-28 2028-292020 2021 2022 2023 2024 2025 2026 2027 2028 2029
$0 $0 $0 $0 $0 $0 $0 $0 $0 $0$0 $0 $0 $0 $0 $0 $0 $0 $0 $0$0 $0 $0 $0 $0 $0 $0 $0 $0 $0$0 $0 $0 $0 $0 $0 $0 $0 $0 $0
------------------ ------------------ ------------------ ------------------ ------------------ ------------------ ------------------ ------------------ ------------------ ------------------$0 $0 $0 $0 $0 $0 $0 $0 $0 $0
16.2 0.0 0.0 0.0 0.0 0.0 0.0 0.0 0.0 0.0
31,000 31,000 31,000 31,000 31,000 31,000 31,000 31,000 31,000 31,000
79 79 79 79 79 79 79 79 79 79205 257 257 257 257 257 257 257 257 257235 272 272 272 272 272 272 272 272 272267 312 312 312 312 312 312 312 312 312123 123 123 123 123 123 123 123 123 123
62 62 62 62 62 62 62 62 62 62100 100 100 100 100 100 100 100 100 100
60 60 60 60 60 60 60 60 60 60280 280 280 280 280 280 280 280 280 280
------------------ ------------------ ------------------ ------------------ ------------------ ------------------ ------------------ ------------------ ------------------ ------------------1,411 1,545 1,545 1,545 1,545 1,545 1,545 1,545 1,545 1,545
$505,148 $0 $0 $0 $0 $0 $0 $0 $0 $0
$24,488 $24,978 $22,741 $23,181 $23,653 $24,135 $24,627 $25,129 $25,641 $26,162
$444,871 $453,768 $413,127 $421,119 $429,706 $438,466 $447,400 $456,513 $465,809 $475,290$599,420 $827,690 $958,266 $976,804 $996,723 $1,017,041 $1,037,764 $1,058,903 $1,080,464 $1,102,456$669,122 $823,414 $877,028 $893,994 $912,224 $930,819 $949,786 $969,133 $988,866 $1,008,994$637,222 $791,023 $851,115 $867,580 $885,272 $903,318 $921,724 $940,499 $959,649 $979,182$318,901 $325,279 $296,145 $301,874 $308,030 $314,309 $320,714 $327,246 $333,910 $340,706$156,783 $159,918 $145,595 $148,412 $151,438 $154,525 $157,674 $160,886 $164,162 $167,503$304,020 $310,101 $282,327 $287,788 $293,657 $299,643 $305,748 $311,976 $318,329 $324,808$162,198 $165,442 $150,624 $153,538 $156,669 $159,863 $163,120 $166,443 $169,832 $173,289$501,742 $511,777 $465,940 $474,954 $484,639 $494,518 $504,595 $514,873 $525,357 $536,050
------------------ ------------------ ------------------ ------------------ ------------------ ------------------ ------------------ ------------------ ------------------ ------------------$4,323,915 $4,393,389 $4,462,909 $4,549,244 $4,642,013 $4,736,637 $4,833,153 $4,931,600 $5,032,016 $5,134,440
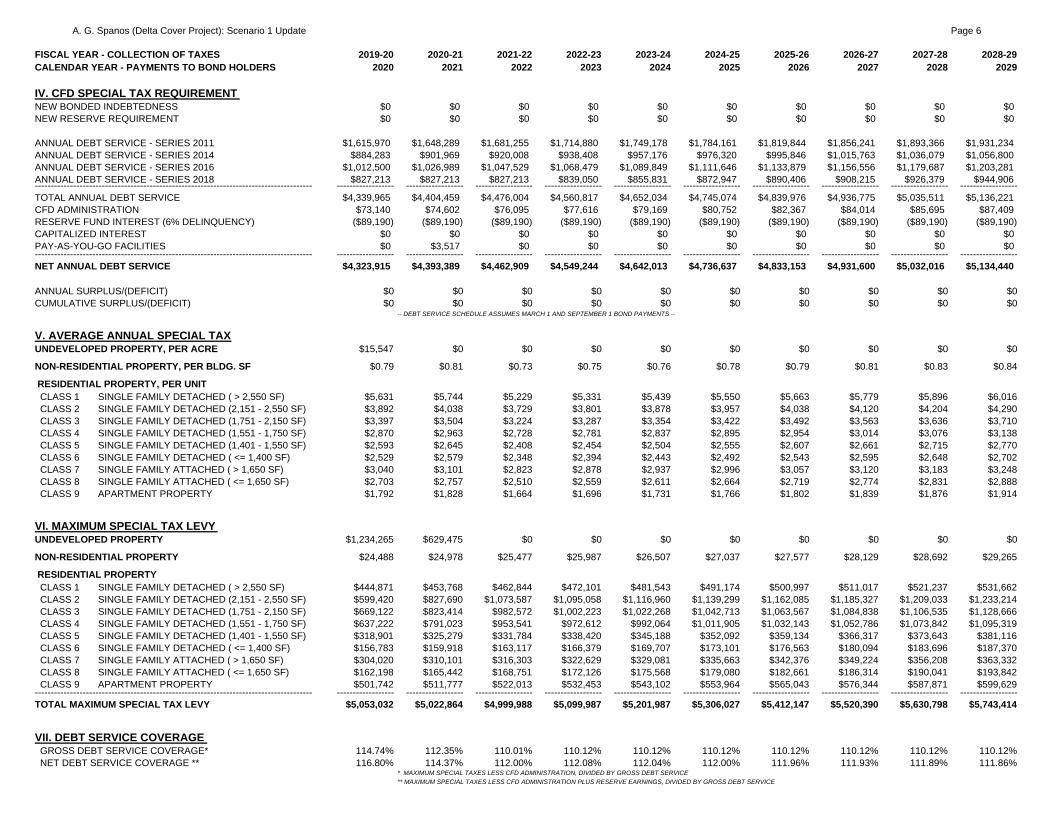
A. G. Spanos (Delta Cover Project): Scenario 1 Update Page 6
FISCAL YEAR - COLLECTION OF TAXESCALENDAR YEAR - PAYMENTS TO BOND HOLDERS
IV. CFD SPECIAL TAX REQUIREMENT NEW BONDED INDEBTEDNESSNEW RESERVE REQUIREMENT
ANNUAL DEBT SERVICE - SERIES 2011ANNUAL DEBT SERVICE - SERIES 2014ANNUAL DEBT SERVICE - SERIES 2016ANNUAL DEBT SERVICE - SERIES 2018---------------------------------------------------------------------------------------TOTAL ANNUAL DEBT SERVICECFD ADMINISTRATIONRESERVE FUND INTEREST (6% DELINQUENCY)CAPITALIZED INTERESTPAY-AS-YOU-GO FACILITIES---------------------------------------------------------------------------------------NET ANNUAL DEBT SERVICE
ANNUAL SURPLUS/(DEFICIT)CUMULATIVE SURPLUS/(DEFICIT)
V. AVERAGE ANNUAL SPECIAL TAX UNDEVELOPED PROPERTY, PER ACRE
NON-RESIDENTIAL PROPERTY, PER BLDG. SF
RESIDENTIAL PROPERTY, PER UNIT CLASS 1 SINGLE FAMILY DETACHED ( > 2,550 SF) CLASS 2 SINGLE FAMILY DETACHED (2,151 - 2,550 SF) CLASS 3 SINGLE FAMILY DETACHED (1,751 - 2,150 SF) CLASS 4 SINGLE FAMILY DETACHED (1,551 - 1,750 SF) CLASS 5 SINGLE FAMILY DETACHED (1,401 - 1,550 SF) CLASS 6 SINGLE FAMILY DETACHED ( <= 1,400 SF) CLASS 7 SINGLE FAMILY ATTACHED ( > 1,650 SF) CLASS 8 SINGLE FAMILY ATTACHED ( <= 1,650 SF) CLASS 9 APARTMENT PROPERTY
VI. MAXIMUM SPECIAL TAX LEVY UNDEVELOPED PROPERTY
NON-RESIDENTIAL PROPERTY
RESIDENTIAL PROPERTY CLASS 1 SINGLE FAMILY DETACHED ( > 2,550 SF) CLASS 2 SINGLE FAMILY DETACHED (2,151 - 2,550 SF) CLASS 3 SINGLE FAMILY DETACHED (1,751 - 2,150 SF) CLASS 4 SINGLE FAMILY DETACHED (1,551 - 1,750 SF) CLASS 5 SINGLE FAMILY DETACHED (1,401 - 1,550 SF) CLASS 6 SINGLE FAMILY DETACHED ( <= 1,400 SF) CLASS 7 SINGLE FAMILY ATTACHED ( > 1,650 SF) CLASS 8 SINGLE FAMILY ATTACHED ( <= 1,650 SF) CLASS 9 APARTMENT PROPERTY---------------------------------------------------------------------------------------TOTAL MAXIMUM SPECIAL TAX LEVY
VII. DEBT SERVICE COVERAGE GROSS DEBT SERVICE COVERAGE* NET DEBT SERVICE COVERAGE **
2019-20 2020-21 2021-22 2022-23 2023-24 2024-25 2025-26 2026-27 2027-28 2028-292020 2021 2022 2023 2024 2025 2026 2027 2028 2029
$0 $0 $0 $0 $0 $0 $0 $0 $0 $0$0 $0 $0 $0 $0 $0 $0 $0 $0 $0
$1,615,970 $1,648,289 $1,681,255 $1,714,880 $1,749,178 $1,784,161 $1,819,844 $1,856,241 $1,893,366 $1,931,234$884,283 $901,969 $920,008 $938,408 $957,176 $976,320 $995,846 $1,015,763 $1,036,079 $1,056,800
$1,012,500 $1,026,989 $1,047,529 $1,068,479 $1,089,849 $1,111,646 $1,133,879 $1,156,556 $1,179,687 $1,203,281$827,213 $827,213 $827,213 $839,050 $855,831 $872,947 $890,406 $908,215 $926,379 $944,906------------------ ------------------ ------------------ ------------------ ------------------ ------------------ ------------------ ------------------ ------------------ ------------------
$4,339,965 $4,404,459 $4,476,004 $4,560,817 $4,652,034 $4,745,074 $4,839,976 $4,936,775 $5,035,511 $5,136,221$73,140 $74,602 $76,095 $77,616 $79,169 $80,752 $82,367 $84,014 $85,695 $87,409
($89,190) ($89,190) ($89,190) ($89,190) ($89,190) ($89,190) ($89,190) ($89,190) ($89,190) ($89,190)$0 $0 $0 $0 $0 $0 $0 $0 $0 $0$0 $3,517 $0 $0 $0 $0 $0 $0 $0 $0
------------------ ------------------ ------------------ ------------------ ------------------ ------------------ ------------------ ------------------ ------------------ ------------------$4,323,915 $4,393,389 $4,462,909 $4,549,244 $4,642,013 $4,736,637 $4,833,153 $4,931,600 $5,032,016 $5,134,440
$0 $0 $0 $0 $0 $0 $0 $0 $0 $0$0 $0 $0 $0 $0 $0 $0 $0 $0 $0
-- DEBT SERVICE SCHEDULE ASSUMES MARCH 1 AND SEPTEMBER 1 BOND PAYMENTS --
$15,547 $0 $0 $0 $0 $0 $0 $0 $0 $0
$0.79 $0.81 $0.73 $0.75 $0.76 $0.78 $0.79 $0.81 $0.83 $0.84
$5,631 $5,744 $5,229 $5,331 $5,439 $5,550 $5,663 $5,779 $5,896 $6,016$3,892 $4,038 $3,729 $3,801 $3,878 $3,957 $4,038 $4,120 $4,204 $4,290$3,397 $3,504 $3,224 $3,287 $3,354 $3,422 $3,492 $3,563 $3,636 $3,710$2,870 $2,963 $2,728 $2,781 $2,837 $2,895 $2,954 $3,014 $3,076 $3,138$2,593 $2,645 $2,408 $2,454 $2,504 $2,555 $2,607 $2,661 $2,715 $2,770$2,529 $2,579 $2,348 $2,394 $2,443 $2,492 $2,543 $2,595 $2,648 $2,702$3,040 $3,101 $2,823 $2,878 $2,937 $2,996 $3,057 $3,120 $3,183 $3,248$2,703 $2,757 $2,510 $2,559 $2,611 $2,664 $2,719 $2,774 $2,831 $2,888$1,792 $1,828 $1,664 $1,696 $1,731 $1,766 $1,802 $1,839 $1,876 $1,914
$1,234,265 $629,475 $0 $0 $0 $0 $0 $0 $0 $0
$24,488 $24,978 $25,477 $25,987 $26,507 $27,037 $27,577 $28,129 $28,692 $29,265
$444,871 $453,768 $462,844 $472,101 $481,543 $491,174 $500,997 $511,017 $521,237 $531,662$599,420 $827,690 $1,073,587 $1,095,058 $1,116,960 $1,139,299 $1,162,085 $1,185,327 $1,209,033 $1,233,214$669,122 $823,414 $982,572 $1,002,223 $1,022,268 $1,042,713 $1,063,567 $1,084,838 $1,106,535 $1,128,666$637,222 $791,023 $953,541 $972,612 $992,064 $1,011,905 $1,032,143 $1,052,786 $1,073,842 $1,095,319$318,901 $325,279 $331,784 $338,420 $345,188 $352,092 $359,134 $366,317 $373,643 $381,116$156,783 $159,918 $163,117 $166,379 $169,707 $173,101 $176,563 $180,094 $183,696 $187,370$304,020 $310,101 $316,303 $322,629 $329,081 $335,663 $342,376 $349,224 $356,208 $363,332$162,198 $165,442 $168,751 $172,126 $175,568 $179,080 $182,661 $186,314 $190,041 $193,842$501,742 $511,777 $522,013 $532,453 $543,102 $553,964 $565,043 $576,344 $587,871 $599,629
------------------ ------------------ ------------------ ------------------ ------------------ ------------------ ------------------ ------------------ ------------------ ------------------$5,053,032 $5,022,864 $4,999,988 $5,099,987 $5,201,987 $5,306,027 $5,412,147 $5,520,390 $5,630,798 $5,743,414
114.74% 112.35% 110.01% 110.12% 110.12% 110.12% 110.12% 110.12% 110.12% 110.12%116.80% 114.37% 112.00% 112.08% 112.04% 112.00% 111.96% 111.93% 111.89% 111.86%
* MAXIMUM SPECIAL TAXES LESS CFD ADMINISTRATION, DIVIDED BY GROSS DEBT SERVICE** MAXIMUM SPECIAL TAXES LESS CFD ADMINISTRATION PLUS RESERVE EARNINGS, DIVIDED BY GROSS DEBT SERVICE

A. G. Spanos (Delta Cover Project): Scenario 1 Update Page 7
FISCAL YEAR - COLLECTION OF TAXESCALENDAR YEAR - PAYMENTS TO BOND HOLDERS
I. CFD BONDED INDEBTEDNESS TOTAL BONDED INDEBTEDNESSLESS: COSTS OF ISSUANCE / UNDERWRITER'S DISCOUNTLESS: RESERVE REQUIREMENTLESS: CAPITALIZED INTEREST---------------------------------------------------------------------------------------TOTAL BOND FINANCED FACILITIES
II. ABSORPTION - BUILDING PERMITS (as of 3/1) UNDEVELOPED PROPERTY REMAINING UNDEVELOPED ACREAGE
DEVELOPED NON-RESIDENTIAL PROPERTY NON-RESIDENTIAL BLDG. SF
DEVELOPED RESIDENTIAL PROPERTY CLASS 1 SINGLE FAMILY DETACHED ( > 2,550 SF) CLASS 2 SINGLE FAMILY DETACHED (2,151 - 2,550 SF) CLASS 3 SINGLE FAMILY DETACHED (1,751 - 2,150 SF) CLASS 4 SINGLE FAMILY DETACHED (1,551 - 1,750 SF) CLASS 5 SINGLE FAMILY DETACHED (1,401 - 1,550 SF) CLASS 6 SINGLE FAMILY DETACHED ( <= 1,400 SF) CLASS 7 SINGLE FAMILY ATTACHED ( > 1,650 SF) CLASS 8 SINGLE FAMILY ATTACHED ( <= 1,650 SF) CLASS 9 APARTMENT PROPERTY---------------------------------------------------------------------------------------TOTAL DEVELOPED RESIDENTIAL UNITS
III. MELLO-ROOS SPECIAL TAX LEVY UNDEVELOPED PROPERTY SPECIAL TAXES
NON-RESIDENTIAL PROPERTY SPECIAL TAXES
RESIDENTIAL PROPERTY SPECIAL TAXES CLASS 1 SINGLE FAMILY DETACHED ( > 2,550 SF) CLASS 2 SINGLE FAMILY DETACHED (2,151 - 2,550 SF) CLASS 3 SINGLE FAMILY DETACHED (1,751 - 2,150 SF) CLASS 4 SINGLE FAMILY DETACHED (1,551 - 1,750 SF) CLASS 5 SINGLE FAMILY DETACHED (1,401 - 1,550 SF) CLASS 6 SINGLE FAMILY DETACHED ( <= 1,400 SF) CLASS 7 SINGLE FAMILY ATTACHED ( > 1,650 SF) CLASS 8 SINGLE FAMILY ATTACHED ( <= 1,650 SF) CLASS 9 APARTMENT PROPERTY---------------------------------------------------------------------------------------TOTAL ANNUAL SPECIAL TAX LEVY
2029-30 2030-31 2031-32 2032-33 2033-34 2034-35 2035-36 2036-37 2037-38 2038-392030 2031 2032 2033 2034 2035 2036 2037 2038 2039
$0 $0 $0 $0 $0 $0 $0 $0 $0 $0$0 $0 $0 $0 $0 $0 $0 $0 $0 $0$0 $0 $0 $0 $0 $0 $0 $0 $0 $0$0 $0 $0 $0 $0 $0 $0 $0 $0 $0
------------------ ------------------ ------------------ ------------------ ------------------ ------------------ ------------------ ------------------ ------------------ ------------------$0 $0 $0 $0 $0 $0 $0 $0 $0 $0
0.0 0.0 0.0 0.0 0.0 0.0 0.0 0.0 0.0 0.0
31,000 31,000 31,000 31,000 31,000 31,000 31,000 31,000 31,000 31,000
79 79 79 79 79 79 79 79 79 79257 257 257 257 257 257 257 257 257 257272 272 272 272 272 272 272 272 272 272312 312 312 312 312 312 312 312 312 312123 123 123 123 123 123 123 123 123 123
62 62 62 62 62 62 62 62 62 62100 100 100 100 100 100 100 100 100 100
60 60 60 60 60 60 60 60 60 60280 280 280 280 280 280 280 280 280 280
------------------ ------------------ ------------------ ------------------ ------------------ ------------------ ------------------ ------------------ ------------------ ------------------1,545 1,545 1,545 1,545 1,545 1,545 1,545 1,545 1,545 1,545
$0 $0 $0 $0 $0 $0 $0 $0 $0 $0
$26,695 $27,238 $27,792 $28,356 $28,933 $29,520 $30,120 $30,731 $31,355 $31,991
$484,961 $494,825 $504,887 $515,150 $525,618 $536,295 $547,186 $558,295 $569,626 $581,184$1,124,888 $1,147,769 $1,171,107 $1,194,913 $1,219,194 $1,243,961 $1,269,223 $1,294,990 $1,321,273 $1,348,082$1,029,524 $1,050,465 $1,071,825 $1,093,612 $1,115,835 $1,138,502 $1,161,622 $1,185,205 $1,209,260 $1,233,796
$999,106 $1,019,428 $1,040,157 $1,061,300 $1,082,867 $1,104,864 $1,127,302 $1,150,188 $1,173,532 $1,197,343$347,639 $354,710 $361,922 $369,279 $376,783 $384,437 $392,244 $400,208 $408,330 $416,615$170,911 $174,388 $177,934 $181,551 $185,240 $189,003 $192,841 $196,756 $200,749 $204,823$331,417 $338,158 $345,034 $352,048 $359,202 $366,498 $373,941 $381,533 $389,276 $397,175$176,815 $180,411 $184,079 $187,821 $191,638 $195,531 $199,502 $203,552 $207,683 $211,897$546,957 $558,083 $569,431 $581,005 $592,812 $604,854 $617,138 $629,666 $642,446 $655,481
------------------ ------------------ ------------------ ------------------ ------------------ ------------------ ------------------ ------------------ ------------------ ------------------$5,238,913 $5,345,475 $5,454,168 $5,565,035 $5,678,120 $5,793,466 $5,911,119 $6,031,125 $6,153,532 $6,278,386

A. G. Spanos (Delta Cover Project): Scenario 1 Update Page 8
FISCAL YEAR - COLLECTION OF TAXESCALENDAR YEAR - PAYMENTS TO BOND HOLDERS
IV. CFD SPECIAL TAX REQUIREMENT NEW BONDED INDEBTEDNESSNEW RESERVE REQUIREMENT
ANNUAL DEBT SERVICE - SERIES 2011ANNUAL DEBT SERVICE - SERIES 2014ANNUAL DEBT SERVICE - SERIES 2016ANNUAL DEBT SERVICE - SERIES 2018---------------------------------------------------------------------------------------TOTAL ANNUAL DEBT SERVICECFD ADMINISTRATIONRESERVE FUND INTEREST (6% DELINQUENCY)CAPITALIZED INTERESTPAY-AS-YOU-GO FACILITIES---------------------------------------------------------------------------------------NET ANNUAL DEBT SERVICE
ANNUAL SURPLUS/(DEFICIT)CUMULATIVE SURPLUS/(DEFICIT)
V. AVERAGE ANNUAL SPECIAL TAX UNDEVELOPED PROPERTY, PER ACRE
NON-RESIDENTIAL PROPERTY, PER BLDG. SF
RESIDENTIAL PROPERTY, PER UNIT CLASS 1 SINGLE FAMILY DETACHED ( > 2,550 SF) CLASS 2 SINGLE FAMILY DETACHED (2,151 - 2,550 SF) CLASS 3 SINGLE FAMILY DETACHED (1,751 - 2,150 SF) CLASS 4 SINGLE FAMILY DETACHED (1,551 - 1,750 SF) CLASS 5 SINGLE FAMILY DETACHED (1,401 - 1,550 SF) CLASS 6 SINGLE FAMILY DETACHED ( <= 1,400 SF) CLASS 7 SINGLE FAMILY ATTACHED ( > 1,650 SF) CLASS 8 SINGLE FAMILY ATTACHED ( <= 1,650 SF) CLASS 9 APARTMENT PROPERTY
VI. MAXIMUM SPECIAL TAX LEVY UNDEVELOPED PROPERTY
NON-RESIDENTIAL PROPERTY
RESIDENTIAL PROPERTY CLASS 1 SINGLE FAMILY DETACHED ( > 2,550 SF) CLASS 2 SINGLE FAMILY DETACHED (2,151 - 2,550 SF) CLASS 3 SINGLE FAMILY DETACHED (1,751 - 2,150 SF) CLASS 4 SINGLE FAMILY DETACHED (1,551 - 1,750 SF) CLASS 5 SINGLE FAMILY DETACHED (1,401 - 1,550 SF) CLASS 6 SINGLE FAMILY DETACHED ( <= 1,400 SF) CLASS 7 SINGLE FAMILY ATTACHED ( > 1,650 SF) CLASS 8 SINGLE FAMILY ATTACHED ( <= 1,650 SF) CLASS 9 APARTMENT PROPERTY---------------------------------------------------------------------------------------TOTAL MAXIMUM SPECIAL TAX LEVY
VII. DEBT SERVICE COVERAGE GROSS DEBT SERVICE COVERAGE* NET DEBT SERVICE COVERAGE **
2029-30 2030-31 2031-32 2032-33 2033-34 2034-35 2035-36 2036-37 2037-38 2038-392030 2031 2032 2033 2034 2035 2036 2037 2038 2039
$0 $0 $0 $0 $0 $0 $0 $0 $0 $0$0 $0 $0 $0 $0 $0 $0 $0 $0 $0
$1,969,858 $2,009,255 $2,049,440 $2,090,429 $2,132,238 $2,174,883 $2,218,380 $2,262,748 $2,308,003 $2,354,163$1,077,936 $1,099,495 $1,121,485 $1,143,914 $1,166,793 $1,190,129 $1,213,931 $1,238,210 $1,262,974 $1,288,233$1,227,347 $1,251,894 $1,276,932 $1,302,470 $1,328,520 $1,355,090 $1,382,192 $1,409,836 $1,438,032 $1,466,793
$963,805 $983,081 $1,002,742 $1,022,797 $1,043,253 $1,064,118 $1,085,400 $1,107,108 $1,129,251 $1,151,836------------------ ------------------ ------------------ ------------------ ------------------ ------------------ ------------------ ------------------ ------------------ ------------------$5,238,946 $5,343,724 $5,450,599 $5,559,611 $5,670,803 $5,784,219 $5,899,904 $6,017,902 $6,138,260 $6,261,025
$89,157 $90,940 $92,759 $94,614 $96,506 $98,436 $100,405 $102,413 $104,461 $106,551($89,190) ($89,190) ($89,190) ($89,190) ($89,190) ($89,190) ($89,190) ($89,190) ($89,190) ($89,190)
$0 $0 $0 $0 $0 $0 $0 $0 $0 $0$0 $0 $0 $0 $0 $0 $0 $0 $0 $0
------------------ ------------------ ------------------ ------------------ ------------------ ------------------ ------------------ ------------------ ------------------ ------------------$5,238,913 $5,345,475 $5,454,168 $5,565,035 $5,678,120 $5,793,466 $5,911,119 $6,031,125 $6,153,532 $6,278,386
$0 $0 $0 $0 $0 $0 $0 $0 $0 $0$0 $0 $0 $0 $0 $0 $0 $0 $0 $0
-- DEBT SERVICE SCHEDULE ASSUMES MARCH 1 AND SEPTEMBER 1 BOND PAYMENTS --
$0 $0 $0 $0 $0 $0 $0 $0 $0 $0
$0.86 $0.88 $0.90 $0.91 $0.93 $0.95 $0.97 $0.99 $1.01 $1.03
$6,139 $6,264 $6,391 $6,521 $6,653 $6,789 $6,926 $7,067 $7,210 $7,357$4,377 $4,466 $4,557 $4,649 $4,744 $4,840 $4,939 $5,039 $5,141 $5,245$3,785 $3,862 $3,941 $4,021 $4,102 $4,186 $4,271 $4,357 $4,446 $4,536$3,202 $3,267 $3,334 $3,402 $3,471 $3,541 $3,613 $3,686 $3,761 $3,838$2,826 $2,884 $2,942 $3,002 $3,063 $3,126 $3,189 $3,254 $3,320 $3,387$2,757 $2,813 $2,870 $2,928 $2,988 $3,048 $3,110 $3,173 $3,238 $3,304$3,314 $3,382 $3,450 $3,520 $3,592 $3,665 $3,739 $3,815 $3,893 $3,972$2,947 $3,007 $3,068 $3,130 $3,194 $3,259 $3,325 $3,393 $3,461 $3,532$1,953 $1,993 $2,034 $2,075 $2,117 $2,160 $2,204 $2,249 $2,294 $2,341
$0 $0 $0 $0 $0 $0 $0 $0 $0 $0
$29,851 $30,448 $31,057 $31,678 $32,311 $32,958 $33,617 $34,289 $34,975 $35,674
$542,295 $553,141 $564,204 $575,488 $586,998 $598,738 $610,713 $622,927 $635,385 $648,093$1,257,878 $1,283,036 $1,308,696 $1,334,870 $1,361,568 $1,388,799 $1,416,575 $1,444,906 $1,473,805 $1,503,281$1,151,239 $1,174,264 $1,197,749 $1,221,704 $1,246,138 $1,271,061 $1,296,482 $1,322,412 $1,348,860 $1,375,837$1,117,225 $1,139,570 $1,162,361 $1,185,608 $1,209,321 $1,233,507 $1,258,177 $1,283,341 $1,309,007 $1,335,188
$388,738 $396,513 $404,443 $412,532 $420,783 $429,198 $437,782 $446,538 $455,469 $464,578$191,117 $194,940 $198,838 $202,815 $206,871 $211,009 $215,229 $219,534 $223,924 $228,403$370,599 $378,011 $385,571 $393,282 $401,148 $409,171 $417,354 $425,702 $434,216 $442,900$197,718 $201,673 $205,706 $209,820 $214,017 $218,297 $222,663 $227,116 $231,659 $236,292$611,621 $623,854 $636,331 $649,057 $662,038 $675,279 $688,785 $702,561 $716,612 $730,944
------------------ ------------------ ------------------ ------------------ ------------------ ------------------ ------------------ ------------------ ------------------ ------------------$5,858,282 $5,975,448 $6,094,957 $6,216,856 $6,341,193 $6,468,017 $6,597,377 $6,729,325 $6,863,912 $7,001,190
110.12% 110.12% 110.12% 110.12% 110.12% 110.12% 110.12% 110.12% 110.12% 110.12%111.82% 111.79% 111.76% 111.72% 111.69% 111.66% 111.63% 111.60% 111.57% 111.54%
* MAXIMUM SPECIAL TAXES LESS CFD ADMINISTRATION, DIVIDED BY GROSS DEBT SERVICE** MAXIMUM SPECIAL TAXES LESS CFD ADMINISTRATION PLUS RESERVE EARNINGS, DIVIDED BY GROSS DEBT SERVICE

A. G. Spanos (Delta Cover Project): Scenario 1 Update Page 9
FISCAL YEAR - COLLECTION OF TAXESCALENDAR YEAR - PAYMENTS TO BOND HOLDERS
I. CFD BONDED INDEBTEDNESS TOTAL BONDED INDEBTEDNESSLESS: COSTS OF ISSUANCE / UNDERWRITER'S DISCOUNTLESS: RESERVE REQUIREMENTLESS: CAPITALIZED INTEREST---------------------------------------------------------------------------------------TOTAL BOND FINANCED FACILITIES
II. ABSORPTION - BUILDING PERMITS (as of 3/1) UNDEVELOPED PROPERTY REMAINING UNDEVELOPED ACREAGE
DEVELOPED NON-RESIDENTIAL PROPERTY NON-RESIDENTIAL BLDG. SF
DEVELOPED RESIDENTIAL PROPERTY CLASS 1 SINGLE FAMILY DETACHED ( > 2,550 SF) CLASS 2 SINGLE FAMILY DETACHED (2,151 - 2,550 SF) CLASS 3 SINGLE FAMILY DETACHED (1,751 - 2,150 SF) CLASS 4 SINGLE FAMILY DETACHED (1,551 - 1,750 SF) CLASS 5 SINGLE FAMILY DETACHED (1,401 - 1,550 SF) CLASS 6 SINGLE FAMILY DETACHED ( <= 1,400 SF) CLASS 7 SINGLE FAMILY ATTACHED ( > 1,650 SF) CLASS 8 SINGLE FAMILY ATTACHED ( <= 1,650 SF) CLASS 9 APARTMENT PROPERTY---------------------------------------------------------------------------------------TOTAL DEVELOPED RESIDENTIAL UNITS
III. MELLO-ROOS SPECIAL TAX LEVY UNDEVELOPED PROPERTY SPECIAL TAXES
NON-RESIDENTIAL PROPERTY SPECIAL TAXES
RESIDENTIAL PROPERTY SPECIAL TAXES CLASS 1 SINGLE FAMILY DETACHED ( > 2,550 SF) CLASS 2 SINGLE FAMILY DETACHED (2,151 - 2,550 SF) CLASS 3 SINGLE FAMILY DETACHED (1,751 - 2,150 SF) CLASS 4 SINGLE FAMILY DETACHED (1,551 - 1,750 SF) CLASS 5 SINGLE FAMILY DETACHED (1,401 - 1,550 SF) CLASS 6 SINGLE FAMILY DETACHED ( <= 1,400 SF) CLASS 7 SINGLE FAMILY ATTACHED ( > 1,650 SF) CLASS 8 SINGLE FAMILY ATTACHED ( <= 1,650 SF) CLASS 9 APARTMENT PROPERTY---------------------------------------------------------------------------------------TOTAL ANNUAL SPECIAL TAX LEVY
2039-40 2040-41 2041-42 2042-43 2043-44 2044-45 2045-46 2046-47 2047-48 TOTAL2040 2041 2042 2043 2044 2045 2046 2047 2048
$0 $0 $0 $0 $0 $0 $0 $0 $0 $63,255,000$0 $0 $0 $0 $0 $0 $0 $0 $0 ($3,162,750)$0 $0 $0 $0 $0 $0 $0 $0 $0 ($6,325,500)$0 $0 $0 $0 $0 $0 $0 $0 $0 ($5,349,265)
------------------ ------------------ ------------------ ------------------ ------------------ ------------------ ------------------ ------------------ ------------------ ------------------$0 $0 $0 $0 $0 $0 $0 $0 $0 $48,417,485
0.0 0.0 0.0 0.0 0.0 0.0 0.0 0.0 0.0 NA
31,000 31,000 31,000 31,000 31,000 31,000 31,000 31,000 31,000 NA
79 79 79 79 79 79 79 79 79 NA257 257 257 257 257 257 257 257 257 NA272 272 272 272 272 272 272 272 272 NA312 312 312 312 312 312 312 312 312 NA123 123 123 123 123 123 123 123 123 NA
62 62 62 62 62 62 62 62 62 NA100 100 100 100 100 100 100 100 100 NA
60 60 60 60 60 60 60 60 60 NA280 280 280 280 280 280 280 280 280 NA
------------------ ------------------ ------------------ ------------------ ------------------ ------------------ ------------------ ------------------ ------------------ ------------------1,545 1,545 1,545 1,545 1,545 1,545 1,545 1,545 1,545 NA
$0 $0 $0 $0 $0 $0 $0 $0 $0 $4,659,254
$32,640 $21,583 $21,103 $21,700 $15,516 $15,136 $7,800 $6,948 $844 $725,532
$592,973 $392,089 $383,384 $394,219 $281,869 $274,983 $141,700 $126,217 $15,330 $12,585,577$1,375,426 $909,467 $889,277 $914,409 $653,808 $637,834 $328,679 $292,766 $35,558 $29,358,138$1,258,822 $832,365 $813,887 $836,889 $598,380 $583,761 $300,815 $267,946 $32,544 $27,451,379$1,221,630 $807,773 $789,841 $812,162 $580,701 $566,513 $291,927 $260,029 $31,582 $26,538,968
$425,066 $281,064 $274,825 $282,592 $202,055 $197,118 $101,576 $90,477 $10,989 $9,976,376$208,977 $138,181 $135,113 $138,932 $99,337 $96,910 $49,938 $44,482 $5,403 $4,735,921$405,231 $267,949 $262,001 $269,405 $192,626 $187,920 $96,836 $86,255 $10,476 $9,385,155$216,195 $142,954 $139,780 $143,731 $102,768 $100,257 $51,663 $46,018 $5,589 $5,270,572$668,777 $442,212 $432,396 $444,615 $317,903 $310,136 $159,814 $142,352 $17,290 $16,302,339
------------------ ------------------ ------------------ ------------------ ------------------ ------------------ ------------------ ------------------ ------------------ ------------------$6,405,738 $4,235,636 $4,141,608 $4,258,654 $3,044,962 $2,970,568 $1,530,748 $1,363,490 $165,605 $146,989,211

A. G. Spanos (Delta Cover Project): Scenario 1 Update Page 10
FISCAL YEAR - COLLECTION OF TAXESCALENDAR YEAR - PAYMENTS TO BOND HOLDERS
IV. CFD SPECIAL TAX REQUIREMENT NEW BONDED INDEBTEDNESSNEW RESERVE REQUIREMENT
ANNUAL DEBT SERVICE - SERIES 2011ANNUAL DEBT SERVICE - SERIES 2014ANNUAL DEBT SERVICE - SERIES 2016ANNUAL DEBT SERVICE - SERIES 2018---------------------------------------------------------------------------------------TOTAL ANNUAL DEBT SERVICECFD ADMINISTRATIONRESERVE FUND INTEREST (6% DELINQUENCY)CAPITALIZED INTERESTPAY-AS-YOU-GO FACILITIES---------------------------------------------------------------------------------------NET ANNUAL DEBT SERVICE
ANNUAL SURPLUS/(DEFICIT)CUMULATIVE SURPLUS/(DEFICIT)
V. AVERAGE ANNUAL SPECIAL TAX UNDEVELOPED PROPERTY, PER ACRE
NON-RESIDENTIAL PROPERTY, PER BLDG. SF
RESIDENTIAL PROPERTY, PER UNIT CLASS 1 SINGLE FAMILY DETACHED ( > 2,550 SF) CLASS 2 SINGLE FAMILY DETACHED (2,151 - 2,550 SF) CLASS 3 SINGLE FAMILY DETACHED (1,751 - 2,150 SF) CLASS 4 SINGLE FAMILY DETACHED (1,551 - 1,750 SF) CLASS 5 SINGLE FAMILY DETACHED (1,401 - 1,550 SF) CLASS 6 SINGLE FAMILY DETACHED ( <= 1,400 SF) CLASS 7 SINGLE FAMILY ATTACHED ( > 1,650 SF) CLASS 8 SINGLE FAMILY ATTACHED ( <= 1,650 SF) CLASS 9 APARTMENT PROPERTY
VI. MAXIMUM SPECIAL TAX LEVY UNDEVELOPED PROPERTY
NON-RESIDENTIAL PROPERTY
RESIDENTIAL PROPERTY CLASS 1 SINGLE FAMILY DETACHED ( > 2,550 SF) CLASS 2 SINGLE FAMILY DETACHED (2,151 - 2,550 SF) CLASS 3 SINGLE FAMILY DETACHED (1,751 - 2,150 SF) CLASS 4 SINGLE FAMILY DETACHED (1,551 - 1,750 SF) CLASS 5 SINGLE FAMILY DETACHED (1,401 - 1,550 SF) CLASS 6 SINGLE FAMILY DETACHED ( <= 1,400 SF) CLASS 7 SINGLE FAMILY ATTACHED ( > 1,650 SF) CLASS 8 SINGLE FAMILY ATTACHED ( <= 1,650 SF) CLASS 9 APARTMENT PROPERTY---------------------------------------------------------------------------------------TOTAL MAXIMUM SPECIAL TAX LEVY
VII. DEBT SERVICE COVERAGE GROSS DEBT SERVICE COVERAGE* NET DEBT SERVICE COVERAGE **
2039-40 2040-41 2041-42 2042-43 2043-44 2044-45 2045-46 2046-47 2047-48 TOTAL2040 2041 2042 2043 2044 2045 2046 2047 2048
$0 ($23,000,000) $0 $0 ($13,000,000) $0 ($15,000,000) $0 ($12,255,000) $63,255,000$0 ($2,300,000) $0 $0 ($1,300,000) $0 ($1,500,000) $0 ($1,225,500) $6,325,500
$2,401,246 $2,449,271 $0 $0 $0 $0 $0 $0 $0 $56,043,641$1,313,998 $1,340,278 $1,367,084 $1,394,425 $1,422,314 $0 $0 $0 $0 $32,575,741$1,496,129 $1,526,051 $1,556,572 $1,587,704 $1,619,458 $1,651,847 $1,684,884 $0 $0 $38,629,644$1,174,872 $1,198,370 $1,222,337 $1,246,784 $1,271,720 $1,297,154 $1,323,097 $1,349,559 $1,376,550 $31,560,419------------------ ------------------ ------------------ ------------------ ------------------ ------------------ ------------------ ------------------ ------------------ ------------------$6,386,245 $6,513,970 $4,145,993 $4,228,913 $4,313,491 $2,949,001 $3,007,981 $1,349,559 $1,376,550 $158,809,445
$108,682 $110,855 $84,804 $86,500 $88,230 $59,997 $61,197 $31,210 $31,834 $2,647,959($89,190) ($89,190) ($89,190) ($56,760) ($56,760) ($38,430) ($38,430) ($17,280) ($17,280) ($2,586,497)
$0 $0 $0 $0 $0 $0 $0 $0 $0 ($5,559,713)$0 $0 $0 $0 $0 $0 $0 $0 $0 $3,517
------------------ ------------------ ------------------ ------------------ ------------------ ------------------ ------------------ ------------------ ------------------ ------------------$6,405,738 $4,235,636 $4,141,608 $4,258,654 $3,044,962 $2,970,568 $1,530,748 $1,363,490 $165,605 $146,989,211
$0 $0 $0 $0 $0 $0 $0 $0 $0 NA$0 $0 $0 $0 $0 $0 $0 $0 $0 NA
-- DEBT SERVICE SCHEDULE ASSUMES MARCH 1 AND SEPTEMBER 1 BOND PAYMENTS --
$0 $0 $0 $0 $0 $0 $0 $0 $0 NA
$1.05 $0.70 $0.68 $0.70 $0.50 $0.49 $0.25 $0.22 $0.03 NA
$7,506 $4,963 $4,853 $4,990 $3,568 $3,481 $1,794 $1,598 $194 NA$5,352 $3,539 $3,460 $3,558 $2,544 $2,482 $1,279 $1,139 $138 NA$4,628 $3,060 $2,992 $3,077 $2,200 $2,146 $1,106 $985 $120 NA$3,915 $2,589 $2,532 $2,603 $1,861 $1,816 $936 $833 $101 NA$3,456 $2,285 $2,234 $2,297 $1,643 $1,603 $826 $736 $89 NA$3,371 $2,229 $2,179 $2,241 $1,602 $1,563 $805 $717 $87 NA$4,052 $2,679 $2,620 $2,694 $1,926 $1,879 $968 $863 $105 NA$3,603 $2,383 $2,330 $2,396 $1,713 $1,671 $861 $767 $93 NA$2,388 $1,579 $1,544 $1,588 $1,135 $1,108 $571 $508 $62 NA
$0 $0 $0 $0 $0 $0 $0 $0 $0 NA
$36,388 $37,116 $37,858 $38,615 $39,387 $40,175 $40,979 $41,798 $42,634 NA
$661,055 $674,276 $687,762 $701,517 $715,547 $729,858 $744,455 $759,344 $774,531 NA$1,533,346 $1,564,013 $1,595,293 $1,627,199 $1,659,743 $1,692,938 $1,726,797 $1,761,333 $1,796,560 NA$1,403,354 $1,431,421 $1,460,050 $1,489,251 $1,519,036 $1,549,416 $1,580,405 $1,612,013 $1,644,253 NA$1,361,891 $1,389,129 $1,416,912 $1,445,250 $1,474,155 $1,503,638 $1,533,711 $1,564,385 $1,595,673 NA
$473,870 $483,347 $493,014 $502,874 $512,932 $523,190 $533,654 $544,327 $555,214 NA$232,971 $237,630 $242,383 $247,231 $252,175 $257,219 $262,363 $267,610 $272,963 NA$451,758 $460,793 $470,009 $479,409 $488,997 $498,777 $508,753 $518,928 $529,306 NA$241,018 $245,838 $250,755 $255,770 $260,885 $266,103 $271,425 $276,854 $282,391 NA$745,563 $760,474 $775,684 $791,197 $807,021 $823,162 $839,625 $856,417 $873,546 NA
------------------ ------------------ ------------------ ------------------ ------------------ ------------------ ------------------ ------------------ ------------------ ------------------$7,141,214 $7,284,038 $7,429,719 $7,578,313 $7,729,879 $7,884,477 $8,042,166 $8,203,010 $8,367,070 NA
110.12% 110.12% 177.16% 177.16% 177.16% 265.33% 265.33% 605.52% 605.52% NA111.52% 111.49% 179.31% 178.50% 178.47% 266.63% 266.60% 606.80% 606.77% NA
* MAXIMUM SPECIAL TAXES LESS CFD ADMINISTRATION, DIVIDED BY GROSS DEBT SERVICE** MAXIMUM SPECIAL TAXES LESS CFD ADMINISTRATION PLUS RESERVE EARNINGS, DIVIDED BY GROSS DEBT SERVICE

ATTACHMENT 5
COMMUNITY FACILITIES DISTRICT SPECIAL TAX AND BONDING CAPACITY ANALYSIS FOR DELTA COVE
SCENARIO 2

August 4, 2010 CFD CAPACITY ANALYSIS - SCENARIO 2 DRAFT© DAVID TAUSSIG AND ASSOCIATES, INC.
$45,216,807
*4% Property Inflation Rate, 2% Escalating Debt Service, 1.80% E.T.R.*
SERIES SERIES SERIESLAND USE ASSUMPTIONS BOND ASSUMPTIONS 2011 2015 2018 + EXISTING TAX RATES [3]BUILDOUT PERIOD (YEARS FROM 2012) [1] 14 AVERAGE COUPON 6.25% 6.50% 6.75% GENERAL TAX LEVY 1.00000%
BOND TERM (YEARS) 30 30 30 LODI UNIFIED SCHOOL DISTRICT #1 0.01740% ANTICIPATED RESIDENTIAL DEVELOPMENT [2] 1,545 FIXED COSTS OF ISSUANCE 3.00% 3.00% 3.00% LODI UNIFIED SCHOOL DISTRICT #2 0.01800% CLASS 1 SINGLE FAMILY DETACHED ( > 2,550 SF) 79 UNDERWRITER'S DISCOUNT 2.00% 2.00% 2.00% LODI UNIFIED SCHOOL DISTRICT #3 0.00410% CLASS 2 SINGLE FAMILY DETACHED (2,151 - 2,550 SF) 257 RESERVE REQUIREMENT 10.00% 10.00% 10.00% LODI UNIFIED SFID 1 0.04670% CLASS 3 SINGLE FAMILY DETACHED (1,751 - 2,150 SF) 272 CAPITALIZED INTEREST 11.97% 6.43% 6.67% SAN JOAQUIN DELTA COLLEGE DISTRICT #1 0.01650% CLASS 4 SINGLE FAMILY DETACHED (1,551 - 1,750 SF) 312 CLASS 5 SINGLE FAMILY DETACHED (1,401 - 1,550 SF) 123 OTHER ASSUMPTIONS CLASS 6 SINGLE FAMILY DETACHED ( <= 1,400 SF) 62 REINVESTMENT INTEREST RATE 1.50% PROJECTED OVERLAPPING ASSESSMENTS CLASS 7 SINGLE FAMILY ATTACHED ( > 1,650 SF) 100 DISCOUNT RATE FOR NPV ANALYSIS 6.25% WATER INVESTIGATION DISTRICT $3.50 CLASS 8 SINGLE FAMILY ATTACHED ( <= 1,650 SF) 60 PROPERTY INFLATION RATE 4.00% CENTRAL DELTA WATER $2.00 CLASS 9 APARTMENT PROPERTY 280 ADMINISTRATION EXPENSE INFLATION RATE 2.00% SJ COUNTY MOSQUITO ABATEMENT $1.50
FY 2009-10 ADMINISTRATION EXPENSE (PER PHASE) $15,000 SJ COUNTY VECTOR CONTROL $7.58 ANTICIPATED NON-RESIDENTIAL DEVELOPMENT [2] RECLAMATION DISTRICT [5] NA CLASS 10 NON-RESIDENTIAL BLDG. SF 31,000 SPECIAL TAX FOR SERVICES [6] $0.00
SPECIAL TAX ASSUMPTIONS (FY 2009-10) PROPOSED PARK MAINTENANCE LLD [7] $96.34 ACREAGE SUMMARY [2] NON-RESIDENTIAL ASSIGNED SPECIAL TAX (PER BLDG. SF) $0.48 GROSS ACREAGE 359.7 UNDEVELOPED MAXIMUM SPECIAL TAX (PER ACRE) $29,852 LESS: EXEMPT PUBLIC AND HOA ACREAGE (168.6) BACKUP SPECIAL TAX (PER ACRE) $22,822 MINIMUM DEBT SERVICE COVERAGE NET TAXABLE RESIDENTIAL ACREAGE 187.3 % SPECIAL TAX INCREASE (THRU BUILDING PERMIT ISSUANCE) 4.00% GROSS DEBT SERVICE COVERAGE 110.00% NET TAXABLE NON-RESIDENTIAL ACREAGE 3.8 % SPECIAL TAX INCREASE (AFTER BUILDING PERMIT ISSUANCE) 2.00% NET DEBT SERVICE COVERAGE 111.41%
#LOWEST EST. BOND PROCEED
BASE AMOUNT AMOUNT SPECIAL TOTAL E.T.R. TOTAL E.T.R.SPECIAL TAX CLASS PRICE [2] (PER UNIT) (PER UNIT) TAX E.T.R. EXCLUDING CFD INCLUDING CFD CLASS 1 SINGLE FAMILY DETACHED ( > 2,550 SF) $494,630 $67,435 $51,642 $3,338 0.6749% 1.1251% 1.8000% CLASS 2 SINGLE FAMILY DETACHED (2,151 - 2,550 SF) $358,610 $48,275 $36,969 $2,390 0.6664% 1.1336% 1.8000% CLASS 3 SINGLE FAMILY DETACHED (1,751 - 2,150 SF) $315,310 $42,175 $32,298 $2,088 0.6621% 1.1379% 1.8000% CLASS 4 SINGLE FAMILY DETACHED (1,551 - 1,750 SF) $268,685 $35,608 $27,268 $1,763 0.6560% 1.1440% 1.8000% CLASS 5 SINGLE FAMILY DETACHED (1,401 - 1,550 SF) $249,338 $32,882 $25,181 $1,628 0.6528% 1.1472% 1.8000% CLASS 6 SINGLE FAMILY DETACHED ( <= 1,400 SF) $238,285 $31,325 $23,989 $1,551 0.6508% 1.1492% 1.8000% CLASS 7 SINGLE FAMILY ATTACHED ( > 1,650 SF) $287,556 $38,266 $29,304 $1,894 0.6587% 1.1413% 1.8000% CLASS 8 SINGLE FAMILY ATTACHED ( <= 1,650 SF) $265,688 $35,185 $26,945 $1,742 0.6556% 1.1444% 1.8000% CLASS 9 APARTMENT PROPERTY $180,784 $23,225 $17,786 $1,150 0.6359% 1.1641% 1.8000% CLASS 10 NON-RESIDENTIAL BLDG. SF $70 $9.75 $7.46 $0.48 0.6855% 1.1145% 1.8000%
NOTES:
E.T.R.--Effective Tax Rate[1] Estimate, subject to change[2] Based on information provided by A.G. Spanos. Subject to change.[3] Based on property tax bills provided by A.G. Spanos and discussions TOTAL BONDED INDEBTEDNESS [4] $59,045,000 RESIDENTIAL SPECIAL TAXES $129,129,269 with overlapping jurisdictions. Subject to change in future years. TOTAL BOND FINANCED FACILITIES $45,216,807 NON-RESIDENTIAL SPECIAL TAXES $689,641[4] Bonded Indebtedness amount assumes that a 3 to 1 value-to-lien ratio is satisfied. UNDEVELOPED SPECIAL TAXES $7,995,332[5] It is assumed for the purpose of this analysis that the City's general fund will bear the TOTAL DEBT SERVICE $148,452,764 TOTAL SPECIAL TAXES $137,814,242 cost of all public services other than park maintenance. TOTAL ADMINISTRATION $2,785,866[6] Based on companion Fiscal Impact Report. MISCELLANEOUS REVENUES ($13,424,388) NPV OF UNDEVELOPED SPECIAL TAXES $4,728,263[7] Estimated charge required to finance the maintenance of internal neighborhood parks TOTAL NET DEBT SERVICE $137,814,242 PAY-AS-YOU-GO FACILITIES $0 utilizing the costs estimates contained in the guidelines provided by GCG.
K:\CLIENTS2\A.G. Spanos Companies\Atlas Tract PFFP\Update 2010\Taxspread\[Atlas PFFP Capacity Analysis 7-28-2010 Scenario 2.xls]Summary
ASSIGNED SPECIAL TAX (FY 2009-10)
PROJECTED SPECIAL TAXES AND BONDED INDEBTEDNESSFOR PROPOSED COMMUNITY FACILITIES DISTRICT
A.G. SPANOS (DELTA COVE PROJECT)
MAJOR CONCLUSIONS
SUMMARY OF TAX COMPUTATIONS

A. G. Spanos (Delta Cover Project): Scenario 2 Update Page 2
SPECIAL TAX CLASSLOWEST
BASE PRICE
PROPOSED ASSIGNED
SPECIAL TAX
ASSIGNED SPECIAL TAX
RATE
EXISTING AD VALOREM
TAX RATE
AD VALOREM PROPERTY
TAXESADDITIONAL
ASSESSMENTSTOTAL
TAX RATE
LOW $494,630 $3,338 0.6749% 1.1027% $5,454 $111 1.8000%HIGH $494,630 $3,338 0.6749% 1.1027% $5,454 $111 1.8000%LOW $358,610 $2,390 0.6664% 1.1027% $3,954 $111 1.8000%HIGH $415,136 $2,390 0.5756% 1.1027% $4,578 $111 1.7051%LOW $315,310 $2,088 0.6621% 1.1027% $3,477 $111 1.8000%HIGH $336,483 $2,088 0.6205% 1.1027% $3,710 $111 1.7561%LOW $268,685 $1,763 0.6560% 1.1027% $2,963 $111 1.8000%HIGH $302,835 $1,763 0.5820% 1.1027% $3,339 $111 1.7214%LOW $249,338 $1,628 0.6528% 1.1027% $2,749 $111 1.8000%HIGH $261,804 $1,628 0.6217% 1.1027% $2,887 $111 1.7668%LOW $238,285 $1,551 0.6508% 1.1027% $2,628 $111 1.8000%HIGH $238,285 $1,551 0.6508% 1.1027% $2,628 $111 1.8000%LOW $287,556 $1,894 0.6587% 1.1027% $3,171 $111 1.8000%HIGH $287,556 $1,894 0.6587% 1.1027% $3,171 $111 1.8000%LOW $265,688 $1,742 0.6556% 1.1027% $2,930 $111 1.8000%HIGH $265,688 $1,742 0.6556% 1.1027% $2,930 $111 1.8000%LOW $180,784 $1,150 0.6359% 1.1027% $1,994 $111 1.8000%HIGH $180,784 $1,150 0.6359% 1.1027% $1,994 $111 1.8000%
SINGLE FAMILY DETACHED (1,751 - 2,150 SF)
SINGLE FAMILY DETACHED ( <= 1,400 SF)
SINGLE FAMILY ATTACHED ( <= 1,650 SF)
SINGLE FAMILY DETACHED ( > 2,550 SF)
SINGLE FAMILY DETACHED (1,401 - 1,550 SF)
SINGLE FAMILY DETACHED (2,151 - 2,550 SF)
SINGLE FAMILY ATTACHED ( > 1,650 SF)
A.G. SPANOS (DELTA COVE PROJECT)FOR PROPOSED COMMUNITY FACILITIES DISTRICT
FISCAL YEAR 2009-2010 RESIDENTIAL SPECIAL TAXES
APARTMENT PROPERTY
SINGLE FAMILY DETACHED (1,551 - 1,750 SF)
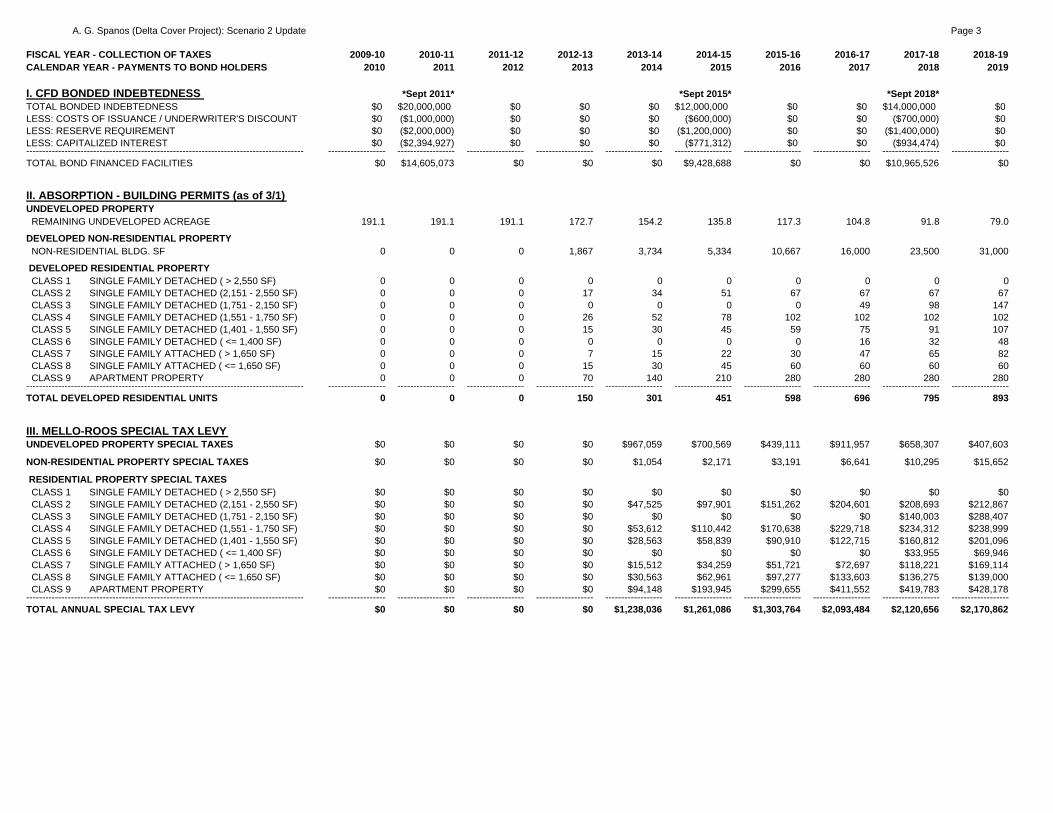
A. G. Spanos (Delta Cover Project): Scenario 2 Update Page 3
FISCAL YEAR - COLLECTION OF TAXES 2009-10 2010-11 2011-12 2012-13 2013-14 2014-15 2015-16 2016-17 2017-18 2018-19CALENDAR YEAR - PAYMENTS TO BOND HOLDERS 2010 2011 2012 2013 2014 2015 2016 2017 2018 2019
63.38% 110.00%I. CFD BONDED INDEBTEDNESS *Sept 2011* *Sept 2015* *Sept 2018*TOTAL BONDED INDEBTEDNESS $0 $20,000,000 $0 $0 $0 $12,000,000 $0 $0 $14,000,000 $0LESS: COSTS OF ISSUANCE / UNDERWRITER'S DISCOUNT $0 ($1,000,000) $0 $0 $0 ($600,000) $0 $0 ($700,000) $0LESS: RESERVE REQUIREMENT $0 ($2,000,000) $0 $0 $0 ($1,200,000) $0 $0 ($1,400,000) $0LESS: CAPITALIZED INTEREST $0 ($2,394,927) $0 $0 $0 ($771,312) $0 $0 ($934,474) $0--------------------------------------------------------------------------------------- ------------------ ------------------ ------------------ ------------------ ------------------ ------------------ ------------------ ------------------ ------------------ ------------------TOTAL BOND FINANCED FACILITIES $0 $14,605,073 $0 $0 $0 $9,428,688 $0 $0 $10,965,526 $0
87.702% 127.956% 107.266% 98.926%
II. ABSORPTION - BUILDING PERMITS (as of 3/1) UNDEVELOPED PROPERTY REMAINING UNDEVELOPED ACREAGE 191.1 191.1 191.1 172.7 154.2 135.8 117.3 104.8 91.8 79.0
DEVELOPED NON-RESIDENTIAL PROPERTY NON-RESIDENTIAL BLDG. SF 0 0 0 1,867 3,734 5,334 10,667 16,000 23,500 31,000
DEVELOPED RESIDENTIAL PROPERTY CLASS 1 SINGLE FAMILY DETACHED ( > 2,550 SF) 0 0 0 0 0 0 0 0 0 0 CLASS 2 SINGLE FAMILY DETACHED (2,151 - 2,550 SF) 0 0 0 17 34 51 67 67 67 67 CLASS 3 SINGLE FAMILY DETACHED (1,751 - 2,150 SF) 0 0 0 0 0 0 0 49 98 147 CLASS 4 SINGLE FAMILY DETACHED (1,551 - 1,750 SF) 0 0 0 26 52 78 102 102 102 102 CLASS 5 SINGLE FAMILY DETACHED (1,401 - 1,550 SF) 0 0 0 15 30 45 59 75 91 107 CLASS 6 SINGLE FAMILY DETACHED ( <= 1,400 SF) 0 0 0 0 0 0 0 16 32 48 CLASS 7 SINGLE FAMILY ATTACHED ( > 1,650 SF) 0 0 0 7 15 22 30 47 65 82 CLASS 8 SINGLE FAMILY ATTACHED ( <= 1,650 SF) 0 0 0 15 30 45 60 60 60 60 CLASS 9 APARTMENT PROPERTY 0 0 0 70 140 210 280 280 280 280--------------------------------------------------------------------------------------- ------------------ ------------------ ------------------ ------------------ ------------------ ------------------ ------------------ ------------------ ------------------ ------------------TOTAL DEVELOPED RESIDENTIAL UNITS 0 0 0 150 301 451 598 696 795 893
III. MELLO-ROOS SPECIAL TAX LEVY UNDEVELOPED PROPERTY SPECIAL TAXES $0 $0 $0 $0 $967,059 $700,569 $439,111 $911,957 $658,307 $407,603
NON-RESIDENTIAL PROPERTY SPECIAL TAXES $0 $0 $0 $0 $1,054 $2,171 $3,191 $6,641 $10,295 $15,652
RESIDENTIAL PROPERTY SPECIAL TAXES CLASS 1 SINGLE FAMILY DETACHED ( > 2,550 SF) $0 $0 $0 $0 $0 $0 $0 $0 $0 $0 CLASS 2 SINGLE FAMILY DETACHED (2,151 - 2,550 SF) $0 $0 $0 $0 $47,525 $97,901 $151,262 $204,601 $208,693 $212,867 CLASS 3 SINGLE FAMILY DETACHED (1,751 - 2,150 SF) $0 $0 $0 $0 $0 $0 $0 $0 $140,003 $288,407 CLASS 4 SINGLE FAMILY DETACHED (1,551 - 1,750 SF) $0 $0 $0 $0 $53,612 $110,442 $170,638 $229,718 $234,312 $238,999 CLASS 5 SINGLE FAMILY DETACHED (1,401 - 1,550 SF) $0 $0 $0 $0 $28,563 $58,839 $90,910 $122,715 $160,812 $201,096 CLASS 6 SINGLE FAMILY DETACHED ( <= 1,400 SF) $0 $0 $0 $0 $0 $0 $0 $0 $33,955 $69,946 CLASS 7 SINGLE FAMILY ATTACHED ( > 1,650 SF) $0 $0 $0 $0 $15,512 $34,259 $51,721 $72,697 $118,221 $169,114 CLASS 8 SINGLE FAMILY ATTACHED ( <= 1,650 SF) $0 $0 $0 $0 $30,563 $62,961 $97,277 $133,603 $136,275 $139,000 CLASS 9 APARTMENT PROPERTY $0 $0 $0 $0 $94,148 $193,945 $299,655 $411,552 $419,783 $428,178--------------------------------------------------------------------------------------- ------------------ ------------------ ------------------ ------------------ ------------------ ------------------ ------------------ ------------------ ------------------ ------------------TOTAL ANNUAL SPECIAL TAX LEVY $0 $0 $0 $0 $1,238,036 $1,261,086 $1,303,764 $2,093,484 $2,120,656 $2,170,862

A. G. Spanos (Delta Cover Project): Scenario 2 Update Page 4
FISCAL YEAR - COLLECTION OF TAXES 2009-10 2010-11 2011-12 2012-13 2013-14 2014-15 2015-16 2016-17 2017-18 2018-19CALENDAR YEAR - PAYMENTS TO BOND HOLDERS 2010 2011 2012 2013 2014 2015 2016 2017 2018 2019
63.38% 110.00%IV. CFD SPECIAL TAX REQUIREMENT NEW BONDED INDEBTEDNESS $0 $20,000,000 $0 $0 $0 $12,000,000 $0 $0 $14,000,000 $0NEW RESERVE REQUIREMENT $0 $2,000,000 $0 $0 $0 $1,200,000 $0 $0 $1,400,000 $0
ANNUAL DEBT SERVICE - SERIES 2011 $0 $0 $1,250,000 $1,250,000 $1,250,000 $1,272,725 $1,298,179 $1,324,143 $1,350,626 $1,377,638ANNUAL DEBT SERVICE - SERIES 2015 $0 $0 $0 $0 $0 $0 $780,000 $780,000 $780,000 $784,565ANNUAL DEBT SERVICE - SERIES 2018 $0 $0 $0 $0 $0 $0 $0 $0 $0 $945,000ANNUAL DEBT SERVICE - SERIES 2021 $0 $0 $0 $0 $0 $0 $0 $0 $0 $0--------------------------------------------------------------------------------------- ------------------ ------------------ ------------------ ------------------ ------------------ ------------------ ------------------ ------------------ ------------------ ------------------TOTAL ANNUAL DEBT SERVICE $0 $0 $1,250,000 $1,250,000 $1,250,000 $1,272,725 $2,078,179 $2,104,143 $2,130,626 $3,107,203CFD ADMINISTRATION $0 $0 $0 $0 $16,236 $16,561 $33,785 $34,461 $35,150 $53,779RESERVE FUND INTEREST (6% DELINQUENCY) $0 $0 $0 $0 ($28,200) ($28,200) ($28,200) ($45,120) ($45,120) ($45,120)CAPITALIZED INTEREST $0 $0 ($1,250,000) ($1,250,000) $0 $0 ($780,000) $0 $0 ($945,000)PAY-AS-YOU-GO FACILITIES $0 $0 $0 $0 $0 $0 $0 $0 $0 $0--------------------------------------------------------------------------------------- ------------------ ------------------ ------------------ ------------------ ------------------ ------------------ ------------------ ------------------ ------------------ ------------------NET ANNUAL DEBT SERVICE $0 $0 $0 $0 $1,238,036 $1,261,086 $1,303,764 $2,093,484 $2,120,656 $2,170,862
ANNUAL SURPLUS/(DEFICIT) $0 $0 $0 $0 $0 $0 $0 $0 $0 $0CUMULATIVE SURPLUS/(DEFICIT) $0 $0 $0 $0 $0 $0 $0 $0 $0 $0
-- DEBT SERVICE SCHEDULE ASSUMES MARCH 1 AND SEPTEMBER 1 BOND PAYMENTS --
V. AVERAGE ANNUAL SPECIAL TAX UNDEVELOPED PROPERTY, PER ACRE $0 $0 $0 $0 $5,599 $4,544 $3,234 $7,774 $6,283 $4,438
NON-RESIDENTIAL PROPERTY, PER BLDG. SF $0.00 $0.00 $0.00 $0.00 $0.56 $0.58 $0.60 $0.62 $0.64 $0.67
RESIDENTIAL PROPERTY, PER UNIT CLASS 1 SINGLE FAMILY DETACHED ( > 2,550 SF) $0 $0 $0 $0 $0 $0 $0 $0 $0 $0 CLASS 2 SINGLE FAMILY DETACHED (2,151 - 2,550 SF) $0 $0 $0 $0 $2,796 $2,879 $2,966 $3,054 $3,115 $3,177 CLASS 3 SINGLE FAMILY DETACHED (1,751 - 2,150 SF) $0 $0 $0 $0 $0 $0 $0 $0 $2,857 $2,943 CLASS 4 SINGLE FAMILY DETACHED (1,551 - 1,750 SF) $0 $0 $0 $0 $2,062 $2,124 $2,188 $2,252 $2,297 $2,343 CLASS 5 SINGLE FAMILY DETACHED (1,401 - 1,550 SF) $0 $0 $0 $0 $1,904 $1,961 $2,020 $2,080 $2,144 $2,210 CLASS 6 SINGLE FAMILY DETACHED ( <= 1,400 SF) $0 $0 $0 $0 $0 $0 $0 $0 $2,122 $2,186 CLASS 7 SINGLE FAMILY ATTACHED ( > 1,650 SF) $0 $0 $0 $0 $2,216 $2,284 $2,351 $2,423 $2,515 $2,602 CLASS 8 SINGLE FAMILY ATTACHED ( <= 1,650 SF) $0 $0 $0 $0 $2,038 $2,099 $2,162 $2,227 $2,271 $2,317 CLASS 9 APARTMENT PROPERTY $0 $0 $0 $0 $1,345 $1,385 $1,427 $1,470 $1,499 $1,529
VI. MAXIMUM SPECIAL TAX LEVY UNDEVELOPED PROPERTY $5,591,530 $5,819,493 $5,935,882 $6,054,600 $5,580,653 $5,081,331 $4,564,983 $4,022,672 $3,664,620 $3,276,801
NON-RESIDENTIAL PROPERTY $0 $0 $0 $0 $1,054 $2,171 $3,191 $6,641 $10,295 $15,652
RESIDENTIAL PROPERTY CLASS 1 SINGLE FAMILY DETACHED ( > 2,550 SF) $0 $0 $0 $0 $0 $0 $0 $0 $0 $0 CLASS 2 SINGLE FAMILY DETACHED (2,151 - 2,550 SF) $0 $0 $0 $0 $47,525 $97,901 $151,262 $204,601 $208,693 $212,867 CLASS 3 SINGLE FAMILY DETACHED (1,751 - 2,150 SF) $0 $0 $0 $0 $0 $0 $0 $0 $140,003 $288,407 CLASS 4 SINGLE FAMILY DETACHED (1,551 - 1,750 SF) $0 $0 $0 $0 $53,612 $110,442 $170,638 $229,718 $234,312 $238,999 CLASS 5 SINGLE FAMILY DETACHED (1,401 - 1,550 SF) $0 $0 $0 $0 $28,563 $58,839 $90,910 $122,715 $160,812 $201,096 CLASS 6 SINGLE FAMILY DETACHED ( <= 1,400 SF) $0 $0 $0 $0 $0 $0 $0 $0 $33,955 $69,946 CLASS 7 SINGLE FAMILY ATTACHED ( > 1,650 SF) $0 $0 $0 $0 $15,512 $34,259 $51,721 $72,697 $118,221 $169,114 CLASS 8 SINGLE FAMILY ATTACHED ( <= 1,650 SF) $0 $0 $0 $0 $30,563 $62,961 $97,277 $133,603 $136,275 $139,000 CLASS 9 APARTMENT PROPERTY $0 $0 $0 $0 $94,148 $193,945 $299,655 $411,552 $419,783 $428,178--------------------------------------------------------------------------------------- ------------------ ------------------ ------------------ ------------------ ------------------ ------------------ ------------------ ------------------ ------------------ ------------------TOTAL MAXIMUM SPECIAL TAX LEVY $5,591,530 $5,819,493 $5,935,882 $6,054,600 $5,851,630 $5,641,848 $5,429,637 $5,204,199 $5,126,969 $5,040,060
VII. DEBT SERVICE COVERAGE GROSS DEBT SERVICE COVERAGE* NA NA 474.87% 484.37% 466.83% 441.99% 259.64% 245.69% 238.98% 160.47% NET DEBT SERVICE COVERAGE ** NA NA 474.87% 484.37% 469.09% 444.20% 261.00% 247.84% 241.10% 161.93%
* MAXIMUM SPECIAL TAXES LESS CFD ADMINISTRATION, DIVIDED BY GROSS DEBT SERVICE** MAXIMUM SPECIAL TAXES LESS CFD ADMINISTRATION PLUS RESERVE EARNINGS, DIVIDED BY GROSS DEBT SERVICE

A. G. Spanos (Delta Cover Project): Scenario 2 Update Page 5
FISCAL YEAR - COLLECTION OF TAXESCALENDAR YEAR - PAYMENTS TO BOND HOLDERS
I. CFD BONDED INDEBTEDNESS TOTAL BONDED INDEBTEDNESSLESS: COSTS OF ISSUANCE / UNDERWRITER'S DISCOUNTLESS: RESERVE REQUIREMENTLESS: CAPITALIZED INTEREST---------------------------------------------------------------------------------------TOTAL BOND FINANCED FACILITIES
II. ABSORPTION - BUILDING PERMITS (as of 3/1) UNDEVELOPED PROPERTY REMAINING UNDEVELOPED ACREAGE
DEVELOPED NON-RESIDENTIAL PROPERTY NON-RESIDENTIAL BLDG. SF
DEVELOPED RESIDENTIAL PROPERTY CLASS 1 SINGLE FAMILY DETACHED ( > 2,550 SF) CLASS 2 SINGLE FAMILY DETACHED (2,151 - 2,550 SF) CLASS 3 SINGLE FAMILY DETACHED (1,751 - 2,150 SF) CLASS 4 SINGLE FAMILY DETACHED (1,551 - 1,750 SF) CLASS 5 SINGLE FAMILY DETACHED (1,401 - 1,550 SF) CLASS 6 SINGLE FAMILY DETACHED ( <= 1,400 SF) CLASS 7 SINGLE FAMILY ATTACHED ( > 1,650 SF) CLASS 8 SINGLE FAMILY ATTACHED ( <= 1,650 SF) CLASS 9 APARTMENT PROPERTY---------------------------------------------------------------------------------------TOTAL DEVELOPED RESIDENTIAL UNITS
III. MELLO-ROOS SPECIAL TAX LEVY UNDEVELOPED PROPERTY SPECIAL TAXES
NON-RESIDENTIAL PROPERTY SPECIAL TAXES
RESIDENTIAL PROPERTY SPECIAL TAXES CLASS 1 SINGLE FAMILY DETACHED ( > 2,550 SF) CLASS 2 SINGLE FAMILY DETACHED (2,151 - 2,550 SF) CLASS 3 SINGLE FAMILY DETACHED (1,751 - 2,150 SF) CLASS 4 SINGLE FAMILY DETACHED (1,551 - 1,750 SF) CLASS 5 SINGLE FAMILY DETACHED (1,401 - 1,550 SF) CLASS 6 SINGLE FAMILY DETACHED ( <= 1,400 SF) CLASS 7 SINGLE FAMILY ATTACHED ( > 1,650 SF) CLASS 8 SINGLE FAMILY ATTACHED ( <= 1,650 SF) CLASS 9 APARTMENT PROPERTY---------------------------------------------------------------------------------------TOTAL ANNUAL SPECIAL TAX LEVY
2019-20 2020-21 2021-22 2022-23 2023-24 2024-25 2025-26 2026-27 2027-28 2028-292020 2021 2022 2023 2024 2025 2026 2027 2028 2029
*Sept 2021*$0 $13,045,000 $0 $0 $0 $0 $0 $0 $0 $0$0 ($652,250) $0 $0 $0 $0 $0 $0 $0 $0$0 ($1,304,500) $0 $0 $0 $0 $0 $0 $0 $0$0 ($870,730) $0 $0 $0 $0 $0 $0 $0 $0
------------------ ------------------ ------------------ ------------------ ------------------ ------------------ ------------------ ------------------ ------------------ ------------------$0 $10,217,520 $0 $0 $0 $0 $0 $0 $0 $0
67.2 55.6 44.1 32.5 21.7 10.9 0.0 0.0 0.0 0.0
31,000 31,000 31,000 31,000 31,000 31,000 31,000 31,000 31,000 31,000
0 26 52 79 79 79 79 79 79 7967 96 125 154 188 222 257 257 257 257
197 197 197 197 222 247 272 272 272 272102 142 182 222 252 282 312 312 312 312123 123 123 123 123 123 123 123 123 123
62 62 62 62 62 62 62 62 62 62100 100 100 100 100 100 100 100 100 100
60 60 60 60 60 60 60 60 60 60280 280 280 280 280 280 280 280 280 280
------------------ ------------------ ------------------ ------------------ ------------------ ------------------ ------------------ ------------------ ------------------ ------------------991 1,086 1,181 1,277 1,366 1,455 1,545 1,545 1,545 1,545
$1,062,192 $779,133 $433,348 $922,779 $527,116 $186,160 $0 $0 $0 $0
$21,321 $21,748 $22,183 $22,626 $23,079 $23,541 $23,155 $21,895 $22,341 $22,796
$0 $0 $138,956 $286,249 $448,050 $457,011 $449,529 $425,065 $433,724 $442,556$217,124 $221,467 $336,848 $458,976 $588,161 $746,248 $880,783 $978,495 $998,428 $1,018,760$445,602 $615,213 $627,517 $640,068 $652,869 $759,924 $841,755 $886,833 $904,899 $923,326$243,779 $248,654 $366,508 $491,234 $623,150 $730,844 $814,390 $862,150 $879,713 $897,627$243,668 $288,634 $294,407 $300,295 $306,301 $312,427 $307,313 $290,588 $296,507 $302,545$108,071 $143,652 $146,525 $149,455 $152,445 $155,493 $152,948 $144,624 $147,570 $150,575$220,162 $277,054 $282,595 $288,247 $294,012 $299,892 $294,983 $278,929 $284,611 $290,407$141,780 $144,616 $147,508 $150,458 $153,468 $156,537 $153,974 $145,595 $148,561 $151,586$436,742 $445,477 $454,386 $463,474 $472,743 $482,198 $474,305 $448,491 $457,628 $466,947
------------------ ------------------ ------------------ ------------------ ------------------ ------------------ ------------------ ------------------ ------------------ ------------------$3,140,442 $3,185,648 $3,250,782 $4,173,862 $4,241,393 $4,310,275 $4,393,136 $4,482,663 $4,573,982 $4,667,126

A. G. Spanos (Delta Cover Project): Scenario 2 Update Page 6
FISCAL YEAR - COLLECTION OF TAXESCALENDAR YEAR - PAYMENTS TO BOND HOLDERS
IV. CFD SPECIAL TAX REQUIREMENT NEW BONDED INDEBTEDNESSNEW RESERVE REQUIREMENT
ANNUAL DEBT SERVICE - SERIES 2011ANNUAL DEBT SERVICE - SERIES 2015ANNUAL DEBT SERVICE - SERIES 2018ANNUAL DEBT SERVICE - SERIES 2021---------------------------------------------------------------------------------------TOTAL ANNUAL DEBT SERVICECFD ADMINISTRATIONRESERVE FUND INTEREST (6% DELINQUENCY)CAPITALIZED INTERESTPAY-AS-YOU-GO FACILITIES---------------------------------------------------------------------------------------NET ANNUAL DEBT SERVICE
ANNUAL SURPLUS/(DEFICIT)CUMULATIVE SURPLUS/(DEFICIT)
V. AVERAGE ANNUAL SPECIAL TAX UNDEVELOPED PROPERTY, PER ACRE
NON-RESIDENTIAL PROPERTY, PER BLDG. SF
RESIDENTIAL PROPERTY, PER UNIT CLASS 1 SINGLE FAMILY DETACHED ( > 2,550 SF) CLASS 2 SINGLE FAMILY DETACHED (2,151 - 2,550 SF) CLASS 3 SINGLE FAMILY DETACHED (1,751 - 2,150 SF) CLASS 4 SINGLE FAMILY DETACHED (1,551 - 1,750 SF) CLASS 5 SINGLE FAMILY DETACHED (1,401 - 1,550 SF) CLASS 6 SINGLE FAMILY DETACHED ( <= 1,400 SF) CLASS 7 SINGLE FAMILY ATTACHED ( > 1,650 SF) CLASS 8 SINGLE FAMILY ATTACHED ( <= 1,650 SF) CLASS 9 APARTMENT PROPERTY
VI. MAXIMUM SPECIAL TAX LEVY UNDEVELOPED PROPERTY
NON-RESIDENTIAL PROPERTY
RESIDENTIAL PROPERTY CLASS 1 SINGLE FAMILY DETACHED ( > 2,550 SF) CLASS 2 SINGLE FAMILY DETACHED (2,151 - 2,550 SF) CLASS 3 SINGLE FAMILY DETACHED (1,751 - 2,150 SF) CLASS 4 SINGLE FAMILY DETACHED (1,551 - 1,750 SF) CLASS 5 SINGLE FAMILY DETACHED (1,401 - 1,550 SF) CLASS 6 SINGLE FAMILY DETACHED ( <= 1,400 SF) CLASS 7 SINGLE FAMILY ATTACHED ( > 1,650 SF) CLASS 8 SINGLE FAMILY ATTACHED ( <= 1,650 SF) CLASS 9 APARTMENT PROPERTY---------------------------------------------------------------------------------------TOTAL MAXIMUM SPECIAL TAX LEVY
VII. DEBT SERVICE COVERAGE GROSS DEBT SERVICE COVERAGE* NET DEBT SERVICE COVERAGE **
2019-20 2020-21 2021-22 2022-23 2023-24 2024-25 2025-26 2026-27 2027-28 2028-292020 2021 2022 2023 2024 2025 2026 2027 2028 2029
$0 $13,045,000 $0 $0 $0 $0 $0 $0 $0 $0$0 $1,304,500 $0 $0 $0 $0 $0 $0 $0 $0
$1,405,191 $1,433,295 $1,461,961 $1,491,200 $1,521,024 $1,551,445 $1,582,473 $1,614,123 $1,646,405 $1,679,333$800,256 $816,261 $832,587 $849,238 $866,223 $883,547 $901,218 $919,243 $937,628 $956,380$945,000 $945,000 $945,000 $958,523 $977,693 $997,247 $1,017,192 $1,037,536 $1,058,287 $1,079,452
$0 $0 $880,538 $880,538 $880,538 $880,538 $893,138 $911,001 $929,221 $947,805------------------ ------------------ ------------------ ------------------ ------------------ ------------------ ------------------ ------------------ ------------------ ------------------$3,150,447 $3,194,556 $4,120,085 $4,179,499 $4,245,478 $4,312,777 $4,394,022 $4,481,902 $4,571,540 $4,662,971
$54,855 $55,952 $76,095 $77,616 $79,169 $80,752 $82,367 $84,014 $85,695 $87,409($64,860) ($64,860) ($64,860) ($83,253) ($83,253) ($83,253) ($83,253) ($83,253) ($83,253) ($83,253)
$0 $0 ($880,538) $0 $0 $0 $0 $0 $0 $0$0 $0 $0 $0 $0 $0 $0 $0 $0 $0
------------------ ------------------ ------------------ ------------------ ------------------ ------------------ ------------------ ------------------ ------------------ ------------------$3,140,442 $3,185,648 $3,250,782 $4,173,862 $4,241,393 $4,310,275 $4,393,136 $4,482,663 $4,573,982 $4,667,126
$0 $0 $0 $0 $0 $0 $0 $0 $0 $0$0 $0 $0 $0 $0 $0 $0 $0 $0 $0
-- DEBT SERVICE SCHEDULE ASSUMES MARCH 1 AND SEPTEMBER 1 BOND PAYMENTS --
$13,438 $11,600 $7,787 $20,910 $16,223 $8,578 $0 $0 $0 $0
$0.69 $0.70 $0.72 $0.73 $0.74 $0.76 $0.75 $0.71 $0.72 $0.74
$0 $0 $5,344 $5,505 $5,672 $5,785 $5,690 $5,381 $5,490 $5,602$3,241 $3,305 $3,509 $3,672 $3,819 $3,969 $3,967 $3,807 $3,885 $3,964$3,031 $3,123 $3,185 $3,249 $3,314 $3,423 $3,408 $3,260 $3,327 $3,395$2,390 $2,438 $2,581 $2,699 $2,807 $2,900 $2,888 $2,763 $2,820 $2,877$2,277 $2,347 $2,394 $2,441 $2,490 $2,540 $2,498 $2,363 $2,411 $2,460$2,251 $2,317 $2,363 $2,411 $2,459 $2,508 $2,467 $2,333 $2,380 $2,429$2,685 $2,771 $2,826 $2,882 $2,940 $2,999 $2,950 $2,789 $2,846 $2,904$2,363 $2,410 $2,458 $2,508 $2,558 $2,609 $2,566 $2,427 $2,476 $2,526$1,560 $1,591 $1,623 $1,655 $1,688 $1,722 $1,694 $1,602 $1,634 $1,668
$2,876,415 $2,492,952 $2,106,769 $1,704,142 $1,279,792 $871,882 $447,144 $0 $0 $0
$21,321 $21,748 $22,183 $22,626 $23,079 $23,541 $24,011 $24,492 $24,981 $25,481
$0 $0 $138,956 $286,249 $448,050 $457,011 $466,151 $475,474 $484,983 $494,683$217,124 $221,467 $336,848 $458,976 $588,161 $746,248 $913,351 $1,094,537 $1,116,428 $1,138,756$445,602 $615,213 $627,517 $640,068 $652,869 $759,924 $872,879 $992,004 $1,011,845 $1,032,081$243,779 $248,654 $366,508 $491,234 $623,150 $730,844 $844,502 $964,394 $983,682 $1,003,356$243,668 $288,634 $294,407 $300,295 $306,301 $312,427 $318,676 $325,049 $331,550 $338,181$108,071 $143,652 $146,525 $149,455 $152,445 $155,493 $158,603 $161,775 $165,011 $168,311$220,162 $277,054 $282,595 $288,247 $294,012 $299,892 $305,890 $312,008 $318,248 $324,613$141,780 $144,616 $147,508 $150,458 $153,468 $156,537 $159,668 $162,861 $166,118 $169,441$436,742 $445,477 $454,386 $463,474 $472,743 $482,198 $491,842 $501,679 $511,713 $521,947
------------------ ------------------ ------------------ ------------------ ------------------ ------------------ ------------------ ------------------ ------------------ ------------------$4,954,665 $4,899,467 $4,924,203 $4,955,225 $4,994,069 $4,995,998 $5,002,717 $5,014,274 $5,114,559 $5,216,850
155.53% 151.62% 117.67% 116.70% 115.77% 113.97% 111.98% 110.00% 110.00% 110.00%157.59% 153.65% 119.24% 118.70% 117.73% 115.90% 113.87% 111.86% 111.82% 111.79%
* MAXIMUM SPECIAL TAXES LESS CFD ADMINISTRATION, DIVIDED BY GROSS DEBT SERVICE** MAXIMUM SPECIAL TAXES LESS CFD ADMINISTRATION PLUS RESERVE EARNINGS, DIVIDED BY GROSS DEBT SERVICE
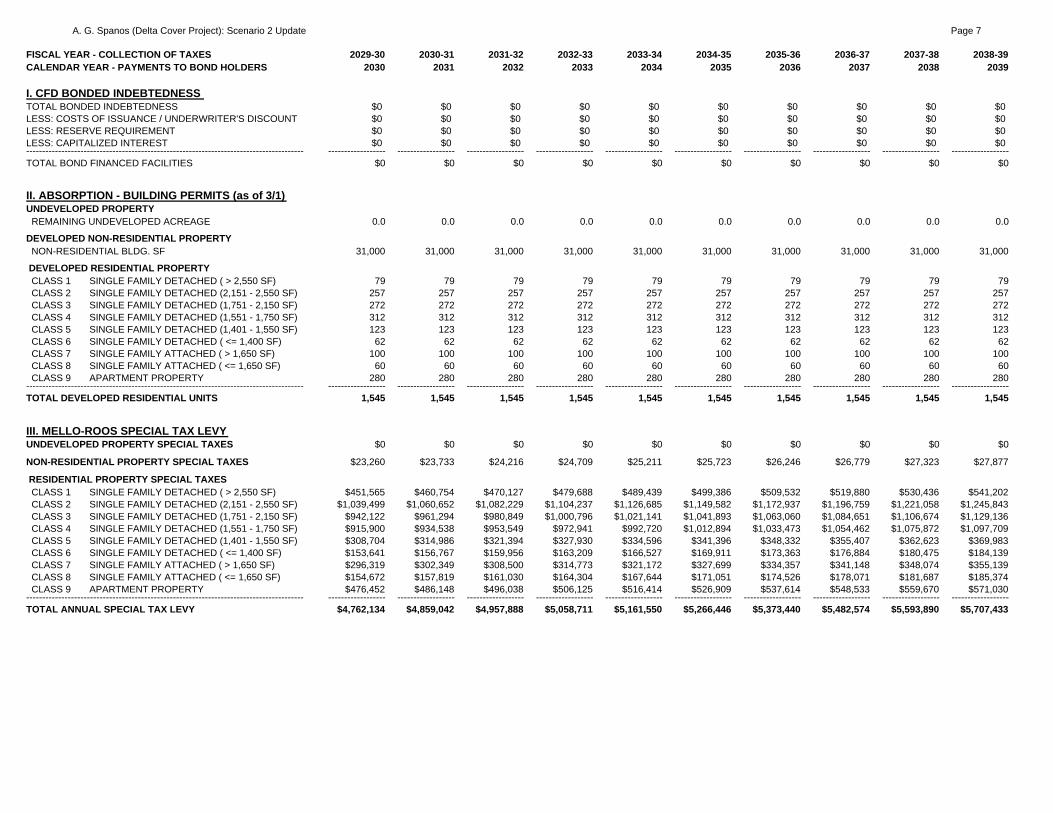
A. G. Spanos (Delta Cover Project): Scenario 2 Update Page 7
FISCAL YEAR - COLLECTION OF TAXESCALENDAR YEAR - PAYMENTS TO BOND HOLDERS
I. CFD BONDED INDEBTEDNESS TOTAL BONDED INDEBTEDNESSLESS: COSTS OF ISSUANCE / UNDERWRITER'S DISCOUNTLESS: RESERVE REQUIREMENTLESS: CAPITALIZED INTEREST---------------------------------------------------------------------------------------TOTAL BOND FINANCED FACILITIES
II. ABSORPTION - BUILDING PERMITS (as of 3/1) UNDEVELOPED PROPERTY REMAINING UNDEVELOPED ACREAGE
DEVELOPED NON-RESIDENTIAL PROPERTY NON-RESIDENTIAL BLDG. SF
DEVELOPED RESIDENTIAL PROPERTY CLASS 1 SINGLE FAMILY DETACHED ( > 2,550 SF) CLASS 2 SINGLE FAMILY DETACHED (2,151 - 2,550 SF) CLASS 3 SINGLE FAMILY DETACHED (1,751 - 2,150 SF) CLASS 4 SINGLE FAMILY DETACHED (1,551 - 1,750 SF) CLASS 5 SINGLE FAMILY DETACHED (1,401 - 1,550 SF) CLASS 6 SINGLE FAMILY DETACHED ( <= 1,400 SF) CLASS 7 SINGLE FAMILY ATTACHED ( > 1,650 SF) CLASS 8 SINGLE FAMILY ATTACHED ( <= 1,650 SF) CLASS 9 APARTMENT PROPERTY---------------------------------------------------------------------------------------TOTAL DEVELOPED RESIDENTIAL UNITS
III. MELLO-ROOS SPECIAL TAX LEVY UNDEVELOPED PROPERTY SPECIAL TAXES
NON-RESIDENTIAL PROPERTY SPECIAL TAXES
RESIDENTIAL PROPERTY SPECIAL TAXES CLASS 1 SINGLE FAMILY DETACHED ( > 2,550 SF) CLASS 2 SINGLE FAMILY DETACHED (2,151 - 2,550 SF) CLASS 3 SINGLE FAMILY DETACHED (1,751 - 2,150 SF) CLASS 4 SINGLE FAMILY DETACHED (1,551 - 1,750 SF) CLASS 5 SINGLE FAMILY DETACHED (1,401 - 1,550 SF) CLASS 6 SINGLE FAMILY DETACHED ( <= 1,400 SF) CLASS 7 SINGLE FAMILY ATTACHED ( > 1,650 SF) CLASS 8 SINGLE FAMILY ATTACHED ( <= 1,650 SF) CLASS 9 APARTMENT PROPERTY---------------------------------------------------------------------------------------TOTAL ANNUAL SPECIAL TAX LEVY
2029-30 2030-31 2031-32 2032-33 2033-34 2034-35 2035-36 2036-37 2037-38 2038-392030 2031 2032 2033 2034 2035 2036 2037 2038 2039
$0 $0 $0 $0 $0 $0 $0 $0 $0 $0$0 $0 $0 $0 $0 $0 $0 $0 $0 $0$0 $0 $0 $0 $0 $0 $0 $0 $0 $0$0 $0 $0 $0 $0 $0 $0 $0 $0 $0
------------------ ------------------ ------------------ ------------------ ------------------ ------------------ ------------------ ------------------ ------------------ ------------------$0 $0 $0 $0 $0 $0 $0 $0 $0 $0
0.0 0.0 0.0 0.0 0.0 0.0 0.0 0.0 0.0 0.0
31,000 31,000 31,000 31,000 31,000 31,000 31,000 31,000 31,000 31,000
79 79 79 79 79 79 79 79 79 79257 257 257 257 257 257 257 257 257 257272 272 272 272 272 272 272 272 272 272312 312 312 312 312 312 312 312 312 312123 123 123 123 123 123 123 123 123 123
62 62 62 62 62 62 62 62 62 62100 100 100 100 100 100 100 100 100 100
60 60 60 60 60 60 60 60 60 60280 280 280 280 280 280 280 280 280 280
------------------ ------------------ ------------------ ------------------ ------------------ ------------------ ------------------ ------------------ ------------------ ------------------1,545 1,545 1,545 1,545 1,545 1,545 1,545 1,545 1,545 1,545
$0 $0 $0 $0 $0 $0 $0 $0 $0 $0
$23,260 $23,733 $24,216 $24,709 $25,211 $25,723 $26,246 $26,779 $27,323 $27,877
$451,565 $460,754 $470,127 $479,688 $489,439 $499,386 $509,532 $519,880 $530,436 $541,202$1,039,499 $1,060,652 $1,082,229 $1,104,237 $1,126,685 $1,149,582 $1,172,937 $1,196,759 $1,221,058 $1,245,843
$942,122 $961,294 $980,849 $1,000,796 $1,021,141 $1,041,893 $1,063,060 $1,084,651 $1,106,674 $1,129,136$915,900 $934,538 $953,549 $972,941 $992,720 $1,012,894 $1,033,473 $1,054,462 $1,075,872 $1,097,709$308,704 $314,986 $321,394 $327,930 $334,596 $341,396 $348,332 $355,407 $362,623 $369,983$153,641 $156,767 $159,956 $163,209 $166,527 $169,911 $173,363 $176,884 $180,475 $184,139$296,319 $302,349 $308,500 $314,773 $321,172 $327,699 $334,357 $341,148 $348,074 $355,139$154,672 $157,819 $161,030 $164,304 $167,644 $171,051 $174,526 $178,071 $181,687 $185,374$476,452 $486,148 $496,038 $506,125 $516,414 $526,909 $537,614 $548,533 $559,670 $571,030
------------------ ------------------ ------------------ ------------------ ------------------ ------------------ ------------------ ------------------ ------------------ ------------------$4,762,134 $4,859,042 $4,957,888 $5,058,711 $5,161,550 $5,266,446 $5,373,440 $5,482,574 $5,593,890 $5,707,433

A. G. Spanos (Delta Cover Project): Scenario 2 Update Page 8
FISCAL YEAR - COLLECTION OF TAXESCALENDAR YEAR - PAYMENTS TO BOND HOLDERS
IV. CFD SPECIAL TAX REQUIREMENT NEW BONDED INDEBTEDNESSNEW RESERVE REQUIREMENT
ANNUAL DEBT SERVICE - SERIES 2011ANNUAL DEBT SERVICE - SERIES 2015ANNUAL DEBT SERVICE - SERIES 2018ANNUAL DEBT SERVICE - SERIES 2021---------------------------------------------------------------------------------------TOTAL ANNUAL DEBT SERVICECFD ADMINISTRATIONRESERVE FUND INTEREST (6% DELINQUENCY)CAPITALIZED INTERESTPAY-AS-YOU-GO FACILITIES---------------------------------------------------------------------------------------NET ANNUAL DEBT SERVICE
ANNUAL SURPLUS/(DEFICIT)CUMULATIVE SURPLUS/(DEFICIT)
V. AVERAGE ANNUAL SPECIAL TAX UNDEVELOPED PROPERTY, PER ACRE
NON-RESIDENTIAL PROPERTY, PER BLDG. SF
RESIDENTIAL PROPERTY, PER UNIT CLASS 1 SINGLE FAMILY DETACHED ( > 2,550 SF) CLASS 2 SINGLE FAMILY DETACHED (2,151 - 2,550 SF) CLASS 3 SINGLE FAMILY DETACHED (1,751 - 2,150 SF) CLASS 4 SINGLE FAMILY DETACHED (1,551 - 1,750 SF) CLASS 5 SINGLE FAMILY DETACHED (1,401 - 1,550 SF) CLASS 6 SINGLE FAMILY DETACHED ( <= 1,400 SF) CLASS 7 SINGLE FAMILY ATTACHED ( > 1,650 SF) CLASS 8 SINGLE FAMILY ATTACHED ( <= 1,650 SF) CLASS 9 APARTMENT PROPERTY
VI. MAXIMUM SPECIAL TAX LEVY UNDEVELOPED PROPERTY
NON-RESIDENTIAL PROPERTY
RESIDENTIAL PROPERTY CLASS 1 SINGLE FAMILY DETACHED ( > 2,550 SF) CLASS 2 SINGLE FAMILY DETACHED (2,151 - 2,550 SF) CLASS 3 SINGLE FAMILY DETACHED (1,751 - 2,150 SF) CLASS 4 SINGLE FAMILY DETACHED (1,551 - 1,750 SF) CLASS 5 SINGLE FAMILY DETACHED (1,401 - 1,550 SF) CLASS 6 SINGLE FAMILY DETACHED ( <= 1,400 SF) CLASS 7 SINGLE FAMILY ATTACHED ( > 1,650 SF) CLASS 8 SINGLE FAMILY ATTACHED ( <= 1,650 SF) CLASS 9 APARTMENT PROPERTY---------------------------------------------------------------------------------------TOTAL MAXIMUM SPECIAL TAX LEVY
VII. DEBT SERVICE COVERAGE GROSS DEBT SERVICE COVERAGE* NET DEBT SERVICE COVERAGE **
2029-30 2030-31 2031-32 2032-33 2033-34 2034-35 2035-36 2036-37 2037-38 2038-392030 2031 2032 2033 2034 2035 2036 2037 2038 2039
$0 $0 $0 $0 $0 $0 $0 $0 $0 $0$0 $0 $0 $0 $0 $0 $0 $0 $0 $0
$1,712,920 $1,747,179 $1,782,122 $1,817,765 $1,854,120 $1,891,202 $1,929,026 $1,967,607 $2,006,959 $2,047,098$975,508 $995,018 $1,014,918 $1,035,217 $1,055,921 $1,077,039 $1,098,580 $1,120,552 $1,142,963 $1,165,822
$1,101,042 $1,123,062 $1,145,524 $1,168,434 $1,191,803 $1,215,639 $1,239,952 $1,264,751 $1,290,046 $1,315,847$966,761 $986,096 $1,005,818 $1,025,935 $1,046,453 $1,067,383 $1,088,730 $1,110,505 $1,132,715 $1,155,369------------------ ------------------ ------------------ ------------------ ------------------ ------------------ ------------------ ------------------ ------------------ ------------------
$4,756,231 $4,851,355 $4,948,382 $5,047,350 $5,148,297 $5,251,263 $5,356,288 $5,463,414 $5,572,682 $5,684,136$89,157 $90,940 $92,759 $94,614 $96,506 $98,436 $100,405 $102,413 $104,461 $106,551
($83,253) ($83,253) ($83,253) ($83,253) ($83,253) ($83,253) ($83,253) ($83,253) ($83,253) ($83,253)$0 $0 $0 $0 $0 $0 $0 $0 $0 $0$0 $0 $0 $0 $0 $0 $0 $0 $0 $0
------------------ ------------------ ------------------ ------------------ ------------------ ------------------ ------------------ ------------------ ------------------ ------------------$4,762,134 $4,859,042 $4,957,888 $5,058,711 $5,161,550 $5,266,446 $5,373,440 $5,482,574 $5,593,890 $5,707,433
$0 $0 $0 $0 $0 $0 $0 $0 $0 $0$0 $0 $0 $0 $0 $0 $0 $0 $0 $0
-- DEBT SERVICE SCHEDULE ASSUMES MARCH 1 AND SEPTEMBER 1 BOND PAYMENTS --
$0 $0 $0 $0 $0 $0 $0 $0 $0 $0
$0.75 $0.77 $0.78 $0.80 $0.81 $0.83 $0.85 $0.86 $0.88 $0.90
$5,716 $5,832 $5,951 $6,072 $6,195 $6,321 $6,450 $6,581 $6,714 $6,851$4,045 $4,127 $4,211 $4,297 $4,384 $4,473 $4,564 $4,657 $4,751 $4,848$3,464 $3,534 $3,606 $3,679 $3,754 $3,830 $3,908 $3,988 $4,069 $4,151$2,936 $2,995 $3,056 $3,118 $3,182 $3,246 $3,312 $3,380 $3,448 $3,518$2,510 $2,561 $2,613 $2,666 $2,720 $2,776 $2,832 $2,889 $2,948 $3,008$2,478 $2,529 $2,580 $2,632 $2,686 $2,741 $2,796 $2,853 $2,911 $2,970$2,963 $3,023 $3,085 $3,148 $3,212 $3,277 $3,344 $3,411 $3,481 $3,551$2,578 $2,630 $2,684 $2,738 $2,794 $2,851 $2,909 $2,968 $3,028 $3,090$1,702 $1,736 $1,772 $1,808 $1,844 $1,882 $1,920 $1,959 $1,999 $2,039
$0 $0 $0 $0 $0 $0 $0 $0 $0 $0
$25,991 $26,510 $27,041 $27,582 $28,133 $28,696 $29,270 $29,855 $30,452 $31,061
$504,577 $514,668 $524,962 $535,461 $546,170 $557,094 $568,235 $579,600 $591,192 $603,016$1,161,531 $1,184,762 $1,208,457 $1,232,626 $1,257,279 $1,282,424 $1,308,073 $1,334,234 $1,360,919 $1,388,137$1,052,723 $1,073,777 $1,095,253 $1,117,158 $1,139,501 $1,162,291 $1,185,537 $1,209,248 $1,233,433 $1,258,101$1,023,423 $1,043,891 $1,064,769 $1,086,065 $1,107,786 $1,129,942 $1,152,540 $1,175,591 $1,199,103 $1,223,085
$344,945 $351,844 $358,881 $366,058 $373,379 $380,847 $388,464 $396,233 $404,158 $412,241$171,677 $175,111 $178,613 $182,185 $185,829 $189,546 $193,337 $197,203 $201,147 $205,170$331,106 $337,728 $344,482 $351,372 $358,399 $365,567 $372,879 $380,336 $387,943 $395,702$172,829 $176,286 $179,812 $183,408 $187,076 $190,818 $194,634 $198,527 $202,497 $206,547$532,386 $543,034 $553,894 $564,972 $576,272 $587,797 $599,553 $611,544 $623,775 $636,250
------------------ ------------------ ------------------ ------------------ ------------------ ------------------ ------------------ ------------------ ------------------ ------------------$5,321,187 $5,427,611 $5,536,163 $5,646,887 $5,759,824 $5,875,021 $5,992,521 $6,112,372 $6,234,619 $6,359,312
110.00% 110.00% 110.00% 110.00% 110.00% 110.00% 110.00% 110.00% 110.00% 110.00%111.75% 111.72% 111.69% 111.65% 111.62% 111.59% 111.56% 111.53% 111.50% 111.47%
* MAXIMUM SPECIAL TAXES LESS CFD ADMINISTRATION, DIVIDED BY GROSS DEBT SERVICE** MAXIMUM SPECIAL TAXES LESS CFD ADMINISTRATION PLUS RESERVE EARNINGS, DIVIDED BY GROSS DEBT SERVICE

A. G. Spanos (Delta Cover Project): Scenario 2 Update Page 9
FISCAL YEAR - COLLECTION OF TAXESCALENDAR YEAR - PAYMENTS TO BOND HOLDERS
I. CFD BONDED INDEBTEDNESS TOTAL BONDED INDEBTEDNESSLESS: COSTS OF ISSUANCE / UNDERWRITER'S DISCOUNTLESS: RESERVE REQUIREMENTLESS: CAPITALIZED INTEREST---------------------------------------------------------------------------------------TOTAL BOND FINANCED FACILITIES
II. ABSORPTION - BUILDING PERMITS (as of 3/1) UNDEVELOPED PROPERTY REMAINING UNDEVELOPED ACREAGE
DEVELOPED NON-RESIDENTIAL PROPERTY NON-RESIDENTIAL BLDG. SF
DEVELOPED RESIDENTIAL PROPERTY CLASS 1 SINGLE FAMILY DETACHED ( > 2,550 SF) CLASS 2 SINGLE FAMILY DETACHED (2,151 - 2,550 SF) CLASS 3 SINGLE FAMILY DETACHED (1,751 - 2,150 SF) CLASS 4 SINGLE FAMILY DETACHED (1,551 - 1,750 SF) CLASS 5 SINGLE FAMILY DETACHED (1,401 - 1,550 SF) CLASS 6 SINGLE FAMILY DETACHED ( <= 1,400 SF) CLASS 7 SINGLE FAMILY ATTACHED ( > 1,650 SF) CLASS 8 SINGLE FAMILY ATTACHED ( <= 1,650 SF) CLASS 9 APARTMENT PROPERTY---------------------------------------------------------------------------------------TOTAL DEVELOPED RESIDENTIAL UNITS
III. MELLO-ROOS SPECIAL TAX LEVY UNDEVELOPED PROPERTY SPECIAL TAXES
NON-RESIDENTIAL PROPERTY SPECIAL TAXES
RESIDENTIAL PROPERTY SPECIAL TAXES CLASS 1 SINGLE FAMILY DETACHED ( > 2,550 SF) CLASS 2 SINGLE FAMILY DETACHED (2,151 - 2,550 SF) CLASS 3 SINGLE FAMILY DETACHED (1,751 - 2,150 SF) CLASS 4 SINGLE FAMILY DETACHED (1,551 - 1,750 SF) CLASS 5 SINGLE FAMILY DETACHED (1,401 - 1,550 SF) CLASS 6 SINGLE FAMILY DETACHED ( <= 1,400 SF) CLASS 7 SINGLE FAMILY ATTACHED ( > 1,650 SF) CLASS 8 SINGLE FAMILY ATTACHED ( <= 1,650 SF) CLASS 9 APARTMENT PROPERTY---------------------------------------------------------------------------------------TOTAL ANNUAL SPECIAL TAX LEVY
2039-40 2040-41 2041-42 2042-43 2043-44 2044-45 2045-46 2046-47 2047-48 2048-492040 2041 2042 2043 2044 2045 2046 2047 2048 2049
$0 $0 $0 $0 $0 $0 $0 $0 $0 $0$0 $0 $0 $0 $0 $0 $0 $0 $0 $0$0 $0 $0 $0 $0 $0 $0 $0 $0 $0$0 $0 $0 $0 $0 $0 $0 $0 $0 $0
------------------ ------------------ ------------------ ------------------ ------------------ ------------------ ------------------ ------------------ ------------------ ------------------$0 $0 $0 $0 $0 $0 $0 $0 $0 $0
0.0 0.0 0.0 0.0 0.0 0.0 0.0 0.0 0.0 0.0
31,000 31,000 31,000 31,000 31,000 31,000 31,000 31,000 31,000 31,000
79 79 79 79 79 79 79 79 79 79257 257 257 257 257 257 257 257 257 257272 272 272 272 272 272 272 272 272 272312 312 312 312 312 312 312 312 312 312123 123 123 123 123 123 123 123 123 123
62 62 62 62 62 62 62 62 62 62100 100 100 100 100 100 100 100 100 100
60 60 60 60 60 60 60 60 60 60280 280 280 280 280 280 280 280 280 280
------------------ ------------------ ------------------ ------------------ ------------------ ------------------ ------------------ ------------------ ------------------ ------------------1,545 1,545 1,545 1,545 1,545 1,545 1,545 1,545 1,545 1,545
$0 $0 $0 $0 $0 $0 $0 $0 $0 $0
$28,443 $19,251 $18,860 $19,383 $19,776 $14,315 $13,978 $14,261 $7,712 $6,948
$552,184 $373,738 $366,135 $376,290 $383,920 $277,914 $271,359 $276,859 $149,715 $134,884$1,271,123 $860,340 $842,840 $866,216 $883,781 $639,755 $624,667 $637,327 $344,642 $310,502$1,152,049 $779,747 $763,886 $785,072 $800,991 $579,825 $566,150 $577,624 $312,357 $281,415$1,119,984 $758,044 $742,625 $763,221 $778,697 $563,687 $550,393 $561,547 $303,663 $273,583
$377,491 $255,499 $250,302 $257,244 $262,460 $189,991 $185,510 $189,270 $102,350 $92,211$187,875 $127,161 $124,574 $128,029 $130,625 $94,557 $92,327 $94,199 $50,939 $45,893$362,346 $245,248 $240,260 $246,923 $251,930 $182,368 $178,067 $181,676 $98,243 $88,512$189,136 $128,014 $125,410 $128,888 $131,502 $95,192 $92,947 $94,831 $51,281 $46,201$582,617 $394,336 $386,314 $397,029 $405,079 $293,231 $286,315 $292,118 $157,966 $142,318
------------------ ------------------ ------------------ ------------------ ------------------ ------------------ ------------------ ------------------ ------------------ ------------------$5,823,247 $3,941,377 $3,861,205 $3,968,294 $4,048,761 $2,930,837 $2,861,713 $2,919,710 $1,578,867 $1,422,466

A. G. Spanos (Delta Cover Project): Scenario 2 Update Page 10
FISCAL YEAR - COLLECTION OF TAXESCALENDAR YEAR - PAYMENTS TO BOND HOLDERS
IV. CFD SPECIAL TAX REQUIREMENT NEW BONDED INDEBTEDNESSNEW RESERVE REQUIREMENT
ANNUAL DEBT SERVICE - SERIES 2011ANNUAL DEBT SERVICE - SERIES 2015ANNUAL DEBT SERVICE - SERIES 2018ANNUAL DEBT SERVICE - SERIES 2021---------------------------------------------------------------------------------------TOTAL ANNUAL DEBT SERVICECFD ADMINISTRATIONRESERVE FUND INTEREST (6% DELINQUENCY)CAPITALIZED INTERESTPAY-AS-YOU-GO FACILITIES---------------------------------------------------------------------------------------NET ANNUAL DEBT SERVICE
ANNUAL SURPLUS/(DEFICIT)CUMULATIVE SURPLUS/(DEFICIT)
V. AVERAGE ANNUAL SPECIAL TAX UNDEVELOPED PROPERTY, PER ACRE
NON-RESIDENTIAL PROPERTY, PER BLDG. SF
RESIDENTIAL PROPERTY, PER UNIT CLASS 1 SINGLE FAMILY DETACHED ( > 2,550 SF) CLASS 2 SINGLE FAMILY DETACHED (2,151 - 2,550 SF) CLASS 3 SINGLE FAMILY DETACHED (1,751 - 2,150 SF) CLASS 4 SINGLE FAMILY DETACHED (1,551 - 1,750 SF) CLASS 5 SINGLE FAMILY DETACHED (1,401 - 1,550 SF) CLASS 6 SINGLE FAMILY DETACHED ( <= 1,400 SF) CLASS 7 SINGLE FAMILY ATTACHED ( > 1,650 SF) CLASS 8 SINGLE FAMILY ATTACHED ( <= 1,650 SF) CLASS 9 APARTMENT PROPERTY
VI. MAXIMUM SPECIAL TAX LEVY UNDEVELOPED PROPERTY
NON-RESIDENTIAL PROPERTY
RESIDENTIAL PROPERTY CLASS 1 SINGLE FAMILY DETACHED ( > 2,550 SF) CLASS 2 SINGLE FAMILY DETACHED (2,151 - 2,550 SF) CLASS 3 SINGLE FAMILY DETACHED (1,751 - 2,150 SF) CLASS 4 SINGLE FAMILY DETACHED (1,551 - 1,750 SF) CLASS 5 SINGLE FAMILY DETACHED (1,401 - 1,550 SF) CLASS 6 SINGLE FAMILY DETACHED ( <= 1,400 SF) CLASS 7 SINGLE FAMILY ATTACHED ( > 1,650 SF) CLASS 8 SINGLE FAMILY ATTACHED ( <= 1,650 SF) CLASS 9 APARTMENT PROPERTY---------------------------------------------------------------------------------------TOTAL MAXIMUM SPECIAL TAX LEVY
VII. DEBT SERVICE COVERAGE GROSS DEBT SERVICE COVERAGE* NET DEBT SERVICE COVERAGE **
2039-40 2040-41 2041-42 2042-43 2043-44 2044-45 2045-46 2046-47 2047-48 2048-492040 2041 2042 2043 2044 2045 2046 2047 2048 2049
$0 ($20,000,000) $0 $0 $0 ($12,000,000) $0 $0 ($14,000,000) $0$0 ($2,000,000) $0 $0 $0 ($1,200,000) $0 $0 ($1,400,000) $0
$2,088,040 $2,129,801 $0 $0 $0 $0 $0 $0 $0 $0$1,189,139 $1,212,921 $1,237,180 $1,261,923 $1,287,162 $1,312,905 $0 $0 $0 $0$1,342,163 $1,369,007 $1,396,387 $1,424,315 $1,452,801 $1,481,857 $1,511,494 $1,541,724 $1,572,558 $0$1,178,477 $1,202,046 $1,226,087 $1,250,609 $1,275,621 $1,301,133 $1,327,156 $1,353,699 $1,380,773 $1,408,389------------------ ------------------ ------------------ ------------------ ------------------ ------------------ ------------------ ------------------ ------------------ ------------------$5,797,819 $5,913,775 $3,859,654 $3,936,847 $4,015,584 $4,095,895 $2,838,650 $2,895,423 $2,953,332 $1,408,389
$108,682 $110,855 $84,804 $86,500 $88,230 $89,995 $61,197 $62,421 $63,669 $32,471($83,253) ($83,253) ($83,253) ($55,053) ($55,053) ($55,053) ($38,133) ($38,133) ($38,133) ($18,393)
$0 $0 $0 $0 $0 $0 $0 $0 $0 $0$0 $0 $0 $0 $0 $0 $0 $0 $0 $0
------------------ ------------------ ------------------ ------------------ ------------------ ------------------ ------------------ ------------------ ------------------ ------------------$5,823,247 $3,941,377 $3,861,205 $3,968,294 $4,048,761 $2,930,837 $2,861,713 $2,919,710 $1,578,867 $1,422,466
$0 $0 $0 $0 $0 $0 $0 $0 $0 $0$0 $0 $0 $0 $0 $0 $0 $0 $0 $0
-- DEBT SERVICE SCHEDULE ASSUMES MARCH 1 AND SEPTEMBER 1 BOND PAYMENTS --
$0 $0 $0 $0 $0 $0 $0 $0 $0 $0
$0.92 $0.62 $0.61 $0.63 $0.64 $0.46 $0.45 $0.46 $0.25 $0.22
$6,990 $4,731 $4,635 $4,763 $4,860 $3,518 $3,435 $3,505 $1,895 $1,707$4,946 $3,348 $3,280 $3,370 $3,439 $2,489 $2,431 $2,480 $1,341 $1,208$4,235 $2,867 $2,808 $2,886 $2,945 $2,132 $2,081 $2,124 $1,148 $1,035$3,590 $2,430 $2,380 $2,446 $2,496 $1,807 $1,764 $1,800 $973 $877$3,069 $2,077 $2,035 $2,091 $2,134 $1,545 $1,508 $1,539 $832 $750$3,030 $2,051 $2,009 $2,065 $2,107 $1,525 $1,489 $1,519 $822 $740$3,623 $2,452 $2,403 $2,469 $2,519 $1,824 $1,781 $1,817 $982 $885$3,152 $2,134 $2,090 $2,148 $2,192 $1,587 $1,549 $1,581 $855 $770$2,081 $1,408 $1,380 $1,418 $1,447 $1,047 $1,023 $1,043 $564 $508
$0 $0 $0 $0 $0 $0 $0 $0 $0 $0
$31,682 $32,316 $32,962 $33,622 $34,294 $34,980 $35,680 $36,393 $37,121 $37,864
$615,076 $627,378 $639,925 $652,724 $665,778 $679,094 $692,676 $706,529 $720,660 $735,073$1,415,900 $1,444,218 $1,473,102 $1,502,565 $1,532,616 $1,563,268 $1,594,534 $1,626,424 $1,658,953 $1,692,132$1,283,264 $1,308,929 $1,335,107 $1,361,810 $1,389,046 $1,416,827 $1,445,163 $1,474,066 $1,503,548 $1,533,619$1,247,547 $1,272,498 $1,297,948 $1,323,907 $1,350,385 $1,377,392 $1,404,940 $1,433,039 $1,461,700 $1,490,934
$420,486 $428,896 $437,473 $446,223 $455,147 $464,250 $473,535 $483,006 $492,666 $502,519$209,274 $213,459 $217,728 $222,083 $226,525 $231,055 $235,676 $240,390 $245,197 $250,101$403,616 $411,688 $419,922 $428,320 $436,887 $445,624 $454,537 $463,628 $472,900 $482,358$210,678 $214,892 $219,189 $223,573 $228,045 $232,606 $237,258 $242,003 $246,843 $251,780$648,975 $661,955 $675,194 $688,698 $702,472 $716,521 $730,852 $745,469 $760,378 $775,586
------------------ ------------------ ------------------ ------------------ ------------------ ------------------ ------------------ ------------------ ------------------ ------------------$6,486,498 $6,616,228 $6,748,552 $6,883,523 $7,021,194 $7,161,618 $7,304,850 $7,450,947 $7,599,966 $7,751,965
110.00% 110.00% 172.65% 172.65% 172.65% 172.65% 255.18% 255.18% 255.18% 548.11%111.44% 111.41% 174.81% 174.05% 174.02% 174.00% 256.52% 256.50% 256.47% 549.41%
* MAXIMUM SPECIAL TAXES LESS CFD ADMINISTRATION, DIVIDED BY GROSS DEBT SERVICE** MAXIMUM SPECIAL TAXES LESS CFD ADMINISTRATION PLUS RESERVE EARNINGS, DIVIDED BY GROSS DEBT SERVICE
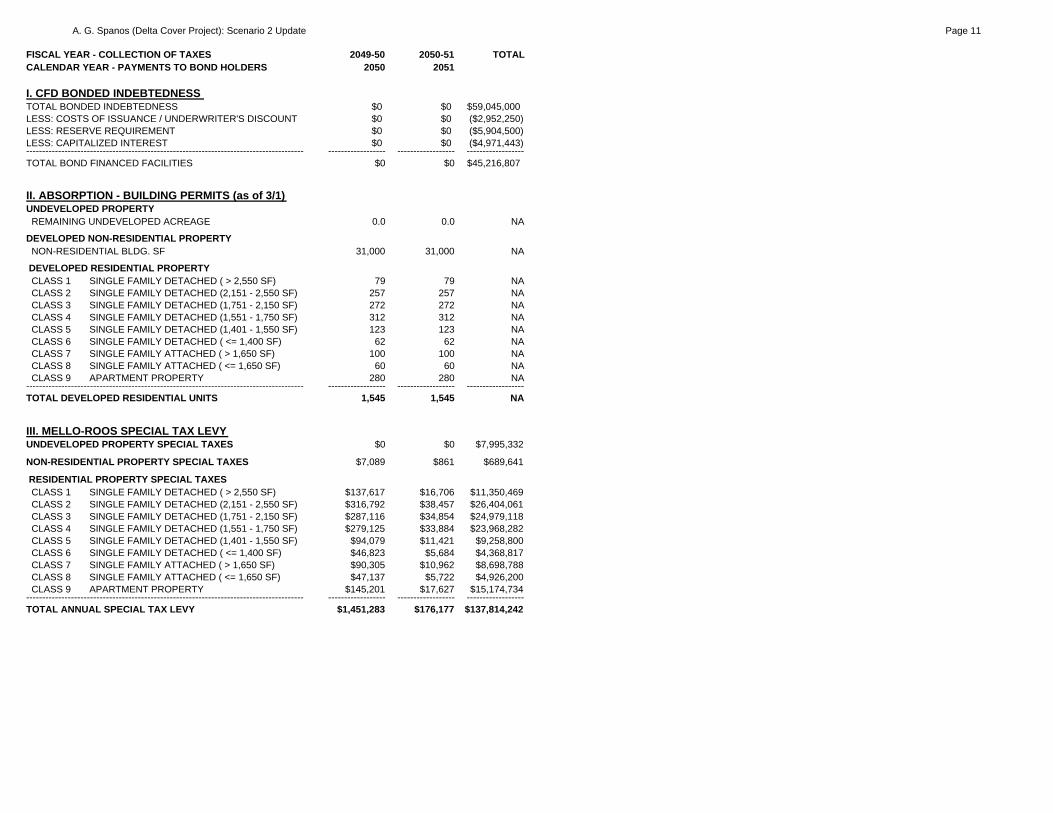
A. G. Spanos (Delta Cover Project): Scenario 2 Update Page 11
FISCAL YEAR - COLLECTION OF TAXESCALENDAR YEAR - PAYMENTS TO BOND HOLDERS
I. CFD BONDED INDEBTEDNESS TOTAL BONDED INDEBTEDNESSLESS: COSTS OF ISSUANCE / UNDERWRITER'S DISCOUNTLESS: RESERVE REQUIREMENTLESS: CAPITALIZED INTEREST---------------------------------------------------------------------------------------TOTAL BOND FINANCED FACILITIES
II. ABSORPTION - BUILDING PERMITS (as of 3/1) UNDEVELOPED PROPERTY REMAINING UNDEVELOPED ACREAGE
DEVELOPED NON-RESIDENTIAL PROPERTY NON-RESIDENTIAL BLDG. SF
DEVELOPED RESIDENTIAL PROPERTY CLASS 1 SINGLE FAMILY DETACHED ( > 2,550 SF) CLASS 2 SINGLE FAMILY DETACHED (2,151 - 2,550 SF) CLASS 3 SINGLE FAMILY DETACHED (1,751 - 2,150 SF) CLASS 4 SINGLE FAMILY DETACHED (1,551 - 1,750 SF) CLASS 5 SINGLE FAMILY DETACHED (1,401 - 1,550 SF) CLASS 6 SINGLE FAMILY DETACHED ( <= 1,400 SF) CLASS 7 SINGLE FAMILY ATTACHED ( > 1,650 SF) CLASS 8 SINGLE FAMILY ATTACHED ( <= 1,650 SF) CLASS 9 APARTMENT PROPERTY---------------------------------------------------------------------------------------TOTAL DEVELOPED RESIDENTIAL UNITS
III. MELLO-ROOS SPECIAL TAX LEVY UNDEVELOPED PROPERTY SPECIAL TAXES
NON-RESIDENTIAL PROPERTY SPECIAL TAXES
RESIDENTIAL PROPERTY SPECIAL TAXES CLASS 1 SINGLE FAMILY DETACHED ( > 2,550 SF) CLASS 2 SINGLE FAMILY DETACHED (2,151 - 2,550 SF) CLASS 3 SINGLE FAMILY DETACHED (1,751 - 2,150 SF) CLASS 4 SINGLE FAMILY DETACHED (1,551 - 1,750 SF) CLASS 5 SINGLE FAMILY DETACHED (1,401 - 1,550 SF) CLASS 6 SINGLE FAMILY DETACHED ( <= 1,400 SF) CLASS 7 SINGLE FAMILY ATTACHED ( > 1,650 SF) CLASS 8 SINGLE FAMILY ATTACHED ( <= 1,650 SF) CLASS 9 APARTMENT PROPERTY---------------------------------------------------------------------------------------TOTAL ANNUAL SPECIAL TAX LEVY
2049-50 2050-51 TOTAL2050 2051
$0 $0 $59,045,000$0 $0 ($2,952,250)$0 $0 ($5,904,500)$0 $0 ($4,971,443)
------------------ ------------------ ------------------$0 $0 $45,216,807
0.0 0.0 NA
31,000 31,000 NA
79 79 NA257 257 NA272 272 NA312 312 NA123 123 NA
62 62 NA100 100 NA
60 60 NA280 280 NA
------------------ ------------------ ------------------1,545 1,545 NA
$0 $0 $7,995,332
$7,089 $861 $689,641
$137,617 $16,706 $11,350,469$316,792 $38,457 $26,404,061$287,116 $34,854 $24,979,118$279,125 $33,884 $23,968,282
$94,079 $11,421 $9,258,800$46,823 $5,684 $4,368,817$90,305 $10,962 $8,698,788$47,137 $5,722 $4,926,200
$145,201 $17,627 $15,174,734------------------ ------------------ ------------------
$1,451,283 $176,177 $137,814,242

A. G. Spanos (Delta Cover Project): Scenario 2 Update Page 12
FISCAL YEAR - COLLECTION OF TAXESCALENDAR YEAR - PAYMENTS TO BOND HOLDERS
IV. CFD SPECIAL TAX REQUIREMENT NEW BONDED INDEBTEDNESSNEW RESERVE REQUIREMENT
ANNUAL DEBT SERVICE - SERIES 2011ANNUAL DEBT SERVICE - SERIES 2015ANNUAL DEBT SERVICE - SERIES 2018ANNUAL DEBT SERVICE - SERIES 2021---------------------------------------------------------------------------------------TOTAL ANNUAL DEBT SERVICECFD ADMINISTRATIONRESERVE FUND INTEREST (6% DELINQUENCY)CAPITALIZED INTERESTPAY-AS-YOU-GO FACILITIES---------------------------------------------------------------------------------------NET ANNUAL DEBT SERVICE
ANNUAL SURPLUS/(DEFICIT)CUMULATIVE SURPLUS/(DEFICIT)
V. AVERAGE ANNUAL SPECIAL TAX UNDEVELOPED PROPERTY, PER ACRE
NON-RESIDENTIAL PROPERTY, PER BLDG. SF
RESIDENTIAL PROPERTY, PER UNIT CLASS 1 SINGLE FAMILY DETACHED ( > 2,550 SF) CLASS 2 SINGLE FAMILY DETACHED (2,151 - 2,550 SF) CLASS 3 SINGLE FAMILY DETACHED (1,751 - 2,150 SF) CLASS 4 SINGLE FAMILY DETACHED (1,551 - 1,750 SF) CLASS 5 SINGLE FAMILY DETACHED (1,401 - 1,550 SF) CLASS 6 SINGLE FAMILY DETACHED ( <= 1,400 SF) CLASS 7 SINGLE FAMILY ATTACHED ( > 1,650 SF) CLASS 8 SINGLE FAMILY ATTACHED ( <= 1,650 SF) CLASS 9 APARTMENT PROPERTY
VI. MAXIMUM SPECIAL TAX LEVY UNDEVELOPED PROPERTY
NON-RESIDENTIAL PROPERTY
RESIDENTIAL PROPERTY CLASS 1 SINGLE FAMILY DETACHED ( > 2,550 SF) CLASS 2 SINGLE FAMILY DETACHED (2,151 - 2,550 SF) CLASS 3 SINGLE FAMILY DETACHED (1,751 - 2,150 SF) CLASS 4 SINGLE FAMILY DETACHED (1,551 - 1,750 SF) CLASS 5 SINGLE FAMILY DETACHED (1,401 - 1,550 SF) CLASS 6 SINGLE FAMILY DETACHED ( <= 1,400 SF) CLASS 7 SINGLE FAMILY ATTACHED ( > 1,650 SF) CLASS 8 SINGLE FAMILY ATTACHED ( <= 1,650 SF) CLASS 9 APARTMENT PROPERTY---------------------------------------------------------------------------------------TOTAL MAXIMUM SPECIAL TAX LEVY
VII. DEBT SERVICE COVERAGE GROSS DEBT SERVICE COVERAGE* NET DEBT SERVICE COVERAGE **
2049-50 2050-51 TOTAL2050 2051
$0 ($13,045,000) $59,045,000$0 ($1,304,500) $5,904,500
$0 $0 $48,733,601$0 $0 $30,069,915$0 $0 $36,054,334
$1,436,556 $1,465,287 $33,594,913------------------ ------------------ ------------------$1,436,556 $1,465,287 $148,452,764
$33,121 $33,783 $2,785,866($18,393) ($18,393) ($2,414,350)
$0 $0 ($5,105,538)$0 $0 $0
------------------ ------------------ ------------------$1,451,283 $176,177 $137,814,242
$0 $0 NA$0 $0 NA
$0 $0 NA
$0.23 $0.03 NA
$1,742 $211 NA$1,233 $150 NA$1,056 $128 NA
$895 $109 NA$765 $93 NA$755 $92 NA$903 $110 NA$786 $95 NA$519 $63 NA
$0 $0 NA
$38,621 $39,393 NA
$749,775 $764,770 NA$1,725,974 $1,760,494 NA$1,564,291 $1,595,577 NA$1,520,752 $1,551,168 NA
$512,570 $522,821 NA$255,103 $260,205 NA$492,005 $501,845 NA$256,815 $261,952 NA$791,097 $806,919 NA
------------------ ------------------ ------------------$7,907,005 $8,065,145 NA
548.11% 548.11% NA549.39% 549.36% NA

ATTACHMENT 6
PFFP PRINCIPLES AND OBJECTIVES

FINANCING PRINCIPLES AND OBJECTIVES The following principles and City objectives shall guide the implementation efforts associated with financing infrastructure and public facilities for the MLSP. 1. The Public Facilities Financing Plan shall be consistent with, and serve to
reinforce, the Land Use Plan and subsequent development of the Project.
Objective 1.1: Apply land use regulations and financing mechanisms that encourage development of the Project at the proposed density ranges and in appropriate phases. Financing mechanisms shall assure that variances from the density ranges and development phases do not negatively affect infrastructure funding capacity.
Objective 1.2: Landowners, developers, and builders within the Project shall have the right
to develop the Project at such time, rate, sequence, and order as they deem appropriate within the exercise of their subjective business judgment.
Objective 1.3: A detailed financial analysis reflecting how infrastructure costs will be
allocated and funded shall be prepared to support specification and adoption of selected financing mechanisms. The financial analysis should be updated during the development process to account for changing project-specific circumstances, shifting market conditions, and more refined facility and cost data that will become available over time.
Objective 1.4: The original financial analysis for the Project, and any subsequent updates,
shall be based on and adhere to the template and guidelines for conducting a PFFP or PFA, as applicable, as promulgated by the City and in effect at the time.
2. Future development within the Project shall pay the full costs of infrastructure needed
to serve the Project area, except where other funding sources are appropriate and available.
Objective 2.1: Landowners, developers, and builders within the Project shall bear primary
responsibility for funding all infrastructure and facilities needed to serve the Project area.
Objective 2.2: The level of public facilities and infrastructure provided to the Project shall
be at least equal to, and in some cases superior to, the level of public facilities and infrastructure provided within the existing City.
Objective 2.3: The City shall require dedication of land for road improvements and
construction of public improvements consistent with Citywide policies, the Stockton Municipal Code, and subsequent subdivision maps.

Objective 2.4: Existing landowners and residents shall not be burdened with assessments or taxes to pay for Project infrastructure or facilities if no benefit is received.
Objective 2.5: Properties outside the boundaries of the Project that benefit from
infrastructure provided by the Project-triggered improvements, such as major roadway improvements or school facilities, shall contribute funding to these improvements through an agreed-upon mechanism.
3. Future development within the Project shall pay the costs of mitigating impacts on
existing facilities and infrastructure in the City.
Objective 3.1: Development will pay existing City development impact fees and additional off-site mitigation as specified by the Project EIR.
Objective 3.2: Infrastructure and public facilities triggered and paid for by development
within the Project that provide benefit to the entire City shall qualify for funding through existing development impact fee ordinances and receive either direct fee credits, credits against future development impact fee obligations, reimbursement from future development impact fee revenues, or a combination of these as required.
4. Infrastructure costs shall be proportionately allocated among Project properties based
on the principle of benefit received.
Objective 4.1: Basic infrastructure program costs shall be allocated to individual neighborhoods and ownerships within the Project based upon the appropriate cost allocation (nexus) logic for each infrastructure improvement type.
Objective 4.2: A mechanism(s) for equalizing the differential burdens of public land
requirements upon individual ownerships shall be included in financing mechanisms established for the Project.
Objective 4.3: A mechanism(s) for securing financial obligation for an equitable share of
infrastructure costs on non-participating property owners shall be included in financing mechanisms established for the Project.
Objective 4.4: Fair share cost allocations for on-site and off-site facilities will be based on
net costs after accounting for regional, State, and federal funding, as determined appropriate by the City.

5. The City shall facilitate the establishment of necessary financing entities and arrangements for Project area infrastructure financing. Objective 5.1: The City shall establish, pursuant to related statutory authority and
procedures, Project area financing mechanisms (e.g., Community Facilities District, Assessment District, Revenue Bond Program).
Objective 5.2: A Project Area of Benefit, pursuant to the provisions of the Stockton
Municipal Code, shall be established by the City. This project area of benefit fee (i.e., Project Fee) should incorporate a proportionate-share cost allocation of required backbone infrastructure to be borne by all benefiting Project development.
Objective 5.3: All costs associated with forming and administering any financing
mechanism shall be borne by the Project. Objective 5.4: To ensure that funding of infrastructure development is timely and that other
public benefits are achieved, the City shall offer development agreements to specific plan developers or builders, consistent with existing City policy and ordinances.
Objective 5.5: The City shall participate in discussions with school districts regarding
school facility requirements and planning, and seek outcomes that facilitate timely school construction consistent with the phased development of the Project.
6. Developers shall be encouraged to privately construct infrastructure items to assure
timely and cost-effective installation of required infrastructure and facilities. Objective 6.1: Infrastructure costs for oversized facilities that are determined to benefit
properties outside the Project shall be reimbursed in accordance with provisions of the Stockton Municipal Code.
Objective 6.2: The City shall establish a mechanism within the Project Fee program (and
other fee programs) that offers credits against subsequent fee obligations if a developer privately builds infrastructure items that are included in the proposed Project Fee program (or other impact fee programs).
Objective 6.3: The City shall establish a mechanism within the Project Fee program that
reimburses developers who privately construct basic infrastructure items that exceed their proportional cost allocation or who dedicate excess land.

7. An ongoing monitoring and reporting system shall be established to ensure that appropriate adjustments are made so that implementing mechanisms can respond, as necessary, to changing circumstances.
Objective 7.1: At the time a debt financing vehicle is employed, the developer will execute
an agreement with the City guaranteeing that, if infrastructure planned to be financed with that financing tool cannot be fully funded due to an unforeseen funding shortfall, private equity or other sources of funding will be provided when needed.
Objective 7.2: The monitoring and reporting process shall consist of true-up and audit steps
that involve rerunning the financial analysis, comparing the results of the current financial update to those of the prior update or original study, submitting the analysis to the City and its peer review consultant, meeting with the City and its peer review consultant to review and revise the analysis as applicable, and adjusting implementing mechanisms for the remaining undeveloped portion of the Project as necessary.
Objective 7.3: The developer shall be responsible for conducting the monitoring and
reporting, which will occur prior to when the following Project thresholds are triggered:
a. recordation of the first final subdivision map for the Project; b. recordation of the first final subdivision map for each planned major
phase of development after the first phase, as documented in the Project’s specific plan, financing plan, fiscal analysis, or otherwise determined in conjunction with the City;
c. issuance of a building permit for a residential dwelling unit that constitutes the first of the remaining 20% of the units planned for the Project; and
d. at any other time at the City’s reasonable request based on changes to the Project, fluctuations in external market conditions, structural alterations to the City’s budget, or other significant events, realized or envisioned, but only after the City Council issues such request by resolution.
Objective 7.4: The developer shall be responsible for covering all costs associated with the
monitoring and reporting system, including the City’s costs and peer review costs.