David Shonnard Department of Chemical Engineering Michigan ...
152
1 Michigan Technological University David R. Shonnard Chapter 11: Product Recovery and Purification David Shonnard Department of Chemical Engineering Michigan Technological University
Transcript of David Shonnard Department of Chemical Engineering Michigan ...

1Michigan Technological UniversityDavid R. Shonnard
Chapter 11: Product Recovery and Purification
David ShonnardDepartment of Chemical Engineering
Michigan Technological University

2Michigan Technological UniversityDavid R. Shonnard
Presentation Outline:
l Overview of Bioseparations
l Separation of Insoluble Products
l Primary Isolation / Concentration of Product
l Purification / Removal of Contaminant Materials
l Product Preparation
3Michigan Technological UniversityDavid R. Shonnard
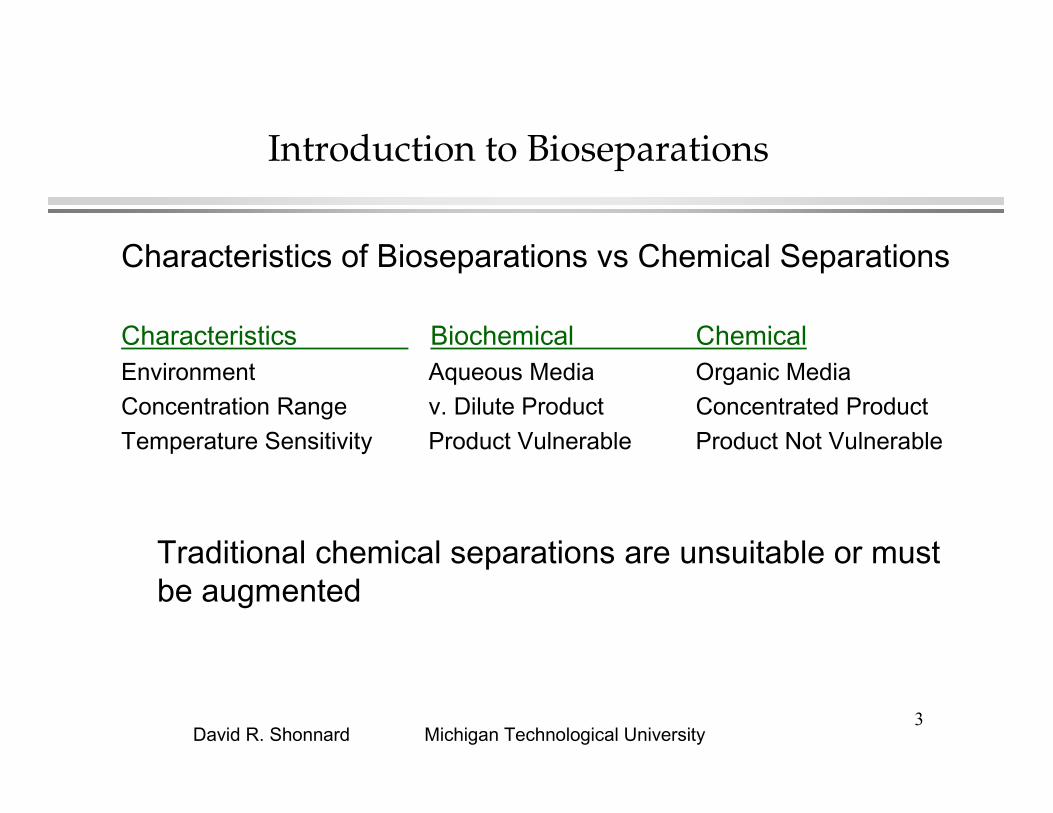
Characteristics of Bioseparations vs Chemical Separations
Characteristics Biochemical ChemicalEnvironment Aqueous Media Organic MediaConcentration Range v. Dilute Product Concentrated ProductTemperature Sensitivity Product Vulnerable Product Not Vulnerable
Traditional chemical separations are unsuitable or must be augmented
Introduction to Bioseparations

4Michigan Technological UniversityDavid R. Shonnard
Biochemical Separations Technologies
Technologies
“Bioprocess Engineering: Basic Concepts”Shuler and Kargi, Prentice Hall, 2002
5Michigan Technological UniversityDavid R. Shonnard
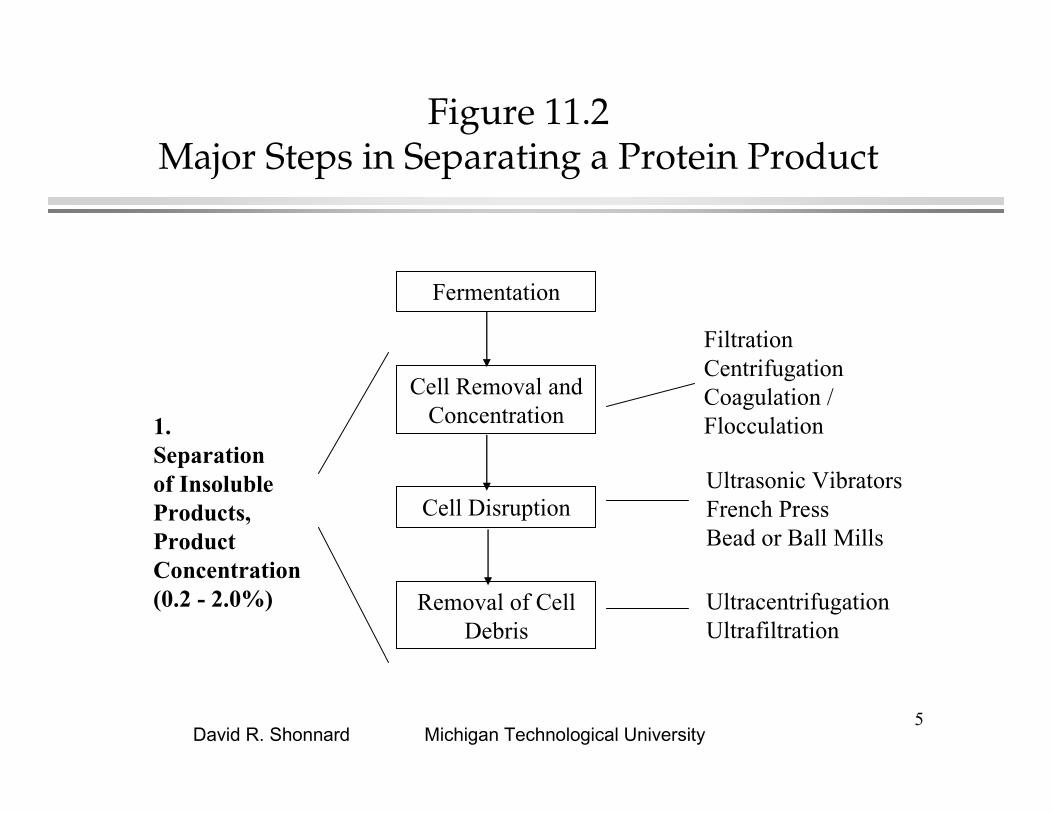
Figure 11.2Major Steps in Separating a Protein Product
Fermentation
Cell Removal and Concentration
Cell Disruption
Removal of Cell Debris
1.Separationof InsolubleProducts,ProductConcentration(0.2 - 2.0%)
FiltrationCentrifugationCoagulation / Flocculation
Ultrasonic VibratorsFrench PressBead or Ball Mills
UltracentrifugationUltrafiltration

6Michigan Technological UniversityDavid R. Shonnard
Figure 11.2Major Steps in Separating a Protein Product
Protein Precipitation or Aqueous Two-
Phase Extraction
Ultrafiltration
2.ProductIsolation, (removal of water) (1 - 10%)
Other methods for product isolation:Liquid-liquid extractionAdsorption

7Michigan Technological UniversityDavid R. Shonnard
Figure 11.2Major Steps in Separating a Protein Product
Chromatographic Purification
Solvent Precipitation
Dialysis
3.Purification / Removal of ContaminantChemicals,(50 - 80%)
Other methods for product purification:Reverse OsmosisCross-flow UltrafiltrationElectrophoresisElectrodialysis

8Michigan Technological UniversityDavid R. Shonnard
Figure 11.2Major Steps in Separating a Protein Product
Lyophilization
4.Product Preparation,(90 - 100%)
Other methods:Crystallization

9Michigan Technological UniversityDavid R. Shonnard
1. Removal of Insoluble ProductsRotary Vacuum Filtration
Cell Solution
• coagulation agents/(filter aids) added
• vacuum applied to rotating drum (∆P)
“Bioprocess Engineering: Basic Concepts”Shuler and Kargi, Prentice Hall, 2002

10Michigan Technological UniversityDavid R. Shonnard
1. Removal of Insoluble ProductsRotary Vacuum Filtration
µ)(
cm
c
rr
APg
dt
dV
+∆=
Filter medium resistance (a constant)
Filter cake resistance
Viscosity of filtrate (water)
Filter area
Volumefiltered
Note: rc increases with the volume filtered, VA
VCrc
α=
C = wt. of cells per volume filtrate (g cells/L)αααα = average specific resistance of filter cake

11Michigan Technological UniversityDavid R. Shonnard
1. Removal of Insoluble ProductsRotary Vacuum Filtration
Integrate Filter Equation: V=0 at t=0.
V 2 + 2VV o = Kt
where
V o = rm
α CA
K = 2 A2
α C µ
∆P gc
Ruth Equation
gc = 1kg •m
s2
N
N = Newton

12Michigan Technological UniversityDavid R. Shonnard
1. Removal of Insoluble ProductsRotary Vacuum Filtration
Rearrange Ruth Equation
“Bioprocess Engineering: Basic Concepts”Shuler and Kargi, Prentice Hall, 2002
A
CKr
KV
gPC
A
K
gPC
A
VVKV
t
mo
c
c
o
2 intercept -y
2 intercept -y
2
1
2 slope
)2(1
2
2
αµ
µα
•=⇒•=
∆
•=
∆
•=
+=

13Michigan Technological UniversityDavid R. Shonnard
Rotary Vacuum Filtration
Effect of pHand time onvolume filtered
“Bioprocess Engineering: Basic Concepts”Shuler and Kargi, Prentice Hall, 2002

14Michigan Technological UniversityDavid R. Shonnard
Rotary Vacuum Filtration
Effect of filteraid and time onvolume filtered
Typical Filter Conditions
• pH = 3.6
• 2% - 3% filter aid
• heat treatment, T=80˚C“Bioprocess Engineering: Basic Concepts”Shuler and Kargi, Prentice Hall, 2002

15Michigan Technological UniversityDavid R. Shonnard
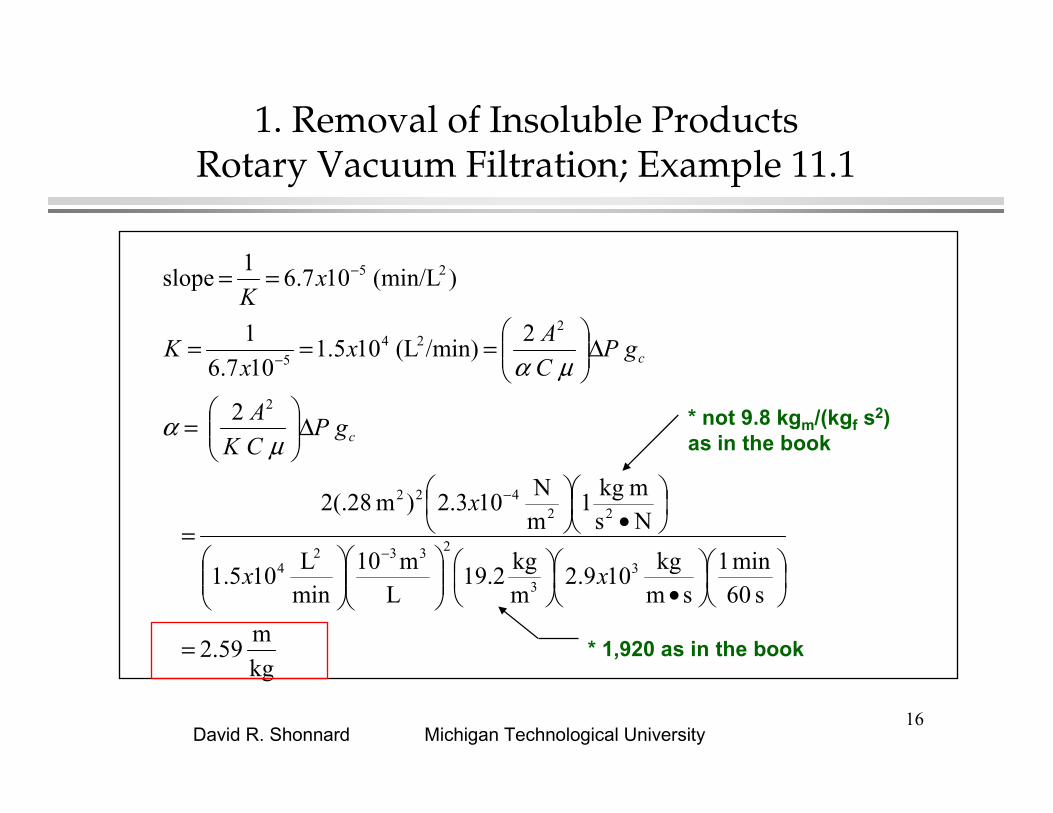
1. Removal of Insoluble ProductsRotary Vacuum Filtration; Example 11.1
Yeast Cell suspension FiltrationRotary Vacuum Filtration….Rotary Vacuum Filtration….Rotary Vacuum Filtration….Rotary Vacuum Filtration….
y = 6.7E-05x + 0.0272
R2 = 0.9906
0.00
0.02
0.04
0.06
0.08
0.10
0.12
0 200 400 600 800 1000 1200
V (Liters of Filtrate)
16Michigan Technological UniversityDavid R. Shonnard
* not 9.8 kgm/(kgf s2)as in the book
kg
m 2.59
s 60min 1
smkg
109.2mkg
2.19L
m10minL
105.1
Nsm kg
1mN
103.2)m 2(.28
2
2 /min)(L 105.1
107.6
1
)(min/L 107.6 1
slope
33
23324
22422
2
224
5
25
=
•
•
=
∆
=
∆
===
==
−
−
−
−
xx
x
gPCK
A
gPC
Ax
xK
xK
c
c
µα
µα
1. Removal of Insoluble ProductsRotary Vacuum Filtration; Example 11.1
* 1,920 as in the book

17Michigan Technological UniversityDavid R. Shonnard
1. Removal of Insoluble ProductsMicrofiltration/Ultrafiltration
• for particle size range ~ 10-9 to 10-5 m = dp
• purpose → to concentrate a cell suspension→ to recover dissolved solutes / proteins
Cross-Flow Filtration
pumpMicrofiltration membrane
Filtrate or “Permeate”(dissolved solutes / proteins)
“Retentate”(concentrated suspension)
Feed Tank
Membrane module

18Michigan Technological UniversityDavid R. Shonnard
1. Removal of Insoluble ProductsMicrofiltration for Removal of Cells
• Mass balance model for separation of cells(cells are retained in the feed tank)
MF Membrane
Permeate qP, CP
Retentate
Feed Tank VF(t)
qR,CR
VP(t)
MF Cassette Permeate
TankFeedqF, CF
Mass Balance Assumptions
1. Feed tank is well mixed.
2. Permeate tank is well mixed.
3. Volume of fluid in MF cassette is negligible.
4. Densities of each stream are equal.
Chandrasekaran, R.,MS Thesis, Dept. ofChemical EngineeringMTU
19Michigan Technological UniversityDavid R. Shonnard
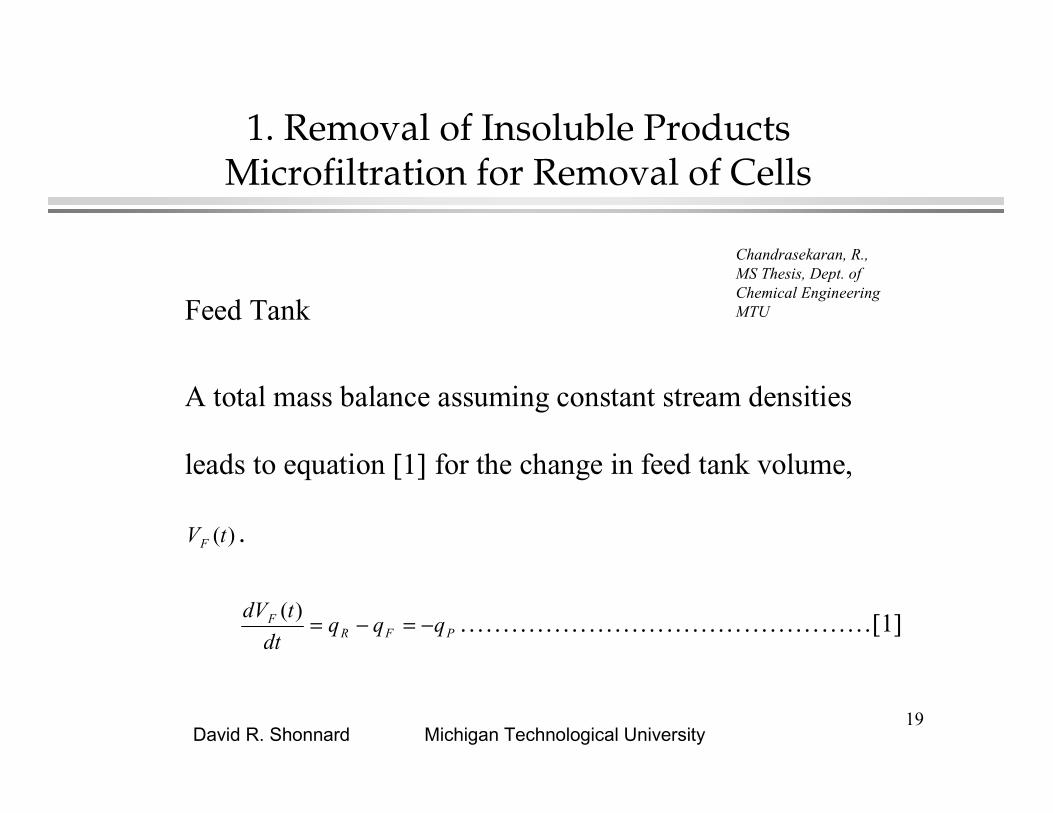
1. Removal of Insoluble ProductsMicrofiltration for Removal of Cells
Feed Tank
A total mass balance assuming constant stream densities
leads to equation [1] for the change in feed tank volume,
)(tVF .
PFRF qqqdt
tdV−=−=
)( …………………………………………[1]
Chandrasekaran, R.,MS Thesis, Dept. ofChemical EngineeringMTU
20Michigan Technological UniversityDavid R. Shonnard
1. Removal of Insoluble ProductsMicrofiltration for Removal of Cells
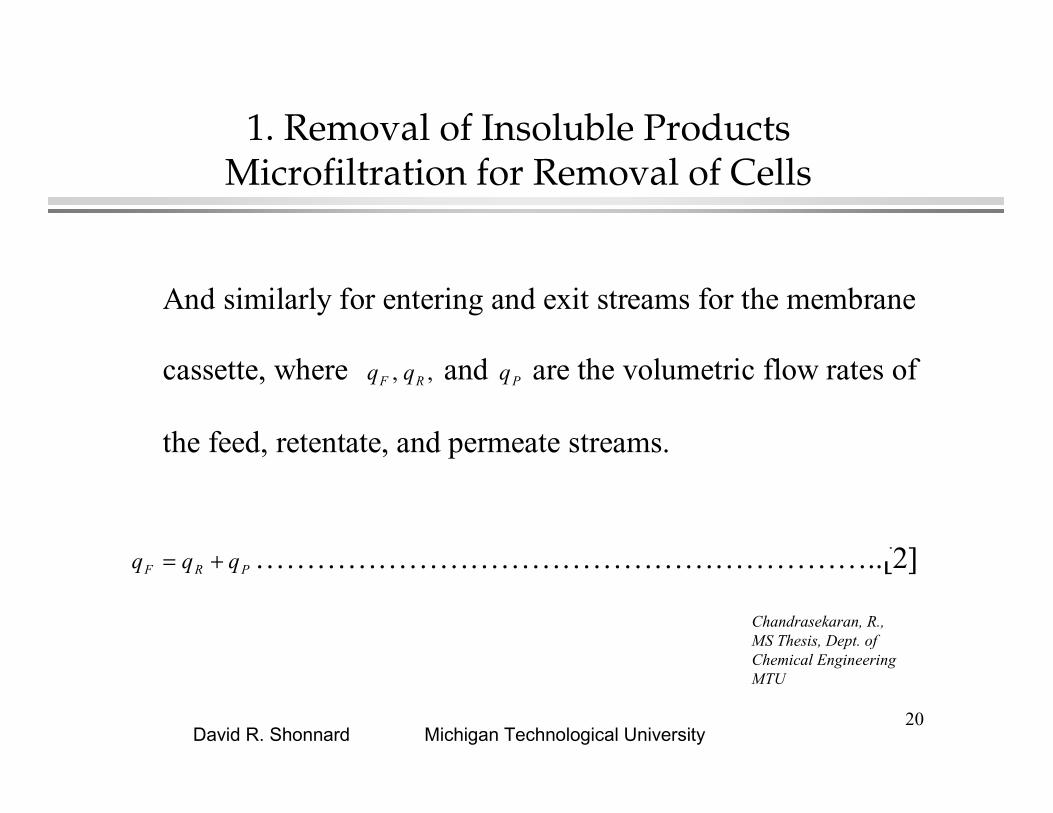
And similarly for entering and exit streams for the membrane
cassette, where ,, RF qq and Pq are the volumetric flow rates of
the feed, retentate, and permeate streams.
PRF qqq += ……………………………………………………..[2]
Chandrasekaran, R.,MS Thesis, Dept. ofChemical EngineeringMTU

21Michigan Technological UniversityDavid R. Shonnard
1. Removal of Insoluble ProductsMicrofiltration for Removal of Cells
A cell mass balance on the feed tank results in equation [3],
where ,, RF CC and PC are the concentrations of the cells in the
feed, retentate, and permeate streams.
FFRRFF CqCqtVCdt
d −=))(( ……………………………………[3]
Chandrasekaran, R.,MS Thesis, Dept. ofChemical EngineeringMTU
22Michigan Technological UniversityDavid R. Shonnard
1. Removal of Insoluble ProductsMicrofiltration for Removal of Cells
Chandrasekaran, R.,MS Thesis, Dept. ofChemical EngineeringMTU
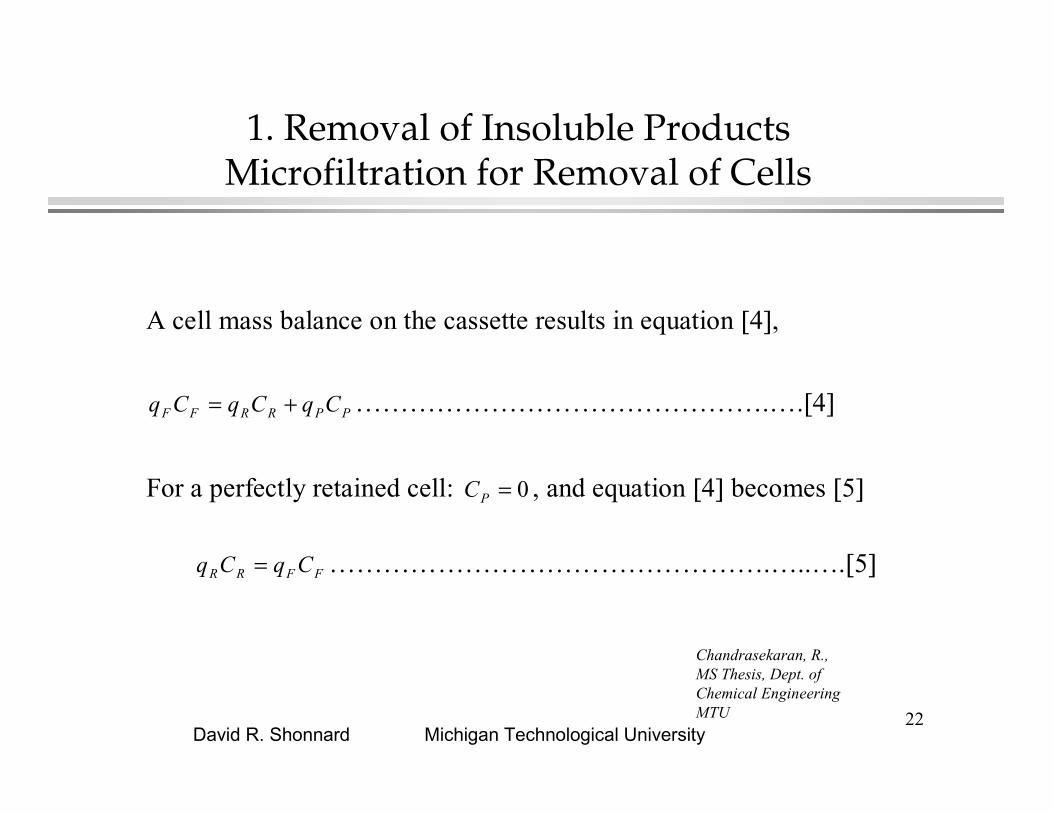
A cell mass balance on the cassette results in equation [4],
PPRRFF CqCqCq += ……………………………………….….[4]
For a perfectly retained cell: 0=PC , and equation [4] becomes [5]
FFRR CqCq = ………………………………………….…..….[5]

23Michigan Technological UniversityDavid R. Shonnard
1. Removal of Insoluble ProductsMicrofiltration for Removal of Cells
Chandrasekaran, R.,MS Thesis, Dept. ofChemical EngineeringMTU
Substituting [5] into [3] (for a perfectly retained cell)
FFRRFFF CqCqmdt
dtVC
dt
d −==))((
0=−= FFFF CqCq
0=Fmdt
d where Fm is mass of cells in feed tank ( Fm = )(tVC FF )….[7]

24Michigan Technological UniversityDavid R. Shonnard
Integrating; ∫ ∫= dtdmF 0 ⇒ =Fm Constant
At 0
,0 FF mmt == (0Fm is the initial mass of cells in the feed tank)
∴ 0FF mm = for all time t “perfectly retained cell”…………[8]
1. Removal of Insoluble ProductsMicrofiltration for Removal of Cells
Chandrasekaran, R.,MS Thesis, Dept. ofChemical EngineeringMTU
t
mF
mFo

25Michigan Technological UniversityDavid R. Shonnard
1. Removal of Insoluble ProductsMicrofiltration for Removal of Cells
Chandrasekaran, R.,MS Thesis, Dept. ofChemical EngineeringMTU
Cell Concentration, CF (t)
d(CFVF( t)) =∫ 0 dt∫CFVF (t) = constant = mFo
CF = mFo
VF(t)= mFo
VFo − qPt
t
CF

26Michigan Technological UniversityDavid R. Shonnard
1. Removal of Insoluble ProductsMicrofiltration for Removal of Cells
Chandrasekaran, R.,MS Thesis, Dept. ofChemical EngineeringMTU
t
mF
+−= tCqm FPF 0
0,0 FF mmt == ⇒
0Fm=
Constant……………………….……[11]
Constant At
Perfectly Permeating Cell (or Protein)
CF
Foo
Fo
o
Po
o
PFo
Po
o
FoPFo
F
o
FoFo
Po
FoPFoFF
CV
m
tVq
V
tVq
m
tqV
tVm
qm
tC
V
mC
tqV
tCqm
tV
tmtC
==−
−=
−
−=
=
−−==
)1(
)1()(
that note
)(
)()(

27Michigan Technological UniversityDavid R. Shonnard
1. Removal of Insoluble ProductsMicrofiltration for Removal of Cells
Chandrasekaran, R.,MS Thesis, Dept. ofChemical EngineeringMTU
CF
mF
Partially Retained Cell (or Protein)Some fraction (θ) of the cells (or protein) is of a sizethat is retained and (1-θ) permeates.
CF
))1( (
)(
Factorion Concentrat is where
))1(
(
θθ
θθ
−+=
−==
−+=
CFCC
tqV
V
tV
VCF
CFCF
mm
FoF
PFo
Fo
F
Fo
FoF

28Michigan Technological UniversityDavid R. Shonnard
Microfiltration of Skim Milk to Separate Casein Protein (CP) from Whey Protein (WP)
Chandrasekaran, R.,MS Thesis, Dept. ofChemical EngineeringMTU
Protein mass versus concentration factor, CF = VFo/VF

29Michigan Technological UniversityDavid R. Shonnard
Chandrasekaran, R.,MS Thesis, Dept. ofChemical EngineeringMTU
Microfiltration of Skim Milk to Separate Casein Protein (CP) from Whey Protein (WP)
Protein concentration versus concentration factor, CF = VFo/VF

30Michigan Technological UniversityDavid R. Shonnard
Chandrasekaran, R.,MS Thesis, Dept. ofChemical EngineeringMTU
Microfiltration of Skim Milk to Separate Casein Protein (CP) from Whey Protein (WP)
Comparison of model with experimental data
31Michigan Technological UniversityDavid R. Shonnard
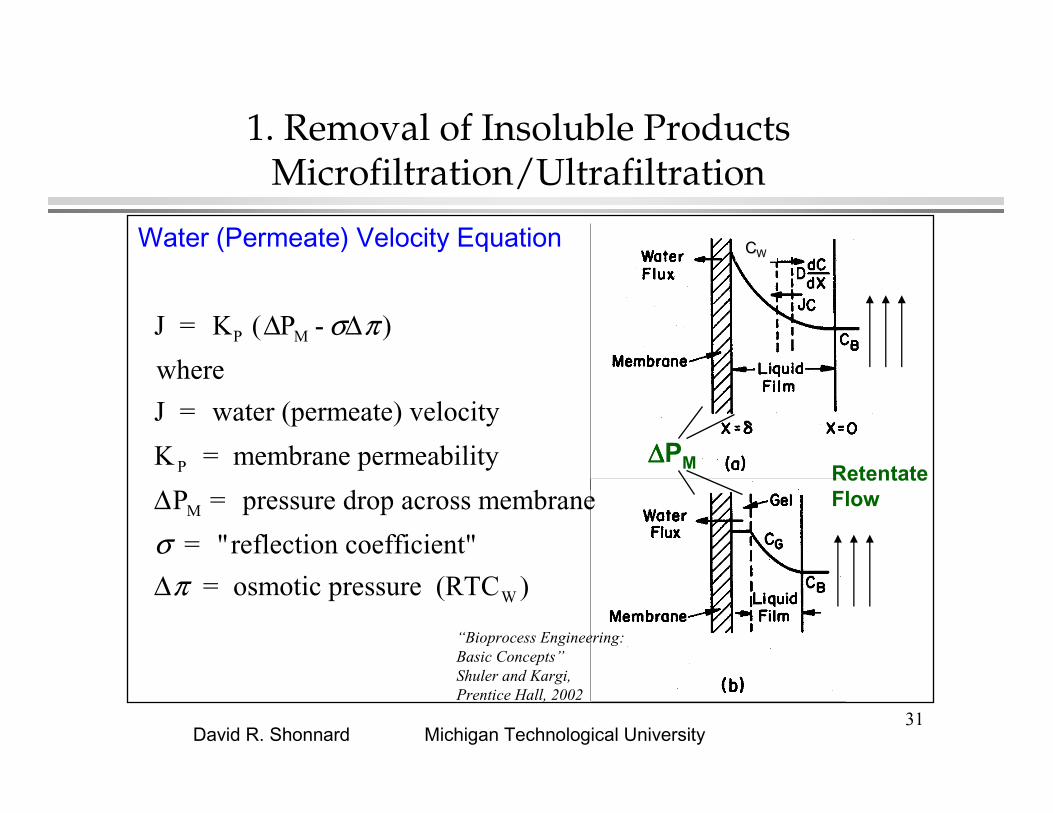
1. Removal of Insoluble ProductsMicrofiltration/Ultrafiltration
Water (Permeate) Velocity Equation CCWW
RetentateFlow
∆∆∆∆PM
J = KP (∆PM - σ∆π )
where
J = water (permeate) velocity
K P = membrane permeability
∆PM = pressure drop across membrane
σ = "reflection coefficient"
∆π = osmotic pressure (RTCW )
“Bioprocess Engineering: Basic Concepts”Shuler and Kargi, Prentice Hall, 2002

32Michigan Technological UniversityDavid R. Shonnard
film in the solute ofy diffusivit theis where
ln
gintegratin
0
D
C
CDJ
CCx
CCxdx
dCDJ
B
W
B
W
δ
δ
=
====
=
1. Removal of Insoluble ProductsMicrofiltration/Ultrafiltration
Concentration Polarization - relating CW to CB
In the liquid film;
Gel FormationWhen J and/or CB are high enough, a gel layer will form at the membrane surface, causing an additional resistance (RG) to solute flux, J.

33Michigan Technological UniversityDavid R. Shonnard
1. Removal of Insoluble ProductsMicrofiltration/Ultrafiltration
Permeate Flow Rate
∆PM = Pi - 1
2 (Pi - Po )
J = ∆PM
RG
+ RM
Gel resistanceMembrane resistance
“Bioprocess Engineering: Basic Concepts”Shuler and Kargi, Prentice Hall, 2002
34Michigan Technological UniversityDavid R. Shonnard
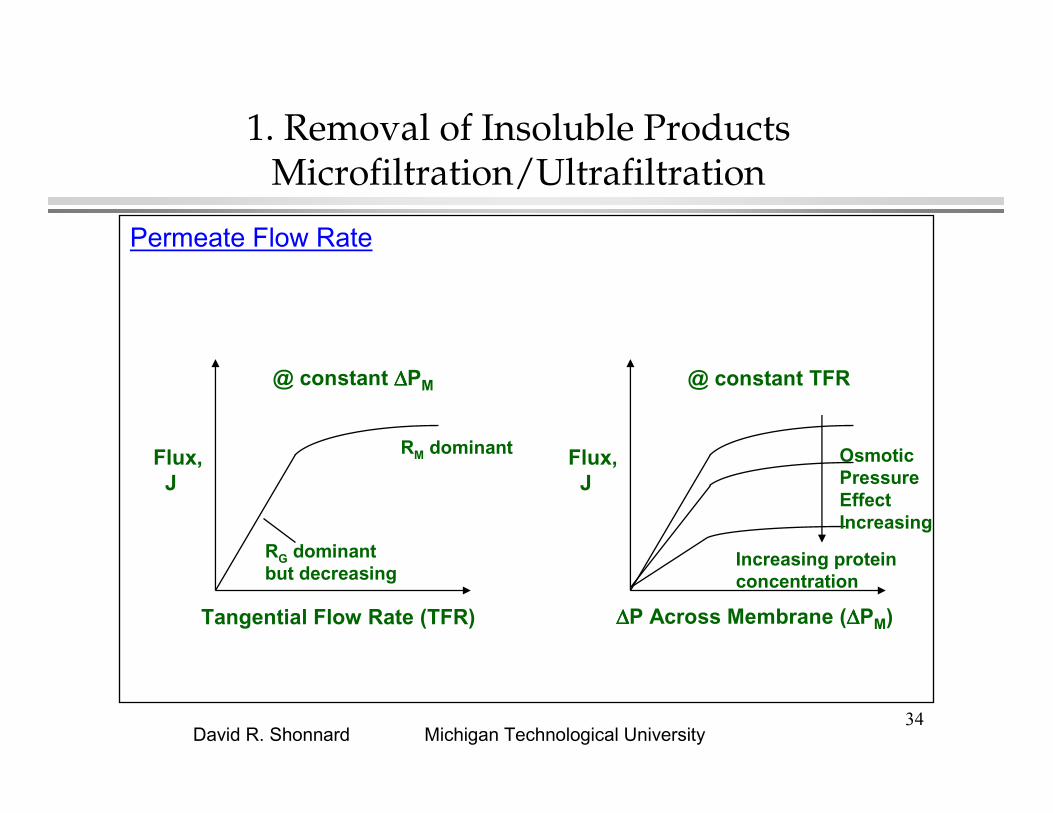
1. Removal of Insoluble ProductsMicrofiltration/Ultrafiltration
Permeate Flow Rate
Flux,J
Tangential Flow Rate (TFR)
@ constant ∆∆∆∆PM
Flux,J
∆∆∆∆P Across Membrane (∆∆∆∆PM)
@ constant TFR
RG dominant but decreasing
RM dominant
Increasing protein concentration
Osmotic Pressure Effect Increasing

35Michigan Technological UniversityDavid R. Shonnard
1. Removal of Insoluble ProductsMicrofiltration/Ultrafiltration
Concentration Polarization - relating CW to CB
Example of Protein Ultrafiltration;
J = 1.3x10⁻³ cm / sec
D = 9.5x10⁻⁷ cm2 / sec (protein diffusivity)
δ = 180x10-4 cm
J = Dδ
lnCW
CB
⇒ 1.3x10⁻³ cm / sec = 9.5x10⁻⁷ cm2 / sec
180x10-4 cmln
CW
CB
CW
CB
= 1.3 or CW is 30% > than C B

36Michigan Technological UniversityDavid R. Shonnard
1. Removal of Insoluble ProductsMicrofiltration/Ultrafiltration
Microfiltration Design - time for filtration
dV
dt = - A J
V = volume of solution remaining to be filtered
A = membrane filter area
if we assume no concentration polarization, CW ≈ CB
dV
dt = - A KP (∆P -σRTCB )
for total reflection of solute, σ = 1 and n = CBV
and is constant, where n is total solute mass (cells)
dV
dt = - A K
P ∆P 1-
[RTn / ∆P
V

37Michigan Technological UniversityDavid R. Shonnard
1. Removal of Insoluble ProductsMicrofiltration/Ultrafiltration
Microfiltration Design - time for filtration (cont.)
dV
dt = - A KP ∆P 1-
[RTn / ∆P
V
at t = 0 V = Vo (initial volume of solution)
integrating
t = 1
A KP ∆P
(Vo - V) +
R T n
∆P
ln
Vo - RTn / ∆P
V- RTn / ∆P
often RTn
∆P << (Vo - V)
t ≈ 1
A KP ∆P
(Vo - V) Time to filter from Vo to V.

38Michigan Technological UniversityDavid R. Shonnard
1. Removal of Insoluble ProductsMicrofiltration/Ultrafiltration
Microfiltration Design - Example, Cell Microfiltration
Vo = 1000 liters, A = 10 m2
Xo = 1 g dcw / L concentration to X = 10 g dcw / L
K P ∆P = initial water flux = 5.7x10⁻⁴ cm / sec
V = Vo Xo
X = 1000 L
1 g dcw / L
10 g dcw / L
= 100 L
t = 1
(10 m2)(100 cm2 / m2 ) (5.7x10⁻⁴ cm / sec)
(1000 -100)L
103 cm3
L
= 1.58x10⁴ sec = 4.4 hours

39Michigan Technological UniversityDavid R. Shonnard
“Bioprocess Engineering: Basic Concepts”Shuler and Kargi, Prentice Hall, 2002

40Michigan Technological UniversityDavid R. Shonnard
1. Removal of Insoluble ProductsMicrofiltration/Ultrafiltration
Modes of Operation1. Concentration
2. One-Pass
Retentate
Permeate
Retentate
Permeate

41Michigan Technological UniversityDavid R. Shonnard
1. Removal of Insoluble ProductsMicrofiltration/Ultrafiltration
Modes of Operation3. Total Recycle Mode - membrane system characterization
Post-Processing:Microfiltration of cells is often followed by conventional filtration of retentate or centrifugation. Then, cell disruption for recovery of intracellular proteins occurs.
Retentate
Permeate
42Michigan Technological UniversityDavid R. Shonnard
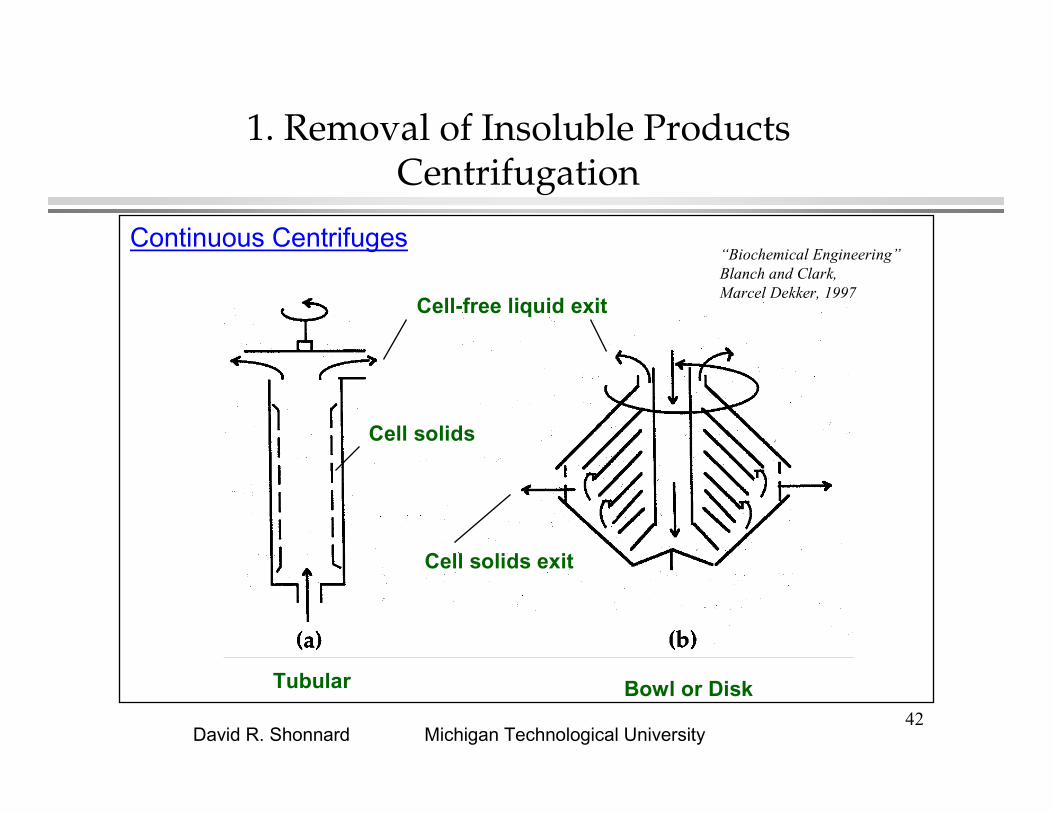
1. Removal of Insoluble ProductsCentrifugation
Continuous Centrifuges
Bowl or DiskTubular
Cell-free liquid exit
Cell solids exit
Cell solids
“Biochemical Engineering”Blanch and Clark, Marcel Dekker, 1997

43Michigan Technological UniversityDavid R. Shonnard
µρρω
ωρρππµ
ωρπ
ωρπ
πµ
18
)(
)(6
3
-
16
cellon forcebouyancy
1
6 cellon force lcentrifuga
13 cellon force drag
22
23
23
23
fPPOC
fPPOCP
BAD
cfPB
cPPA
cOCPD
DrU
rDUD
FFF
grDF
grDF
gUDF
−=
−=
=
==
==
==
1. Removal of Insoluble ProductsTubular Centrifugation
r
FA FD
FB
UOC
y
L
44Michigan Technological UniversityDavid R. Shonnard
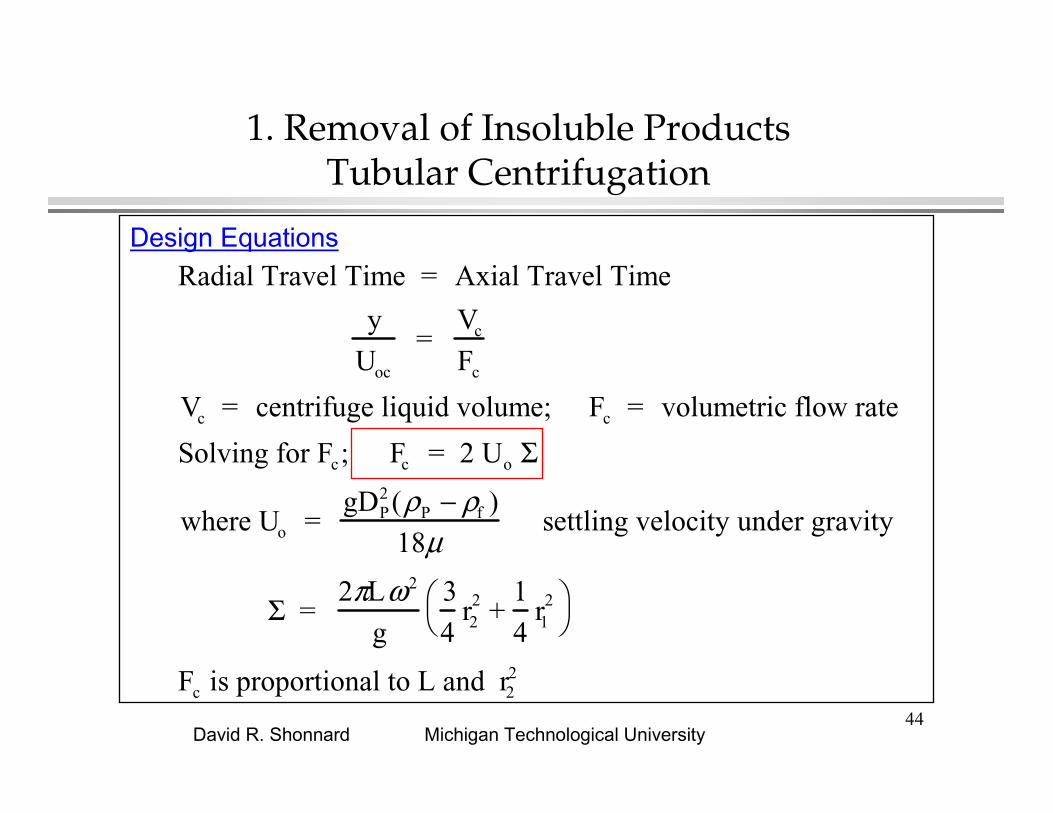
1. Removal of Insoluble ProductsTubular Centrifugation
Design Equations
Radial Travel Time = Axial Travel Time
y
Uoc
= Vc
Fc
Vc = centrifuge liquid volume; Fc = volumetric flow rate
Solving for Fc; Fc = 2 Uo Σ
where Uo = gDP
2 (ρP − ρf )
18µ settling velocity under gravity
Σ = 2πLω2
g
3
4r2
2 +1
4r1
2
Fc is proportional to L and r22

45Michigan Technological UniversityDavid R. Shonnard
1. Removal of Insoluble ProductsCell Disruption ; 11.3
If the desired product is intra-cellular, an effective method to break open the cell wall is needed in order to release the products.
“Biochemical Engineering”Blanch and Clark, Marcel Dekker, 1997

46Michigan Technological UniversityDavid R. Shonnard
1. Removal of Insoluble ProductsCell Disruption Equipment
Exposure of cells to high liquid shear rates by passing cells through a restricted orifice under high pressure
handwheel
rod forvalveadjustment
valve
valveseat
impactring
“Biochemical Engineering”Blanch and Clark, Marcel Dekker, 1997

47Michigan Technological UniversityDavid R. Shonnard
1. Removal of Insoluble ProductsCell Disruption Equipment
Rapid agitation of a microbial cell suspension with glass beads or similar abrasives
handwheeldrive motor
variable v-belt
shaft
agitatordisk
circulating pump
temperature jacket
“Biochemical Engineering”Blanch and Clark, Marcel Dekker, 1997

48Michigan Technological UniversityDavid R. Shonnard
1. Removal of Insoluble ProductsCell Disruption Equipment
Problem 6.1 Blanch and Clark textbookProtein release from yeast using disruption by an industrial homogenizer
Protein release depends upon the pressure, P, and number of recyclepasses, N
Design Equation
logRm
Rm - R
= KNPc
Rm = maximum protein conc. (mg / L)
R = protein conc. (mg / L)
K = constant
C = constant
“Biochemical Engineering”Blanch and Clark, Marcel Dekker, 1997

49Michigan Technological UniversityDavid R. Shonnard
1. Removal of Insoluble ProductsCell Disruption Equipment
Problem 6.1 Blanch and Clark textbook (cont.)
Determine K and C
slope = KPc
or ln(slope) = ln(K) + C ln(P)

50Michigan Technological UniversityDavid R. Shonnard
2. Primary Isolation/Concentration of Product:11.4
Separation Objectives• Remove water from fermentation broth• Dilute solute (product) → more concentrated solute• Often these steps concentrate chemically similar byproducts
(other proteins / biomolecules)
Separation MethodsA. Extraction (liquid-liquid)B. AdsorptionC. Precipitation
not very selectivefor desired product
None the less, these methods are often applied prior to purification

51Michigan Technological UniversityDavid R. Shonnard
2. Primary Isolation/Concentration of Product:Liquid-Liquid Extraction
Liquid-liquid extraction is commonly used, especially in antibiotic fermentations to recover product from broth.
Features of liquid extractant1. nontoxic2. inexpensive3. highly selective toward the product4. immiscible with the fermentation broth
Other Applications 1. removal of inhibitory fermentation products (ethanol and acetone - butanol).

52Michigan Technological UniversityDavid R. Shonnard
2. Primary Isolation/Concentration of Product:Liquid-Liquid Extraction
Liquid-liquid extraction is commonly used, especially in antibiotic fermentations to recover products from fermentation broth
Fermentation broth + penicillin Butyl acetate solvent
Butyl acetate + penicillinFermentation broth -penicillin
low pH
Buffered phosphateAqueous solution
Purified aqueousSolution with penicillin
Butyl acetate
neutral pH
drying steppenicillin

53Michigan Technological UniversityDavid R. Shonnard
2. Primary Isolation/Concentration of Product:Liquid-Liquid Extraction - Equilibrium
Liquid-liquid extraction takes advantage of solute equilibrium partitioning between the fermentation broth (heavy, H) phase and a light (L) extractant phase.
phaseheavy in the solute
offraction moleor mass ion,concentrat theis
phaselight in the solute
offraction moleor mass ion,concentrat theis
tcoefficienon distributi a is where,
X
Y
KX
YK DD =

54Michigan Technological UniversityDavid R. Shonnard
K D = Y
X
Partitioning isa function of pHfor many solutes
Solvent is Amylacetate
“Bioprocess Engineering: Basic Concepts”Shuler and Kargi, Prentice Hall, 2002
55Michigan Technological UniversityDavid R. Shonnard
factor extraction theis where
1
1
)/(1
1or
, Since
or )(
1
111
1
1111
o
D
Do
DoD
oo
H
LKE
EHLKX
X
XH
LKXX
X
YK
YH
LXXLYXXH
=
+=
+=
−==
−==−
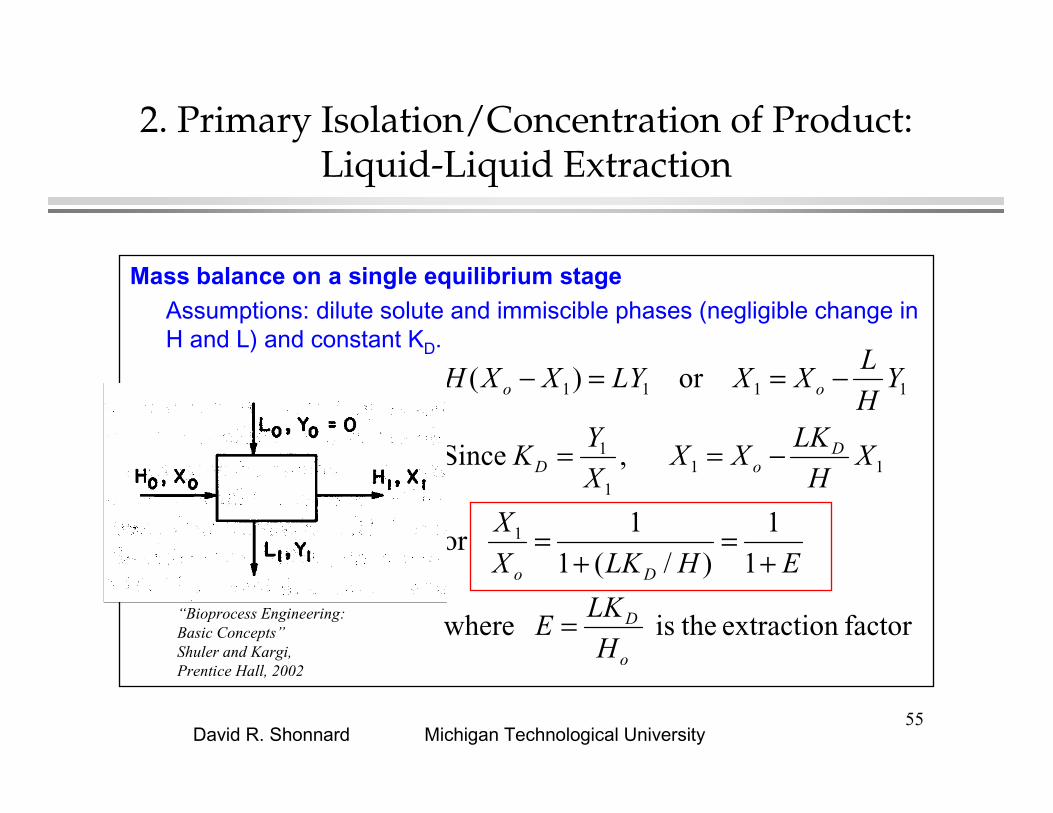
2. Primary Isolation/Concentration of Product:Liquid-Liquid Extraction
Mass balance on a single equilibrium stageAssumptions: dilute solute and immiscible phases (negligible change in H and L) and constant KD.
“Bioprocess Engineering: Basic Concepts”Shuler and Kargi, Prentice Hall, 2002

56Michigan Technological UniversityDavid R. Shonnard
NNND
NNN
ND
NNNNNNN
XEXXH
LKXX
X
YK
YH
LXXYYLXXH
)1(or , , Since
or )()( N, Stage
11
111
+=+==
+=−=−
−−
−+−
2. Primary Isolation/Concentration of Product:Liquid-Liquid Extraction
Mass balance on a multiple equilibrium stagesAssumptions: dilute solute and immiscible phases (negligible change in H and L) and constant KD.
“Bioprocess Engineering: Basic Concepts”Shuler and Kargi, Prentice Hall, 2002
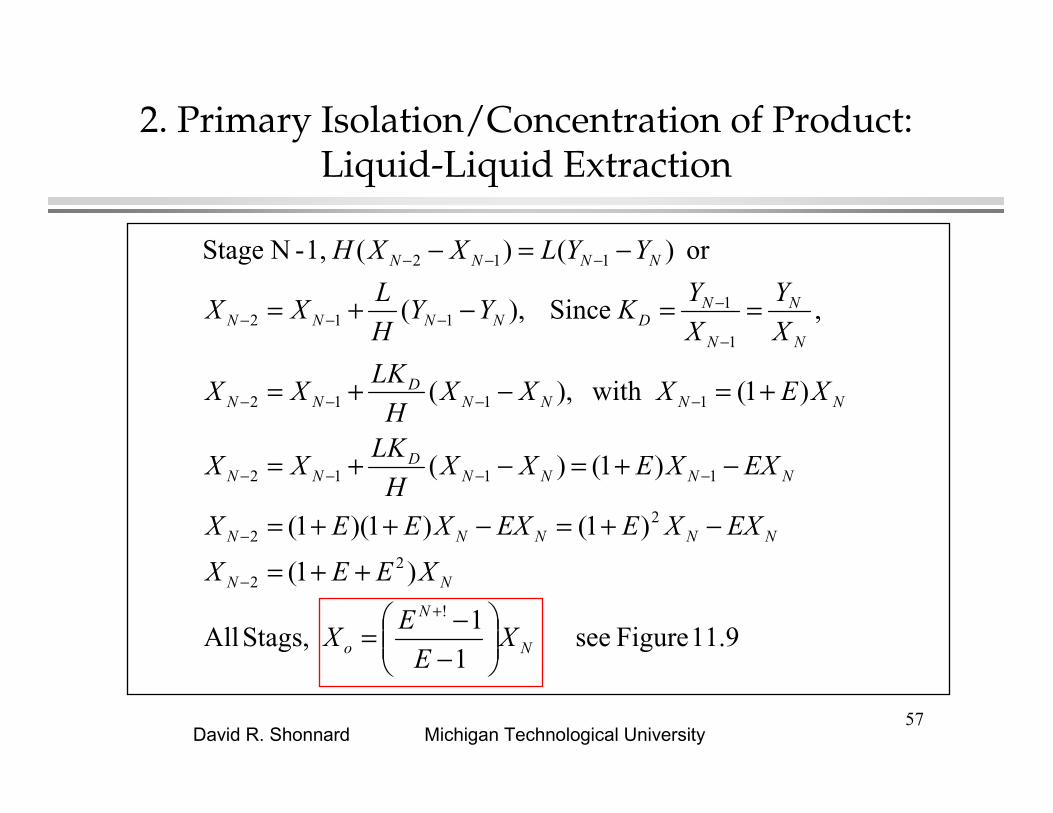
57Michigan Technological UniversityDavid R. Shonnard
11.9 Figure see 1
1 Stags, All
)1(
)1()1)(1(
)1( )(
)1( with ),(
, Since ),(
or )()( 1,-N Stage
!
22
22
1112
1112
1
1112
112
N
N
o
NN
NNNNN
NNNND
NN
NNNND
NN
N
N
N
NDNNNN
NNNN
XE
EX
XEEX
EXXEEXXEEX
EXXEXXH
LKXX
XEXXXH
LKXX
X
Y
X
YKYY
H
LXX
YYLXXH
−
−=
++=
−+=−++=
−+=−+=
+=−+=
==−+=
−=−
+
−
−
−−−−
−−−−
−
−−−−
−−−
2. Primary Isolation/Concentration of Product:Liquid-Liquid Extraction

58Michigan Technological UniversityDavid R. Shonnard
2. Primary Isolation/Concentration of Product:Liquid-Liquid Extraction - Figure 11.9
RelatesXN/Xo to E and Number ofStages , N.
“Bioprocess Engineering: Basic Concepts”Shuler and Kargi, Prentice Hall, 2002
59Michigan Technological UniversityDavid R. Shonnard
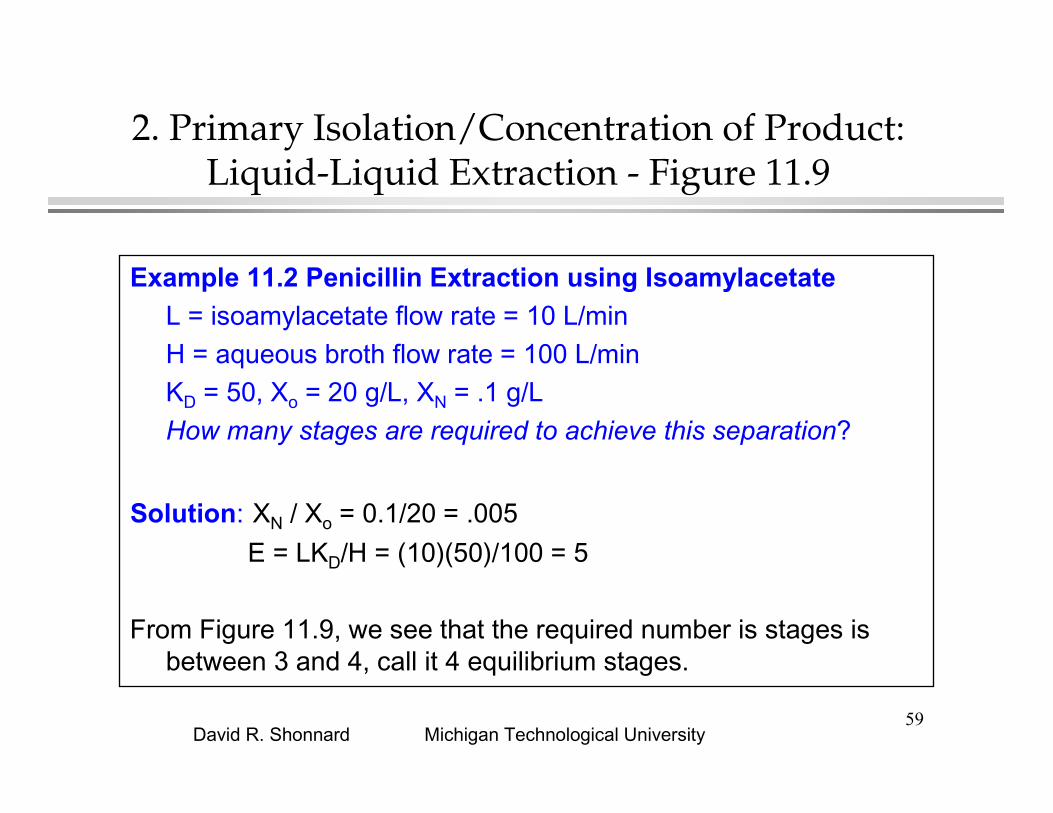
2. Primary Isolation/Concentration of Product:Liquid-Liquid Extraction - Figure 11.9
Example 11.2 Penicillin Extraction using IsoamylacetateL = isoamylacetate flow rate = 10 L/minH = aqueous broth flow rate = 100 L/minKD = 50, Xo = 20 g/L, XN = .1 g/LHow many stages are required to achieve this separation?
Solution: XN / Xo = 0.1/20 = .005
E = LKD/H = (10)(50)/100 = 5
From Figure 11.9, we see that the required number is stages is between 3 and 4, call it 4 equilibrium stages.

60Michigan Technological UniversityDavid R. Shonnard
2. Primary Isolation/Concentration of Product:Liquid-Liquid Extraction - Figure 11.9
“Bioprocess Engineering: Basic Concepts”Shuler and Kargi, Prentice Hall, 2002

61Michigan Technological UniversityDavid R. Shonnard
2. Primary Isolation/Concentration of Product:Liquid-Liquid Extraction - Equipment
Podbielniakcentrifugalextractor
The separationis very rapid,allowing for shortresidence timeswhich benefitsunstable products
(especially pH-sensitive antibiotics.
“Bioprocess Engineering: Basic Concepts”Shuler and Kargi, Prentice Hall, 2002

62Michigan Technological UniversityDavid R. Shonnard
2. Primary Isolation/Concentration of Product:Precipitation
A very common first step after cell disruption for recovery of intracellular proteins.
Water-protein interactions are key to understanding protein precipitation / solubility in water.
Salting-Outaddition of (NH4)2SO4 or Na2SO4 up to high concentrations → 1 to 3 Molar!
COO- -- NH4+
NH4+ -- SO4
2-
salts exclude water fromthe surface leading toprotein-protein interactionsand precipitation
protein

63Michigan Technological UniversityDavid R. Shonnard
2. Primary Isolation/Concentration of Product:Precipitation
Protein solubility is a function of ionic strength (salt concentration).
ionsalt on charge
(mole/L)ion salt ofion concentratmolar
(mole/L) 2
1 stsrength ionic
re) temperatuand pH offunction (a
(moles/L)constant out salting a
(g/L) sstrength, ionic 0at solubilityprotein
(g/L) solubilityprotein
S
Slog
2
'
'
o
==
==
=
==
−=
∑
i
i
ii
S
o
S
Z
C
ZCI
K
S
S
IK

64Michigan Technological UniversityDavid R. Shonnard
2. Primary Isolation/Concentration of Product:Precipitation
Organic Solvent Additioncan also reduce protein-water interactions and promote protein-protein interactions leading to precipitation.
Isoelectric Precipitationat the pH of the isoelectric point, a protein is uncharged, reducing protein-water interactions which leads to precipitation. Warning: extremes in pH may denature the protein product.

65Michigan Technological UniversityDavid R. Shonnard
2. Primary Isolation/Concentration of Product:Isoelectric Precipitation
Belter, Cussler & Hu, 1988 Effects of pH on the chargeof protein functional groups
NH2 + H+ → NH3+
COOH → COO- + H+

66Michigan Technological UniversityDavid R. Shonnard
3. Product Purification /Contaminant Removal:
Contaminants often remain with product after primary isolation.
Chromatography: is the most important separation method for biochemical products.
Basic Concepts:1. Separation is based on differential affinities of solutes
toward a solid adsorbent material.

67Michigan Technological UniversityDavid R. Shonnard
3. Product Purification /Contaminant Removal: (cont.)
2. Different kinds of affinity
* →→→→ electric charge … ion exchange chromatography
→→→→ van der Waals force … adsorption chromatography→→→→ solubility in liquid … liquid-liquid partitioning chromatog.→→→→ solute size/diffusion … gel filtration chromatography
* →→→→ receptor - ligand … affinity chromatography
→→→→ hydrophobic interactions … hydrophobic chromatography
* most common usage

68Michigan Technological UniversityDavid R. Shonnard
3. Product Purification /Contaminant Removal:Adsorption - 11.4.4
Definition: the removal of selected chemicals from a mobile fluid phase into an immobile solid phase.
Adsorbents: solid materials to which the chemicals (solutes, adsorbates) adhere. These are the immobile phase.
Examples: activated carbonion exchange resinsaluminasilica gelother gels: dextran or agarose

69Michigan Technological UniversityDavid R. Shonnard
3. Product Purification /Contaminant Removal:Adsorption - 11.4.4 (cont.)
Fixed-Bed Adsorption
3 Zones
Saturated zone, soluteis present in both fluidand solid at maximumconcentration.
Adsorption zone, conc-entrations of solute in fluid & solid are in trans-ition.
Virgin zone, concentra-tions near zero.
“Bioprocess Engineering: Basic Concepts”Shuler and Kargi, Prentice Hall, 2002

70Michigan Technological UniversityDavid R. Shonnard
3. Product Purification /Contaminant Removal:Adsorption Equilibrium
Freundlich Isotherm: an isotherm describes the partitioning of a solute between the solid and liquid phases at equilibrium.
CS* = KF CL
*(1/n)
CS* = equilibrium conc. of solute on adsorbent
mass solute
mass dry adsorbent
CL* = equilibrium conc. of solute in fluid
mass solute
volume of fluid
K F = equilibrium constant (units depent on exponent)
n = a constant
Ion exchange resinGraver Technologies
www.gravertech.com

71Michigan Technological UniversityDavid R. Shonnard
3. Product Purification /Contaminant Removal:Adsorption Equilibrium- Freundlich Isotherm
Freundlich Isotherm:
CS*
CL*
n = 1
n > 1
0 < n <1FavorableAdsorption
UnfavorableAdsorption

72Michigan Technological UniversityDavid R. Shonnard
3. Product Purification /Contaminant Removal:Adsorption Equilibrium- Langmuir Isotherm
Langmuir Isotherm:
CS*
CL*
MaximumAdsorptionCapacity
CS
* = CS,max
* CL*
K L + CL*
CS,max*

73Michigan Technological UniversityDavid R. Shonnard
3. Product Purification /Contaminant Removal:Adsorption Equilibrium - Adsorbent Capacity
Example Problem:
Calculate the capacity of ion exchange resin to adsorb protein given that:
• m = mass of dry resin in a column = 1 kg• ε = porosity of the fixed-bed = 0.40 cm3 fluid/cm3 bed volume• ρr = resin density = 1.2 g dry resin/cm3 resin• n = 1 in the Freundlich Isotherm• per unit bed volume, there is 100 times more protein adsorbed as there is in the fluid at equilibrium.
C*L = 1 mg protein/cm3 fluid at equilibrium

74Michigan Technological UniversityDavid R. Shonnard
3. Product Purification /Contaminant Removal:Adsorption Equilibrium - Adsorbent Capacity
Problem Solution:1. First, calculate KF in the Freundlich Isotherm.
resindry g
fluid cm 55.6
)4.01)(2.1(
)4.0(100
)1(
100
)1(
100or
100 )cm 1)(1(
volume"bed cm 1 in the fluid in theprotein of mass the times100
volumebed cm 1in resin toabsorbed mass"
balance mass solute a perform volumebed cm 1 of Basis
1nfor isotherm Freundlich theis
3
**
*
*3*
3
3
3
**
=−
=
−=⇒=
−=
=−
=⇒
==
F
rFLF
r
LS
LrS
LFS
K
KCKC
C
CC
CKC
ερε
ερε
εερ

75Michigan Technological UniversityDavid R. Shonnard
3. Product Purification /Contaminant Removal:Adsorption Equilibrium - Adsorbent Capacity
Problem Solution:2. Use the Freundlich Isotherm plus m= 1 kg resin to calculate
capacity.
Capacity = m CS* = m KF CL
*
= (1,000 g dry resin) 55.6 cm3 fluid
g dry resin
1 mg protein
cm3 fluid
= 55,555.6 mg Protein
For each kg dry resin

76Michigan Technological UniversityDavid R. Shonnard
3. Product Purification /Contaminant Removal:Adsorption Equilibrium - Batch Adsorption
Example Problem 2: Batch Adsorption
An aqueous solution of protein (10 mg/cm3) of volume 1000 cm3 is contacted with 10 g of the resin (from the prior example problem). What is the concentration remaining in the aqueous phase after equilibrium is achieved?
• m = mass of dry resin in a column = 10 g• n = 1 in the Freundlich Isotherm• V = volume of aqueous solution = 1,000 cm3.KF = 55.6 cm3 solution/g dry resin
Mass Balance on Protein
CS* m + CL
* V = (10 mg protein
cm3) V

77Michigan Technological UniversityDavid R. Shonnard
3. Product Purification /Contaminant Removal:Adsorption Equilibrium - Batch Adsorption
Example Problem 2: Batch Adsorption (cont.)
Equilibrium
CS* = K
F C
L*(1/n) = K
F C
L* for n = 1
Mass Balance Equation becomes:
K F CL* (100 g resin) + CL
* (1,000 cm3 ) = 104 mg Protein
CL* ((100 g resin) K
F + 1,000 cm3 ) = 104 mg Protein
CL* =
104 mg Protein
((100 g resin) (55.6 cm3 fluid
g resin) + 1,000 cm3 )
CL* = 1.52 mg Protein / cm3

78Michigan Technological UniversityDavid R. Shonnard
3. Product Purification /Contaminant Removal:Adsorption Equilibrium - Batch Adsorption
Example Problem 2: Batch Adsorption (cont.)
% Recovery of Protein = 1 - CL
*
CLo
100
= 1 - 1.52
10
100 = 84.76%
79Michigan Technological UniversityDavid R. Shonnard
3. Product Purification /Contaminant Removal:Fixed Bed Adsorption
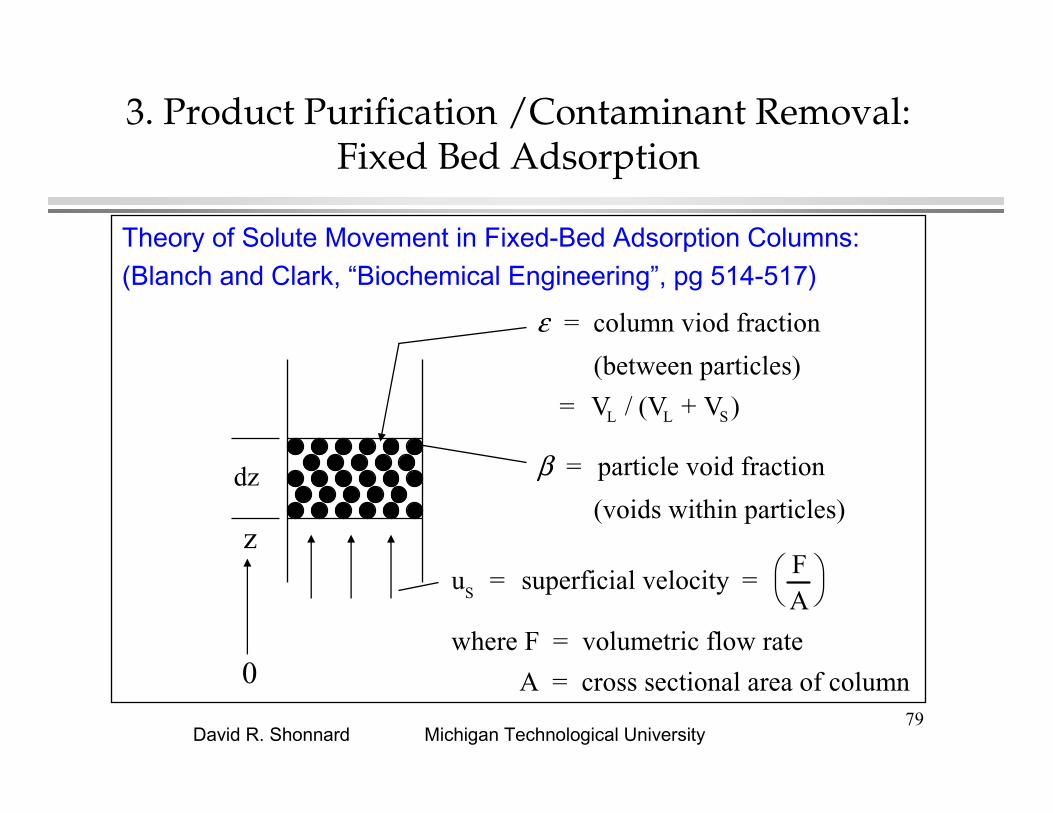
Theory of Solute Movement in Fixed-Bed Adsorption Columns:(Blanch and Clark, “Biochemical Engineering”, pg 514-517)
ε = column viod fraction
(between particles)
= VL / (VL + VS)
β = particle void fraction
(voids within particles)
uS = superficial velocity =
FA
where F = volumetric flow rate
A = cross sectional area of column
dz
z
0

80Michigan Technological UniversityDavid R. Shonnard
3. Product Purification /Contaminant Removal:Fixed Bed Adsorption
Theory of Solute Movement in Fixed-Bed Adsorption Columns:(cont.)
∂(VLCL )∂t
+ ∂(VSs )
∂t + uS
∂(VCL )∂z
= DL
∂2 (VCL )∂z2
(accumulation (accumulation (convective (axial
in liquid) in solid) flow) dispersion)
s (t, z) = C Li
β + ρP C
S - - - avg. concentration inside particle
C Li
= C
Li(t, r,z)4πr2dr
0
R
∫43
πR2 =
3R3
r2CLi
(t, r, z)dr0
R
∫
C S =
3R3
r2CSi
(t, r,z)dr0
R
∫ DL
= axial dispersion coefficient (cm2 / s)
81Michigan Technological UniversityDavid R. Shonnard
3. Product Purification /Contaminant Removal:Fixed Bed Adsorption
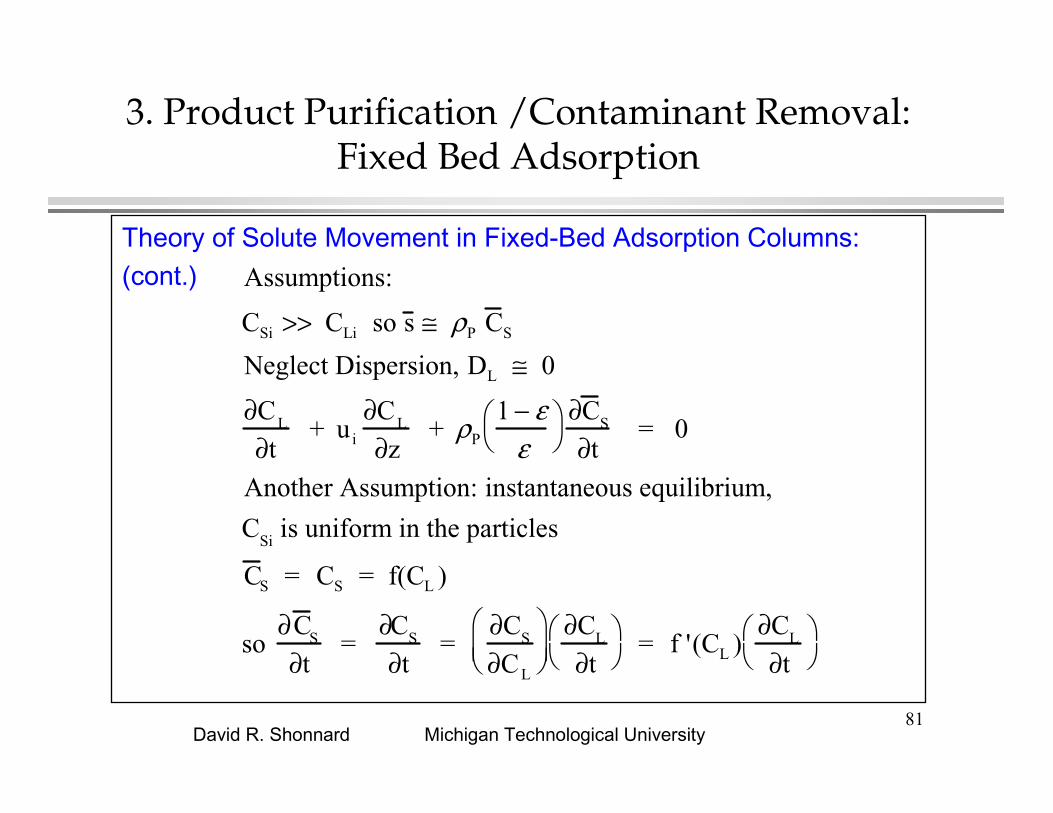
Theory of Solute Movement in Fixed-Bed Adsorption Columns:(cont.)
Assumptions:
CSi >> CLi so s ≅ ρP C SNeglect Dispersion, DL ≅ 0
∂CL
∂t + ui
∂CL
∂z + ρP
1 − εε
∂C S
∂t = 0
Another Assumption: instantaneous equilibrium,
CSi
is uniform in the particles
C S = CS = f(CL )
so ∂C
S
∂t =
∂CS
∂t =
∂CS
∂CL
∂CL
∂t
= f '(CL )
∂CL
∂t

82Michigan Technological UniversityDavid R. Shonnard
3. Product Purification /Contaminant Removal:Fixed Bed Adsorption
Theory of Solute Movement in Fixed-Bed Adsorption Columns:(cont.)
Therefore
∂CL
∂t +
ui
1+ ρP
1- εε
f '(CL
)
∂CL
∂z = 0
This is the form of a kinematic wave.
CL
z
t1 t2 t3 Dispersion effects

83Michigan Technological UniversityDavid R. Shonnard
3. Product Purification /Contaminant Removal:Fixed Bed Adsorption
Theory of Solute Movement in Fixed-Bed Adsorption Columns:(cont.)
The velocity of solute propaga
−dz
dt = −
∂CL
∂t
∂CL
∂z
= ui
1+ ρP
1-εε
f '(CL)
the mean retention time of solute
t = L
ui1+ ρ
P
1-εε
f '(CL)
84Michigan Technological UniversityDavid R. Shonnard
3. Product Purification /Contaminant Removal:Basics of Chromatography
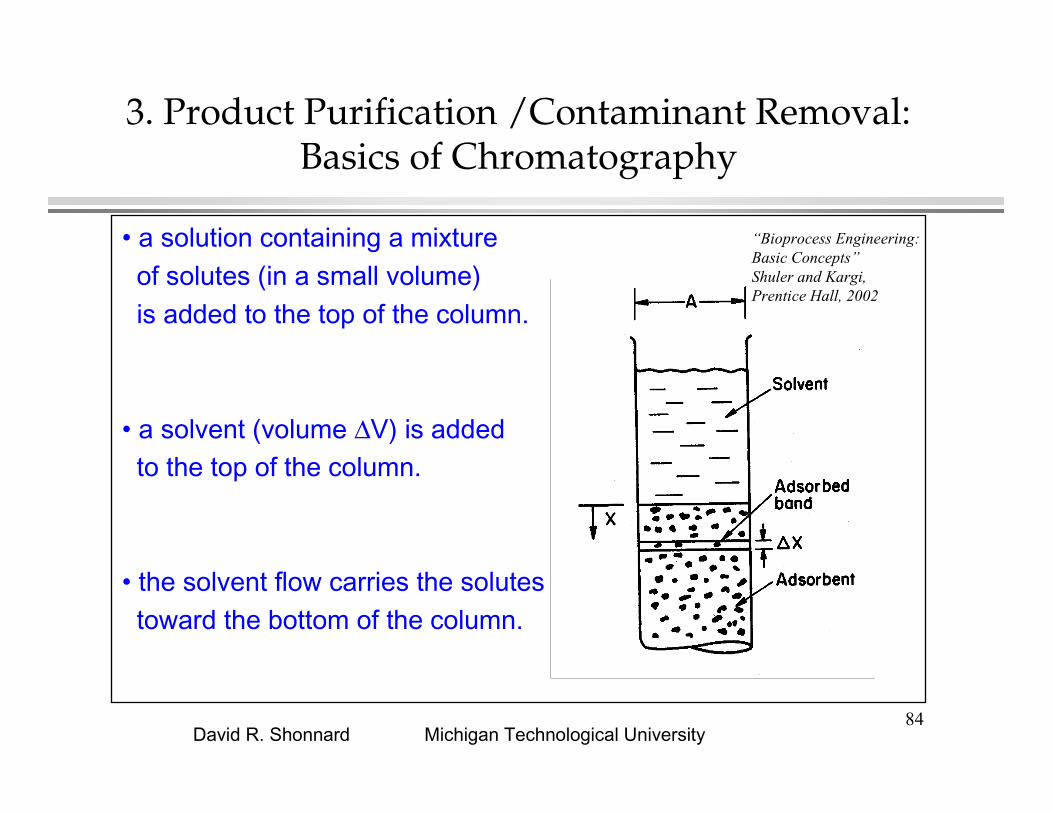
• a solution containing a mixtureof solutes (in a small volume)is added to the top of the column.
• a solvent (volume ∆V) is addedto the top of the column.
• the solvent flow carries the solutestoward the bottom of the column.
“Bioprocess Engineering: Basic Concepts”Shuler and Kargi, Prentice Hall, 2002

85Michigan Technological UniversityDavid R. Shonnard
3. Product Purification /Contaminant Removal:Basics of Chromatography
• each solute is carried alongat a different apparentvelocity, depending uponthe strength of interactionwith the column packing.
• ideally, each solute exitsthe column as a discreteband of material.
“Bioprocess Engineering: Basic Concepts”Shuler and Kargi, Prentice Hall, 2002
time

86Michigan Technological UniversityDavid R. Shonnard
3. Product Purification /Contaminant Removal:Basics of Chromatography
A technique to separate components in a mixture based upon differential affinity for solutes for the adsorbent.
The affinity is quantified by the adsorption isotherm, CS* = f(CL*), and in particular the derivative, f ‘(CL*).
The affinity could also include size selection as in gel permeation or molecular sieve chromatography.

87Michigan Technological UniversityDavid R. Shonnard
3. Product Purification /Contaminant Removal:Theory of Chromatography
A Theory of Solute Movement How much solvent (∆V) is needed to move a solute a distance ∆x?
Solute balance over a differential column height ∆x
-∂CL
∂x
∆x
∆V = ε A ∆x
∂CL
∂V
∆V + A ∆x
∂CS '
∂V
∆V
rate of solute rate of solute rate of solute
removal by removal from removal from
solvent flow void space solid phase
88Michigan Technological UniversityDavid R. Shonnard
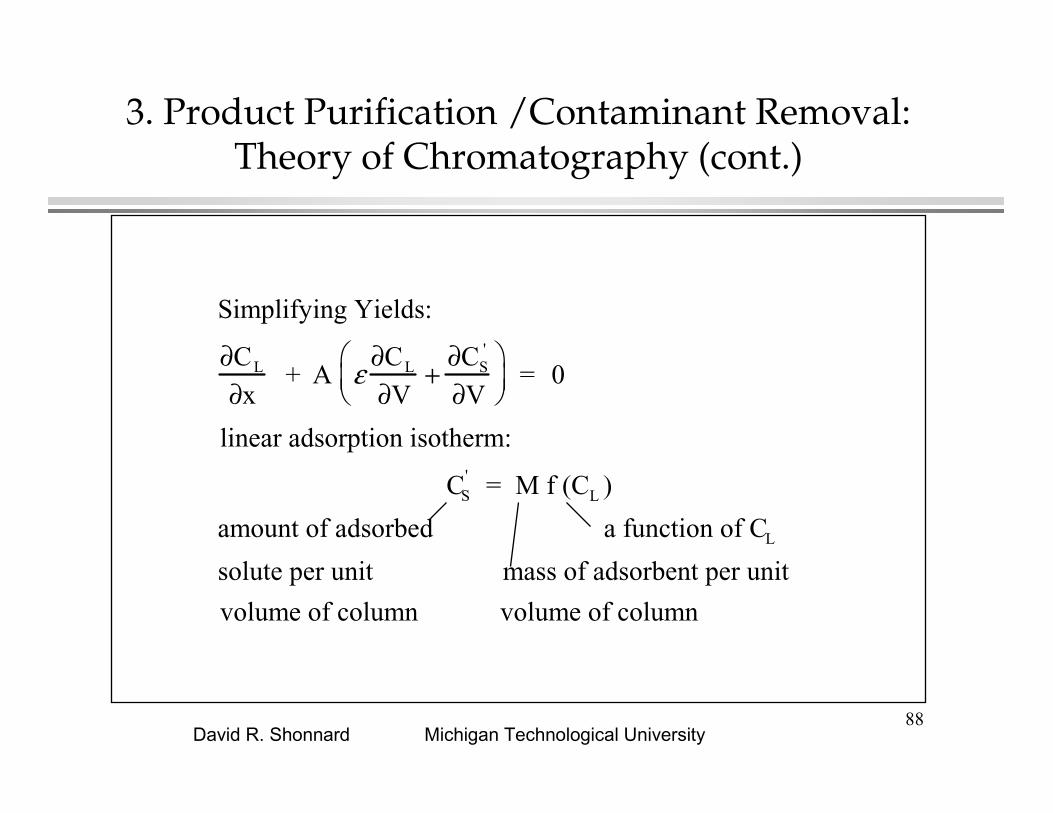
3. Product Purification /Contaminant Removal:Theory of Chromatography (cont.)
Simplifying Yields:
∂CL
∂x + A ε ∂CL
∂V+
∂CS '
∂V
= 0
linear adsorption isotherm:
CS ' = M f (CL )
amount of adsorbed a function of CL
solute per unit mass of adsorbent per unit
volume of column volume of column

89Michigan Technological UniversityDavid R. Shonnard
3. Product Purification /Contaminant Removal:Theory of Chromatography (cont.)
Simplifying Yields:
−∂C
L
∂x = A ε + M f '(CL )( )∂C
L
∂Vrearranging
∂V
∂x
= A ε + M f ' (CL)( )
Integrating from xo to x and Vo to V
∆x = ∆V
A ε +M f ' (CL )( )distance that elution volume of
solute band solvent
moves

90Michigan Technological UniversityDavid R. Shonnard
3. Product Purification /Contaminant Removal:Theory of Chromatography (cont.)
• The stronger the adsorption interaction, the shorter the travel distance, ∆x, for a given elution volume, ∆V.
• a stronger adsorption interactions means a greater value of M f ‘(CL).
CS'
CL
M f ' (CL )
adsorption isotherm

91Michigan Technological UniversityDavid R. Shonnard
3. Product Purification /Contaminant Removal:Theory of Chromatography (cont.)
Example: Solute A, Adsorbent BAdsorption isotherm: CS = k1 (CL)3
k1 = 0.2CL = 0.05 mg A/mL solution
ε = 0.35M = 5 g adsorbent B/100 mL column volume
∆V = volume of solvent added = 250 mL [cm3]A = column cross-sectional area = 10 cm2
mg A adsorbed
mg B
mg A
mL solution
mg A adsorbed
mg B
/
mg A
mL solution
3
92Michigan Technological UniversityDavid R. Shonnard
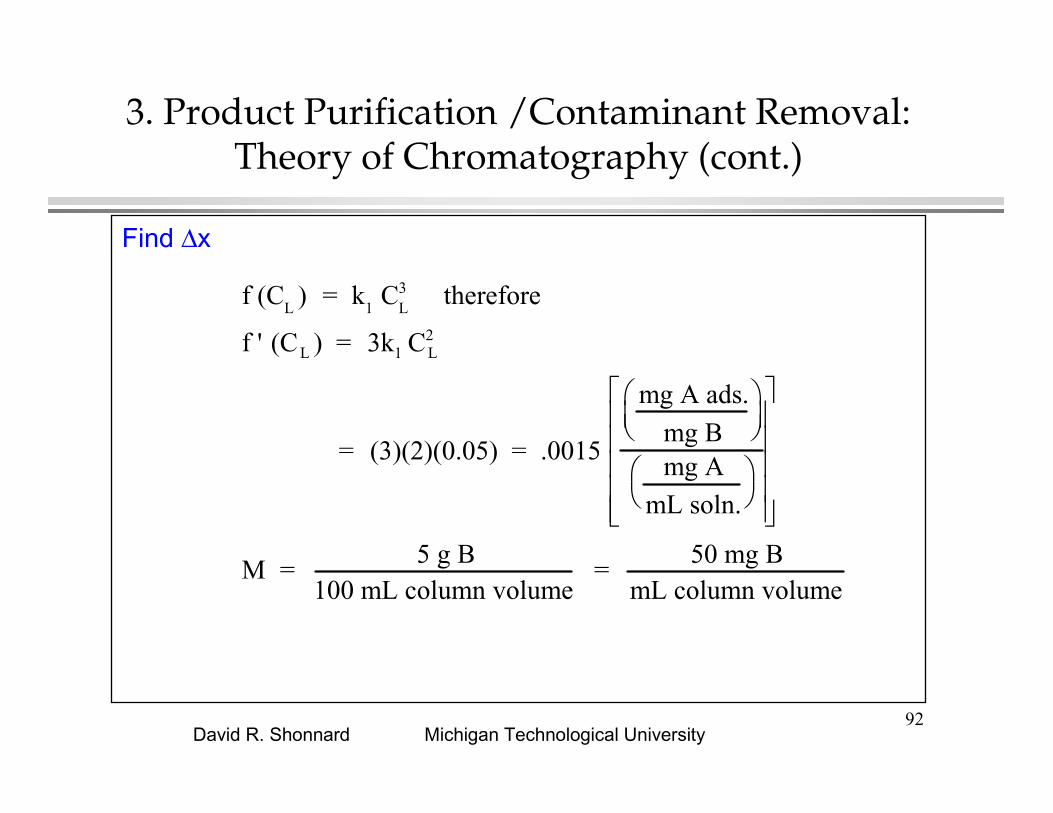
3. Product Purification /Contaminant Removal:Theory of Chromatography (cont.)
Find ∆x
f (CL
) = k1 C
L3 therefore
f ' (CL ) = 3k1 CL2
= (3)(2)(0.05) = .0015
mg A ads.
mg B
mg A
mL soln.
M = 5 g B
100 mL column volume =
50 mg BmL column volume

93Michigan Technological UniversityDavid R. Shonnard
3. Product Purification /Contaminant Removal:Theory of Chromatography (cont.)
Find ∆x
∆x = = ∆V
A ε + M f ' (CL)( )
250 mL 1 cm3 soln.
mL soln.
(10 cm2 ) 0.35cm3 soln.
cm3 coln vol+ 50
mg Bcm3 coln vol
.0015mg A / mg B
mg A / cm3 soln.
∆x = 58.5 cm

94Michigan Technological UniversityDavid R. Shonnard
3. Product Purification /Contaminant Removal:Examples of Chromatography
Bailey and Ollis, 1986, Fig. 11.18
95Michigan Technological UniversityDavid R. Shonnard
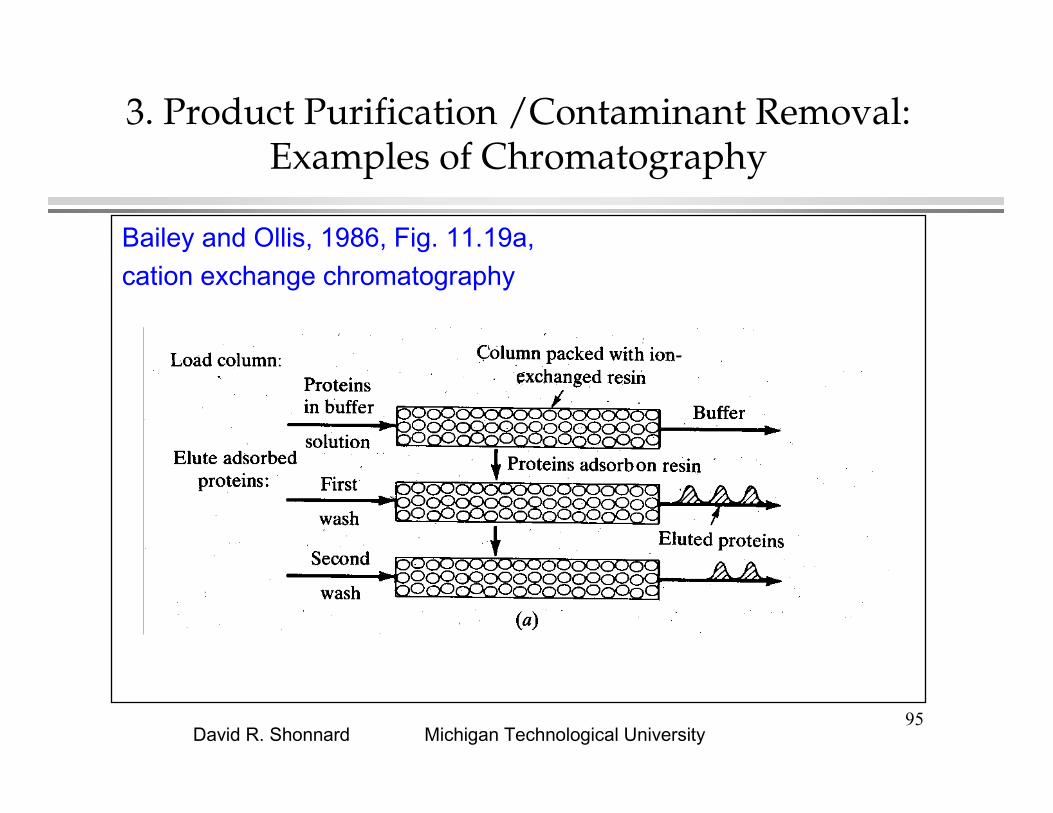
3. Product Purification /Contaminant Removal:Examples of Chromatography
Bailey and Ollis, 1986, Fig. 11.19a, cation exchange chromatography

96Michigan Technological UniversityDavid R. Shonnard
3. Product Purification /Contaminant Removal:Examples of Chromatography
Bailey and Ollis, 1986, Fig. 11.19b, cationexchange chromato-graphy

97Michigan Technological UniversityDavid R. Shonnard
3. Product Purification /Contaminant Removal:Examples of Chromatography
Gel Permeation Chromatography: is based on the penetration of solute molecules into small pores of packing particles on the basis of molecular size and the shape of the solute molecules. It is also known as size exclusion chromatography.
Equivalent Equilibrium Constant
K av,i = exp(-πL(rg + ri )2 )
where
L = concentration of gel fiber (cm/ cm3 )
rg = radius of a gel fiber (cm)
ri = radius of a spherical molecule of species, i (cm)
Kav,i
is equivalent to f ' (CL) in calculating t or
dzdt

98Michigan Technological UniversityDavid R. Shonnard
3. Product Purification /Contaminant Removal:Examples of Chromatography
Molecule radii estimated based on protein diffusion coefficients
Bailey and Ollis, 1986,

99Michigan Technological UniversityDavid R. Shonnard
3. Product Purification /Contaminant Removal:Examples of Chromatography
Bailey and Ollis, 1986, Fig. 11.21, gel permeation chromato-graphy

100Michigan Technological UniversityDavid R. Shonnard
3. Product Purification /Contaminant Removal:Examples of Chromatography
Bailey and Ollis, 1986, Fig. 11.22, molecularsieve chromato-graphy

101Michigan Technological UniversityDavid R. Shonnard
3. Product Purification /Contaminant Removal:Ion Exchange of Amino Acids
Charged Amino Acid R Groups at Neutral pH
“Principles of Biochemistry”Lehninger, Worth, 1982

102Michigan Technological UniversityDavid R. Shonnard
3. Product Purification /Contaminant Removal:Ion Exchange of Amino Acids (cont.)
Polar Amino Acid R Groups at Neutral pH
“Principles of Biochemistry”Lehninger, Worth, 1982

103Michigan Technological UniversityDavid R. Shonnard
3. Product Purification /Contaminant Removal:Ion Exchange of Amino Acids (cont.)
Nonpolar Amino Acid R Groups at Neutral pH “Principles of Biochemistry”Lehninger, Worth, 1982

104Michigan Technological UniversityDavid R. Shonnard
3. Product Purification /Contaminant Removal:Ion Exchange of Amino Acids (cont.)
Acid dissociation reactions - Nonpolar and Polar R Groups:
“Bioseparaion Process Science”Garcia et al., Blackwell Science, 1999

105Michigan Technological UniversityDavid R. Shonnard
3. Product Purification /Contaminant Removal:Ion Exchange of Amino Acids (cont.)
Acid dissociation reactions - Nonpolar and Polar R Groups:
“Bioseparaion Process Science”Garcia et al., Blackwell Science, 1999

106Michigan Technological UniversityDavid R. Shonnard
3. Product Purification /Contaminant Removal:Ion Exchange of Amino Acids (cont.)
Acid dissociation reactions - Nonpolar and Polar R Groups:
“Bioseparaion Process Science”Garcia et al., Blackwell Science, 1999

107Michigan Technological UniversityDavid R. Shonnard
3. Product Purification /Contaminant Removal:Ion Exchange of Amino Acids (cont.)
Acid dissociation reactions - Negatively Charged R Groups:
“Bioseparaion Process Science”Garcia et al., Blackwell Science, 1999

108Michigan Technological UniversityDavid R. Shonnard
3. Product Purification /Contaminant Removal:Ion Exchange of Amino Acids (cont.)
Acid dissociation reactions - Negatively Charged R Groups:
“Bioseparaion Process Science”Garcia et al., Blackwell Science, 1999
109Michigan Technological UniversityDavid R. Shonnard
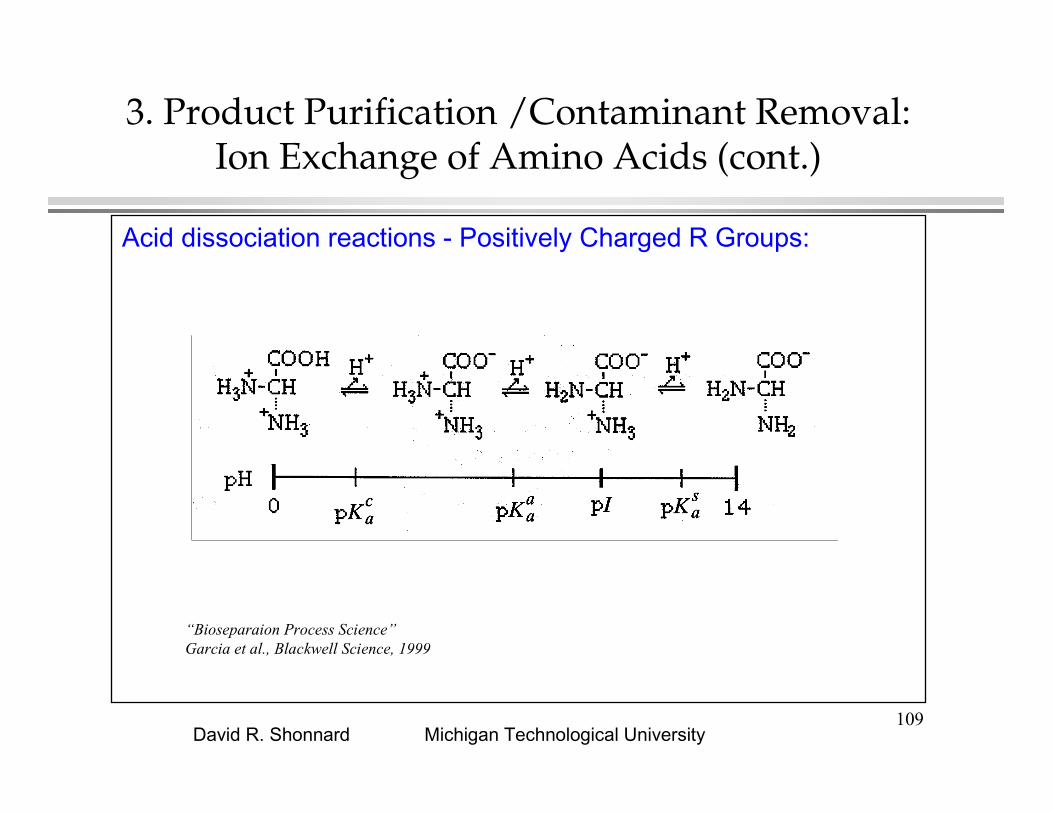
3. Product Purification /Contaminant Removal:Ion Exchange of Amino Acids (cont.)
Acid dissociation reactions - Positively Charged R Groups:
“Bioseparaion Process Science”Garcia et al., Blackwell Science, 1999

110Michigan Technological UniversityDavid R. Shonnard
3. Product Purification /Contaminant Removal:Ion Exchange of Amino Acids (cont.)
Acid dissociation reactions - Positively Charged R Groups:
“Bioseparaion Process Science”Garcia et al., Blackwell Science, 1999

111Michigan Technological UniversityDavid R. Shonnard
3. Product Purification /Contaminant Removal:Ion Exchange of Amino Acids (cont.)
Acid dissociation reactions - Stoichiometry of COOH = HA:
HA K a
← → A- + H+ ⇒ K a = [H+][A-]
[HA]
log Ka = log [H+] + log
[A-]
[HA]
pH = -log [H+] and pKa = -log Ka
pH = pKa + log [A-]
[HA] or
[A-]
[HA] = 10(pH-pKa)
but [HA]o = [HA] + [A-] or [HA] = [HA]o - [A-]
[A-]
[HA]o - [A-] = 10(pH-pKa) and [A-]
[HA]o =
10(pH-pKa)
1 +10(pH-pKa)
112Michigan Technological UniversityDavid R. Shonnard
3. Product Purification /Contaminant Removal:Ion Exchange of Amino Acids (cont.)
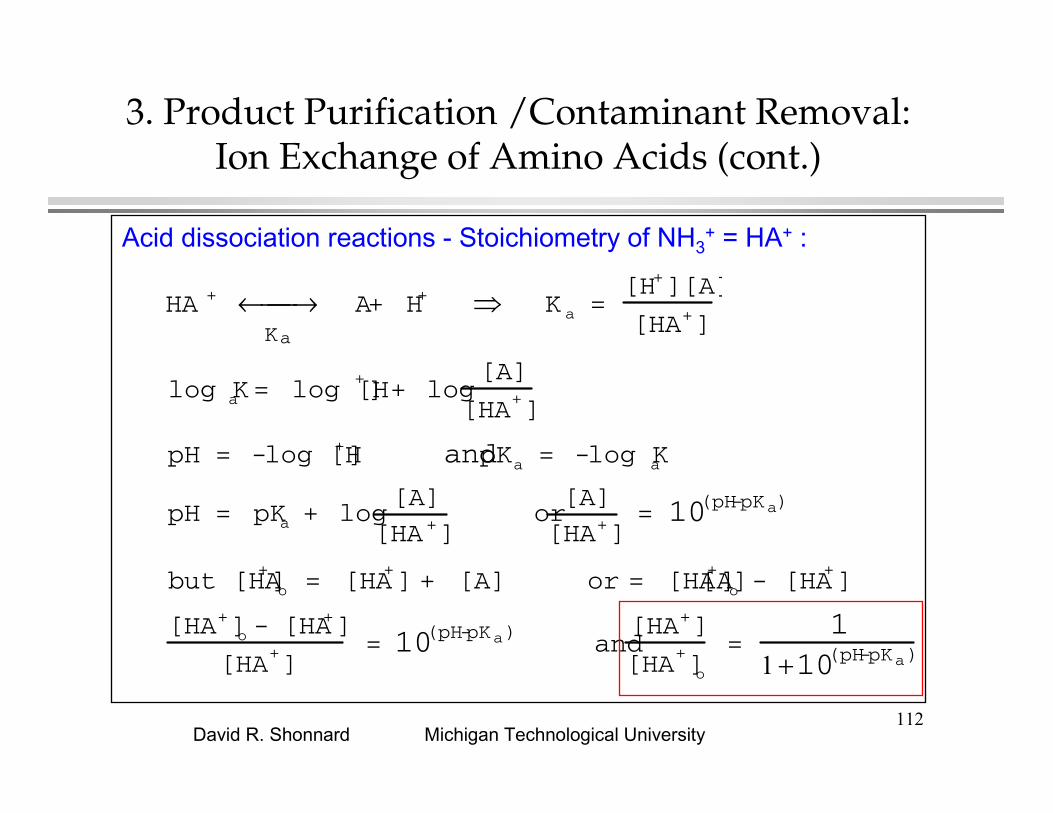
Acid dissociation reactions - Stoichiometry of NH3+ = HA+ :
HA + Ka
← → A + H+ ⇒ K a = [H+][A]
[HA+]
log Ka = log [H+] + log
[A]
[HA+]
pH = -log [H+] and pKa = -log Ka
pH = pKa + log [A]
[HA+] or
[A]
[HA+] = 10(pH-pKa)
but [HA+]o = [HA+] + [A] or [A] = [HA+]o - [HA
+]
[HA+]o - [HA+]
[HA+] = 10(pH-pKa) and
[HA+]
[HA+]o =
11 +10(pH-pKa)

113Michigan Technological UniversityDavid R. Shonnard
3. Product Purification /Contaminant Removal:Ion Exchange of Amino Acids (cont.)
Charge on amino acid groups: ( )( )
( )
( )
( )
( )
( )( )s
a
sa
aa
ca
pKpH
pKpH
pKpH
pKpH
−
−
−
−
++=
+
−=
+
−=
++=
101
11chain side of Charge
10
11
11chain side of Charge
10
11
11group carboxyl- of Charge
101
11group amino- of Charge
α
α
114Michigan Technological UniversityDavid R. Shonnard
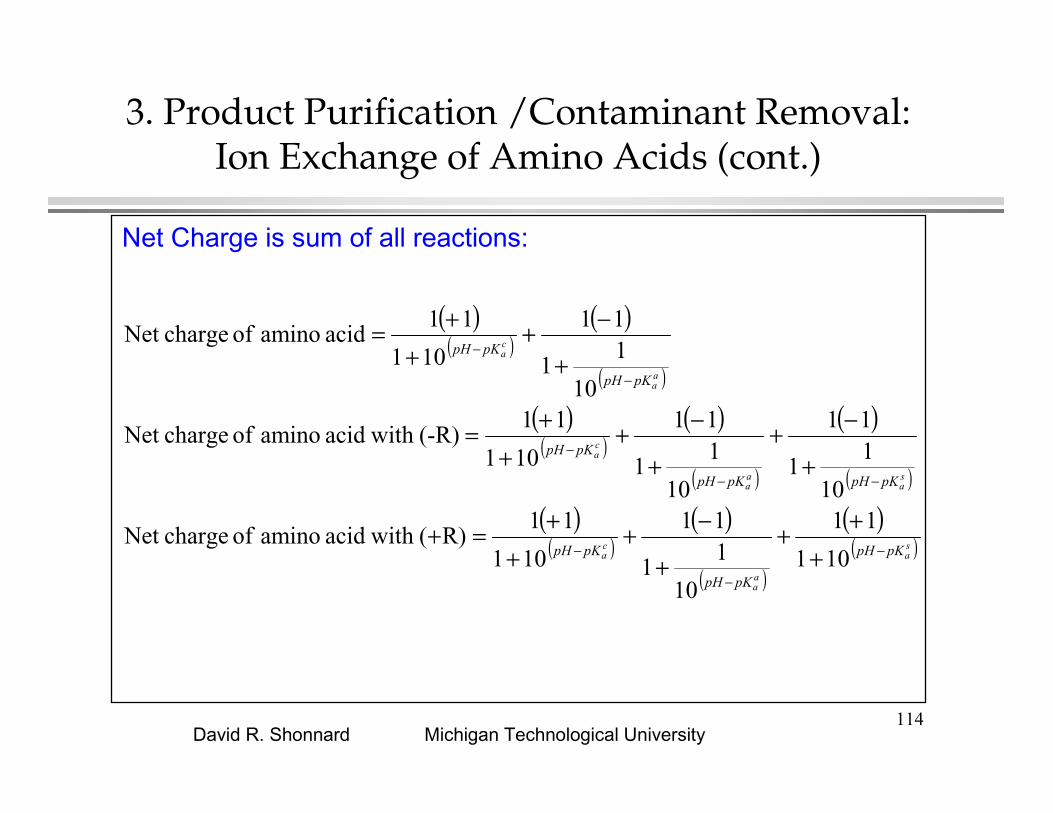
3. Product Purification /Contaminant Removal:Ion Exchange of Amino Acids (cont.)
Net Charge is sum of all reactions:
( )( )
( )
( )
( )( )
( )
( )
( )
( )
( )( )
( )
( )
( )( )s
a
aa
ca
sa
aa
ca
aa
ca
pKpH
pKpH
pKpH
pKpHpKpH
pKpH
pKpH
pKpH
−
−
−
−−
−
−
−
+++
+
−++
+=+
+
−++
−++
+=
+
−++
+=
101
11
10
11
11
101
11R)( with acid amino of chargeNet
10
11
11
10
11
11
101
11(-R) with acid amino of chargeNet
10
11
11
101
11acid amino of chargeNet

115Michigan Technological UniversityDavid R. Shonnard
3. Product Purification /Contaminant Removal:Ion Exchange of Amino Acids (cont.)

116Michigan Technological UniversityDavid R. Shonnard
3. Product Purification /Contaminant Removal:Ion Exchange of Proteins
A computer algorithm for computing charge of proteins (Genetics Computer Group, Inc. 1993)
−
+
−
=
rminicarboxy te
eddeprotonat of #
terminiamino
protonated of #
residues charged
negatively of #
residues charged
positively of #
arg ech
Net
[ ][ ] )(
)()(NKH
HtNpN
+= +
+
N(p) is the number of protonated residuesN(t) is the total number of residues of a specific type[H+] is the hydrogen ion concentrationK(N) is the aminoacid dissociation constant

117Michigan Technological UniversityDavid R. Shonnard
3. Product Purification /Contaminant Removal:Ion Exchange of Proteins
−
+
−
=
rminicarboxy te
eddeprotonat of #
terminiamino
protonated of #
residues charged
negatively of #
residues charged
positively of #
arg ech
Net
Calculate the net charge of the following peptide NH2-Lys-Pro-Lys-COOH
68.10
12.9
19.2
charged positively Lysine
nInformatio
=
=
=
sa
aa
ca
pK
pK
pK
41.10
9.1
aminoacidnonpolar Proline
nInformatio
=
=aa
ca
pK
pK
2 0 1 from lys 1 from lys

118Michigan Technological UniversityDavid R. Shonnard
−
+
−
=
rminicarboxy te
eddeprotonat of #
terminiamino
protonated of #
residues charged
negatively of #
residues charged
positively of #
arg ech
Net
68.10
12.9
19.2
charged positively Lysine
nInformatio
=
=
=
sa
aa
ca
pK
pK
pK
41.10
9.1
aminoacidnonpolar Proline
nInformatio
=
=aa
ca
pK
pK
2 0 1 from lys 1 from lys
[ ][ ]
[ ][ ]
[ ][ ] 19.212.968.10 101010
2charge
Net−+
+
−+
+
−+
+
+−
++
+=
H
H
H
H
H
H
0
0.5
1
1.5
2
2.5
3
3.5
0 5 10 15
pH
Net
ch
arg
e

119Michigan Technological UniversityDavid R. Shonnard
3. Product Purification /Nonideal effects on Chromatographic Separations
Dispersion, Wall Effects, and Nonequilibrium:
“Bioprocess Engineering: Basic Concepts”Shuler and Kargi, Prentice Hall, 2002
Gaussian Peak
σ σ σ σ i tmax,i = standard deviation
Resolution of Peaks
RS=
tmax, j − tmax,i
1 / 2(tw,i + tw, j )

120Michigan Technological UniversityDavid R. Shonnard
3. Product Purification /Nonideal Effects on Chromatographic Separations
Prediction of Peak Width:
yi =ymax,i exp -( t − tmax,i)
2
2(σ tmax,i )2
σ σ σ σ depends on dispersion and adsorption kinetics
σ 2 = v
kalv =superficial velocity,
ka =surfaceadsorption reaction rate
l =column length

121Michigan Technological UniversityDavid R. Shonnard
3. Product Purification /Nonideal Effects on Chromatographic Separations
Prediction of Peak Height:
ymax,i is inversely proportional to σ tmax,i
σ σ σ σ may depend on other processes
σ 2 ∝vd2
linternal diffusion control,
σ 2 ∝v1/ 2 / d3/ 2
lexternal film control,
σ 2 ∝vd2
DlTaylor dispersion (laminar flow),
122Michigan Technological UniversityDavid R. Shonnard
3. Product Purification /Scale Up of Chromatographic Separations
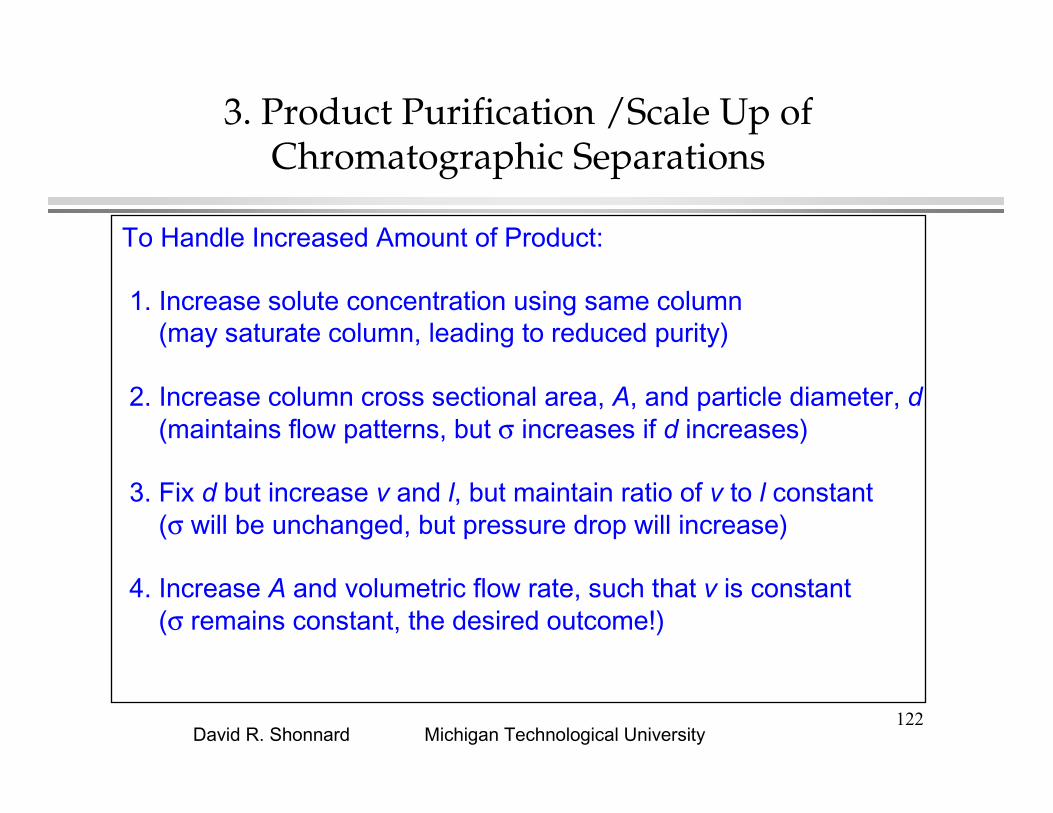
To Handle Increased Amount of Product:
1. Increase solute concentration using same column(may saturate column, leading to reduced purity)
2. Increase column cross sectional area, A, and particle diameter, d(maintains flow patterns, but σ increases if d increases)
3. Fix d but increase v and l, but maintain ratio of v to l constant(σ will be unchanged, but pressure drop will increase)
4. Increase A and volumetric flow rate, such that v is constant(σ remains constant, the desired outcome!)

123Michigan Technological UniversityDavid R. Shonnard
3. Product Purification /Scale Up of Chromatographic Separations
Recent Advances in Chromatographic Packing:
1. Rigid beads with macropores inside particles
2. Allows higher flowrates without bead compression
3. Allows higher flowrates without excessive pressure drop
4. Good mass transfer is maintained between macroporesand micropore within particles.

124Michigan Technological UniversityDavid R. Shonnard
3. Chromatographic Separation of Proteins from Cheese Whey
Heat Treatment(Optional)
Evaporator
Spray Dryer
NFDM
Standardize
Cheese Milk
Rennet/Acid
Curds
Cheese
Whey
Ultrafiltration
Evaporator/Spray Dryer
Evaporator/Spray Dryer
WPC
Dry Whole Whey
Ultrafiltration
UF Milk
Evaporator/Spray Dryer
MPC
Acid Rennet/Heat
Whey Curds
Evaporator/Spray Dryer
Dry Whole Whey
Wash
Evaporator/Spray Dryer
Casein
Cream Separator
Raw Milk
Chandrasekaran, R.,MS Thesis, Dept. ofChemical EngineeringMTU

125Michigan Technological UniversityDavid R. Shonnard
3. Chromatographic Separation of Proteins from Cheese Whey (cont.)
Fluid Sweet Whey
Water 93.7
Total Solid 6.35
Fat 0.5
Protein 0.8
Lactose 4.85
Ash 0.5
Lactic Acid 0.05
Table 1.2 Composition of Whey (Weight %) (Kosikowski et al., 1997)
Chandrasekaran, R.,MS Thesis, Dept. ofChemical EngineeringMTU

126Michigan Technological UniversityDavid R. Shonnard
Whey proteins are finding increasing application in the fields of nutrition (protein powder), as an antibiotic, and in other pharmaceutical applications. Individual whey proteins can be separated using cation exchange chromatography, using pH change during elution to recover individual proteins.
Table 1. Isoelectric Points of Major Whey Proteins [1]Whey Protein Isoelectric Pointβ-lactoglobulin 5.35-5.49
α-lactalbumin 4.2-4.5
Bovine Serum Albumin 5.13Immunoglobulins 5.5-8.3
Lactoferrin 7.8-8.0Lactoperoxidase 9.2-9.9
3. Chromatographic Separation of Proteins from Cheese Whey (cont.)

127Michigan Technological UniversityDavid R. Shonnard
Whey proteins have a range of molecular weights.
3. Chromatographic Separation of Proteins from Cheese Whey (cont.)
Table 2. Major Whey Protein Molecular Weights [1] Whey Protein Molecular Weight β-lactoglobulin 18,300 α-lactalbumin 14,000
Bovine Serum Albumin 69,000 Immunoglobulins 150,000
Lactoferrin 77,000 Lactoperoxidase 77,500
128Michigan Technological UniversityDavid R. Shonnard
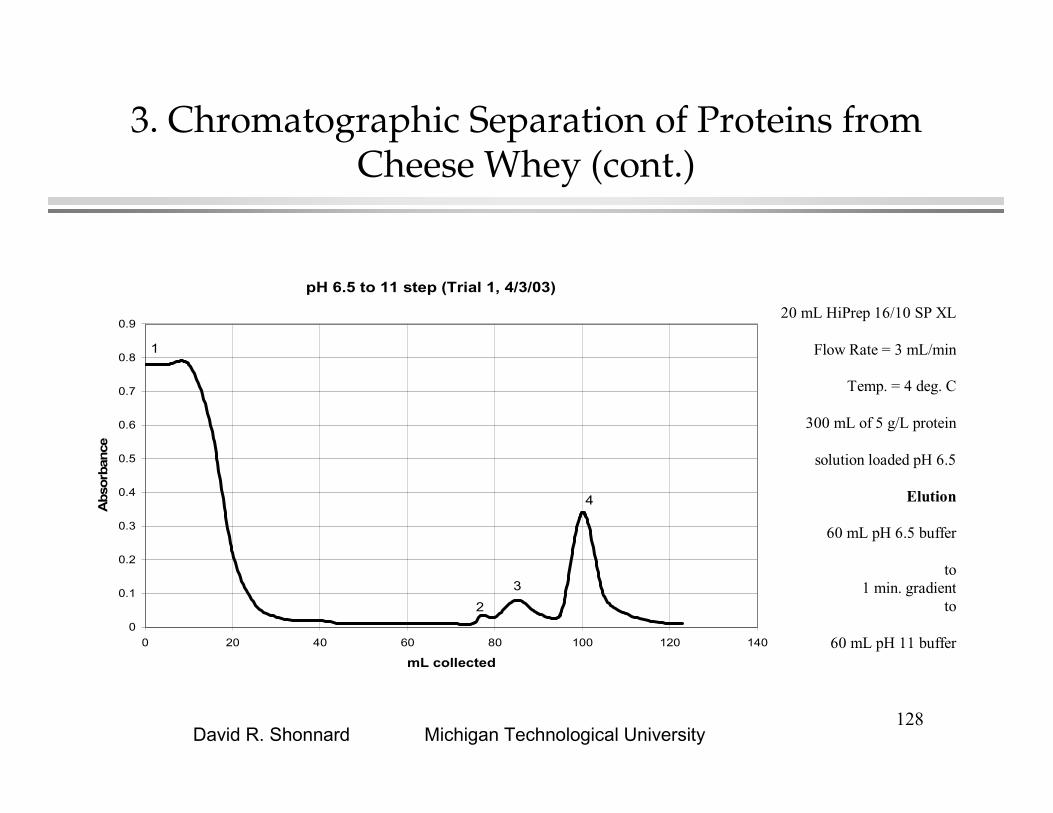
3. Chromatographic Separation of Proteins from Cheese Whey (cont.)
pH 6.5 to 11 step (Trial 1, 4/3/03)
0
0.1
0.2
0.3
0.4
0.5
0.6
0.7
0.8
0.9
0 20 40 60 80 100 120 140
mL collected
Abso
rban
ce
1
2
3
4
20 mL HiPrep 16/10 SP XL
Flow Rate = 3 mL/min
Temp. = 4 deg. C
300 mL of 5 g/L protein
solution loaded pH 6.5
Elution
60 mL pH 6.5 buffer
to1 min. gradient
to
60 mL pH 11 buffer
129Michigan Technological UniversityDavid R. Shonnard
3. Chromatographic Separation of Proteins from Cheese Whey (cont.)
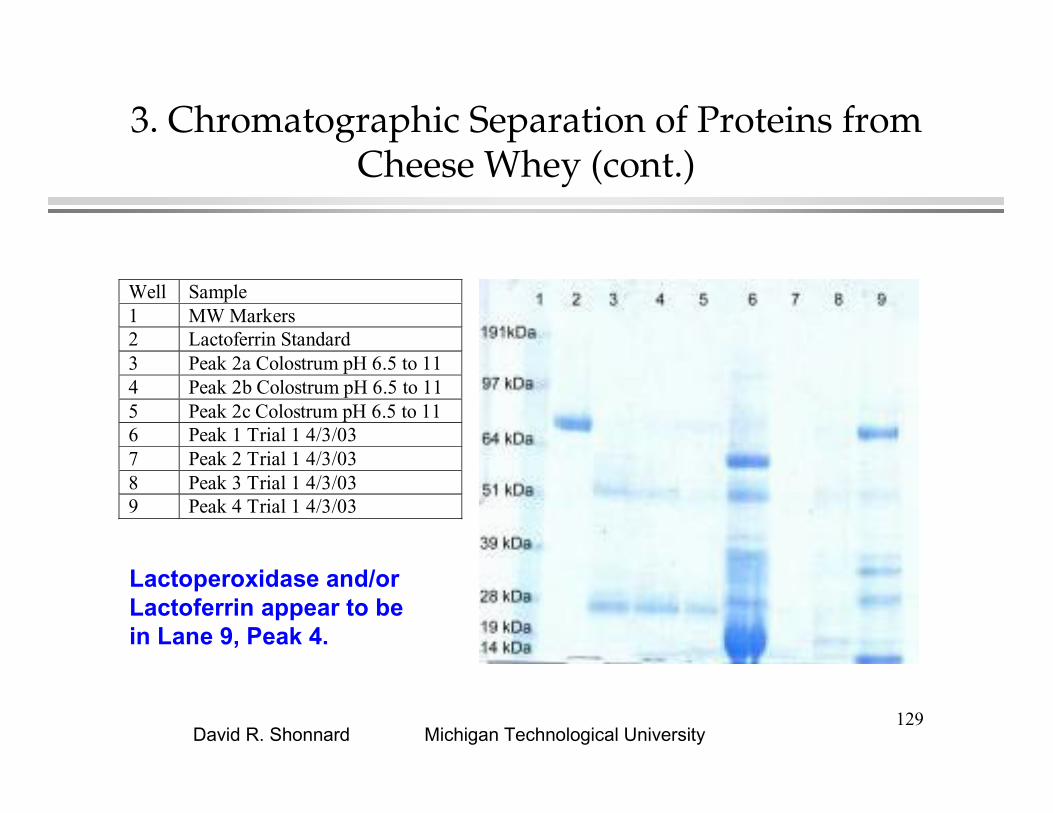
Well Sample 1 MW Markers 2 Lactoferrin Standard 3 Peak 2a Colostrum pH 6.5 to 11 4 Peak 2b Colostrum pH 6.5 to 11 5 Peak 2c Colostrum pH 6.5 to 11 6 Peak 1 Trial 1 4/3/03 7 Peak 2 Trial 1 4/3/03 8 Peak 3 Trial 1 4/3/03 9 Peak 4 Trial 1 4/3/03
Lactoperoxidase and/or Lactoferrin appear to be in Lane 9, Peak 4.

130Michigan Technological UniversityDavid R. Shonnard
500 ml of a solution of 5 g/L whey protein powder were loaded inthe column HiPrep 16/10 SP XL and eluted using gradients from 0 to 85% pH11 (+ 15% pH 6.5 yielding pH 8.5 solution) in 2, 4, 6, 8, 10, 12 and 14 min, using program 2.
Program 2 Breakpoint
(min) Conc %B Flow rate
(ml/min) Fraction volume
(ml)
Tube A Tube B Valve position
0 0 3 5 pH 6.5 pH 11 Load 20 0 3 5 pH 6.5 pH 11 Load
(20+x) 85 3 5 pH 6.5 pH 11 Load (40+x) 85 3 5 pH 6.5 pH 11 Load (43+x) 100 3 5 pH 6.5 pH 11 Load (58+x) 100 3 5 pH 6.5 pH 11 Load
Where x is the time for the pH gradient from 0% pH 11 to 85% pH 11.
3. Effects of pH Gradient on Peak Resolution

131Michigan Technological UniversityDavid R. Shonnard
Figure 2. Change of 0% pH 11 to 85% pH 11 in 2 min. Figure 3. Change of 0% pH 11 to 85% pH 11 in 4 min.
12
1 2

132Michigan Technological UniversityDavid R. Shonnard
Figure 4. Change of 0% pH 11 to 85% pH 11 in 6 min. Figure 5. Change of 0% pH 11 to 85% pH 11 in 8 min
1
2
1
2 3

133Michigan Technological UniversityDavid R. Shonnard
Figure 6. Change of 0% pH 11 to 85% pH 11 in 10 min. Figure 7. Change of 0% pH 11 to 85% pH 11 in 12 min.
1
2
3
1
2
3

134Michigan Technological UniversityDavid R. ShonnardFigure 8. Change of 0% pH 11 to 85% pH 11 in 14 min.
1
2
3
135Michigan Technological UniversityDavid R. Shonnard
4. Product Preparation / Crystallization
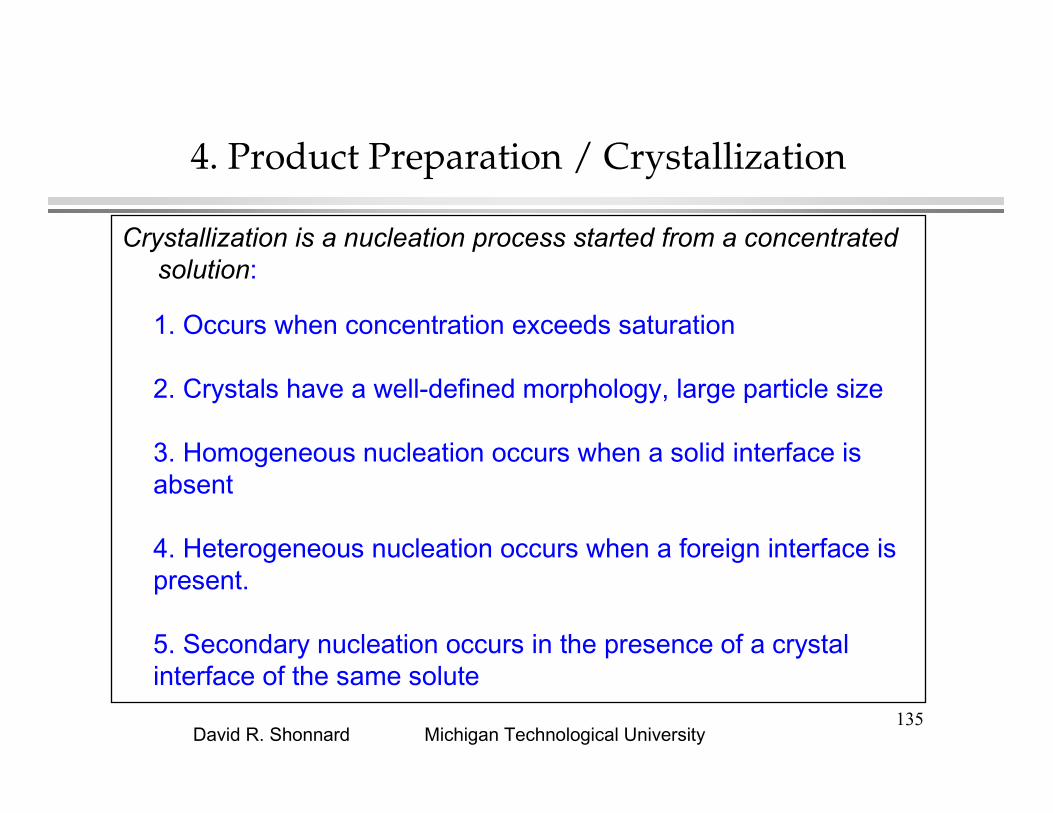
Crystallization is a nucleation process started from a concentrated solution:
1. Occurs when concentration exceeds saturation
2. Crystals have a well-defined morphology, large particle size
3. Homogeneous nucleation occurs when a solid interface is absent
4. Heterogeneous nucleation occurs when a foreign interface is present.
5. Secondary nucleation occurs in the presence of a crystal interface of the same solute

136Michigan Technological UniversityDavid R. Shonnard
4. Product Preparation / Crystallization
Critical cluster or nucleus is the largest cluster of molecules just prior to spontaneous nucleation:
1. n* is the number of molecules in the critical nucleus.
2. Subcritical clusters refers to when, n < n*
3. Supercritical clusters refers to when n > n*
4. An embryo is a cluster having n = n*.
5. An embryo or critical nucleus can range from 10 nm to several µm in size.
137Michigan Technological UniversityDavid R. Shonnard
4. Product Preparation / Crystallization
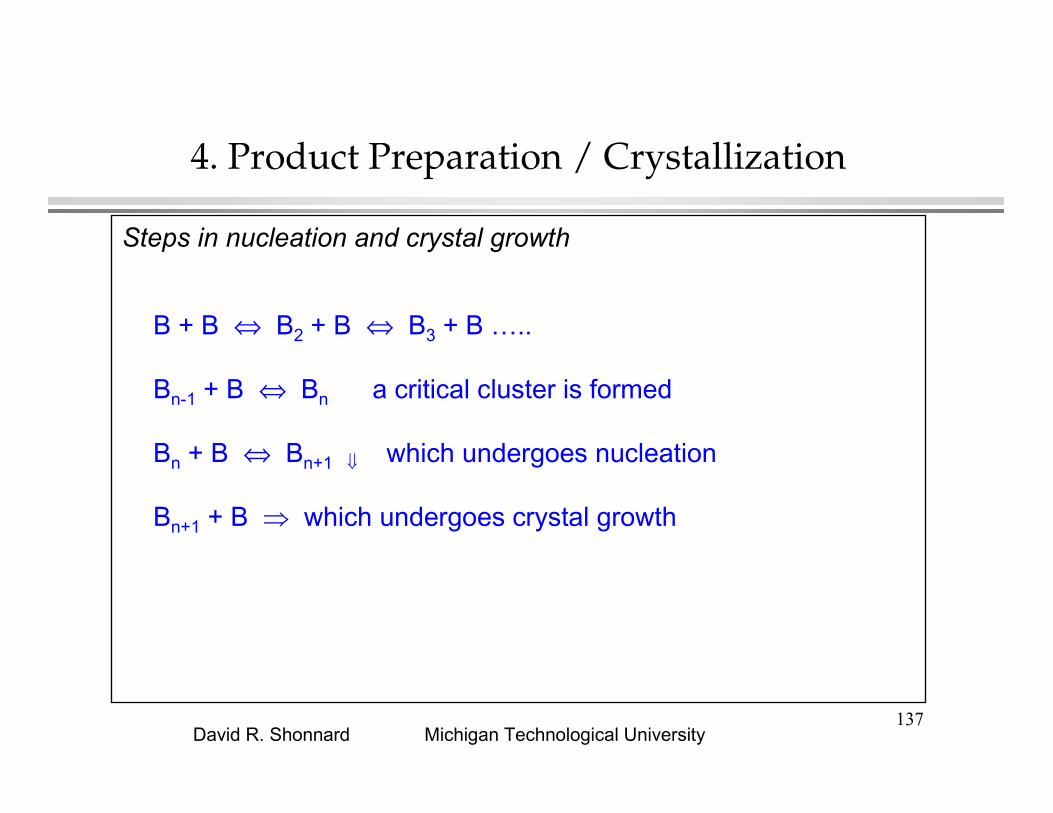
Steps in nucleation and crystal growth
B + B ⇔ B2 + B ⇔ B3 + B …..
Bn-1 + B ⇔ Bn a critical cluster is formed
Bn + B ⇔ Bn+1 ⇓ which undergoes nucleation
Bn+1 + B ⇒ which undergoes crystal growth

138Michigan Technological UniversityDavid R. Shonnard
4. Product Preparation / Crystallization
Characteristic zones of crystallization
No crystallization occursGrowth of existing crystals,
Formation of new nuclei
New nuclei form spontaneously
“Bioseparation Process Science”Garcia et al., Blackwell Science, 1999

139Michigan Technological UniversityDavid R. Shonnard
4. Product Preparation / Crystallization
Transport Processes During Crystallization
“Bioseparation Process Science”Garcia et al., Blackwell Science, 1999
Growth Rate of Crystals,
G = dL
dt = kg ∆C
where ∆C = C* − C is
the degree of saturation
Molecules incrystal
Molecules insolution

140Michigan Technological UniversityDavid R. Shonnard
4. Product Preparation / CrystallizationThermodynamics of Homogeneous Nucleation
Free Energy Change for Homogeneous Nucleation
∆GHomogeneous = ∆GSurface formation + ∆GClustering
∆GSurface formation = 4π r 2γ sl
where γ sl is the surface tension of the solid / liquid interface
∆GClustering = − RT lnC
C*
4 / 3π r 3
Vmolar,solid
The critical nucleus, rc , is where there is a maximum in ∆GHomogeneous
d∆GHomogeneous
dr = 0 = 8π rcγ sl − RT ln
C
C*
4π rc2
Vmolar, solid
rc =2γ sl Vmolar, solid
RT lnC
C*
Useful calculation when seeding aCrystallization process
“Bioseparation Process Science”Garcia et al., Blackwell Science, 1999,Pages127-140
=
141Michigan Technological UniversityDavid R. Shonnard
4. Product Preparation / CrystallizationRate of Formation of Nuclei,dN/dt
=
∆==
2
*33
2solidmolar,
3
max0
ln3
16-exp
-exp
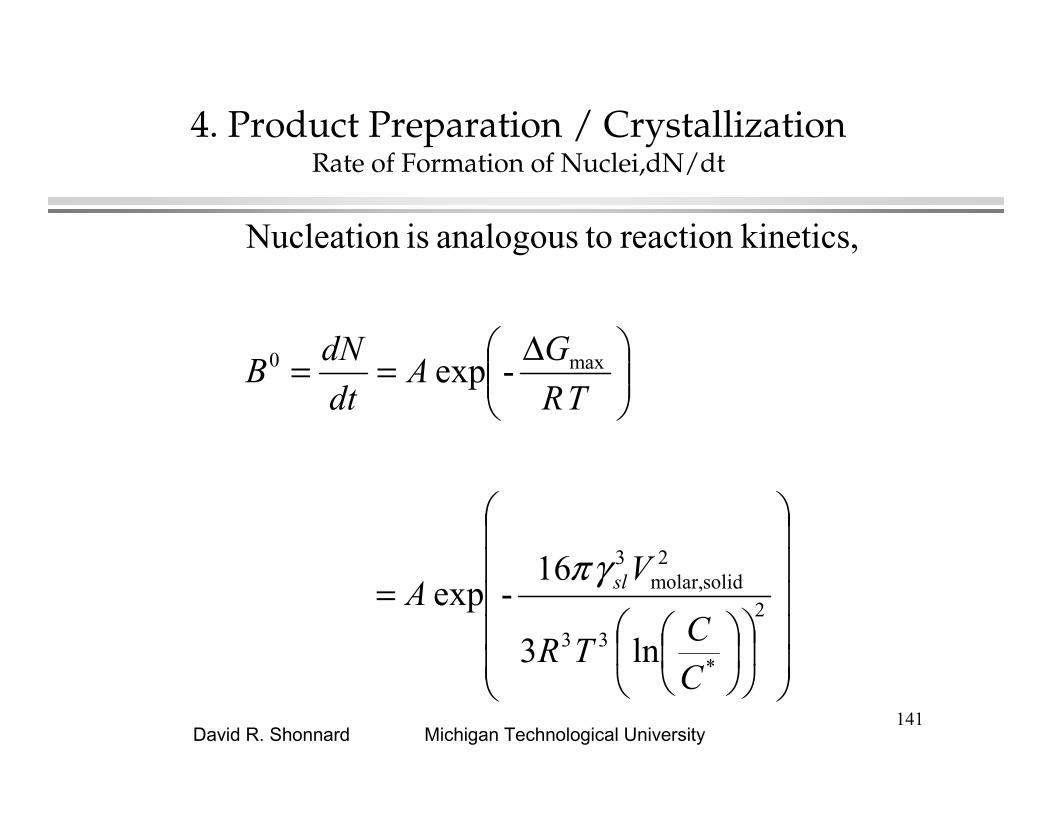
kinetics,reaction toanalogous is Nucleation
CC
TR
VA
TR
GA
dt
dNB
slγπ

142Michigan Technological UniversityDavid R. Shonnard
4. Product Preparation / CrystallizationBatch Crystallization, Solid Phase Balance
growth. crystal
todue range size specific a leaving and entering
crystals ofnumber the trackson balanceA
curve vs of Slope
Density, Population 2.
or
size, versus
Crystals, ofNumber eCummulativ 1.
n
LN
n
L
N

143Michigan Technological UniversityDavid R. Shonnard
4. Product Preparation / CrystallizationBatch Crystallization, Population Balance Equation
+
=
+
LLLL range, ofout
growing crystals
ofNumber
range,within
endat crystals
ofNumber
range, into
growing crystals
ofNumber
range,within
initially crystals
ofNumber
.for range size is 2subscript
range, sizesmaller a is 1subscript
step. timesmall a is (dL/dt), size crystal of
rategrowth isG range, size is volume,is 22final11initial
L
t
LV
tnGVLnVtnGVLnV
∆
∆∆
∆+∆=∆+∆

144Michigan Technological UniversityDavid R. Shonnard
4. Product Preparation / CrystallizationBatch Crystallization, Population Balance Equation (cont.)
0
allover constant a isG Assuming
0)(
0. togo to and allow and and , ,by divide
=+
=+
∆∆∆∆
dL
dnG
dt
dn
L
dL
Gnd
dt
dn
tLtLV

145Michigan Technological UniversityDavid R. Shonnard
4. Product Preparation / CrystallizationBatch Crystallization, Population Balance Equation (cont.)
−=
−=
∞→
==
==
G
LtuBn
G
sL
sG
Bn
nLG
BnL
nt
Domain Laplace in the exp
Transforms Laplace using BCs andequation balance population solve
finite is , as
0, at
0 0, at
nucleationfor (BCs) conditionsboundary
0
0
0

146Michigan Technological UniversityDavid R. Shonnard
4. Product Preparation / CrystallizationBatch Crystallization, Cumulative Crystal Mass
430c
c
3
0
c
4
1
, as and
factor shape a is and solid crystal ofdensity is where
eunit volumper mass crystal cumulative is
tGBkWM
L
k
dLLnkM
M
v
v
L
v
ρ
ρ
ρ
==
∞→
= ∫

147Michigan Technological UniversityDavid R. Shonnard
4. Product Preparation / CrystallizationBatch Crystallization, Cooling Curve
330c
Wof change of rate- ion concentrat solute of change of rate
ationcrystallizbatch duringation supersatur of degreeconstant a
achieve toiprelationsh etemperatur- time theDetermine
tGBkdt
dC
dt
dW
dt
dC
vρ−=
−=
=

148Michigan Technological UniversityDavid R. Shonnard
4. Product Preparation / CrystallizationBatch Crystallization, Cooling Curve (cont.)
4
thatfind we0, at
, form, start to crystals that re temperatu thefrom gintegratin
toalproportion bemust change etemperatur
of rate theation,supersatur of degreeconstant a achieve to
430c
0
0
330c
T
v
vT
k
tGBk-TT
t
T
tGBkdt
dTk
dt
dCdt
dC
ρ
ρ
=
=
−==

149Michigan Technological UniversityDavid R. Shonnard
4. Product Preparation / CrystallizationContinuous Crystallization, Solid Phase Balances
Number of
crystals growing
into range, ∆L,
over a time, ∆t
+Number of
crystals entering
range, ∆L, by flow
=
Number of
crystals growing
out of range, ∆L,
over a time, ∆t
+Number of
crystals leaving
range, ∆L, by flow
V G1 n1∆t + Qnin ∆L∆t = V G2 n2 ∆t + V n∆L∆t
V is volume, ∆L is size range, G is growth rate
of crystal size (dL / dt), ∆t is a small time step,
Q is volumetric flow rate through crystallizer.
subscript 1 is a smaller size range,
subscript 2 is size range for ∆L,
subscript in is for inlet conditions.

150Michigan Technological UniversityDavid R. Shonnard
4. Product Preparation / CrystallizationContinuous Crystallization, Solid Phase Balances
divide by ∆L , and ∆t and allow ∆L and ∆t to go to 0,
and assuming that no crystals are entering, nin
= 0,
and that G is constant.
V Gdn
dL+ Qn = 0
Restating in terms of residence time, τ = VQ
dn
dL+ n
Gτ= 0
Boundary Condition, L = 0, n = no = Bo
G

151Michigan Technological UniversityDavid R. Shonnard
4. Product Preparation / CrystallizationContinuous Crystallization, Solid Phase Balances
Population density solution,
n = no exp − LGτ
M = ρc kv n0
L
∫ L3 dL
where ρc is density of crystal solid and kv is a shape factor
M = 6 ρc kv no Gτ G3τ 3 − G3τ 3 + G 2τ 2 L +1
2GτL2 +
1
6L3
exp -
L
Gτ
and as L → ∞,
M = W = 6ρc kv no G 4 τ 4

152Michigan Technological UniversityDavid R. Shonnard
4. Product Preparation / CrystallizationContinuous Crystallization, Advantages
Advantages:
1. Input of solute helps to maintain a constant degree of saturation, ∆C
2. Desirable for determining growth rates and other kinetic parameters, but are not popular in industrial applications.