David Norris, Director of Opportunity Mapping Kip Holley, Research Associate Opportunity and the...
34
David Norris, Director of Opportunity Mapping Kip Holley, Research Associate Opportunity and the Detroit Metropolitan Region Mapping Trends and Existing Conditions in Detroit and the Surrounding Region to Catalyze Opportunity Initiatives
-
Upload
thomas-eaton -
Category
Documents
-
view
216 -
download
1
Transcript of David Norris, Director of Opportunity Mapping Kip Holley, Research Associate Opportunity and the...

David Norris, Director of Opportunity MappingKip Holley, Research Associate
Opportunity and the Detroit Metropolitan Region
Mapping Trends and Existing Conditions in Detroit and the Surrounding Region to
Catalyze Opportunity Initiatives
• Maps and Indexes– Opportunity across the Region– Opportunity within Detroit– Assets and Opportunity within Detroit– Regional Trends
• Analysis– Race and Opportunity– Demographics of Change– Dynamics of Change– Diversity, Opportunity, and Achievement
Overview
Maps and Indexes
4
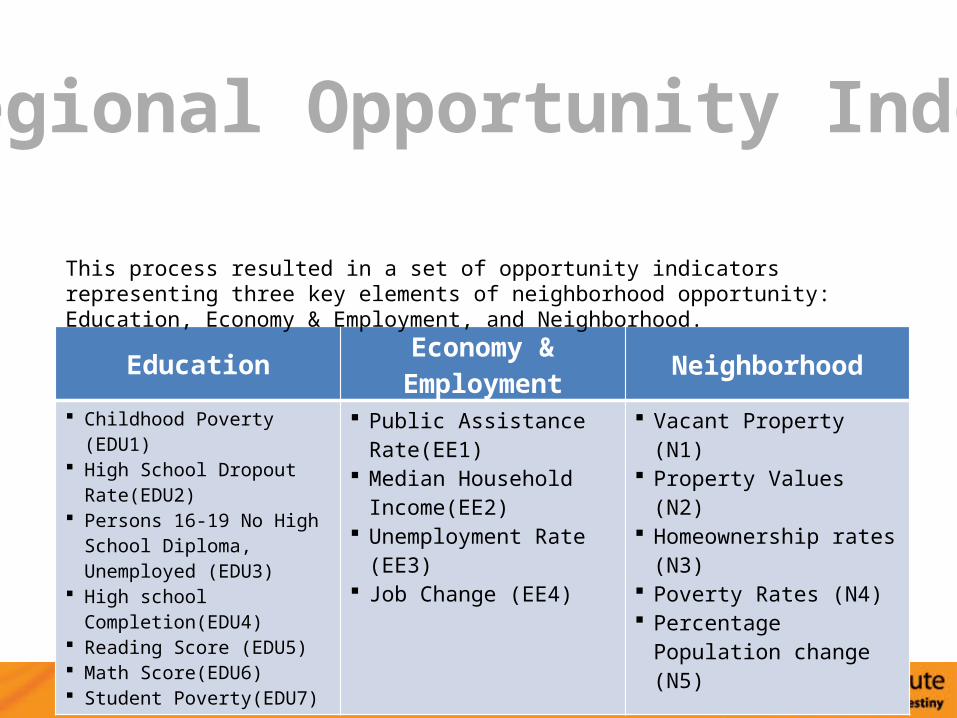
Education Economy & Employment Neighborhood Childhood Poverty (EDU1) High School Dropout
Rate(EDU2) Persons 16-19 No High School
Diploma, Unemployed (EDU3) High school Completion(EDU4) Reading Score (EDU5) Math Score(EDU6) Student Poverty(EDU7)
Public Assistance Rate(EE1) Median Household
Income(EE2) Unemployment Rate (EE3) Job Change (EE4)
Vacant Property (N1) Property Values (N2) Homeownership rates (N3) Poverty Rates (N4) Percentage Population
change (N5)
This process resulted in a set of opportunity indicators representing three key elements of neighborhood opportunity: Education, Economy & Employment, and Neighborhood.
Regional Opportunity Index
5
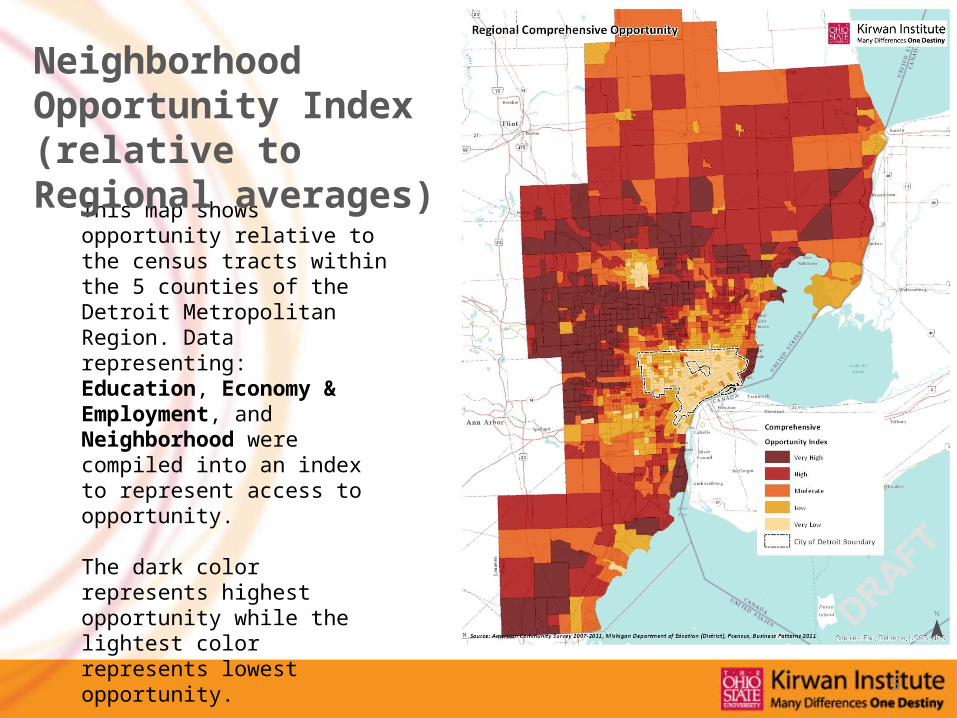
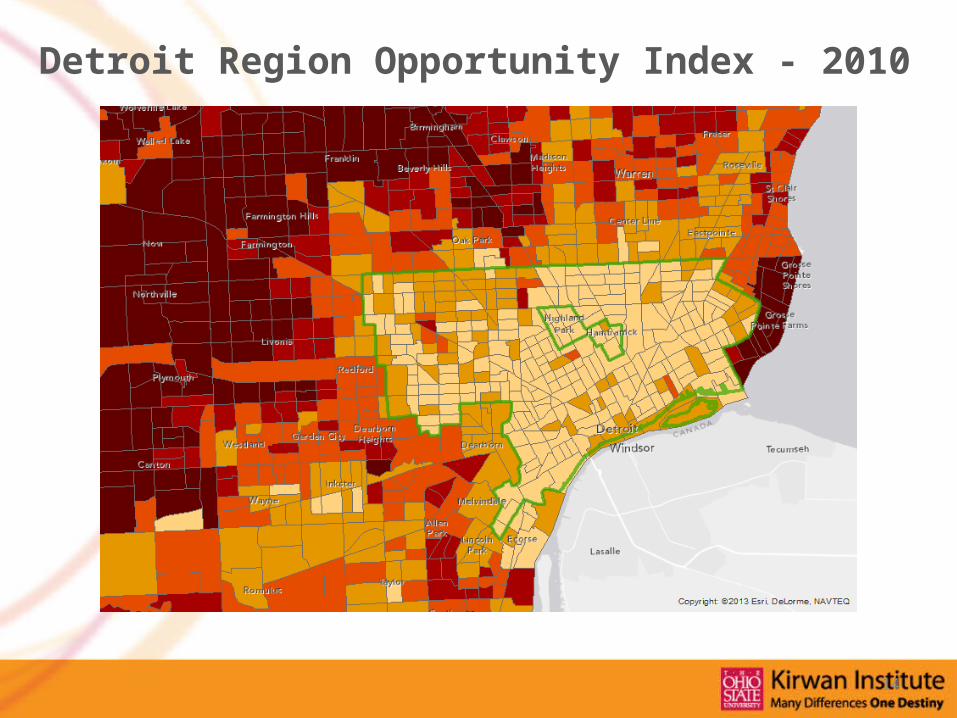
This map shows opportunity relative to the census tracts within the 5 counties of the Detroit Metropolitan Region. Data representing: Education, Economy & Employment, and Neighborhood were compiled into an index to represent access to opportunity.
The dark color represents highest opportunity while the lightest color represents lowest opportunity.
Neighborhood Opportunity Index (relative to Regional averages)

6
Neighborhood Opportunity Index (relative to City averages)
In response from advisory committee feedback, this map:
• Highlights the opportunity landscape in Detroit• Detroit is not monolithic
• Contains indicators that correspond with crucial programs• Where are investments working?• Where does new investment need to occur?
Detroit: Assets and Opportunities

Workforce Development & Job Creation Early Child Development City systems
& Opportunity Employment Status Adult Education Attainment Industry by Occupation:
Number of jobs in fastest growing sectors of the region [90 percentile of job growth over past 5 years]
Employment Sector Small Business Ownership
Reading Score Math Score Infant Mortality Proximity to Community
Centers Proximity to Parks Juvenile Crime Rate Free-reduced Lunch
Public Transit Proximity Means of Transportation to
work Automobile Access Mean Commute Time
This process resulted in a set of opportunity indicators representing three key elements of neighborhood opportunity: Workforce Development & Job creation, Early Child Development, and City systems & Opportunity
Detroit Assets & Opportunity Index
9
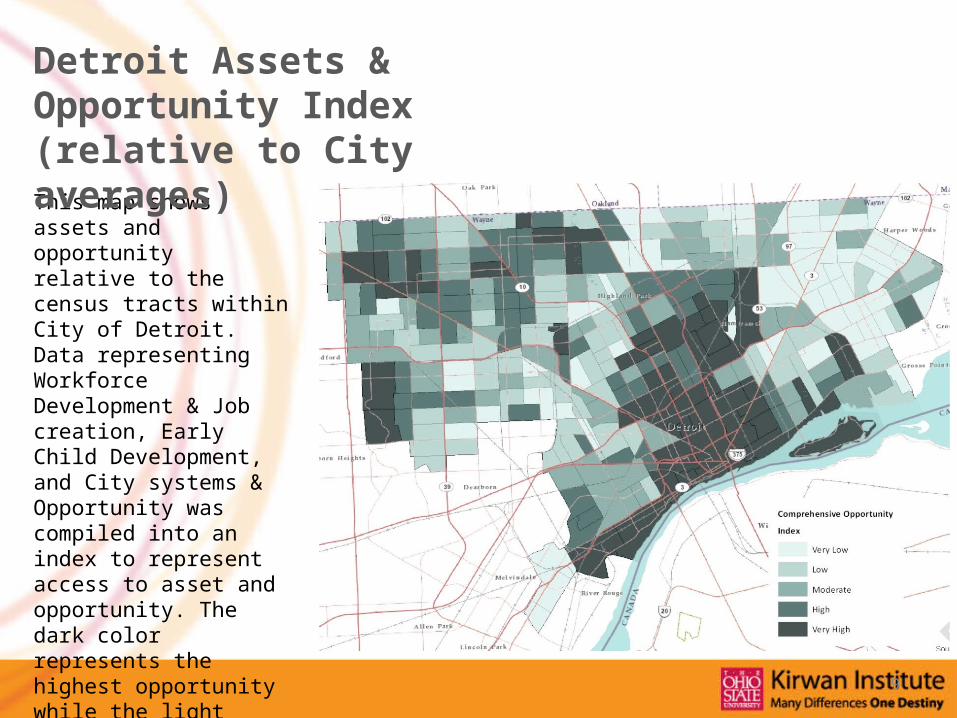
This map shows assets and opportunity relative to the census tracts within City of Detroit. Data representing Workforce Development & Job creation, Early Child Development, and City systems & Opportunity was compiled into an index to represent access to asset and opportunity. The dark color represents the highest opportunity while the light color represents the lowest opportunity.
Detroit Assets & Opportunity Index (relative to City averages)

Education Economy & Employment Neighborhood Childhood Poverty High School Dropout Rate Persons 16-19 No High
School Diploma, Unemployed
High school Completion Reading Score Math Score Student Poverty
Public Assistance Rate Median Household Income Unemployment Rate Job Change
Vacant Property Property Values Homeownership rates Poverty Rates Percentage Population
change
This process resulted in a set of opportunity indicators representing how three key elements of neighborhood opportunity have been changed: Education, Economy & Employment, and Neighborhood.
Regional Trends Index
11
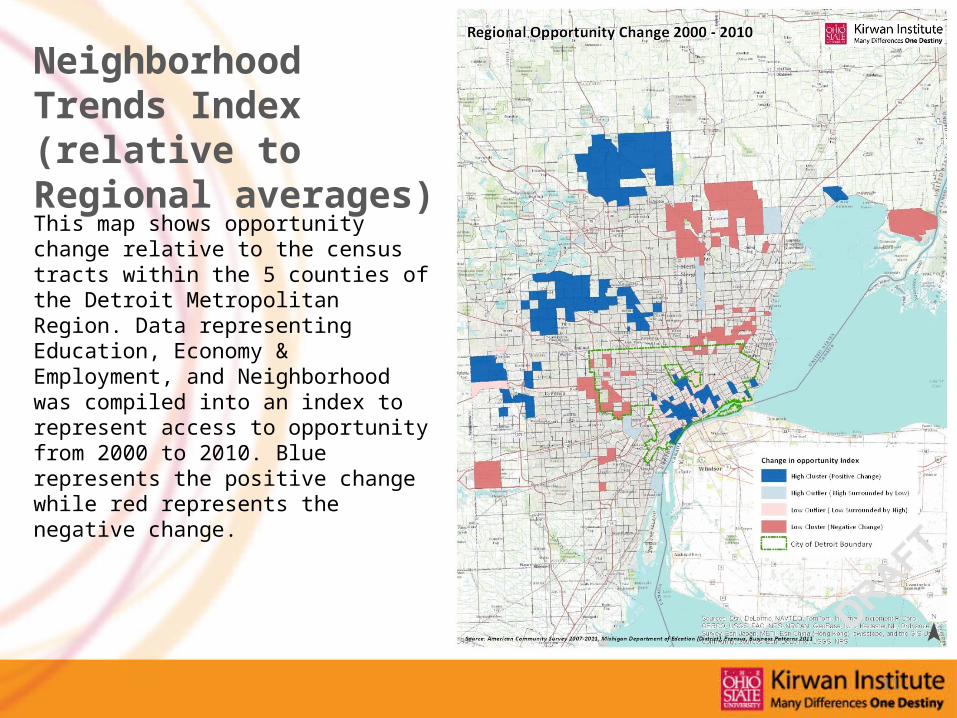
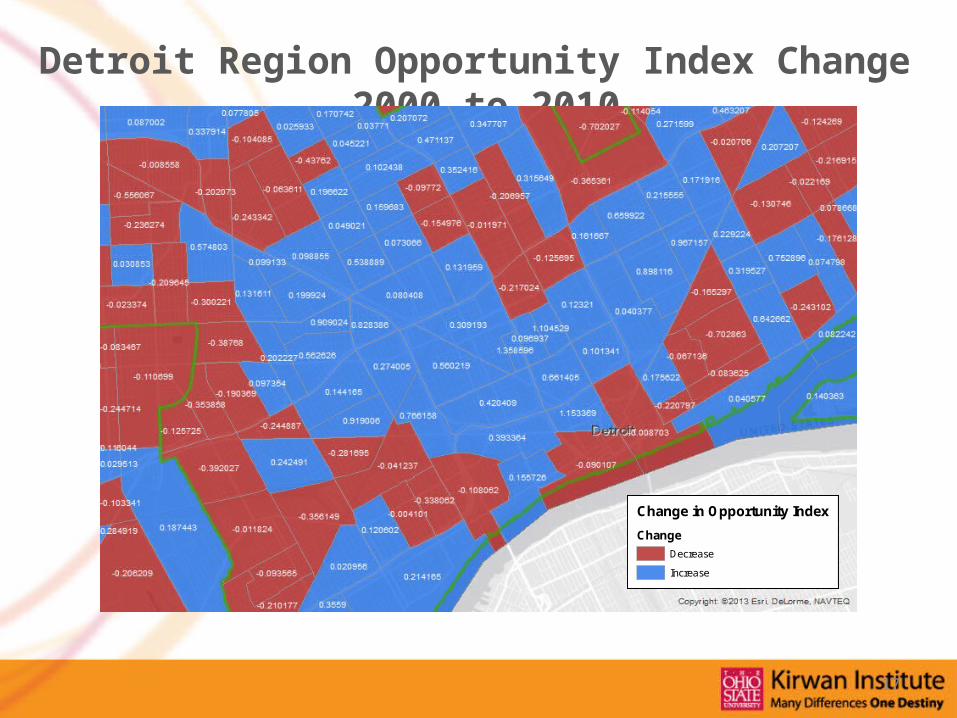
This map shows opportunity change relative to the census tracts within the 5 counties of the Detroit Metropolitan Region. Data representing Education, Economy & Employment, and Neighborhood was compiled into an index to represent access to opportunity from 2000 to 2010. Blue represents the positive change while red represents the negative change.
Neighborhood Trends Index (relative to Regional averages)
12
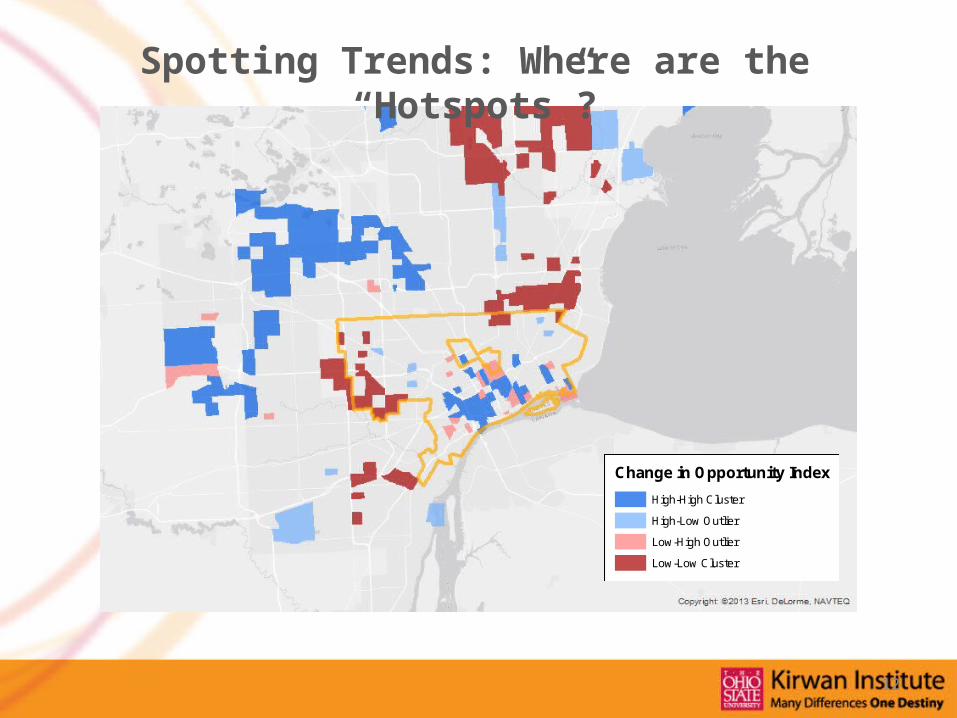
Change in Opportunity Index
High-High Cluster
High-Low Outlier
Low-High Outlier
Low-Low Cluster
Spotting Trends: Where are the “Hotspots”?

13
Detroit Region Opportunity Index - 2000
14
Detroit Region Opportunity Index - 2010

15
Detroit Region Opportunity Index Scores- 2000
16
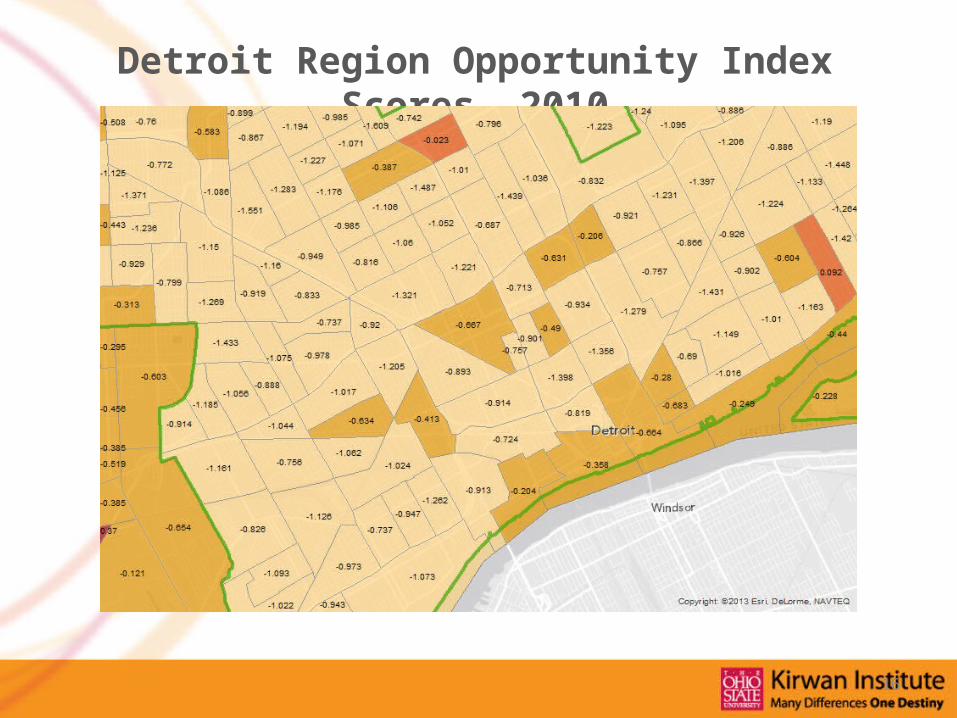
Detroit Region Opportunity Index Scores- 2010
17
Detroit Region Opportunity Index Change – 2000 to 2010
Change in Opportunity Index
Change
Decrease
Increase
18
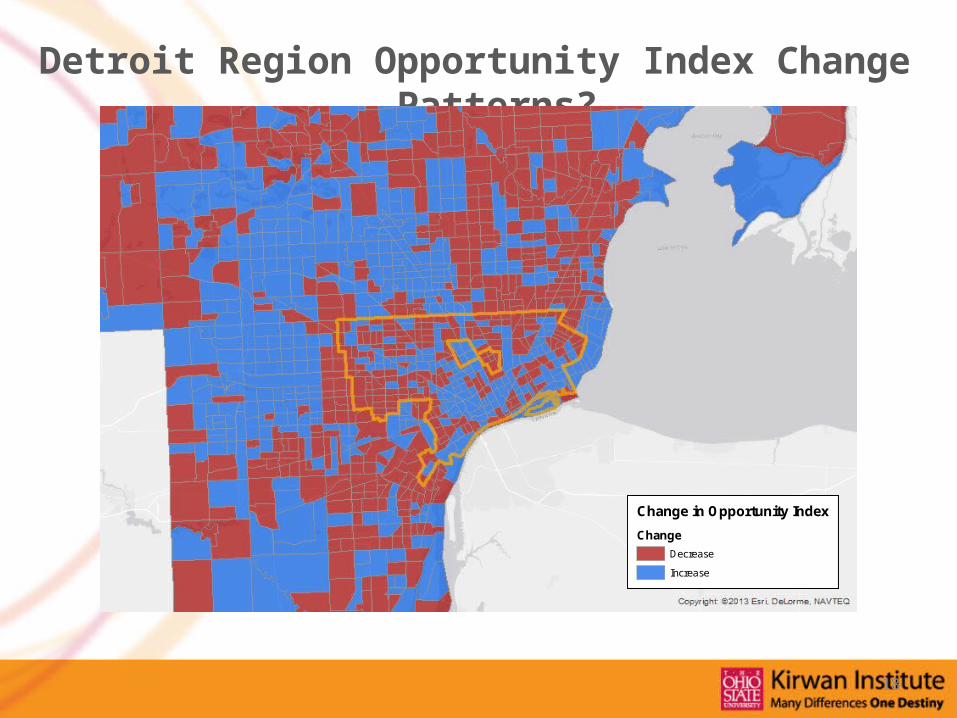
Detroit Region Opportunity Index Change – Patterns?
Change in Opportunity Index
Change
Decrease
Increase

19
Detroit Region Opportunity Index Change – Clusters
Change in Opportunity Index
High-High Cluster
High-Low Outlier
Low-High Outlier
Low-Low Cluster

20
Change in Opportunity Index
High-High Cluster
High-Low Outlier
Low-High Outlier
Low-Low Cluster
Statistically Significant Change, 2000 to 2010

21
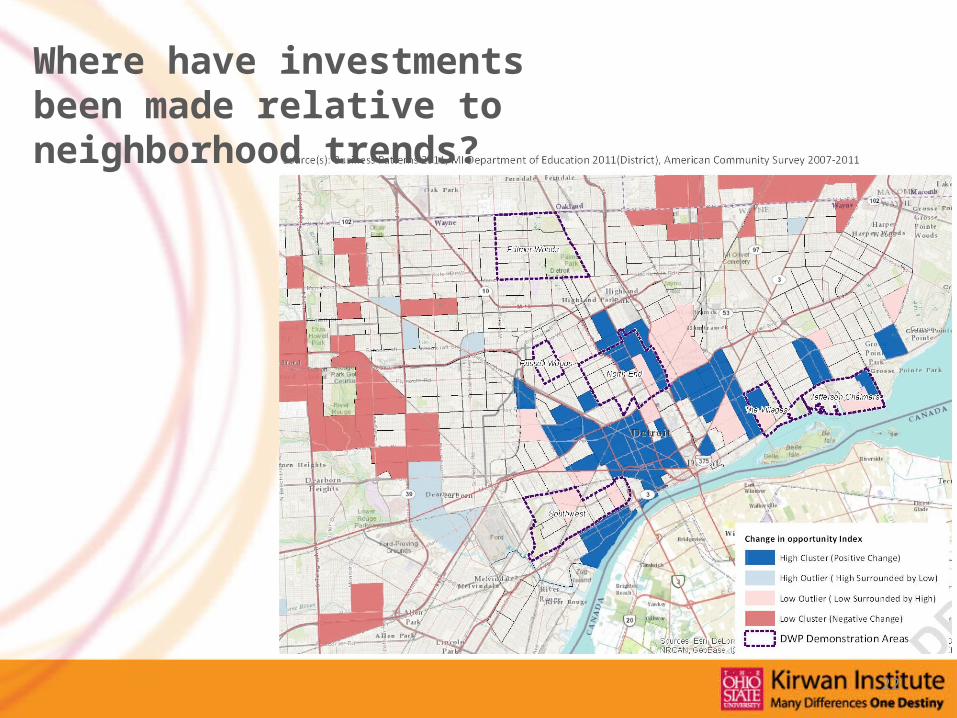
This map shows opportunity change relative to the census tracts within the 5 counties of the Detroit Metropolitan Region. Data representing Education, Economy & Employment, and Neighborhood was compiled into an index to represent access to opportunity from 2000 to 2010. Blue represents the positive change while red represents the negative change.
Neighborhood Trends Index (relative to Regional averages)
22
Where have investments been made relative to neighborhood trends?

Analysis

24
0%
10%
20%
30%
40%
50%
60%
70%
80%
90%
100%Race by Opportunity Index
Low Moderate High
Black or African Amer-
ican53%
White36%
Hispanic or
Latino6%
Asian2%
All Others3%
Low
Black or African American
5%
White85%
Hispanic or Latino
3%
Asian5%
All Others2%
High
What about Race relative to Opportunity?

25
0%
10%
20%
30%
40%
50%
60%
70%
80%
90%
100%
Low Cluster (Negative Change) Low Outlier ( Low Surrounded by High)High Outlier ( High Surrounded by Low) High Cluster (Positive Change)
Asian5%
Black or African American
20% His-panic
or Latino
3%White70%
Total Other2%
High Cluster (Positive Change)
Asian3%
Black or African American
29%
Hispanic or
Latino3%
White64%
Total Other2%
Low Cluster (Negative Change)
Who lives in areas that are improving or declining?

26
Education Economy & Employment Neighborhood Comprehensive
High Cluster (Positive Change) 0.487 0.555 0.294 0.445
High Outlier ( High Surrounded by Low) 0.302 0.585 1.001 0.630
Low Outlier ( Low Surrounded by High) -0.461 -0.406 -0.235 -0.368
Low Cluster (Negative Change) -0.376 -0.447 -0.399 -0.407
Education Economy & Employment Neighborhood Comprehensive
-0.600
-0.400
-0.200
0.000
0.200
0.400
0.600
0.800
1.000
1.200
High Cluster (Positive Change) High Outlier ( High Surrounded by Low) Low Outlier ( Low Surrounded by High) Low Cluster (Negative Change)
What’s changing in improving or declining areas?

27
EDU1 EDU2 EDU3 EDU4 EDU5 EDU6 EDU7 Education
High Cluster (Positive Change) -0.164 -0.324 -0.478 0.578 0.215 0.359 -0.303 0.346
High Outlier ( High Surrounded by Low) -0.380 0.091 -0.369 -0.204 -0.300 -0.266 0.425 -0.077
Low Outlier ( Low Surrounded by High) 1.561 1.273 0.629 -0.834 -1.010 -0.775 1.024 -1.015
Low Cluster (Negative Change) 0.451 0.416 0.425 -0.384 -0.417 -0.448 0.372 -0.416
What's changing in improving and declining areas? Education
EDU1 EDU2 EDU3 EDU4 EDU5 EDU6 EDU7 Education
-1.500
-1.000
-0.500
0.000
0.500
1.000
1.500
2.000
High Cluster (Positive Change) High Outlier ( High Surrounded by Low) Low Outlier ( Low Surrounded by High)Low Cluster (Negative Change)
Education
Childhood Poverty (EDU1) High School Dropout Rate(EDU2) Persons 16-19 No High School Diploma,
Unemployed (EDU3) High school Completion(EDU4) Reading Score (EDU5) Math Score(EDU6) Student Poverty(EDU7)
28
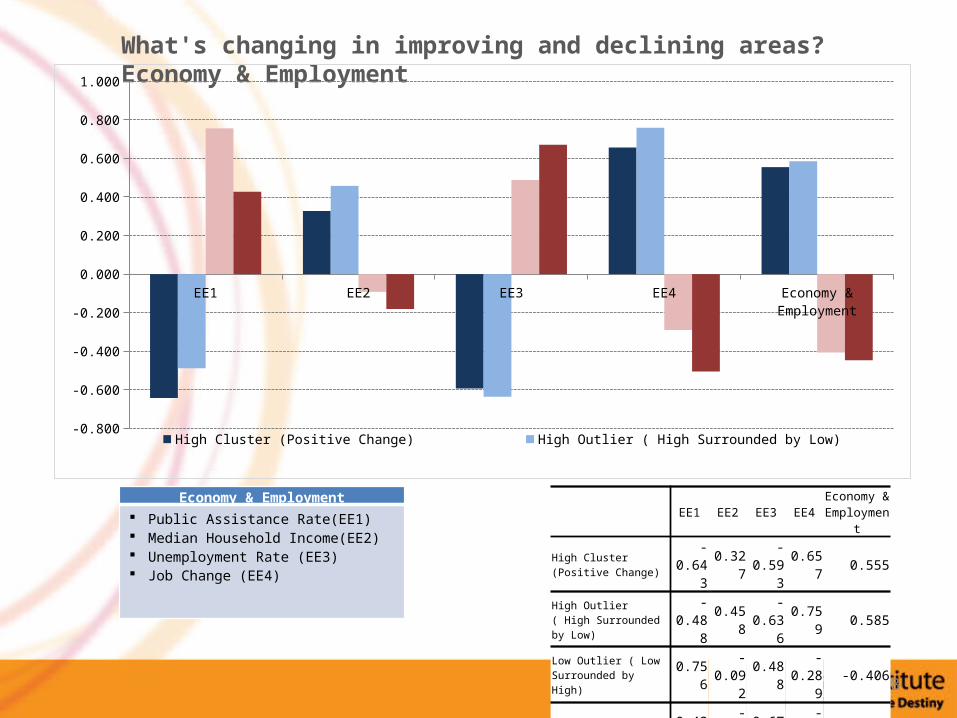
EE1 EE2 EE3 EE4 Economy & Employment
High Cluster (Positive Change) -0.643 0.327 -0.593 0.657 0.555
High Outlier ( High Surrounded by Low) -0.488 0.458 -0.636 0.759 0.585
Low Outlier ( Low Surrounded by High) 0.756 -0.092 0.488 -0.289 -0.406
Low Cluster (Negative Change) 0.428 -0.183 0.671 -0.505 -0.447
What's changing in improving and declining areas? Economy & Employment
EE1 EE2 EE3 EE4 Economy & Employment
-0.800
-0.600
-0.400
-0.200
0.000
0.200
0.400
0.600
0.800
1.000
High Cluster (Positive Change) High Outlier ( High Surrounded by Low) Low Outlier ( Low Surrounded by High) Low Cluster (Negative Change)
Economy & Employment Public Assistance Rate(EE1) Median Household Income(EE2) Unemployment Rate (EE3) Job Change (EE4)
29
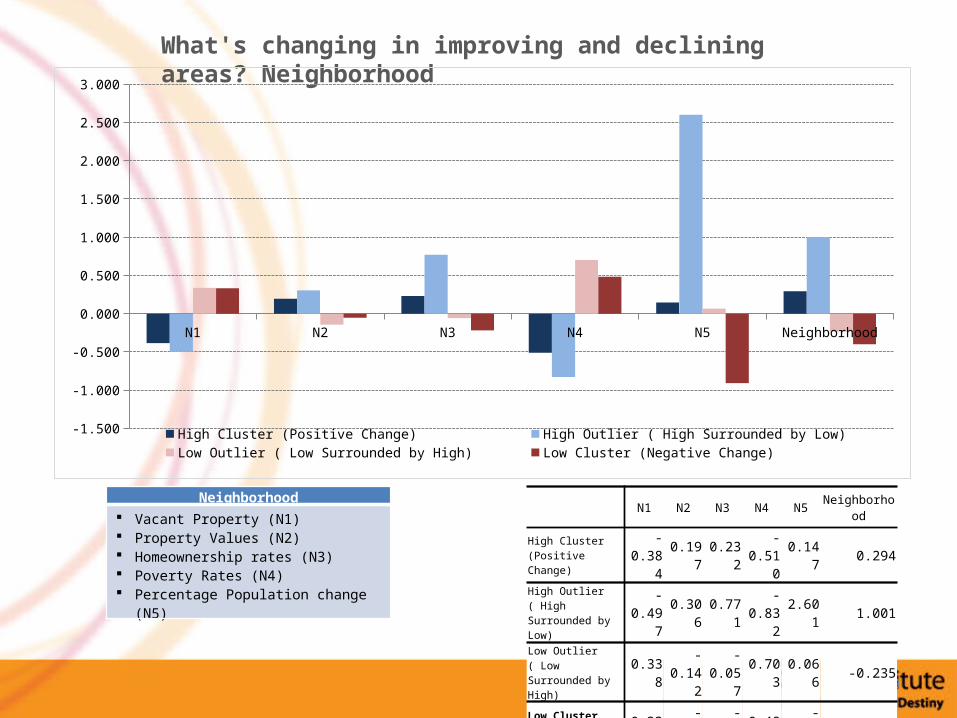
N1 N2 N3 N4 N5 Neighborhood
High Cluster (Positive Change) -0.384 0.197 0.232 -0.510 0.147 0.294
High Outlier ( High Surrounded by Low) -0.497 0.306 0.771 -0.832 2.601 1.001
Low Outlier ( Low Surrounded by High) 0.338 -0.142 -0.057 0.703 0.066 -0.235
Low Cluster (Negative Change) 0.333 -0.053 -0.217 0.484 -0.908 -0.399
What's changing in improving and declining areas? Neighborhood
Neighborhood Vacant Property (N1) Property Values (N2) Homeownership rates (N3) Poverty Rates (N4) Percentage Population change (N5)
N1 N2 N3 N4 N5 Neighborhood
-1.500
-1.000
-0.500
0.000
0.500
1.000
1.500
2.000
2.500
3.000
High Cluster (Positive Change) High Outlier ( High Surrounded by Low) Low Outlier ( Low Surrounded by High) Low Cluster (Negative Change)
30
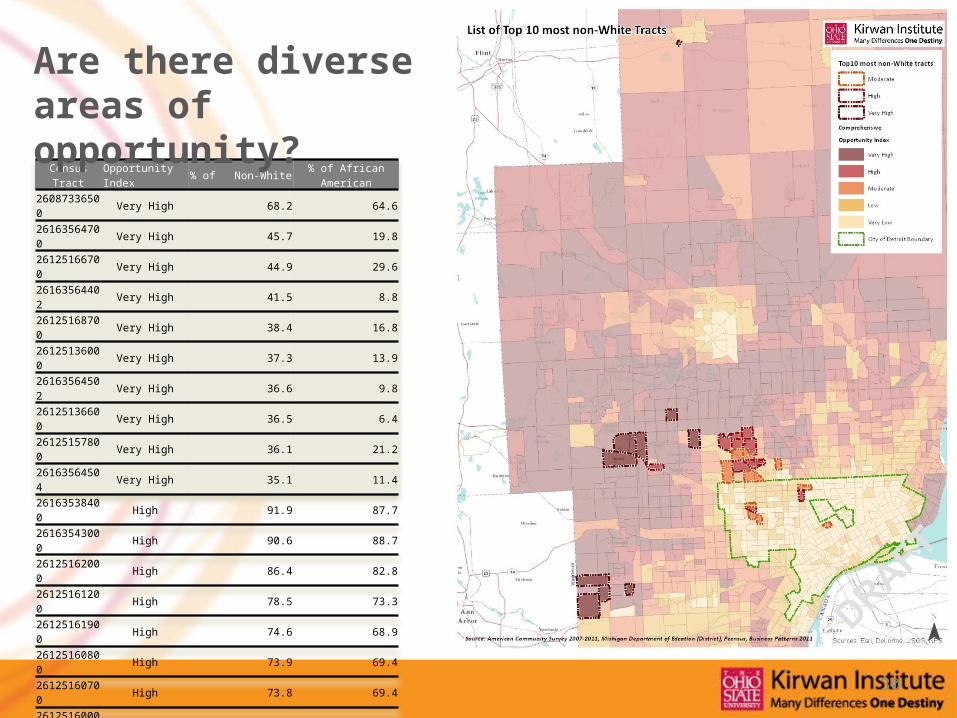
Census Tract Opportunity Index % of Non-White % of African American
26087336500 Very High 68.2 64.626163564700 Very High 45.7 19.826125166700 Very High 44.9 29.626163564402 Very High 41.5 8.826125168700 Very High 38.4 16.826125136000 Very High 37.3 13.926163564502 Very High 36.6 9.826125136600 Very High 36.5 6.426125157800 Very High 36.1 21.226163564504 Very High 35.1 11.426163538400 High 91.9 87.726163543000 High 90.6 88.726125162000 High 86.4 82.826125161200 High 78.5 73.326125161900 High 74.6 68.926125160800 High 73.9 69.426125160700 High 73.8 69.426125160000 High 66.3 60.926125160600 High 58.8 50.926125165200 High 57.3 17.726163542500 Moderate 96.7 93.526163542900 Moderate 93.8 90.526163543100 Moderate 92.6 89.126125162300 Moderate 91.8 88.126163532300 Moderate 88.4 83.426163538200 Moderate 88.0 83.426125161800 Moderate 85.5 81.426125171300 Moderate 81.8 77.426125161500 Moderate 81.8 77.326125161600 Moderate 81.0 73.0
Are there diverse areas of opportunity?
31
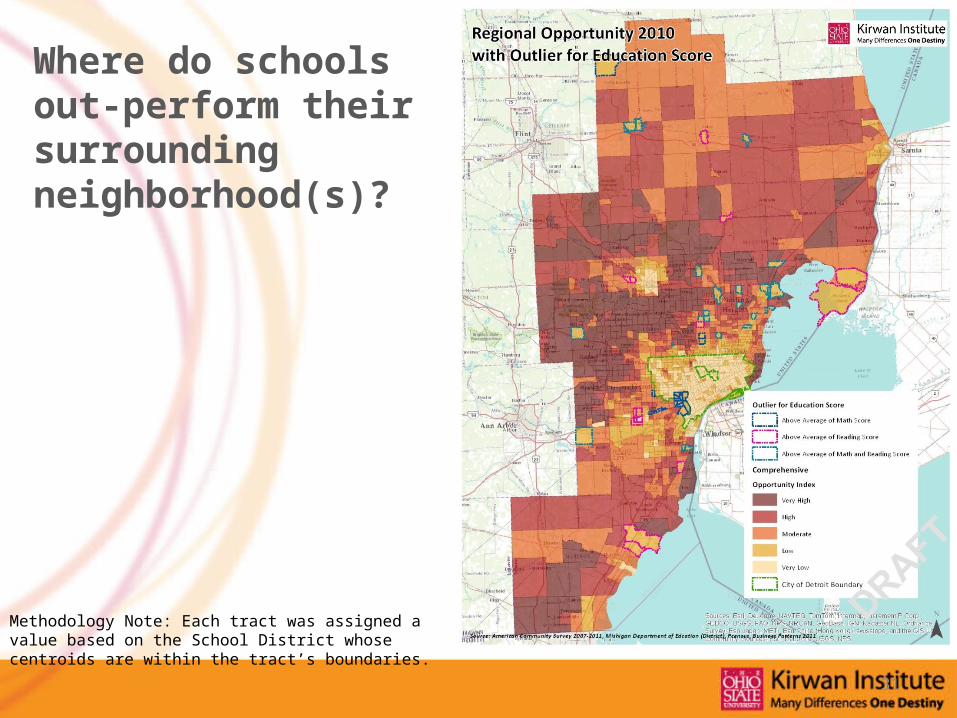
Where do schools out-perform their surrounding neighborhood(s)?
Methodology Note: Each tract was assigned a value based on the School District whose centroids are within the tract’s boundaries.
Yet to do:• More detailed “deep dive” into the data for
individual hot spot areas• Food access in the Detroit area: food deserts,
food swamps

Key Lessons

Key Lessons• Detroit is not “monolithic” in terms of
opportunity• Shared fates writ large: Disinvestment is not
just a “Detroit problem”• Shared fates writ small: Evidence in trend data
of neighborhood effects, linked to investment